abstractbura.brunel.ac.uk/bitstream/2438/15556/1/fulltext.docx · web viewour throwaway society is...
TRANSCRIPT

Pyrolysis of domestic based feedstock at temperatures up to 300°C
Hussam Jouhara a, Darem Ahmad a, Inge van den Boogaert a, Evina Katsoua, Stefaan Simonsa, Nik Spencer b
aCollege of Engineering, Design and Physical Sciences, Brunel University London, Uxbridge, Middlesex UB8 3PH, UK
b Manik Ventures Ltd & Mission Resources Limited, Offenham Road, Worcestershire Evesham WR11 8DX, UK
ABSTRACTThis article reports the state of the art of the characteristics of products derived from the pyrolysis of municipal solid waste. The by-products which arise at more elevated temperatures are discussed so that the outcomes of low temperature pyrolysis may be put into context. Our throwaway society is a globally growing issue, the continued discarding of valuable resources into landfill sites is highly undesirable due to many of these materials being non-biodegradable and some may produce toxic gases which are harmful to the environment if discarded in an uncontrolled way. Domestic and industrial sorting and transport of discarded resources result in an increase in carbon footprint as well as a high cost. Therefore, an alternative resource management method is required in order to achieve a more sustainable and less harmful method of managing these valuable resources in the future.Below 300°C, the products of pyrolysis are generally expected largely to contain biochar, bio-oil and syngas. However, the phase distribution and chemical composition of the products is highly dependent on the feedstock used as well as the operating parameters of the process. Plant based feedstock produces more biochar while plastic based feedstock produces more bio-oil. The composition of products can be analysed using gas chromatography/mass spectrometry. Current applications of pyrolysis are focused on high temperatures due to the increased yields of gases and bio-oils, which are more valuable. Biochar, however, is becoming increasingly popular due to its various applications such as a filter material for water purification. Low temperature pyrolysis is an area where further research is required in order to produce economically viable processes.
Keywords: Low temperature pyrolysis, Energy recovery, Emissions. Content
s1. Introduction............................................................................................................................22. Principles of pyrolysis............................................................................................................43. Types of pyrolysis processes..................................................................................................5
3.1 Pyrolysis processes...........................................................................................................53.2 Reactor configurations.....................................................................................................53.2.1 Fixed bed reactors and batch reactors...........................................................................63.2.2 Fluidized bed reactors...................................................................................................73.2.3 Rotary kiln reactor.........................................................................................................8

4. Kinetics of Pyrolysis..............................................................................................................95. Characterisation of pyrolytic products at temperatures below 300°C.................................10
5.1 Discarded Food..............................................................................................................105.1.1 Proximate and ultimate analysis..............................................................................105.1.2 Syngas.....................................................................................................................115.1.3 Bio-oil.....................................................................................................................125.1.4 Biochar....................................................................................................................14
5.2 Plastics............................................................................................................................175.2.1 Proximate and ultimate analysis..............................................................................175.2.2 Syngas.....................................................................................................................185.2.3 Bio-oil.....................................................................................................................195.2.4 Biochar....................................................................................................................21
5.3 Sewage sludge................................................................................................................255.2.1 Proximate and ultimate analysis..............................................................................265.3.1 Syngas.....................................................................................................................275.3.2 Bio-oil.....................................................................................................................295.3.3 Biochar....................................................................................................................30
5.4 Wood and garden material.............................................................................................345.2.1 Proximate and ultimate analysis..............................................................................355.4.1 Syngas.....................................................................................................................365.4.2 Bio-oil.....................................................................................................................385.4.3 Biochar....................................................................................................................39
6. Pollutant emissions...........................................................................................................427. Current uses of pyrolytic products and operating conditions...........................................468. Economic Benefit of pyrolysis ........................................................................................489. Conclusion and future outlook.........................................................................................49 References........................................................................................................................49
Nomenclature Q Heat requirement for pyrolysis (kJ/kg)MSW Municipal solid waste W Moisture content feedstock (%)ATT Advanced thermal treatment Cp Specific heat capacity (J/(kg ˚C))DSC Differential scanning calorimetry m Mass ratios of the biocharDTA Differential thermal analysis α Heat transfer coefficient (W/(m2∙ K) )
HR Heating rate (˚C/s) A Pre-exponential factorHTT Highest treatment temperature (˚C) E Apparent activation energy (kJ/mol)BET Brunauer-Emmet-Teller R Gas constant (8.314 J/(mol K))PP Poly-propylenePET Polyethylene terephthalate SubscriptsLDPE Low-density polyethylene 1 Heat supplied for moisture evaporation HDPE High-density polyethylene 2 Pyrolysis caloric requirementPVC Polyvinyl chloride 3 Heat loss of the reactor
ch Biocharm Mass (kg) M Dry materialsT Temperature (˚C) v Volatile matter
2

1. Introduction The finite amount of fossil fuels available is depleting at a fast rate with an urgent need to develop an alternative method to extract valuable chemical compounds that is sustainable [1-2]. The Global discarding of resources is increasing at an alarming rate. Current technology is available to treat a variety of these resources. However, the majority of the discarded material conversion methods are economically unviable on large scale and have many complications [3]. MSW stands for municipal solid waste, which are resources such as paper, plastic, garden material, textiles, food and many other materials. These resources become MSW at the point that the person with responsibility for these products makes the decision to discard them thus changing its definition under waste regulations to MSW. Over 22.3 million tonnes of these material were discarded therefore generating the same amount of MSW in England in 2014, each person producing over 420 kg of material annually and only 44.8% of it being recycled [4]. Discarded material composition is shown in Table 1.
Table 1Discarded material composition in 2011 in England [5].
Category Value (wt.%)Organic material (e.g. food, garden) 35.8Furniture related equipment 14.9Paper 14.0Glass 6.8Dense plastic 6.6Card packaging 5.2Plastic films 3.8Wood 3.8Metals 3.7Textiles 2.9
Recycling is a solution that reduces resources going to landfill sites whilst reusing the recycled materials to make other products. Some technical issues do arise with recycling, as many materials can only be reused a limited number of times before they can no longer be chemically active to produce products with certain chemical properties [6]. Recycling does leave a carbon footprint due to sorting and transportation processes and taking into account that this process comes with the necessary expenses [7-8]. This makes recycling a solution which is highly attractive from a short-term viewpoint as it reduces the volumes going into landfill sites and it also has a capability to make other useful products. Resource management processes, such as pyrolysis and gasification are known as advanced thermal treatment (ATT) methods which provide a solution for resource treatment and can also meet emissions regulations [9]. Other conversion methods, such as combustion, incineration and anaerobic digestion, offer an alternative way to make use of the energy content within the material. Production of toxic compounds such as nitrogen oxides and sulphur oxides are reduced when pyrolysis is used in comparison with incineration [10]. Not
3

only are greenhouse emissions from pyrolysis reduced relative to incineration but the solid residues are of higher quality [11]. Incineration, pyrolysis and gasification are the main ATT technologies. In “waste-to-energy” recovery mechanisms (treating MSW), a combination of the technologies mentioned above can be used together to provide a thermo-chemical process. Combination of the technologies mentioned can result in conversion processes that are more efficient [12]. Combustion is a heat generating process but its efficiency is only around 10% and it produces a large amount of greenhouse gases [13-14]. Pyrolysis offers a method whereby it produces energy from waste feedstock in the form of three phases: solid biochar, liquid bio-oil and syngas [15-18]. Biochar is a fine-grained residue which has a high carbon content. It is formed by the thermal decomposition of biomass in the absence of oxygen [19]. The chemical composition of biochar varies because of its heterogeneous nature, containing both stable and unstable components [19]. Bio-oil consists mainly of cyclic-compounds with some straight chain fractions. In comparison to petroleum oil, where a blend of oil compounds are obtained, bio-oil may require less reforming so that it is ready for usage by pharmaceutical or textile companies [20].Gases/vapours derived from pyrolysis contain carbon monoxide, water vapour and some low molecular weight alkane and alkenes [21]. The contribution of each molecule to the gaseous fraction varies depending on many factors but most significantly on temperature [21]. In comparison with incineration, pyrolytic products contain low amounts of nitrogen oxides and sulphur oxides due to the inert medium the process is being operated in. The solid biochar is also of better quality [11].
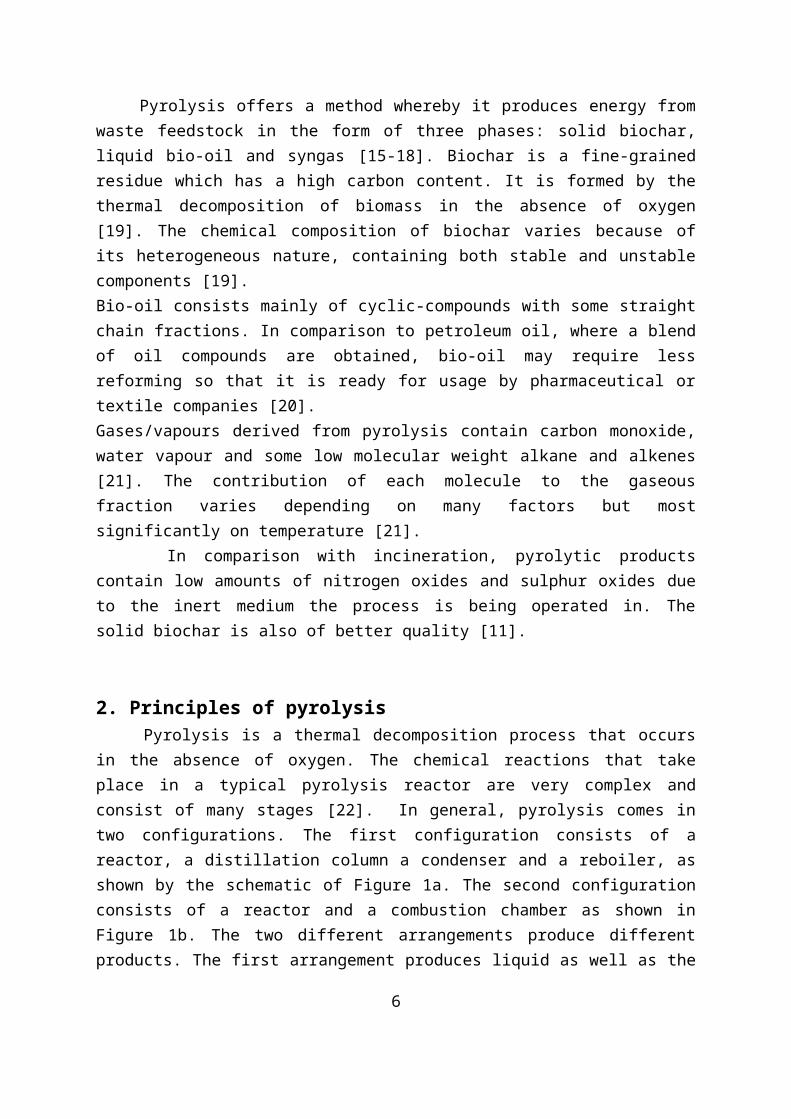
2. Principles of pyrolysis Pyrolysis is a thermal decomposition process that occurs in the absence of oxygen. The chemical reactions that take place in a typical pyrolysis reactor are very complex and consist of many stages [22]. In general, pyrolysis comes in two configurations. The first configuration consists of a reactor, a distillation column a condenser and a reboiler, as shown by the schematic of Figure 1a. The second configuration consists of a reactor and a combustion chamber as shown in Figure 1b. The two different arrangements produce different products. The first arrangement produces liquid as well as the solid char and gas. The second arrangement produces no liquid bio-oil because there is no condenser and all of the feed is thermally decomposed to gases which are then used in the combustion chamber to provide heat [22].
4

Figure 1. Flow diagrams for simplified pyrolysis units. (a) Simplified biochar and bio-oil flow diagram. (b) Biochar and gas flow diagram [23]. The majority of pyrolysis processes are conducted at high temperatures of 300 to 1000°C but operating temperatures can reach 3000°C when pyrolyzing polymers [21-30]. The higher the operating temperature, the more thermal decomposition is able to take place, thus producing a wider range of products but more significantly lower molecular weight molecules that are of high value [10]. The products made using pyrolysis are the result of the type of biomass feedstock used in the reactor. For example, pyrolysis of biomass will produce a different product composition than that from plastic [33]. The rate of heating during pyrolysis significantly alters the products. Slow pyrolysis, which is a slow heating process, allows secondary reactions to take place due to the increased residence time of the feed in the reactor [34].
3. Types of pyrolysis processes3.1 Pyrolysis processes Pyrolysis processes are split into the three main categories shown in Table 2 below. These processes have different reaction temperatures, heating rates, feedstock sizes and residence times.
Table 2A summary of the different types of pyrolysis processes and their operating parameters. Process Reaction
temp (°C)
Heating rate (°C/min)
Residence time
Feedstock size
Bio-oil yield(%)
Biochar yield (%)
Gas yield (%)
Ref.
Slow pyrolysis
300-550 50 5-30min;25-35 h
Whole 20-50 25-35 20-50
[35-38]
IntermediatePyrolysis
300-450 200 10 min Coarse/finely ground
35-50 25-40 20-30
[35-38]
Fast/flash 300-1000 10-1000 2s Finely 60-75 10-25 10- [35-
5
pyrolysis ground 30 38] The operating conditions have a strong impact on the products formed. From table 2, it is clear that fast pyrolysis uses finely ground feedstock which produces a high bio-oil yield. In contrast, slow pyrolysis uses whole feedstock sizes but produces a much lower bio-oil content. These operating parameters can be manipulated to generate a desired product range depending on the feedstock.
3.2 Reactor configurations Reactor configurations can be altered to match a particular feedstock and a desired outcome. Such reactors include fixed bed reactors, batch reactors, semi-reactors, rotary kilns, fluidized bed reactors and microwave assisted reactors. The reactors have the same basic principle and that is to thermally decompose the feed material but their differences rely in the design and configuration to adjust to a specific feed material [34]. However, although there are many types of reactor designs, it remains a challenge to utilise such processes in an economically viable way. The high temperatures currently used in pyrolysis processes result in a high operating cost thus reducing the economics of such processes [34]. The type of reactor used in a pyrolysis process plays an important role due to the significant amount of heat that must be transferred across the reactor to enable material decomposition [34].
3.2.1 Fixed bed reactors and batch reactors A fixed bed reactor, shown in Table 3, heats feedstock externally using an electric furnace. The reactor is kept in anaerobic conditions by flushing it with an inert gas such as nitrogen, which is maintained throughout the process [33]. A discharge of gases and vapours occurs during the process, while biochar is removed after its completion. A batch reactor is similar to a fixed bed reactor but with no mass transfer occurring to the outside of the reactor [33]. Both of these reactor types are easy to manufacture and operate. However, residence time is long and the char obtained is difficult to remove [33].
6
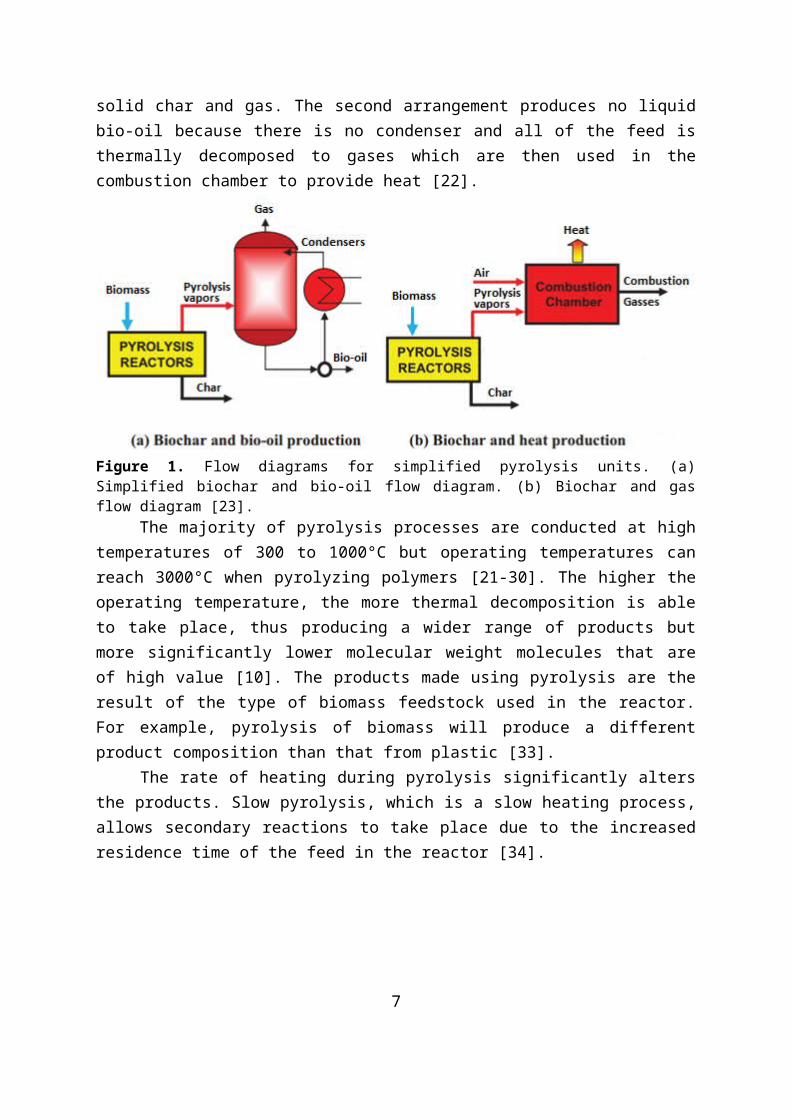
Table 3Pyrolysis reactor designs of a fixed bed reactor from literature. Pyrolysis reactor designs Reference
Fixed-bed reactor and pyrolysis system (1-N2 bottle; 2-reactor; 3-heat exchanger; 4-separation unit, 5-water trap; 6-gas flow meter; 7-rotameter)
Ates et al. (2013) [26]
Fixed bed pyrolysis system (1-furnace; 2-pyrolysis reactor; 3-thermocouple; 4-temperature controller; 5-N2 pipe; 6-liquid gathering tank; 7-thermometer; 8-condenser; 9-pressure gauge; 10-sampling vent)
Wang et al. (2005) [36]
3.2.2 Fluidized bed reactors In-contrast to fixed bed reactors, fluidized bed reactors operate under fast heating rates and they allow a good blending of the feed material. However, the biggest disadvantage of a fluidized bed reactor is that the feedstock must be very small so that the particles can float. This adds complications to the process as a grinder must be installed. Biochar removal from the bed is problematic as most of the biochar phase will be dispersed within the fluid phase [37]. Schematics of fluidized bed reactors within pyrolysis systems are shown in Table 4.
7

This type of reactor is useful to analyse product composition and various blends of feedstock, however, scaling-up can be problematic [37].
Table 4Pyrolysis reactor designs of a fluidized bed reactor from literature.Pyrolysis reactor designs Reference
Williams et al. (1999a) [38]
Marculescu et al. (2007)[39]
3.2.3 Rotary kiln reactors The rotary kiln reactor is one of the types of pyrolysis reactors that has been successfully implemented on an industrial scale. It operates based on a slow heating rate with temperatures reaching 500°C and a residence time of 1 hour [37]. The only disadvantage of this reactor is that the feedstock requires pre-treatment but it is not complex [37]. Table 5
8

shows a rotary kiln reactor design which has a more complex configuration than fluidized bed and fixed bed systems.
Table 5 Pyrolysis reactor design of a rotary kiln bed reactor used in literature.Pyrolysis reactor design Reference
Rotary kiln pyrolysis system (1-thermometer; 2-bearing; 3-gear transmission; 4-electrical furnace; 5-rotary kiln; 6-temperature controller; 7-seal; 8-two-steps condenser; 9-filter; 10-accumulative flowmeter; 11-computer; 12-gas sampling device; 13-feed and discharge opening; 14-speed adjustable electrical machinery)
Li et al. (1999a,b),[40–42]
In summary, the current reactors used in pyrolysis operate at high temperatures and many are economically unviable. The rotary kiln reactor is the only reactor that has been successfully implemented on an industrial scale but it also operates at high temperature [37].Many of the reactor designs require shredding of the feedstock to allow the reaction to take place efficiently and effectively. Shredding of the feedstock increases the surface area to volume ratio of the material allowing faster reactions to take place. Therefore, this property can be used to alter the desired output.
4. Kinetics of PyrolysisThe general reaction of pyrolysis is outlined as:
CxHyOz + Q => Char + Liquid + Gas +H2O (1)
Q is the total amount of heat that is required for the reaction to take place. This term involves heat supplied for moisture vaporisation, Q1 measured in kJ/kg, pyrolysis caloric requirement, Q2, and heat loss from the reactor to the surrounding atmosphere, Q3 [10].
Q1= W × 2260, (2)where W is the moisture content of the feedstock, %. Water content can be high in certain feedstocks such as food. The higher the water content is, the more heat, thus energy, is needed. Therefore, a drying stage could be adopted prior to pyrolysis [10].
Q2=C p , M∫mM dT+¿C p ,ch∫mch dT+Cp , v∫mv dT +Qp ¿ (3)
9
(5)
where C p ,ch , Cp , M ∧Cp , v are the specific heat capacities of the char, dry materials and volatile matter, respectively. mch ,mM∧mvare the mass ratios of the char, dry materials and volatile to the feedstock. Depending on the type of MSW, Q2 can be calculated using differential scanning calorimetry (DSC) or differential thermal analysis (DTA) [31]. Q3 can be ignored in heat transfer design. Adequate insulation must be in place to make sure heat loss is negligible. Heating rate (HR) can be described using the following equation:
HR=∆ T . αm. Cp
HR has units of °C s-1. ∆ T is the temperature difference between the feedstock and reactor wall, α is the heat transfer coefficient that is inside the reactor, m (kg) is the mass of the feedstock that is heated per m2. Heating rates reported in literature vary from 4 to 670 °C s -1 [36, 43-47]. Heating rate has a significant effect on the yield. Higher heating rate values are associated with high volatile matter. Volatile matter is referred to as being the gas and bio-oil phases. High heating rates along with long residence times also generate high gaseous yields [10]. The thermal degradation of organic matter based on agricultural residues, based on isothermal steps, has been described by the following equation [48-51]:
dcdt
=k (t ) . f (c )⟹ dxdT
. dTdt
=k (T ) . f (x )
where dcdt represents reaction rate; f ( x )∨f (c )represent the function of thermal degradation;
k (T ) is the reaction rate constant and represented by the Arrhenius formula k (T )=A e−ERT
where the terms A, E, R and T are the pre-exponential factor, apparent activation energy, gas constant and absolute temperature, respectively.
5. Characterisation of pyrolytic products at temperatures below 300°C5.1 Discarded Food The UK discarded approximately 7.3 million tons (Mt) of food in 2016. 4.4 Mt of these could have been prevented, as the food was still in the right conditions to be used or consumed. 3.5 Mt of this household food is discarded in sewers or landfill sites. The total amount of household food and the way it is being currently processed are shown in Figure 2. Pyrolysis might be a great alternative as it forms biochar, bio-oil and syngas which all contain high calorific values [52].
10
(4)
Figure 2. The total amount of household discarded food produced by the UK in 2016. The diagram shows the discarding methods and the amount of resource which could have been prevented [52].
5.1.1 Proximate and ultimate analysis As the products of pyrolysis are highly dependent on the feedstock used, proximate and ultimate analyses provide highly valuable information to analyse why certain products are formed. Proximate analysis focuses on the chemical composition of a material in terms of moisture content, fixed carbon, volatile matter and ash content. Ultimate analysis quantitatively analyses the elemental composition of a material in terms of carbon, hydrogen, nitrogen, sulphur and oxygen. In order to produce accurate results, proximate and ultimate analyses must comply with international standards such as ASTM, ISO, AS and D. Experimental studies on pyrolysis carry out proximate and ultimate analyses of the feedstock used. This enables possible correlations to be made with the products obtained. Proximate and ultimate analyses of discarded food are shown in Tables 6 and 7, respectively.
Table 6Proximate analysis of various food materials [33,53-54].Material Fixed carbon
(%)Moisture (%) Volatile
matter %)Ash (%) HHV
(MJ/kg)Walnut shell 15.90 11.00 71.80 1.30 -Almond tree pruning
16.00 10.60 72.20 1.20 -
Almond shell 9.10 10.00 80.30 0.60 -Olive stone 13.80 10.40 74.40 1.40 -Orange peel 13.07 9.20 74.79 2.94 16.83Cattle bone 2.33 4.07 28.90 64.70 -Hazelnut shell 7.40 11.80 77.00 3.80 18.3Waste cereal 19.10 5.50 73.50 1.90 17.42Waste peanuts crisps
14.10 4.60 79.10 2.20 22.13
Proximate analysis of various materials, shown in table 6, clearly show that volatile matter is the major component containing at least 72% by weight of discarded food. However, the only material that significantly differs is cattle bone. It consists predominantly of ash.
Table 7Ultimate analysis of various discarded foods [33, 53-57].Material Carbon (%) Hydrogen (%) Nitrogen (%) Oxygen (%) Sulphur
(%)Walnut shell 45.10 6.00 0.30 48.60 0Almond tree pruning
51.30 6.50 0.80 41.36 0.04
Almond shell 50.50 6.60 0.20 42.69 0.01Olive stone 44.80 6.00 0.10 49.09 0.01Orange peel 39.70 6.20 0.46 53.03 0.60Cattle bone 32.90 8.00 3.20 55.90 0Hazelnut shell 46.30 2.50 0.40 50.80 0
11

Waste cereal 43.00 5.89 2.16 41.4 0.12
Ultimate analyses of almost all feedstock materials used in Table 6 are shown in Table 7. The ultimate analysis shows an almost equal split of carbon and oxygen content with hydrogen content at less than 10% as well as some nitrogen and sulphur content in very low amounts.
5.1.2 SyngasIn-order to show the effect of feedstock on gas yield, Table 8 summarises the experimental results of pyrolyzing discarded food.
Table 8A summary of pyrolysis of various discarded food feedstock.
Biomass Reactor Temperature (°C)
Gas yield (%) Reference
Pistaccio shell Fixed bed 300 25 [55]Discarded cereals
Fixed bed 300-800 30 [33]
Discarded peanut crisps
Fixed bed 300-800 16 [33]
Discarded orange peel
Fixed bed 300 27.8 [56]
The quantities of syngas generated in the pyrolysis of discarded cereals and discarded peanut crisps have different trends with increasing temperature. For discarded peanut crisps the trend is almost constant, not greatly affected by temperature increase above 300°C, whereas in the case of discarded cereals, the opposite is true. Therefore, from the pyrolysis experiment of Grycova et al. [33], it is clear that the syngas generated is highly dependent on feedstock used as well as temperature in some cases. An experiment carried out by Aguira et al. [56] on discarded orange peel in a fixed bed pyrolysis reactor shows that the gaseous yield is largely independent of feedstock particle size. The syngas yield variation with particle size was only 2%.
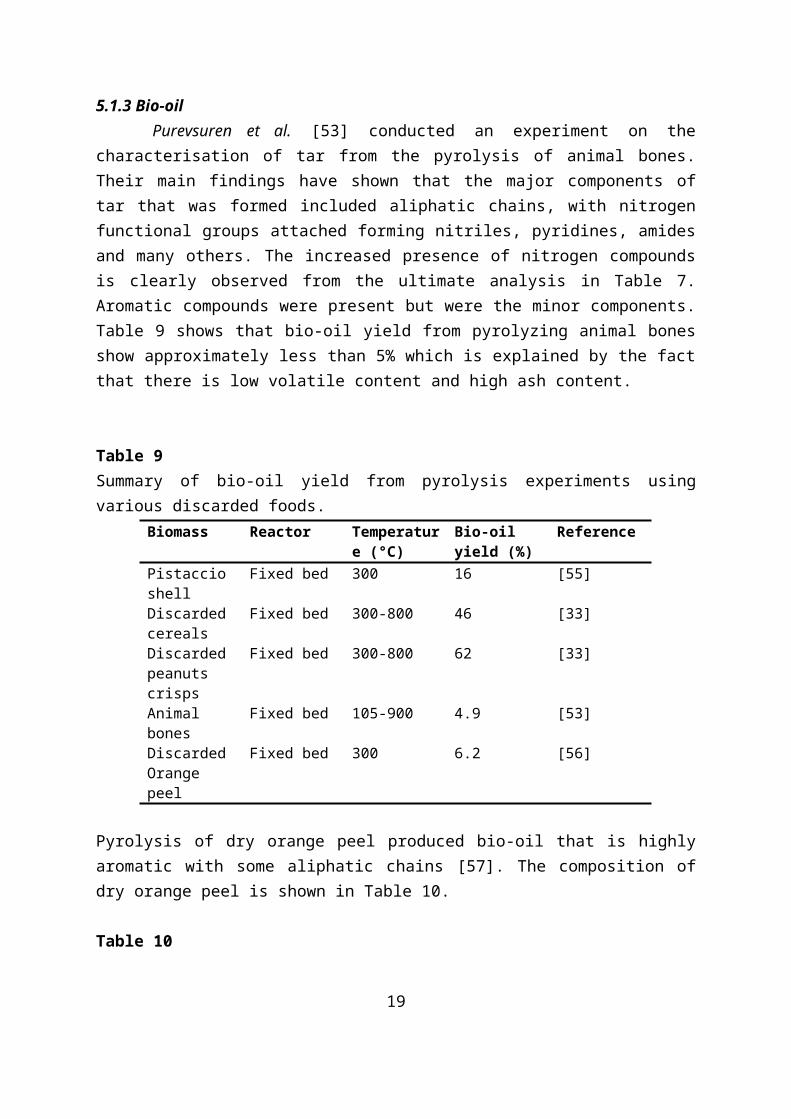
5.1.3 Bio-oil Purevsuren et al. [53] conducted an experiment on the characterisation of tar from the pyrolysis of animal bones. Their main findings have shown that the major components of tar that was formed included aliphatic chains, with nitrogen functional groups attached forming nitriles, pyridines, amides and many others. The increased presence of nitrogen compounds is clearly observed from the ultimate analysis in Table 7. Aromatic compounds were present but were the minor components. Table 9 shows that bio-oil yield from pyrolyzing animal bones show approximately less than 5% which is explained by the fact that there is low volatile content and high ash content.
12
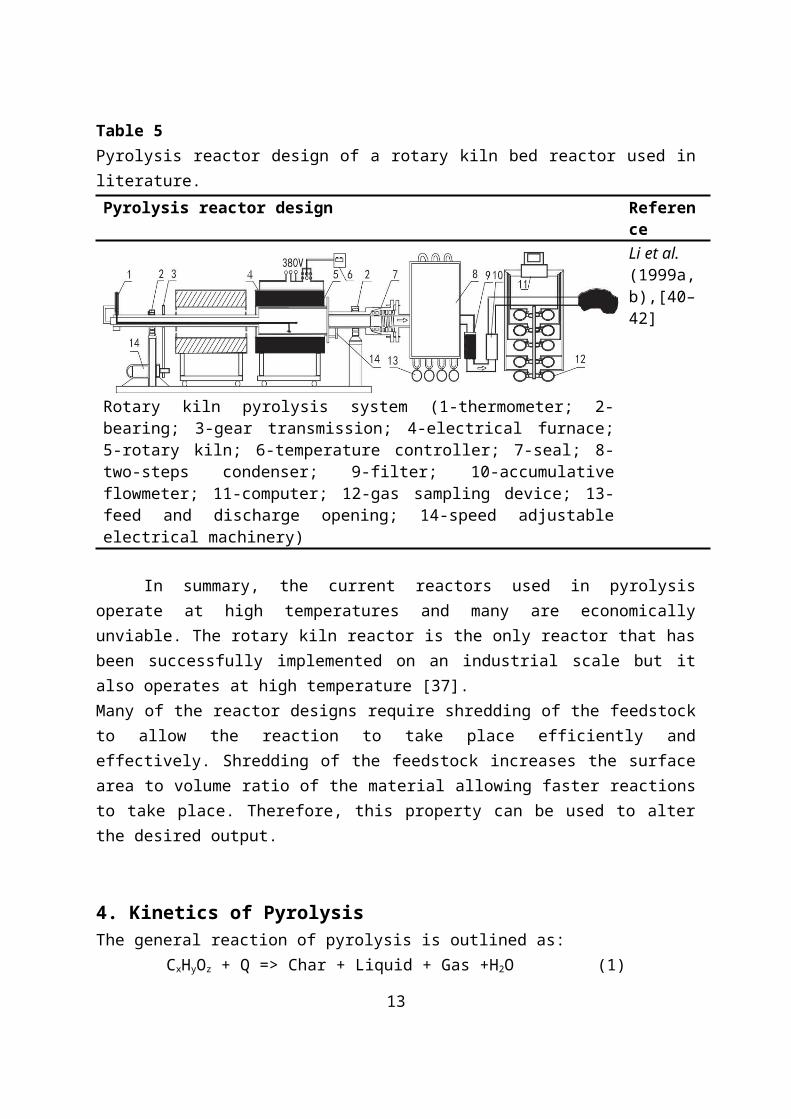
Table 9Summary of bio-oil yield from pyrolysis experiments using various discarded foods.
Biomass Reactor Temperature (°C)
Bio-oil yield (%)
Reference
Pistaccio shell Fixed bed 300 16 [55]Discarded cereals
Fixed bed 300-800 46 [33]
Discarded peanuts crisps
Fixed bed 300-800 62 [33]
Animal bones Fixed bed 105-900 4.9 [53]Discarded Orange peel
Fixed bed 300 6.2 [56]
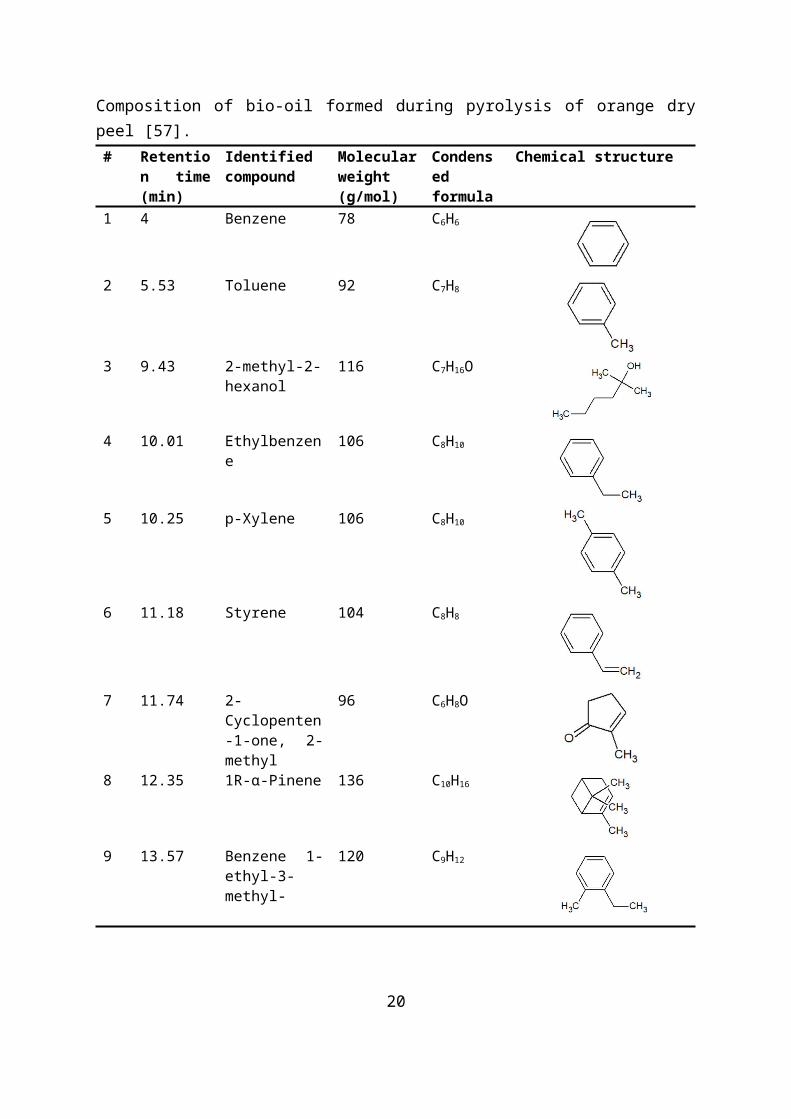
Pyrolysis of dry orange peel produced bio-oil that is highly aromatic with some aliphatic chains [57]. The composition of dry orange peel is shown in Table 10.
Table 10Composition of bio-oil formed during pyrolysis of orange dry peel [57].# Retention
time (min)Identified compound
Molecular weight (g/mol)
Condensed formula
Chemical structure
1 4 Benzene 78 C6H6
2 5.53 Toluene 92 C7H8
3 9.43 2-methyl-2-hexanol
116 C7H16O
4 10.01 Ethylbenzene 106 C8H10
5 10.25 p-Xylene 106 C8H10
6 11.18 Styrene 104 C8H8
13

7 11.74 2-Cyclopenten-1-one, 2-methyl
96 C6H8O
8 12.35 1R-α-Pinene 136 C10H16
9 13.57 Benzene 1-ethyl-3-methyl-
120 C9H12
The formation of highly aromatic molecules can be problematic, especially in the case of Benzene, Toluene and Xylene due to their carcinogenic nature. Therefore, bio-oil containing such chemical components will require handling with care and treatment.
5.1.4 Biochar5.1.4.1 Influence of treatment time on biochar yield Even though the treatment temperature has a bigger influence on biochar yield, the treatment time also effects the over-all product yield [59, 60]. Table 11 is a summary of reviewed studies along with the reactions’ operating parameters [59, 61-62]. These studies show that increasing the treatment time has a negative effect on the biochar product yield, with the product yield decreasing by 0.4 – 58%. The biggest drop in biochar yield is seen in the research of Ronsse et al. [60] where straw biomass shows a biochar yield decrease of 58% with a longer residence time. This can be explained by the fact that a high heating rate results in the degradation of naturally occurring biomass structures and a loss of volatile compounds [63-64]. Although biochar yield is highly influenced by the type of biomass used, all reviewed studies show a decrease in the biochar yield during a longer pyrolysis residence time [64]. A longer treatment time results in a loss of volatile compounds, which is one of the reasons for lower biochar yield [59, 66].
Table 11 A summary of the experimental conditions used during the pyrolysis of food biomass of four different journal articles [59, 61-62].Type of reactor GDL-1500X tubular
furnaceTubular stainless steel Muffle furnace
Reactor size (L) - 1.36 -Type of waste Rice straw Straw and dry algea Rice strawSample amount Unknown sample
amount as < 0,25 mm particles
70 – 135 g as 2 mm – 15 mm particles
Unknown sample amount as < 2 mm particles
Treatment time(mins)
60, 120, 180, 300 10, 60 120, 240, 460
14

Heating rate (°C /min)
5 17 -
Treatment temperature (°C)
300, 400, 500, 600, 700
300, 450, 600, 750 250, 300, 350, 400, 450
Pressure Atmospheric Atmospheric -Biochar yield with longer residencetime
Slight decrease (~0,4%)
Decrease (~56%) Decrease (~9%)
Reference W. Wu (2012) [58] F. Ronsse (2013) [60] X. Peng (2011) [61]
The residence time also affects the overall biochar content, as shown in Table 12. The residence time has a huge influence on the quantity of volatile matter. Ronsse et al. [60] stated that there is a drop of ~60% of volatile compounds between the residence time of 10 minutes and 60 minutes at a treatment temperature of 300 °C. This finding is confirmed by the results from other studies [59, 62, 66]. At a longer residence time, the amount of fixed carbon increases. Biochar with a high amount of fixed carbon and low volatile matter is very stable, as the biochar has a better resistance to either aerobic or anaerobic degradation [60]. A longer residence time results in more organic carbon structures, as more organic carbon clusters are formed, the char becomes more graphitic, thus more stable [67]. This type of biochar is favoured for soil management and water treatment, as the overall characteristics are better [66, 69].
Table 12 The biochar characteristics of straw biochar made during pyrolysis at two different highest treatment temperatures (HTT) and residence times from the research study of Ronsse et al. [60].Biomass material and HTT
Residence time (min)
Volatile matter (wt.%)
Fixed carbon (wt.%)
Fixed carbon yield (wt.%)
Ash content (wt.%)
Total C content (wt.%)
Total H content (wt.%)
Straw 300 °C 10 94.8 23.7 22.5 8.0 50.3 6.260 36.8 66.5 24.5 19.1 76.2 5.0
450 °C 10 28.5 80.6 23.0 22.4 84.1 3.660 27.5 84.1 23.1 22.9 86.4 3.5
5.1.4.2 Influence of temperature on biochar yield During the pyrolysis of food biomass, a lot of naturally occurring plant structures degrade, resulting in a huge mass loss. As hemicellulose degrades at 200 °C – 260 °C and cellulose at 240 °C – 350 °C, there is a reduction of biomass volume during pyrolysis. The mass loss profile is shown in Figure 3. The first mass drop in this figure (50 °C – 100 °C) is due to the
15

evaporation of moisture. The second mass drop (250 °C – 350 °C) is related to the degradation of hemicelluloses and celluloses. Lignin, another plant structure, degrades at a much higher temperature, between 300 °C – 600 °C (highest temperature is highly dependent on the biomass) which explains the last mass loss at 500 °C [64, 68, 70-71].
Figure 3. Percentage mass loss of a typical plant feedstock. The mass drops are caused by the degradation of plant structures [69]. The highest treatment temperature (HTT) has a major influence on the mass loss profile but it is also the factor that has the most impact on biochar yield. Especially when working with food biomass, a lower treatment time is favoured as high temperatures cause a drastic decrease in the biochar yield [56, 61, 63, 72-75]. Ronsse et al. [60] researched the influence of treatment time and temperature on the yield of biochar with four different types of biomass. All biomasses showed a great decrease of biochar yield when the treatment temperature was increased. The results of Ronsse et al. [60] are summarized in Figure 4, where the effect of the treatment temperature is shown. When the temperature was increased at 150 °C increments (from 300 °C to 450 °C) there was an average biochar yield loss of
~60%.Figure 4. Percentage Biochar yield as a function of temperature [60].
As seen in Table 13, the increasing temperature lowers the H/C ratio which can be explained by the aromatic rings becoming more graphitic. The Brunauer-Emmett-Teller (BET) surface area also increases because the cell structures and naturally occurring pores degrade resulting in fewer, but bigger pores [17, 26, 28].
Table 13 The effect of treatment temperature on food biochar characteristics researched by Ronsse et al. [60].Temperature Time pH in C (wt.%) H (wt.%) H/C Highest
16
200 300 400 500 600 700 8000
10
20
30
40
50
60
70
80
90
100Wood biomass
Straw Biomass
Green waste biomass
Dry algae biomass
Htt during the pyrolysis (°C)
Bioc
har y
ield
(wt%
)

(°C) (min) solution ratio heating value (MJ/kg)
300 10 6.1 50.3 6.2 1.47 -450 9.8 84.1 3.6 0.51 25.1600 10.9 90.1 2.4 0.32 26.5750 12.1 92.2 1.6 0.20 -
To produce a very stable biochar, a low temperature and long residence time are preferred. The optimal treatment temperature in order to make biochar is a temperature of 300 °C or below, as this produces the highest biochar yield (when comparing the yield with that at higher temperatures) and also the best biochar characteristics.
5.2 Plastics The production and use of plastic products have grown enormously over the last couple of decades due to their wide range of properties. Plastics are long chains of monomers that are mainly derived from fossil fuels but can also be derived from chemical processes. Plastics are categorised into the following groups: Poly-Propylene (PP), Polyethylene terephthalate (PET), Low-density polyethylene (LDPE), High-density polyethylene (HDPE) and Polyvinyl chloride (PVC) [77-78]. Due to the fact that there is not a proper way to recycle all types of plastics, most of it is dumped in landfills. Pyrolysis of plastic may be an interesting alternative as it provides an opportunity to turn waste into valuable biogas and biofuel [79].
5.2.1 Proximate and ultimate analysis Plastic comes in a variety of forms to serve different purposes. China is the biggest producer of plastic, reaching 269 million tonnes in 2015. The biggest disadvantage of plastics is that they are the least likely organic material to biodegrade from municipal solid waste [80]. Therefore, the deposition of plastic into landfill sites is not desirable and incineration has many controversies due to the toxic gases that can be released into the atmosphere [81]. Pyrolysis offers a mechanism of plastic waste conversion that is economical with the least environmental effect [82]. Sharuddin et al. [37] has reviewed pyrolysis of plastics and concluded that it has the potential to produce valuable and economical syngas, bio-oil and bio char. There are many types of plastic and the majority fall into groups as shown in Table 14.
Table 14Properties of various types of plastic [4–6, 8, 38-39, 86]. Types of plastic Moisture (wt.%) Fixed carbon
(wt.%)Volatile (wt.%) Ash (wt.%)
Polyethylene terephthalate (PET)
0.46 - 0.61 7.77 – 13.17 86.83 – 91.75 0.00 – 0.02
High-density polyethylene (HDPE)
0.00 0.01 – 0.03 98.57- 99.81 0.18 – 1.40
Polyvinyl 0.74 - 0.80 5.19 – 6.30 93.70 – 94.82 0.00
17

chloride (PVC)Low-density polyethylene (LDPE)
0.30 0.00 99.60 – 99.70 0.00 – 0.40
Polypropylene (PP)
0.15 - 0.18 0.16 – 1.22 95.08 – 97.85 1.99 – 3.55
Polystyrene (PS) 0.25 - 0.30 0.12 – 0.20 99.50 – 99.63 0.00Others 0.00 - 0.16 0.04 – 2.88 97.12 – 99.78 0.00 – 1.01
Table 14 clearly shows that the majority of the plastics are highly volatile, thus responsive to thermal decomposition. The moisture, fixed carbon and ash content are very small meaning that the products produced will predominantly be bio-oil and no water processing is required if pyrolysis is carried out for plastic only. To evaluate the quality of the bio-oil that can be used as fuel in motor engines, Table 15 showcases the properties of the bio-oils that are derived from the pyrolysis of plastic in comparison with the commercial standard values of gasoline and diesel.
Table 15Physical properties of bio-oils from various types of plastic and standard values of gasoline and diesel [4-6, 8, 38-39, 86]. Physical properties
Type of plastic Commercial standard value ASTM 1979
PET HDPE PVC LDPE PP PS Gasoline DieselAPI gravity@ 60OF
N/A 27.48 38.98 47.75 33.03 N/A 55 38
Viscosity (mm2/s)
N/A 5.08 6.36 5.56 4.09 1.4 1.17 1.9-4.1
Density @15°C (g/cm3)
0.90 0.89 0.84 0.78 0.86 0.85 0.78 0.81
Octane number MON (min)
N/A 85.3 N/A N/A 87.6 N/A 81-85 -
Octane number RON (min)
N/A 95.3 N/A N/A 97.8 9-98 91-95 -
Pour point (°C)
N/A -5 N/A N/A -9 -67 - 6
The properties of bio-oils from HDPE, PP and PS, shown in Table 15, have MON and RON values that are within the range of commercial gasoline and diesel standards. However, the bio-oils from plastics have higher viscosity values than the standard. Therefore, bio-oil derived from plastics would require further chemical treatment before it is suitable for commercial use.
18
5.2.2 Syngas Syngas is considered to be a by-product when plastic is the feedstock of a pyrolysis reactor. The percentage weight of the gaseous fraction is within 5-20%. To increase the gaseous fraction of the pyrolytic product, high temperatures (over 500°C) are required. This parameter opposes the conditions needed for high bio-oil yield [87]. The gaseous products from the pyrolysis of LDPE, PS and their mixture were investigated by Onwudili et al. [87]. Their results have shown that more gas is produced when a mixture of plastic feedstock is used in comparison to the individual types of plastics. The gaseous fraction produced in their investigation did not exceed 13% at a temperature of 350°C [87]. Williams et al. [38] conducted experiments on HDPE, LDPE, PP, PS, PET and PVC individually and their results show that the composition of the gas components produced during pyrolysis of each type of plastic were hydrogen, methane, ethane, ethene, propane, propene butane and butene. However, it was noted that when PET was used as feedstock in pyrolysis, gases such as carbon dioxide and carbon monoxide were produced in higher amounts relative to other types of plastics. Hydrogen chloride was produced when PVC was used as feedstock. Jung et al. [88] investigated the use of PET and PP plastic as feedstock for pyrolysis. Their findings show that each of PET and PP individually had produced gases that have high calorific values of approximately 42 and 50 MJ/kg. Therefore, the pyrolysis gases produced using PE and PP have a great potential to be used as a heating source in pyrolysis plants. Furthermore, as the majority of different types of plastics used in pyrolysis produce gases containing ethene and propene, these can be used as a chemical feedstock for the production of polyolefins if separated from other gas components. The high calorific value of pyrolysis gas enables it to be used to generate electricity using gas turbines or in direct firing in boilers [37]. Quantification of each type of syngas produced from pyrolysis at temperatures below 300°C is not available in literature but its composition may include the gases shown in Table 16 depending on the operating parameters of the reaction.
Table 16 Gaseous molecules produced by pyrolysis of plastics [6, 19, 37, 84].
Gas
HydrogenCarbon monoxideCarbon dioxide
MethaneEthanePropanePropeneButaneButene
19
5.2.3 Bio-oil Many experiments in literature [38, 87-88] have been carried out to characterise the chemical composition of the bio-oil produced from the pyrolysis of plastics. Bio-oil is the major product produced from the pyrolysis of plastics, therefore, it has been widely focused on in literature. The type of plastic used as a feedstock in the reactor ultimately dictates the composition of the products. Table 17 shows the possible chemical composition of the pyrolytic products of plastics. It must be noted that the distribution of the compounds varies depending on the composition of the feedstock and the operating parameters.
Table 17Chemical composition of the products produced from the pyrolysis of plastics [38, 87-89].PET HDPE PVC LDPE PP PS1-Propanone 1-
Methylcyclopentene
Azulene Benzene 2-Methyl-1-Pentene
Benzene
Benzoic acid 3-Methylcyclopentene
Naphthalene, 1-methyl-
Toluene 3-Methylcyclopentene
Toluene
Biphenyl 1-Hexene Biphenyl Xylene 1-Heptene Ethylbenzene
Diphenylmethane
Cyclohexene Naphthalene, 1-ethyl-
Dimethylbenzene 1-Octene Xylene
4-Ethylbenzoic acid
1-Heptene Naphthalene, 1-(2-propenyl)-
Trimethylbenzene C4–C13 hydrocarbon
Styrene
4-Vinylbenzoic acid
1-Octene Naphthalene, 2,7-dimethyl-
Indane Over C14 hydrocarbon
Cumene
Fluorene 1-Nonene Naphthalene, 1,6-dimethyl-
Indene Benzene Propylbenzene
Benzophenone
1-Decene Naphthalene, 1,7-dimethyl-
Methylindenes Toluene 2-Ethyltoluene
4-Acetylbenzoic acid
1-Undecene Naphthalene, 1,4-dimethyl-
Naphthalene Xylene Naphthalene
Anthracene 1-Tridecene Naphthalene, 1,6,7-trimethyl-
Methylnaphthalenes
Ethybenzene Diphenylmethane
20

Biphenyl-4-carboxylic acid
C4–C13 hydrocarbon
9H-Fluorene
Ethylnaphthalene Indene Anthracene
1-Butanone Over C14 hydrocarbon
Naphthalene, 1-(2-propenyl)
Dimethylnaphthalene
Biphenyl 1,2-Diphenylethane
m-Terphenyl Benzene Phenanthrene, 1-methyl
Acenaphthylene - 2,2-Diphenylpropane
- Toluene Fluoranthene, 2-methyl-
Acenaphthene - 1,3-Diphenylpropane
- Xylene 1H-Indene, 2,3-dihydro-5-methyl-
Trimethylnaphthalenes
- Phenylnaphthalene
- - Naphthalene, 2-phenyl-
Fluorene - Diphenylbenzene
- - - Tetramethylnaphthalene
- Triphenylbenzene
The majority of the plastics will produce a variety of compounds; some are alkanes, alkenes, aromatics and others shown in Table 17. The major concern is that benzene is produced and benzene is a known carcinogen [90]. Therefore, the products must be properly controlled and used before they come into contact with humans. The chemical characterisation of pyrolytic products with plastics as feedstock, shown in Table 17, may require a high temperature to achieve. However, these chemical compounds may be achievable by altering parameters other than temperature such as heating rate, pressure and residence time [37]. Paradela et al.[91] conducted a research study on co-pyrolysis of biomass and plastic wastes. Their findings show that when plastics were pyrolysed up to temperature of 450°C, a higher heating value of 44.7 MJ/kg was achieved. This value is similar to that of heating fuel oil. The major parameters that showed a high influence are as follows: alkane content increases with increased temperature and reaction temperature strongly influences product phase distribution. Ma et al. [92] carried out an experiment on the low temperature pyrolysis of PVC. They have found that at temperatures below 300°C the yield consisted of a solid residue while oil and gas were the minor phases. The most influential parameters were found to be similar to that of Paradela et al. [91]. The molecular content of PVC includes chlorine, which is toxic, and after decomposition due to pyrolysis over 90% of the chlorine is found to be in the gaseous phase. Therefore, the gaseous phase must be treated carefully.
21

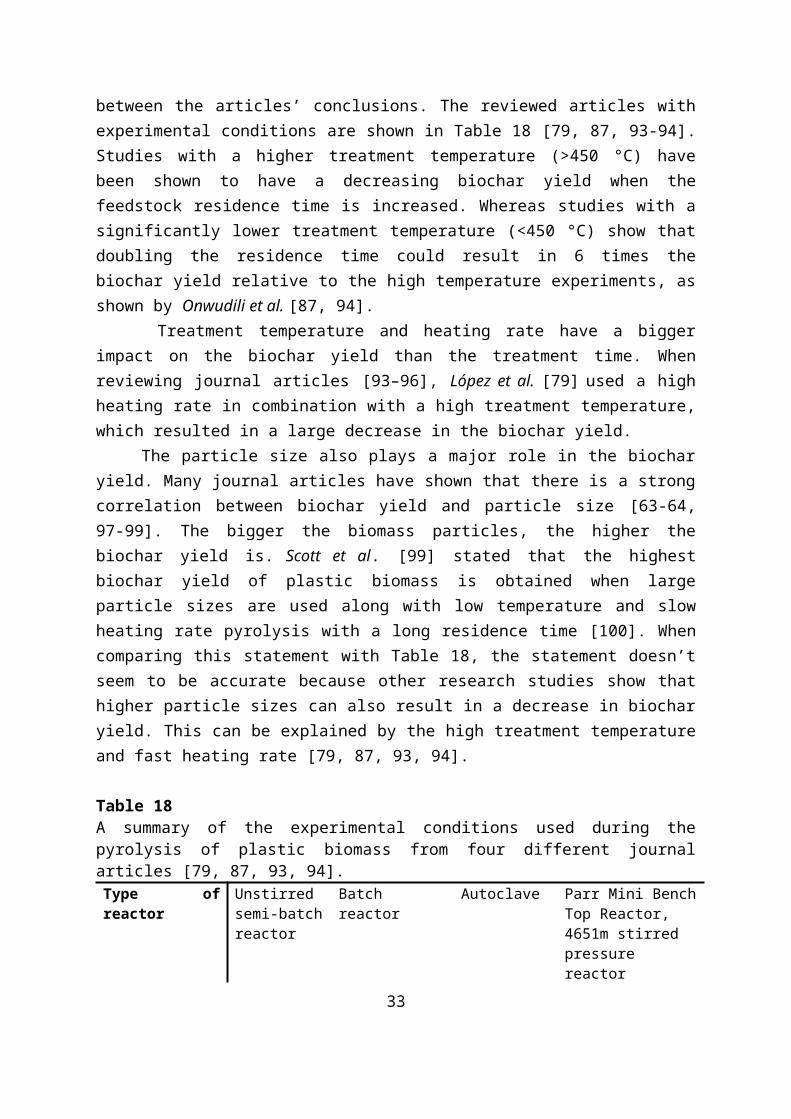
5.2.4 Biochar5.2.4.1 Influence of treatment time on biochar yield Pyrolysis of plastic in literature differs in the operating parameter conditions and there is some contradiction between the articles’ conclusions. The reviewed articles with experimental conditions are shown in Table 18 [79, 87, 93-94]. Studies with a higher treatment temperature (>450 °C) have been shown to have a decreasing biochar yield when the feedstock residence time is increased. Whereas studies with a significantly lower treatment temperature (<450 °C) show that doubling the residence time could result in 6 times the biochar yield relative to the high temperature experiments, as shown by Onwudili et al. [87, 94]. Treatment temperature and heating rate have a bigger impact on the biochar yield than the treatment time. When reviewing journal articles [93–96], López et al. [79] used a high heating rate in combination with a high treatment temperature, which resulted in a large decrease in the biochar yield. The particle size also plays a major role in the biochar yield. Many journal articles have shown that there is a strong correlation between biochar yield and particle size [63-64, 97-99]. The bigger the biomass particles, the higher the biochar yield is. Scott et al. [99] stated that the highest biochar yield of plastic biomass is obtained when large particle sizes are used along with low temperature and slow heating rate pyrolysis with a long residence time [100]. When comparing this statement with Table 18, the statement doesn’t seem to be accurate because other research studies show that higher particle sizes can also result in a decrease in biochar yield. This can be explained by the high treatment temperature and fast heating rate [79, 87, 93, 94].
Table 18 A summary of the experimental conditions used during the pyrolysis of plastic biomass from four different journal articles [79, 87, 93, 94].Type of reactor Unstirred
semi-batch reactor
Batch reactor Autoclave Parr Mini Bench Top Reactor, 4651m stirred pressure reactor
Reactor size (L) 3.5 20 0,025 0,3 Type of waste PE, PP,
PS,PET & PVC
Plastic plates (mostly made of PS)
LDPE LDPE & PS
Sample amount 100 g as 3 mm particles
1000 g as 5 cm2 particles
4 g as 40 µm particles
10 g as 2 mm particles
Treatment time(minutes)
30 60, 75, 120 30, 90 60, 120
Heating rate (°C /min)
20 10 - 10
Treatment temperature (°C)
460, 500, 600 400, 450, 500 370 – 450 300, 500
Pressure Atmospheric Atmospheric - 0.8 – 4.3 MPaBiochar yield with longer residencetime
Decreased (~25%)
Decreased (~4%) Increased (~35%)
Increased (~8%)
22

Reference A. López (2011)
R. Miandad (2016)
L. Tiikma (2006)
Jude A. Onwudili (2009)
Research conducted by López et al. [79] has shown that the treatment time has a big impact on the H/C-ratio. Especially in the first 15 minutes there is an increasing amount of carbon and a decreasing amount of hydrogen in the biochar, as shown in Table 19. After the first 15 minutes, all the characteristics stay relatively the same. The treatment time did not have a big impact on the biochar characteristics in pyrolysis performed at 500 °C [79-87].
Table 19 The biochar characteristics of plastic biochar made during pyrolysis with 500 °C as HTT, as stated by López et al. [79].Temperature (°C)
Time (min)
Moisture (wt.%)
C (wt.%) H (wt.%) H/C ratio
Highest heating value (MJ/kg)
5000 - 83.8 14.0 2.0 47.415 0.4 94.4 3.7 0.5 39.430 0.2 93.7 3.5 0.4 38.2120 0.3 94.1 3.5 0.4 38.2
5.2.4.2 Influence of temperature on biochar yield In order to break down plastic, a relatively higher treatment temperature is favoured during pyrolysis, as the degradation of plastic starts at 400 °C and it is fully pyrolyzed at 500 °C [79]. The degradation can be registered by looking at the mass loss. López et al.[79] conducted research into pyrolysis of different kinds of plastics. The results in terms of mass loss rate can be seen in Figure 5. As seen in the figure, every plastic (except for PVC) has one peak. This peak shows the degradation temperature and speed per type of plastic. The first PVC peak is explained by the evaporation of HCl, the second peak is the decomposition of the remaining polyene [79]. During the full degradation of plastics, bio-oil and syngas are the most common products. The higher the pyrolysis temperature is, the higher the syngas yield will be [93, 96].
23

Figure 5. Rate of mass loss of different types of plastics due to pyrolysis. PVC is the only plastic type that has two peaks. The average decomposition temperature is 450 °C as found by López et al [79].
While a higher temperature is needed for full decomposition of plastic mass, biochar yield decreases with increasing temperature. The required temperature to fully break down plastic is so high that the biochar yield during pyrolysis very low or not even present. The common products that are formed appear as bio-oil and syngas [93, 96]. To get the highest biochar yield during the pyrolysis of plastic, a very low treatment temperature and a long residence time are favoured. The lower temperature ensures that less plastic gets converted into bio-oil or syngas and the longer treatment time increases the biochar yield [87, 94, 96]. Another temperature related influence on the biochar characteristics is the heating rate. The heating rate plays a major role in the formation of pores. When comparing the same biochar made with other heating rates, the biochar made with low heating rates have fewer pores [69, 101]. The pores are also smaller when comparing them with pores of biochar made during a high heating rate process. When the heating rate is increased, the volatile compounds evaporate, creating new pores or enlarging the already existing pores [58, 102]. However, a very high heating rate (>100 °C/min) negatively influences the biochar pore structure, as natural biomass structures degrade resulting in destruction of the pores present [103]. An overview of four different heating rates and some of the biochar pore structure reported in literature is given in Figure 6 [62].
24

Figure 6. The influence of heating rate on the pore definition of biochar, where a high heating rate results in a biochar with very defined and big pores [62].
The overall biochar characteristics strongly depend on the HTT and heating rate. For the optimal pore formation, a heating rate of 10 °C/s is favoured, as the structure of micro- and macro-pores are almost the same at a heating rate of 100°C/s, but the lower heating rate makes sure no internal structure cracks occur [62]. Looking at Table 20, increasing the temperature has some negative effects on biochar characteristics. As the temperature increases, the H/C ratio decreases meaning that the (aromatic) carbon-rings are getting more graphitic. When the structure becomes more graphitic, the amount of random cross-links will decrease, meaning there is a decrease in natural occurring pores. The higher heating value also decreases, this goes hand in hand with the decreasing H/C ratio [79]. The best biochar yield and characteristics are obtained during a long residence time, lower heating rate and low temperature pyrolysis [63, 79, 87, 93-94].
Table 20The effect of temperature on the biochar composition as found by López et al. [79].Temperature (°C)
Time (min)
Moisture (wt.%)
C (wt.%) H (wt.%) H/C ratio
Higher heating value (MJ/kg)
46030
0.1 92.0 3.9 0.5 38.5500 0.2 93.7 3.5 0.4 38.2600 0.1 91.7 2.3 0.3 36.8
25

5.3 Sewage sludge Sewage sludge (SS) disposal can be a challenging issue due to increased laws and regulations. In the EU over 10 million tons of sewage sludge is produced every year and the amount is increasing rapidly due to the increasing population. The majority of sludge is disposed of in three ways: landfill, agricultural use and incineration [104]. Figure 7 shows how sewage sludge is disposed of by treatment type. The bar chart clearly shows that some countries dispose of sludge in an unknown way. This can be alarming due to the toxic nature of some sludge materials and the amount is as high as 80% in the case of Sweden.
Belg
ium
(200
8)Bu
lgar
y (2
009)
Czec
h Re
publ
ic (2
007)
Denm
ark
(200
7)G
erm
any
(200
7)Es
toni
a (2
009)
Irela
nd (2
007)
Gre
ece
(200
9)Sp
ain
(200
9)Fr
ance
(200
8)Ita
ly (2
008)
Cypr
us (2
007)
Lativ
a (2
007)
Lith
uani
a (2
007)
Luxe
mbo
urg
(200
8)Hu
ngar
y (2
007)
Mal
ta (2
009)
The
Net
herla
nds
(200
8)Au
stria
(200
8)Po
land
(200
9)Po
rtug
al (2
007)
Rom
ania
(200
9)Sl
oven
ia (2
009)
Slov
akia
(200
5)Fi
nlan
d (2
000)
Swed
en (2
009)
Uni
ted
King
dom
(200
9)Ic
elan
d (2
003)
Switz
erla
nd (2
006)
0
10
20
30
40
50
60
70
80
90
100
No available data
Other
Incineration
Landfill
Compost and other applications
Argicultural use
Tota
l mas
s per
cent
age
(%)
Figure 7. Disposal methods of sewage sludge in European countries [105].
Sewage sludge is the solid that arises from water-solid separation during water treatment. As the human population keeps growing, we require more water for the treatment of sewage sludge if we continue to discard this resource. The amount of dry matter produced on average by each person is around 50 g a day. As this matter contains hormones, prions and toxins, it can be dangerous for human and animal health if consumed without treatment. Transportation of this matter and its treatment are expensive for discarded material treatment plants. This matter is rich in volatile matter. Therefore, pyrolysis is a good conversion process as it can convert matter into valuable products [106-107]. Composition and yield are highly dependent on operating parameters [108]. To measure mass change over time as the temperature increases during pyrolysis, thermogravimetric analysis is performed in a micro-processor unit assisted by a data station [57]. Bio-oil is characterised by gas chromatography/mass spectrometry. Non-condensable products are characterised by chromatography.
26

5.2.1 Proximate and ultimate analysis Experimental studies using pyrolysis carry out proximate and ultimate analyses of the feedstock used. This enables possible correlations to be made with the products formed due to pyrolysis. The results of these analyses are shown in Tables 21 and 22.
Table 21Proximate analysis of sewage sludge from various experiments. Material Fixed
carbon (%)
Moisture (%)
Volatile matter %)
Ash (%) HHV (MJ/kg)
Reference
Sludge (dry basis)
14.0 0 33.4 52.4 - [109]
SS - (wet basis)
1.5 3.4 40.1 55.0 - [110]
SS – (wet basis)
3.0 7.00 50 40 12.5 [75]
SS - (dry basis)
8.1 0 49.0 42.9 - [111]
SS - (dry basis)
0.4 0 31.5 63.1 - [112]
SS - (wet basis)
19.0 6.2 58.9 15.9 20.4 [113]
SS - (dry basis)
5.6 7.7 51.7 35.0 13.2 [114]
Proximate analyses of various materials, from Table 21, show that volatile matter and ash content are the major components with very similar weight percentages. The averaged higher heating value for sewage sludge based on 32 values reported in 18 articles is 16.1 MJ/kg [8-24]. It ranges from 11.10 to 22.1 MJ/kg.
Table 22Ultimate analysis of various sewage sludges.Material Carbon
(%)Hydrogen (%)
Nitrogen (%)
Oxygen (%)
Sulphur (%)
Reference
Sludge (dry basis)
22.2 4.0 3.4 17.5 0.5 [109]
SS - (wet basis) 20.0 3.4 3.1 14.0 1.1 [110]
SS – (wet basis) 69.0 9.0 8.3 12.0 1.9 [75]
SS - (dry basis) 26.7 3.3 4.0 22.1 1.2 [111]
SS - (dry basis) 21.0 8.7 3.5 66.0 0.9 [112]
SS - (wet basis) 58.5 9.0 5.0 27.5 0.05 [113]
SS - (dry basis) 58.5 5.8 0.5 33.7 1.4 [114]
27

Ultimate analyses of the same feedstock materials used in Table 21 are shown in table 22. The ultimate analyses show an almost equal split of carbon and oxygen content with hydrogen content at less than 10% as well as some nitrogen and sulphur content at very low amounts. The presence of sulphur within the feedstock requires careful consideration if the syngas is combusted. Sulphur content must be monitored to make sure that it is within the emissions limits. Ogilvie et al. [130] carried out a study on the composition of sewage sludge and they reported that different types of sludge contain 20 to 40% of total organic carbon (TOC) while at least half of the total solids are volatile, as shown in Table 23. Ether content in sludge is low according to Ogilvie et al. [130]. However, ethers can undergo many chemical reactions such as formation of alcohols and haloalkane under heating conditions.
Table 23 Summary of sludge content in terms of organic carbon [130].Constituent Raw sludge Aerobic sludge Anaerobic
sludgeCompost sludge
Volatile solids (%)
75.0 56.5 59.9 49.0
Chemical Oxygen Demand (%)
77.2 39.6 49.9 34.6
TOC (%) 39.4 25.1 30.1 22.15.3.1 Syngas
In-order to show the effect of feedstock on gas yield, Table 24 summarises the experimental results of sewage sludge pyrolysis.
Table 24 A summary of pyrolysis of sewage sludge reported in literature.
Biomass Reactor Temperature (°C)
Gas yield (%) Reference
SS – discarded water treatment plant
Fixed-bed tubular reactor
350 17 [111]
SS - municipal discarded water treatment plant
fixed-bed reactor
350 20 [131]
Sludge – municipal discarded water treatment plant
fixed-bed reactor
300 6 [110]
Sludge – municipal discarded water treatment
Integrated pyrolysis reactor
350 4.7 [132]
Information on syngas yield based on the low temperature pyrolysis of sewage sludge is scarce in literature. However, some journal articles provide yield information at 350°C which show that syngas yield can be in the range of 5 to 20%, as shown in Table 25.
28

The composition of the syngas includes carbon monoxide, carbon dioxide, hydrogen, methane, ethene and ethane. The exact percentage distribution depends on many parameters such the origin of the sludge, heating rate, temperature and many others [114].
Figure 8. Gas evolution at different heating rates as temperature is increased [114].
Kan et al. [114] conducted an experiment observing the effect of the heating rate on biofuel properties of sewage sludge pyrolysis. Their results, in-terms of gas evolution, are shown in figure 8. The results clearly indicate that at 300°C and below, carbon dioxide is the major gas that is evolved and its evolution rate increases steeply with increasing heating rate. Carbon monoxide and hydrogen formation also increase with increased heating rate but carbon monoxide evolution becomes significant at temperatures above 600°C. Carbon monoxide is more problematic than carbon dioxide due to its toxic nature.
29

5.3.2 Bio-oil Temperature plays a major role in determining product yield and composition. High temperatures, over 500°C, favour gas formation, whereas low temperatures favour biochar formation. The advantage of having bio-oil, as a product, is that it can be used as a fuel or a chemical feedstock. Many studies [110-111, 132] have conducted experiments on sewage sludge samples that are derived from wastewater treatment plants. Table 25 below shows a summary of various experiments that were carried out at low temperature.
Table 25 Summary of bio-oil yield from pyrolysis experiments using sewage sludge.
Biomass Reactor Temperature (°C)
Bio-oil yield (%)
Reference
SS – discarded water treatment
Fixed-bed tubular reactor
350 10 [111]
SS - municipal discarded water treatment
Quartz reactor 350 10 [131]
Sludge – municipal discarded water treatment
fixed-bed reactor
300 13 [110]
Sludge – municipal discarded water treatment
Integrated pyrolysis reactor
350 7.3 [132]
Table 26 Elemental analysis of tar produced from sewage sludge pyrolysis.Temperature, °C
C, % H, % N, % O, %
350 68.81 10.31 5.51 15.37450 69.42 10.23 5.85 14.50
Piskorz et al. [133] conducted an experiment on a dried mixture of raw and activated sewage sludge in a bench-scale fluidized-bed reactor at very short residence times of less than 1s over a high temperature range from 400-700°C. Their results have shown that liquid yield up to 52% was obtained and elemental analysis of the tar is shown in Table 26. Increasing the temperature does not significantly affect the elements present within the bio-oil. The atomic ratio of H/C is about 1.77 with the presence of some minor compounds such as alcohols and ketones. Sanchez et al. [131] conducted an experiment on the effect of pyrolysis temperature on the composition of the oils obtained from sewage sludge in the range of 350 to 950°C. Their
30

results have shown that the oils contain high concentrations of polycyclic aromatic hydrocarbons (PAH) even at the lowest experimental temperature of 350°C. Table 27 shows some of the compounds detected by gas chromatography- mass spectrometry during the analysis of the results.
Table 27A summary of concentration of the main compounds found in pyrolysis oil [131].
Compound Retention Time (min)
Final pyrolysis temperature (°C)350 450 550 950
Benzene 7.89 1001 1833 2706 4482Pyridine 10.50 4924 4001 6467 72901H-Pyrrole 10.97 8936 6401 9731 9063Toluene 11.37 4520 6893 11333 119401,4-dimethylbenzene 15.36 1174 1433 2601 2357Styrene 16.21 3036 3394 5994 53121,2-dimethylbenzene 16.30 844 869 1522 13462-Ethylpyridine 16.69 431 - 539 5163-Ethylpyridine 18.71 953 - 588 636Phenol 19.62 23990 18190 10919 12140Benzonitrile 19.77 4396 4443 3539 35911H-Indene 21.93 4003 3608 5235 6784o-Cresol 22.15 4132 3105 5265 2232p-Cresol 23.22 24558 17523 17589 210221-Undecene 23.22 1003 837 1012 8751-Dodecene 26.36 601 762 1240 1347Naphthalene 26.58 5382 6099 5481 4881Isoquinoline 28.21 3683 4331 1550 24221-Tridecene 29.28 1110 715 445 4171H-Indole 29.79 15766 13556 10271 109312-Methylnaphthalene 29.84 2771 3105 1943 2576
Most of the compounds shown in Table 27 are present at almost all temperatures but at different concentrations. The compounds belong to categories such as aliphatic hydrocarbons, aromatics, cycloalkanes and many more. These compounds contain high energy but some can be toxic such as benzene. Therefore, careful control of the products must be taken.
5.3.3 Biochar Biochar has been widely used as a precursor to produce activated carbons. Precursors such as coal, coconut shells, fruit stones, wood and bones have been in the frontline to produce high quality char. In particular, bone chars were commonly used as adsorbent and decolourisation agent for sugar cane, water purification and removal of toxic heavy metals such as cadmium from waste water streams [53-54].
31

5.3.3.1 Influence of treatment time on biochar yield Tables 28 and 29 summarize some of the reviewed journal articles for the effect of treatment time on the yield of biochar. All journal articles agree on the fact that the effect of the treatment time is not as significant as the effect of treatment temperature. The longer residence time mainly has an effect on the mass loss of the biomass used, which can be explained by the moisture content of sludge. Since the biomass used has a high moisture content, the total biomass mass drops during the pyrolysis due to the evaporation of water and volatile compounds [134].
Table 28 A summary of biochar yield from various experiments using sewage sludge as feedstock.
Biomass Reactor Temperature (°C)
Biochar yield (%)
Reference
SS - municipal discarded water treatment
Fixed-bed tubular reactor
350 73 [111]
SS – municipal discarded wastewater treatment
fixed-bed reactor 300 81 [110]
SS - municipal discarded water treatment
Integrated pyrolysis reactor
350 66.7 [132]
Table 29A summary of the experimental conditions used during the pyrolysis of sewage sludge from four different journal articles [134-137].References G. Q. Lu (1995) H. Lu (2013) E. Agrafioti
(2013)T. J. Bandosz (2006)
Type of reactor Isothermal reactor Fixed bed reactor
Muffle furnace Horizontal furnace
Type of waste Anaerobically digested dewatered sewage sludge (~50% moisture)
Sewage from three different WWTPs (~80%)
Raw sludge paste (~60% moisture)
NYC dewatered sewage sludge
Sample amount
40 g 100 g as 0,5 – 1,0 mm particles
20 g -
Treatment time(minutes)
30 – 180 min 120 min 30, 60, 90 min 30, 60 min
Heating rate (°C /min)
20 10 17 10
Treatment temperature (°C)
400 – 850 300 – 600 300, 400, 500 650, 950
Pressure Nitrogen atmosphere
Nitrogen atmosphere
Nitrogen atmosphere
Nitrogen atmosphere
Biochar yield with longer residencetime
No significant difference
No significant difference (2h was the optimal)
Increasing the treatment time with 1h results in a biochar yield
No significant difference
32
increase of 1,7% (62,5% to 64,2%) at 300 °C.
The journal articles reviewed in this paper show that, no matter how long the treatment time is, the biochar yield stays relatively stable. The decrease in yield with longer treatment times is very minimal. However, a longer residence time does have an effect on the BET surface area of the created biochar, where at a residence time of 2 hours, the BET surface area is the biggest [134]. A longer residence time results in a larger variation in pore size, with the longest residence time having the highest peaks at the smallest and largest pore diameters. Both statements are shown in Figure 9 & 10. The biochar yield is highly dependent on the treatment temperature [71, 110, 135, 138-139]. In order to get biochar with the best characteristics and yield, a slow pyrolysis with a long treatment time and a lower temperature is favoured. This gives the best pore distribution, water and volatile compound evaporation and the best absorption properties [134-137].
5.3.3.2 Influence of temperature on biochar yield Comparing the yield of sludge pyrolysis with food pyrolysis, the yield of sludge biochar is relatively low (~80% and ~15% respectively) [61, 135]. This is due to the high moisture content present in sludge. When pyrolyzing sludge biomass, moisture within the feedstock evaporates causing a large drop in mass of the feedstock. The main influencing parameter on percentage biochar yield is treatment temperature. Lu et al. [135] looked into the HTT effect on raw sludge and found that a higher HTT slightly decreases the biochar yield. The biochar yield at each temperature with three different kinds of sludge is given in Figure 11. The biochar yield is very low because the sludge had not been treated before. This gives a very high initial moisture content (~80%) which evaporates during the pyrolysis [135].
33
Figure 9. Profile of treatment time and BET surface area. The max SBET is achieved at a treatment time of two hours [210].
Figure 10. Profiles of pore diameter variation using different treatment times. The best pore distribution is achieved at a treatment time of three hours [210].

As Figure 11 shows, a higher treatment temperature results in a yield drop of ~3%. This is a very low percentage, mainly because the biomass has not had any pre-treatment. Other studies [134, 136-137, 140] have shown that drying the sludge before pyrolysis results in a higher biochar yield. These studies also show that the HTT impact is higher than Figure 11 shows. This is caused by the low amount of moisture, as there is no big mass drop during the pyrolysis of the dried sludge. Agrafioti et al. [136] showed that an increase in temperature by 200°C resulted in a biochar yield drop of 40%. When the pyrolysis temperature increases, there is a decrease in the total C, H, N and S weight percentage. The decrease in carbon and organic carbon can again be explained by the forming of bigger aromatic carbon ring clusters. This also causes the low H/C ratio. With the increase of temperature the weight percentage of metals decrease, which isn’t beneficial when the biochar is made to be used as soil enrichment. The change in product composition is shown in Table 30 [135].
Table 30The product composition of raw sludge and 4 sludge biochars made with different HTT as found by Lu et al. [135].
34
250 300 350 400 450 500 550 600 650 7005
7
9
11
13
15
17
Xilang water plant
Liede water plant
Datansha wa-ter plant
HTT during the pyrolysis (°C)
Bioc
har y
ield
(wt%
)
Fig 11. The impact of temperature on three different sludge biomasses without any pre-treatment, as found by Lu et al. [30].
Temperature (°C)
Time (min)
C (wt%)
Corganic
(wt%)H (wt%)
N (wt%)
S (wt%)
P (wt%)
H/Corganic BET (m2/g)
Raw sludgea 0 33.2 8.4 4.9 5.6 1.1 28.4 0.58 -300
12031.5 11.2 3.3 5.4 0.67 42.6 0.29 4
400 27.5 9.8 2 4.4 0.62 58.8 0.20 8.7500 26.7 9.0 1.9 3.7 0.42 59.9 0.21 10.2600 26 6.6 1.3 3.4 0.43 57.6 0.20 6.3

a The sludge is dried at 25 °C, the elemental composition is done without pyrolysis treatment
The sludge biochar particles are very amorphous and greatly vary in size, as seen in Figure 12. The biochar obtained does not have clearly defined pores, especially when comparing them with the wood biochar in Figure 17. Low temperature pyrolysis is favoured when pyrolyzing sewage sludge to obtain the best biochar characteristics and the highest yield. Pre-treatment of the biochar is mandatory in order to form the highest amount of biochar. A HTT lower than 300 °C is desirable, as this provides the highest biochar yield.
5.4 Wood and garden materials Materials derived from a garden, such as hedge cuttings, grass and wood, are all considered as carbon neutral sources of energy. The reason for this is that when this type of material is burnt it releases the CO2 that was originally absorbed from the atmosphere resulting in no net carbon emissions [6]. Wood consists of three major components (hemicellulose, cellulose and lignin) which are all organic based matter. All three components decompose below 300°C [86, 141]. Properties of these major components are shown in Table 31 below.
Table 31Chemical properties of hemicellulose, cellulose and lignin [141].
Hemicellulose Cellulose LigninDecomposition temperature °C
200-250 240-350 280-500
Monomer Mixed sugars Glucose PhenolPolymer morphology Amorphous Crystalline +
amorphousMacromolecule
35
Figure 12. Structure of sewage sludge derived biochar pyrolyzed at 500 °C at 600x and 2000x magnification [135].

As cellulose and hemicellulose break down thermally in a reactor, they decompose into solid char, vapours, and gases [142]. Pyrolysis of lignin produces methoxy-substituted phenols which are a constituent of bio-oils [142]. Slow pyrolysis yields high quality charcoal at low temperatures. However, the residence time of the feedstock can be 5 to 30 minutes and the bio-oil quality is low [23]. The long residence time of the feedstock within the reactor results in a further reduction of the bio-oil quality. This issue can be resolved by designing a more efficient heat exchanger that is able to provide high heat transfer values which reduce the residence time of the feedstock. This will not only reduce the energy consumption of the process, but may also produce higher quality bio-oil [23].
5.2.1 Proximate and ultimate analysis Experimental studies that conduct pyrolysis carry out proximate and ultimate analyses of the feedstock used. This enables possible correlations to be made with the products formed due to pyrolysis. The results of these analyses are shown in Tables 32 and 33.
Table 32Proximate analysis of various wood and garden materials [143-145].Material Fixed carbon
(%)Moisture (%) Volatile
matter (%)Ash (%) HHV
(MJ/kg)Paulownia wood
20.64 6.50 71.80 1.06 -
Coconut fibre 11.10 - 80.85 8.05 19.23Pine wood 13.15 - 85.45 1.40 19.83Wood cellulose 9.76 5.11 79.04 6.09 -Matter from recycled paper (without deinking)
1.60 4.17 58.03 35.20 -
Newspaper 8.13 1.02 51.17 40.70 -Paper not recycled previously
1.05 6.80 51.92 39.64 -
Most wood types contain a large amount of volatile matter with a low amount of ash. Processed wood material such as paper contains a large amount of volatile matter but it also contains large amounts of ash material. This behaviour is seen in many materials, some of which are outlined in Table 33.
36

Table 33Ultimate analysis of various discarded wood materials [143-145].
Material Carbon(%) Hydrogen(%) Nitrogen(%) Oxygen(%)Paulownia wood
44.73 6.12 0.87 48.28
Leaves of Flourensia oolepis
45.44 5.71 2.47 38.40
Stems of Flourensia oolepis
45.67 3.26 1.56 42.50
Coconut fibre 47.75 5.61 0.90 45.51Pine wood 48.15 6.70 1.35 43.60
Ultimate analyses of various types of wood, shown in Table 33, indicate that the majority of the elemental composition of wood is carbon and oxygen. This is expected as wood consists of three main components (cellulose, hemicellulose and lignin) which are all primarily composed of carbon and oxygen with other elements but in very low amounts.
5.4.1 SyngasIn-order to show the effect of feedstock on gas yield, Table 34 summarises the experimental results of wood and garden waste pyrolysis.
Table 34A summary of the pyrolysis of various discarded woods.
Biomass Reactor Temperature (°C)
Gas yield (%) Reference
Microcrystalline powder - Cellulose
Tubular reactor
300 5 [145]
Xylan - Hemicellulose
Tubular reactor
300 13 [145]
Lignin - Brown powder
Tubular reactor
300 9 [145]
Lignin Wire mesh reactor
325 9 [146]
Zhao et al. [145] conducted a pyrolysis experiment on the three major constituents of wood-based material separately. Their results have shown that the bio-gas yield increases significantly for hemicellulose between temperatures of 300 to 400°C. The reason for this was linked to the fact that hemicellulose contains weak bond strengths in its chemical structure, thus, it is able to degrade to micro-molecular volatiles (non-condensable gases). Pyrolysis of cellulose leads to bio-gas yield increasing almost linearly with temperature increase. Bio-gas yield of lignin pyrolysis was almost constant with increasing temperature. These results are shown in Figure 13.
37

Figure 13. Pyrolysis bio-gas yield of cellulose, hemicellulose and lignin with increasing temperature [145]. An experiment carried out by Yu et al. [146] on pure cellulose, hemicellulose and lignin has shown that thermal degradation of all samples takes place below 300°C. However, the rate of mass loss varies depending on the sample. The results are shown in Figure 14. Xylan (hemicellulose) begins thermal degradation at temperature just above 200°C which is much earlier than the other two components and at a very high rate. However, thermal degradation of cellulose begins at temperature just above 300°C. The reason for this behaviour is predominantly dependent on the molecular bonding of the components. Cellulose consists of strong intermolecular bonding, whereas xylan consists of weaker bonding.
Fig 14. Weight and mass loss rate curves for cellulose, xylan and lignin [146].
38

Whilst Figure 14 shows that bio-gas yield may not increase above 50% at a temperature of 700°C, Figure 15 below shows that bio-gas yield is dominant, reaching approximately 70% at 300°C when leaves are used as feedstock. This clearly shows that even though garden and wood based material may have similar elemental composition, the yield distribution can vary drastically.
Figure 15. Yield distribution of Flourensia oolepis (FO) leaves pyrolysis. Gas yield increases with temperature, whereas solid yield decreases [72].
5.4.2 Bio-oil Zhao et al. [145] conducted an experiment on volatile production from the pyrolysis of cellulose, hemicellulose and lignin. Their results have shown that the bio-oil produced was highly dependent on the component pyrolysed. Pyrolysis of cellulose has formed saccharides, furans and ketones in terms of bio-oil. On the other hand, pyrolysis of hemicellulose has formed acids and ketones as the main ingredients. The major ingredient from the pyrolysis of lignin is phenols [145]. The percentage yield of bio-oil at 300°C of the three main components of wood material is shown in Table 35. Pyrolysis of hemicellulose produces 30% which is the highest bio-oil yield out of the three components, whereas lignin produces the least at 18%. The reason for this is due to the molecular bonding present in each of the components.
Table 35A summary of pyrolysis of various wood and garden materials.
Biomass Reactor Temperature (°C)
Bio-oil yield (%)
Reference
Microcrystalline powder - Cellulose
Tubular reactor
300 25 [145]
Xylan - Tubular 300 30 [145]
39

Hemicellulose reactorLignin - Brown powder
Tubular reactor
300 18 [145]
Lignin Wire mesh reactor
325 9 [146]
Figure 16. Bio-oil yields derived from the pyrolysis of cellulose, hemicellulose and lignin with increasing temperature [145].
There is a clear trend in the bio-oil yield produced with increasing temperature for cellulose. At 500°C, cellulose produces the largest amount of bio-oil and this amount decreases with further increase in temperature. Bio-oil yields for hemicellulose and lignin both have an almost constant yield at temperatures above 400°C. These trends can be clearly seen in Figure 16 above. 5.4.3 Biochar As mentioned earlier, cellulose is composed of glucose molecules linked to each other by glycosidic bonds and when pyrolyzed they produce bio-char [108]. The stoichiometric equation for charcoal production is
C6H10O5 => 3.74C + 2.65H2O + 1.17CO2 + 1.08CH4 [108]
5.4.3.1 Influence of treatment time on biochar yield The biochars from wood and food are very similar, as both materials consist of hemicelluloses, cellulose and lignin [70, 148]. The biggest difference between wood and garden biochar and food biochar is that the pore distribution of wood and garden biochar is wider. Wood and garden biochar pores consist of naturally occurring micro- and macropores, which are already occurring in the natural biomass structure [76, 149-150]. The pore distribution can be seen in Figure 17, where the pore structures of wood and manure biochar
40

are being compared. The wood biochar has more clearly defined and distributed pores, as both micro- and macropores are present. Increasing the treatment time negatively influences the biochar yield, resulting in biochar decreases of 2% - 45% [61, 72]. This can be explained by the mass loss caused by the degradation of natural plant structures [70, 151-154]. Table 36 gives an overview on research papers, where the treatment time has a major influence on the biochar yield. The research study of Ronsse et al. [60] shows a biochar decrease of 45% when the treatment time is increased from 10 minutes to 60 minutes at a treatment time of 300 °C. The biochar decrease can be explained by the degradation of plant structures and evaporation of volatile compounds, including water [155-157]. The heating rate used in the experiment is very high, which may also have caused the large decrease in biochar yield. A longer residence time also influences the biochar characterisation, as more volatile compounds evaporate and some toxic compounds are formed [72, 158-160]. Solar et al.[71] found that with an increased treatment time the biochar yield slightly decreased and the formation of toxic compounds increased. These toxic compounds are known as polycyclic hydrocarbons; they will be discussed in the next section.
Figure 17. On the left, micro- and macro-pores in biochar made from wood and on the right macro-pores in the biochar made of manure [67].
Table 36A summary of the experimental conditions used during the pyrolysis of wood and garden biomass from four different journal articles [60, 72, 160].References J. Solar (2016) F. Ronsse (2013) Y. Lee (2013)Type of reactor Auger reactor Tubular stainless steel Fixed bedReactor size (L) 3 1,36 2,335Type of waste Woody biomass
(Pinus pinaster)Wood and green waste Bagasse, cocopeat,
palm kernel shell and paddy straw
Sample amount 500 g as 0,5 – 2 mm particles
70 – 135 g as 2 mm – 15 mm particles
100 – 400 g as 1 – 2 cm particles
Treatment time(minutes)
32, 64 10, 60 60
Heating rate (°C /min)
- 17 10
41

Treatment temperature (°C)
300 – 750300 – 900900
300, 450, 600, 750 500
Pressure Atmospheric Atmospheric Nitrogen atmosphereBiochar yield with longer residencetime
Increasing the treatment time with 32 min results in a biochar yield decrease of 1,8% (30,7% to 28,9%).
Increasing the treatment time with 50 min results in a biochar yield decrease of 46,1% (89,8% to 43,7%).
-
Table 37 is a summary of the biochar characteristics of discarded green biochar made during two different pyrolysis treatment times. During a longer treatment time, the volatile matter decreases (~25%), while the total amount of fixed carbon increases (~25%). These characterisations result in a very stable biochar, with a better resistance to aerobic and anaerobic degradation. This type of biochar is favoured for soil management and water treatment as the overall characteristics are better [66, 69, 72, 162]. A longer treatment time has the same effect on the wood biochar characteristics as it has on the characteristics of food biochar.
Table 37 The biochar characteristics of green matter biochar made during pyrolysis at two different HTT and residence times cited from Ronsse et al. [60].
Biomass material and HTT
Residence time (min)
Volatile matter (wt%)
Fixed carbon (wt%)
Fixed carbon yield (wt%)
Ash content (wt%)
Total C content (wt%)
Total H content (wt%)
Green waste
300 °C
10 74.3 25.7 25.3 3.6 53.2 6.260 48.6 51.4 25.0 6.8 69.3 5.4
450 °C
10 25.3 74.7 23.4 11.1 78.8 4.260 18.5 81.5 22.7 12.0 82.9 3.5
5.4.3.2 Influence of temperature on biochar yield The influence of temperature on the yield of biochar is more significant than that of treatment time, as higher temperatures increase the degradation of natural plant structures [157, 163]. Figure 4, section 5.1.4.2. shows the effect of temperature on the biochar yield of food biomass and garden material biomass. As can be seen in the figure, the effect of temperature is almost the same for wood and garden biomass and food biomass, since both showed a great decrease in biochar yield (~70%). Table 38 summarizes the biochar characteristics found from biochar made at different temperatures. When comparing the characteristics of the wood biochar with the characteristics of food biochar, they were very alike. The only difference is that the pH of wood biochar is higher at a very high HTT. Since the H/C ratio of wood biochar decreases during an increase in HTT, the biochar structure becomes more graphitic. This increases the surface area, as the naturally occurring pores degrade due to the high temperature. This
42

decreases the number of natural occurring pores, but results in bigger pores since multiple pores degrade and form one bigger pore [61, 72, 76].
Table 38 The effect of treatment temperature on the biochar characteristics as found by F. Ronsse et al. [60].Temperature (°C)
Time (min)
pH in solution
C (wt.%) H (wt.%) H/C ratio
Higher heating value (MJ/kg)
30010
7.4 53.2 6.2 1.41 -450 9.6 78.8 4.2 0.63 27.5600 10.4 87.7 2.3 0.32 27.9750 11.4 87.5 1.5 0.21 -
To form the most stable biochar and yet have a high biochar yield, the pyrolytic reaction must be carried out at low temperature and long treatment time.
6. Pollutant emissions During pyrolysis of biomass, it is inevitable that (harmful) pollution is formed. This can be in the form of smaller carbon compounds such as CO2 and CH4, but also as bigger, more toxic compounds such as PAH and dioxins [160, 164-166]. Smaller carbon compounds are always present during combustion reactions, even when there is an absence of air. During the full combustion of wood biomass, CO2 and H2O are the main products formed, besides heat. However, full combustion is very hard to achieve as some biomass is not completely combusted to produce CO2. This results in the formation of products such as smaller particles (CO and NO2), bigger carbon compounds (benzene, toluene, styrene etc.) and polyaromatic hydrocarbons [166]. Exposure to such gases poses a danger to human health; it is important to treat these pollutants if they are formed [168-170]. Solar et al.[71] analysed the composition of the liquid and gas yield during the pyrolysis of woody biomass. The pyrolysis was performed during different temperature programmes, which gives an overview of the effect of temperature and treatment time on the pollutant emissions during pyrolysis. Tables 39 and 40 present the Gas Chromatography/Mass Spectrometry composition of liquid and syngas yield, respectively, formed during pyrolysis. The toxic compounds are shown in bold. As the treatment temperature is higher (constantly 750 °C instead of a set temperature programme), the formation of toxic compounds is also higher with ~5% for naphthalene, 6% for anthracene, respectively. When the treatment time is increased, the formation of phenol and naphthalene increases by approximately 2%, while the yield of anthracene decreases by 4%. As treatment time and treatment temperature increase, the amount of toxic compounds in the liquid phase of pyrolysis decreases. This can be explained by the fact that some of these compounds evaporate at higher temperatures, which decreases the amount of toxic compounds in the liquids and increases the amount of toxic compounds in the gas fraction [72, 169, 171-172].Table 39
43
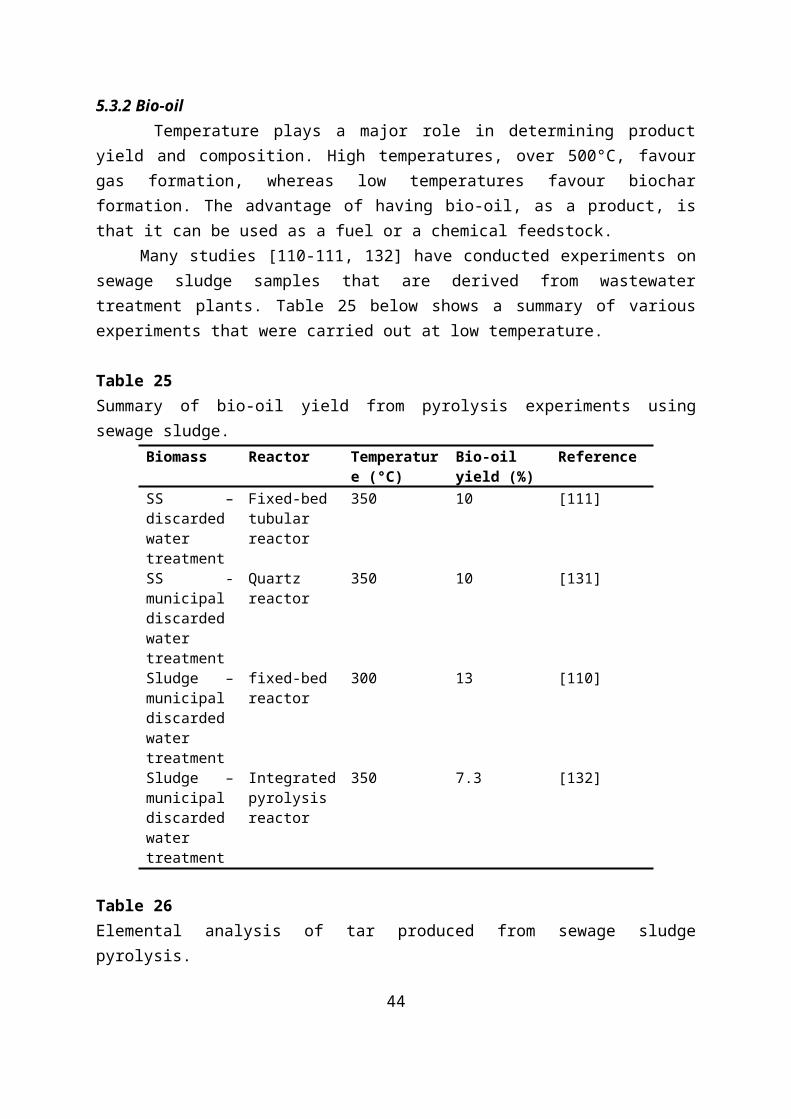
The GC/MS analysis by percentage for pyrolysis liquid yields during pyrolysis of wood biochar, as found by Solar et al. [71]. The toxic compounds are in bold.Temperature profile (°C)
300 – 750 750 350-750 750
Treatment time (min) 32 32 64 64
Water 17.4 22.1 19.3 45.3Phenol 6.7 - 8.7 -Naphthalene 18.4 23.2 19.4 -Naphthalene, 2-methyl-
7.6 - 10.3 -
Biphenylene 8.2 6.1 8.9 -Fluorene 4.9 1.2 4.3 -Anthracene 16.9 22.1 12.1 6.8Butylated hydroxytoluene
9.7 19.2 6.6 42.5
Minor compounds 9.0 6.1 10.1 3.9Amount of toxic compounds
49.6 45.3 50.5 6.8
Table 40The GC/MS analysis, in percentage by volume, for pyrolysis gas yields during pyrolysis of wood biochar, as found by Solar et al. [71].Temperature profile (°C)
300 – 750 750 350-750 750
Treatment time (min) 32 32 64 64H2 37.24 47.52 34.91 50.46CO 23.77 35.05 21.94 34.67CO2 19.14 8.63 22.52 8.59Methane 17.13 8.54 17.38 6.25Ethane 0.42 0.05 0.43 0.00Ethylene 2.30 0.21 2.62 0.03
Increasing the treatment temperature has a negative effect on the gas composition, as the amount of CO and H2 gas increases and the amount of CO2 decreases. Since CO can be very harmful for human and animal health, the production of this gas should be as low as possible [173-174]. Increasing the treatment time has the same effect but to a lesser extent. In order to produce the least harmful compounds, a treatment temperature of 300 °C and a shorter treatment time is favoured. Several studies on biochar yield have shown that pyrolysis at 300 °C or below is favoured in order to have a high biochar yield [56, 61, 63, 72-75]. Another reason why a treatment temperature of 300 °C or lower is preferred is due to the low pollutant concentrations in the flue gas [6]. Polycyclic aromatic hydrocarbons (PAH) are naturally occurring toxic compounds that are formed during the incomplete combustion of organic matter [103, 159, 172, 175-176]. PAHs pose a risk to human health, as exposure to PAHs can lead to cancer, cardiovascular disease and decreased development of growth, immune function and IQ [164,
44

177]. The most common PAH is naphthalene; the structure of naphthalene and its resonance structures are shown in Figure 18.
Figure 18. The structure of naphthalene and its resonance structures [177].
PAHs can be formed by two fundamental reaction mechanisms, where temperature plays a very important role. The first mechanism is during very high temperature pyrolysis (>500 °C). Due to the high temperature, naturally occurring structures degrade, causing cracks in the structure. These cracks release volatile gaseous hydrocarbon radicals. These radicals undergo a chain reaction (propagation and termination), forming large polyaromatic ring structures [171, 179-180]. The second mechanism is performed during lower temperature pyrolysis (<600 °C) and consists of condensation, carbonization and aromatization of biochar. McBeath et al. [180] showed, using 13C-NMR analysis, that low temperature pyrolysis results in PAHs with a maximum of 7 rings [180]. Generally the amount of PAHs formed increases with higher treatment times and HTT, with a maximum of PAHs formed at 500 °C during slow pyrolysis [160, 171, 182]. Most PAHs are insoluble in water, since they are non-polar and lipophilic. Especially bigger PAHs do not dissolve in water as the aqueous solubility decreases logarithmically as the molecular mass increases. Smaller PAH compounds, such as two- and three ring PAHs can dissolve in water, making them more dangerous to humans and animals as the change of biological uptake increases [183-184]. Pyrolysis performed at 700 °C or higher produces a large amount of polyaromatic PAHs. Between 350 °C and 600 °C, the quantities of PAHs formed are less and the PAHs formed have smaller structures (fewer carbon rings). Only when the pyrolysis is performed at 300 °C or below, the amount of PAHs formed is very low and almost not present. Research by McGrath et al. [179] showed that the formation of 4 – 6 ring PAHs does not occur under temperatures of 350 °C, these results can be seen in Figure 19.When the pyrolysis products are used for environmental management or could get in contact with environment, animals or humans, the pyrolysis temperature should stay below 300 °C [158, 164, 177, 185].
Dioxins are other toxic compounds that are formed during pyrolysis. They are harder to deal with, because the formation temperature of dioxins is between 300 °C and 800 °C [166, 186-188]. Dioxins are highly toxic organic pollutants. They also occur during the incineration of biomass, but are also by-products of some industrial processes. As dioxins can cause reproductive and developmental problems, damage to the immune system, interfere with hormones and cause cancer, it is important to make sure no dioxins are formed during the pyrolysis. The dioxin formation occurs at a maximum rate at approximately 325 °C, but in order to form dioxins, chloride has to be present [187]. Dioxins are made during two general mechanisms [158, 185, 189]:
45

- Between 300 °C and 600 °C, the dioxins are formed in the gas phase during the polycondensation of chlorine containing polyphenols, benzenes and phenyls.
- Between 200 and 400 °C, the dioxins are formed by the novo formation, with the maximum reaction speed at 300 °C. The novo reaction requires an oxygen-rich atmosphere, chlorine and copper in order to form dioxins. Since pyrolysis is performed in the absence of oxygen, the formation of dioxins through this mechanism will not occur as long as the pyrolysis temperature stays below 300 °C [190, 191].
46
Figure 19. The effect of treatment temperature on the formation of 4 – 6 ring PAHs, where the maximum PAH yield is found at 500-550 °C and the minimum PAH yield is found at T < 350 °C, as found by McGrath et al. [179].

7. Current uses of pyrolytic products and operating conditions As pyrolysis has three high value products (bio-oil, syngas and biochar), these can be used in many different ways. An overview of product applications is given in Figure 20.
Syngas can be used to produce heat, as seen in Figure 20. Since biogas gives a very clean, blue flame, it can potentially be combusted to provide heat for domestic hot water [192-193]. Syngas can be converted into electricity by the use of heat engines such as gas turbines and combustion engines. As the production of syngas electricity reduces the amount of greenhouse emissions and uses renewable and sustainable energy sources, syngas may be a solution for the scarcity of fossil fuels [191]. The disadvantages of big syngas conversion plants are that they require highly complex designs, constructions, operation and maintenance and that the capital costs are very high [192, 194-196]. Pyrolysis liquids, bio-oil, can be used for many purposes. The interest of using bio-oil as a fuel has been growing over the last couple of decades since it can be considered CO 2 neutral and it contains a very low sulphur content when compared with fossil fuels [197-198]. In order to convert bio-oil into a usable fuel, it has to be upgraded. This requires deoxygenation. Likewise, the bio-oil can be combined with fossil fuel in order to form a stable emulsion. Bio-oil can play an important role in the green chemistry, as numerous polymers are available from biomass and bio-oil [163, 199-201]. Biochar has numerous purposes; it can be used for environmental management, but also for health and cosmetic purposes. When biochar is chemically activated, it enhances its absorption properties. This property is often beneficial in shoe polish, shampoo, deodorant and teeth whitener as the material adsorbs bacteria, lipids and moisture [201]. Activated biochar can also be used as a soil conditioner because it has a very high carbon content. As found by Downie et al. [76] biochar can provide benefits to soils with: Low pH, low nutrient holding capacity, low water holding capacity, poor soil aeration and hard setting soils.
47
Fig 20. An overview of possible applications of pyrolysis products.

Besides the usage of biochar as a soil conditioner, it can also be used to purify water because it contains great adsorbing properties [76, 101, 203-205]. Pyrolysis of biomass is already used on industrial scale, mainly to convert biomass into bio-oil. Pyrolysis plants differ in terms of reactor designs as discussed in section 3, e.g. (circulating) fluidized bed, rotary kiln reactor and vacuum reactors are being used [158]. The plants use dried biomass, meaning that the volatile content is low and pyrolysis time is shorter since the amount of volatile compounds is low. The biomass treatment plants can be found in different countries, where Canada converts the most biomass a day (~105 tons) into various forms of energy. Most of the bigger plants are used to convert biomass into fuel, food flavourings and chemicals, while the smaller plants are mainly used for research [159, 206].As there already are many applications of pyrolysis products, the market keeps growing especially with rising crude oil prices. However, much more research is needed in order to produce and optimize pyrolysis processes to form products that have high heating values which can be used as fuel or chemical feedstock for other processes. Jouhara et al. [206] carried out a study on mixed household waste treatment, using a heat pipe based pyrolysis reactor at a maximum temperature of 300°C. The apparatus of this experiment is called Home Energy Recovery Unit (HERU) and it is designed to treat domestic waste. This energy recovery unit consists of three stages: moisture removal, pyrolysis and gasification. The results of this study have shown that the biochar formed contains metals such as calcium, iron, copper, potassium, bromine, strontium, zinc, sulphur and phosphorus. The bio-oil phase contains metals such as calcium, iron and copper. Various other chemical analyses, such as XRD, XRF, FTIR and GC/MS were conducted on the biochar and bio-oil formed and the study concluded that there were no toxic elements found within the liquid and solid products. Yield values of 5, 20 and 75% were obtained for oil, syngas and biochar, respectively. This research study focused on the chemical analysis of the products, as well as power consumption and CO2 emissions. Carbon footprint of 0.0782 kg CO2e was reported based on dry material and 0.3873 kg CO2e on wet basis. These emission values are lower than the UK government’s CO2 emissions factor of 0.41205 in 2016. This shows a low environmental impact of such process whilst also producing valuable products. The bio-oil was obtained at three different times, showing a progressive colour darkening due to the decreasing moisture levels as the experiment proceeded. The syngas produced from pyrolysis of in HERU is combusted after pyrolysis has taken place. The heat released is used to heat water in a boiler. This provides domestic hot water from discarded materials. The biochar produced has many applications as it can be used in water filters and soil management. The HERU is the only energy recovery unit that is being developed to treat household discarded materials at low temperature.
48
8. Economic benefits of pyrolysis As pyrolysis uses discarded materials to produce high energy products, the economic potential of such process can be significant. Pyrolysis of plastics in particular is more economically attractive because plastics are derived from hydrocarbons and their energy content is significantly higher than other discarded materials such as garden, food or sewage. A report conducted by the American Chemistry Council [207] on pyrolysis of plastics, has shown that a conversion technology such as pyrolysis creates job opportunities, contributes to sustainable development and can also add billions of dollars to the economy. The report focuses on industrial plastic-to-oil conversion methods. However, the core principles are the same for domestic use and the results could provide possible indications of the effect of pyrolysis at domestic level. For the U.S. alone, over 90,000 jobs can be created and an addition of over $5 billion dollars could be added into the economy, whilst reducing waste that is going to landfill sites [207]. Several studies have considered the costs associated with pyrolysis systems. Some studies used the break-even costs of electricity, while others have used the break-even costs of bio-oil, biochar and/or carbon credits. The specific parameter used by the researchers was determined depending on their product of interest. Table 41 shows economic studies of slow and fast pyrolysis. The studies showcase their results using different parameters.
Table 41Economic studies of pyrolysis.Reference Pyrolysis
typeScale Capital cost Biomass
priceResults
Peacocke et al. [208]
Fast Small 9,000 $/t/h 70 $/t Break-even electricity price: 0.15 $/kWh
Brown et al. [209]
Fast Large $110 million 83 $/t Internal Rate of Return (IRR) = 15%
The economic study conducted by Peacocke et al. [208] on small scale pyrolysis result in a break-even electricity price of 0.15 $/kWh. This is a low value and may be achievable in some countries where electricity prices are low. However, it does require a high capital cost. As expected, large scale reactors would require large investments and based on the study carried out by Brown et al. [209], the internal rate of return (IRR) is 15% which is also economically attractive to investors, but the study does not indicate how many years it will take to achieve this. The studies mentioned in table 41 were based on high temperature pyrolysis. In literature, there is no economic evaluation of low temperature pyrolysis. However, high temperature pyrolysis gives an indication that low temperature pyrolysis may have a good economic potential but further research is required for conclusive evidence.
49

9. Conclusion and future outlook Pyrolysis is a thermochemical process which converts discarded material in the absence of oxygen into more useful and high value products. These products are in the form of combustible gases, bio-oil and biochar. The ability to convert any material ultimately depends on the operational temperature of the pyrolysis process as well as on the feedstock used.Almost all of the current literature and applications of pyrolysis focus on high temperature and ground feedstock. Pyrolysis at high temperature is desirable due to the enhanced yield of gaseous compounds and biochar, which contain high higher heating values. Those operating parameters, though, make most pyrolytic processes economically unviable, dangerous and they can also produce highly toxic gases which require treatment before they can be vented to the atmosphere. Pyrolysis heating rate plays a major role in the formation of the products but most heat sources are oven or microwave based. These types of heat sources do not have uniform temperature distributions throughout the reactors. This leads some of the feedstock to thermally degrade under slightly different conditions, thus affecting the results. Viable amounts of syngas, bio-oil and biochar can be produced with significant HHV at 300°C. One of the more noticeable effects of low temperature pyrolysis is the production of lower amounts of toxic gases, which is highly attractive. This provides an excellent opportunity for further development and research so that low temperature pyrolysis can be used at domestic scale with the least risks. Operation of pyrolysis reactions at low temperatures has not been considered in most experimental research studies but results were extracted and analysed from articles where low temperature findings were published. The HERU (Home Energy Recovery Unit) is the only low temperature pyrolysis process that processes resources such as plastic, food, sewage and garden matter, converting them into energy with the little environmental effect. The HERU provides a promising solution to our global growing issue of discarding valuable resources. This paper has provided an extensive review on the current state of the art of the characteristics of products derived from the pyrolysis of municipal solid waste with particular attention on low temperature process. However, comprehensive research is required in order to form conclusive evidence on the economic viability of low temperature pyrolysis as this has not been addressed previously.
Acknowledgment
This paper was conducted as part of the “Design Optimisation of the HERU Waste Treatment System” project that was funded by Manik Ventures Limited.
References[1] Das O, Sarmah AK. The love-hate relationship of pyrolysis biochar and water: A
perspective. Sci Total Environ 2015;512–513:682–5. doi:10.1016/j.scitotenv.2015.01.061.
[2] Srinivasan P, Sarmah AK, Smernik R, Das O, Farid M, Gao W. A feasibility study of agricultural and sewage biomass as biochar, bioenergy and biocomposite feedstock: Production, characterization and potential applications. Sci Total Environ 2015;512–
50

513:495–505. doi:10.1016/j.scitotenv.2015.01.068.[3] Kayakutlu G, Daim T, Kunt M, Altay A, Suharto Y. Scenarios for regional waste
management. Renew Sustain Energy Rev 2017;74:1323–35. doi:10.1016/j.rser.2016.11.147.
[4] DEFRA. UK statistics on waste. 2016.[5] DEFRA. Digest of Waste and Resource Statistics – 2015 Edition. 2015.[6] Czajczyńska D, Anguilano L, Ghazal H, Krzyżyńska R, Reynolds AJ, Spencer N, et al.
Potential of pyrolysis processes in the waste management sector. Therm Sci Eng Prog 2017;3:171–97. doi:10.1016/j.tsep.2017.06.003.
[7] Santibañez-Aguilar JE, Flores-Tlacuahuac A, Rivera-Toledo M, Ponce-Ortega JM. Dynamic optimization for the planning of a waste management system involving multiple cities. J Clean Prod 2017;165:190–203. doi:10.1016/j.jclepro.2017.07.063.
[8] Jouhara H, Czajczyńska D, Ghazal H, Krzyżyńska R, Anguilano L, Reynolds AJ, et al. Municipal waste management systems for domestic use. Energy 2017;139:485–506. doi:10.1016/j.energy.2017.07.162.
[9] DEFRA. Advanced Thermal Treatment of Municipal Solid Waste. 2013.[10] Chen D, Yin L, Wang H. Pyrolysis technologies for municipal solid waste. Waste
Manag 2014;34:25–34.[11] Saffarzadeh A, Shimaoka T, Motomura Y, Watanabe K. Chemical and mineralogical
evaluation of slag products derived from the pyrolysis/melting treatment of MSW. Waste Manag 2006;26:1443–52. doi:10.1016/j.wasman.2005.12.005.
[12] Frassoldati A, Migliavacca G, Crippa T, Velata F, Faravelli T, Ranzi E. Detailed kinetic modeling of thermal degradation of biomasses. 29th Meet Combust 2006:1–6.
[13] Thornley P, Upham P, Huang Y, Rezvani S, Brammer J, Rogers J. Integrated assessment of bioelectricity technology options. Energy Policy 2009;37:890–903. doi:10.1016/j.enpol.2008.10.032.
[14] Pei-dong Z, Guomei J, Gang W. Contribution to emission reduction of CO2 and SO2 by household biogas construction in rural China. Renew Sustain Energy Rev 2007;11:1903–12. doi:10.1016/j.rser.2005.11.009.
[15] Schaefer W. Disposing of solid wastes by pyrolysis. Environ Sci Technol 1975;9.[16] Malkow T. Novel and innovative pyrolysis and gasification technologies for energy
efficient and environmentally sound MSW disposal. Waste Manag 2004;24:53–79. doi:10.1016/S0956-053X(03)00038-2.
[17] Fisher T, Hajaligol M, Waymack B, Kellogg D. Pyrolysis behavior and kinetics of biomass derived materials. J Anal Appl Pyrolysis 2002;62:331–49. doi:10.1016/S0165-2370(01)00129-2.
[18] Jahirul MI, Rasul MG, Chowdhury AA, Ashwath N. Biofuels production through biomass pyrolysis- A technological review. Energies 2012;5:4952–5001. doi:10.3390/en5124952.
[19] Winsley P. Biochar and bioenergy production for climate change mitigation. New Zeal Sci Rev 2007;12:64.
[20] Ahmad I, Khan M, Khan H, Ishaq M, Tariq R, Gul K. Pyrolysis study of polypropylene and polyethylene into premium oil products. Energy Convers Manag 2014;12:663–71.
[21] Sarker M, Kabir A, Rashid M, Molla M, Mohammad A. Waste polyethylene terephthalate (PETE-1) conversion into liquid fuel. J Fundam Renew Energy Appl 2011;1:1–5.
[22] Widiyannita A, Cahyono R, Budiman A, Sutijan A. Study of pyrolysis of ulin. Jounal of Pyrolysis 2016;8:27–48.
51

[23] Zaman C, Pal K, Yehye W, Sagadevan S, Shah S, Adebisi G, et al. A Sustainable Way to Generate Energy from Waste. Pyrolysis 2017:3–34. doi:http://dx.doi.org/10.5772/intechopen.69036 DO.
[24] Di Blasi C. Kinetic and Heat Transfer Control in the Slow and Flash Pyrolysis of Solids. Ind Eng Chem Res 1996;35:37–46. doi:10.1021/ie950243d.
[25] Wu CH, Chang CY, Tseng CH. Pyrolysis products of uncoated printing and writing paper of MSW. Fuel 2002;81:719–25. doi:10.1016/S0016-2361(01)00180-6.
[26] Miskolczi N, Ates F, Borsodi N. Comparison of real waste (MSW and MPW) pyrolysis in batch reactor over different catalysts. Part II: Contaminants, char and pyrolysis oil properties. Bioresour Technol 2013;144:370–9. doi:10.1016/j.biortech.2013.06.109.
[27] Zheng J, Jin Y, Chi Y, Wen J, Jiang X, Ni M. Pyrolysis characteristics of organic components of municipal solid waste at high heating rates. Waste Manag 2009;29:1089–94. doi:10.1016/j.wasman.2008.06.034.
[28] Luo S, Xiao B, Hu Z, Liu S. Effect of particle size on pyrolysis of single-component municipal solid waste in fixed bed reactor. Int J Hydrogen Energy 2010;35:93–7. doi:10.1016/j.ijhydene.2009.10.048.
[29] Islam MN, Islam MN, Beg MRA. The fuel properties of pyrolysis liquid derived from urban solid wastes in Bangladesh. Bioresour Technol 2004;92:181–6. doi:10.1016/j.biortech.2003.08.009.
[30] Williams PT, Williams EA. Interaction of Plastics in Mixed-Plastics Pyrolysis. Energy & Fuels 1999;13:188–96. doi:10.1021/ef980163x.
[31] He F, Yi W, Bai X. Investigation on caloric requirement of biomass pyrolysis using TG-DSC analyzer. Energy Convers Manag 2006;47:2461–9. doi:10.1016/j.enconman.2005.11.011.
[32] Sorum L, Gronli MG, Hustad JE. Pyrolysis characteristics and kinetics of municipal solid wastes. Fuel 2001;80:1217–27. doi:10.1016/S0016-2361(00)00218-0.
[33] Grycová B, Koutník I, Pryszcz A. Pyrolysis process for the treatment of food waste. Bioresour Technol 2016;218:1203–7. doi:10.1016/j.biortech.2016.07.064.
[34] PlasticsEurope. Plastics. Facts 2016 2016.[35] Homagain K, Shahi C, Luckai N, Sharma M. Biochar-based bioenergy and its
environmental impact in Northwestern Ontario Canada: A review. J For Res 2014;25:737–48. doi:10.1007/s11676-014-0522-6.
[36] Yan W, Shuting Z, Yufeng Z, Hui X, Na D, Guanyi C. Experimental studies on low-temperature pyrolysis of municipal household garbage - Temperature influence on pyrolysis product distribution. Renew Energy 2005;30:1133–42. doi:10.1016/j.renene.2004.09.016.
[37] Sharuddin A, Abnisa F, Wan D, Aroua M. A review on pyrolysis of plastic wastes. Energy Convers Manag 2016;115:308–26. doi:10.1016/J.ENCONMAN.2016.02.037.
[38] Williams PT, Williams EA. Fluidised bed pyrolysis of low density polyethylene to produce petrochemical feedstock. J Anal Appl Pyrolysis 1999;51:107–26. doi:10.1016/S0165-2370(99)00011-X.
[39] Marculescu C, Antonini G, Badea A, Apostol T. Pilot installation for the thermo-chemical characterisation of solid wastes. Waste Manag 2007;27:367–74. doi:10.1016/j.wasman.2006.02.011.
[40] Li A, Li X, Li S, Yan J, Cen K. Experiment on manufacture medium heating value fuel gas by pyrolyzing municipal refuse in a rotary kiln. J Chem Ind Eng 1999;50:101–7.
[41] Li AM, Li SQ, Yan JH, Ren Y, Li XD, Chi Y, et al. Analysis of products from organic waste pyrolysis in a rotary kiln. Prog Nat Sci 1999;9:1023–31.
52

[42] Li S, Li A, Ren Y, Yan J, Li X, Chi Y, et al. Pyrolysis of the biomass in a rotary kiln II: Impacts of final pyrolysis temperature on product properties. Acta Energiae Solaris Sin 2000;21:341–8.
[43] Font R, Marcilla A, Garcia AN, Caballero JA, Conesa JA. Kinetic models for the thermal degradation of heterogeneous materials. J Anal Appl Pyrolysis 1995;32:29–39. doi:10.1016/0165-2370(94)00834-N.
[44] Font R, Marcilla A, Garcia AN, Caballero JA, Conesa JA. Comparison between the pyrolysis products obtained from different organic wastes at high temperatures. J Anal Appl Pyrolysis 1995;32:41–9. doi:10.1016/0165-2370(94)00835-O.
[45] García AN, Font R, Marcilla A. Kinetic study of the flash pyrolysis of municipal solid waste in a fluidized bed reactor at high temperature. J Anal Appl Pyrolysis 1995;31:101–21. doi:10.1016/0165-2370(94)00816-J.
[46] Garcia AN, Font R, Marcilla A. Gas Production by Pyrolysis of Municipal Solid Waste at High Temperature in a Fluidized Bed Reactor. Energy and Fuels 1995;9:648–58.
[47] Velghe I, Carleer R, Yperman J, Schreurs S. Study of the pyrolysis of municipal solid waste for the production of valuable products. J Anal Appl Pyrolysis 2011;92:366–75. doi:10.1016/j.jaap.2011.07.011.
[48] Vyazovkin S, Burnham AK, Criado JM, Pérez-Maqueda LA, Popescu C, Sbirrazzuoli N. ICTAC Kinetics Committee recommendations for performing kinetic computations on thermal analysis data. Thermochim Acta 2011;520:1–19. doi:10.1016/j.tca.2011.03.034.
[49] Vyazovkin S, Chrissafis K, Di Lorenzo ML, Koga N, Pijolat M, Roduit B, et al. ICTAC Kinetics Committee recommendations for collecting experimental thermal analysis data for kinetic computations. Thermochim Acta 2014;590:1–23. doi:10.1016/j.tca.2014.05.036.
[50] Du Y, Jiang X, Lv G, Ma X, Jin Y, Wang F, et al. Thermal behavior and kinetics of bio-ferment residue/coal blends during co-pyrolysis. Energy Convers Manag 2014;88:459–63. doi:10.1016/j.enconman.2014.08.068.
[51] Chen J, Wang Y, Lang X, Ren X, Fan S. Evaluation of agricultural residues pyrolysis under non-isothermal conditions: Thermal behaviors, kinetics, and thermodynamics. Bioresour Technol 2017;241:340–8. doi:10.1016/j.biortech.2017.05.036.
[52] WRAP. Estimates of Food Surplus and Waste Arisings in the UK 2016:1–13.[53] Purevsuren B, Avid B, Gerelmaa T, Davaajav Y, Morgan TJ, Herod AA, et al. The
characterisation of tar from the pyrolysis of animal bones. Fuel 2004;83:799–805. doi:10.1016/j.fuel.2003.10.011.
[54] Haykiri-Acma H. The role of particle size in the non-isothermal pyrolysis of hazelnut shell. J Anal Appl Pyrolysis 2006;75:211–6. doi:10.1016/j.jaap.2005.06.002.
[55] Lua AC, Yang T. Effect of activation temperature on the textural and chemical properties of potassium hydroxide activated carbon prepared from pistachio-nut shell. J Colloid Interface Sci 2004. doi:10.1016/j.jcis.2003.10.001.
[56] Aguiar L, Márquez-Montesinos F, Gonzalo A, Sánchez JL, Arauzo J. Influence of temperature and particle size on the fixed bed pyrolysis of orange peel residues. J Anal Appl Pyrolysis 2008;83:124–30. doi:10.1016/j.jaap.2008.06.009.
[57] Miranda R, Bustos-Martinez D, Blanco CS, Villarreal MHG, Cantú MER. Pyrolysis of sweet orange (Citrus sinensis) dry peel. J Anal Appl Pyrolysis 2009;86:245–51. doi:10.1016/j.jaap.2009.06.001.
[58] Wu W, Yang M, Feng Q, McGrouther K, Wang H, Lu H, et al. Chemical characterization of rice straw-derived biochar for soil amendment. Biomass and Bioenergy 2012. doi:10.1016/j.biombioe.2012.09.034.
53

[59] Mermoud F, Salvador S, Van de Steene L, Golfier F. Influence of the pyrolysis heating rate on the steam gasification rate of large wood char particles. Fuel 2006. doi:10.1016/j.fuel.2005.12.004.
[60] Ronsse F, van Hecke S, Dickinson D, Prins W. Production and characterization of slow pyrolysis biochar: Influence of feedstock type and pyrolysis conditions. GCB Bioenergy 2013. doi:10.1111/gcbb.12018.
[61] Peng X, Ye LL, Wang CH, Zhou H, Sun B. Author’s personal copy Temperature-and duration-dependent rice straw-derived biochar: Characteristics and its effects on soil properties of an Ultisol in southern China n.d.
[62] Zygourakis K. Effect of Pyrolysis Conditions on the Macropore Structure of Coal-Derived Chars. Energy and Fuels 1993. doi:10.1021/ef00037a007.
[63] Demirbas A. Effects of temperature and particle size on bio-char yield from pyrolysis of agricultural residues. J Anal Appl Pyrolysis 2004. doi:10.1016/j.jaap.2004.07.003.
[64] Ahmad M, Lee SS, Dou X, Mohan D, Sung JK, Yang JE, et al. Effects of pyrolysis temperature on soybean stover- and peanut shell-derived biochar properties and TCE adsorption in water. Bioresour Technol 2012;118:536–44. doi:10.1016/j.biortech.2012.05.042.
[65] Griessacher T, Antrekowitsch J, Steinlechner S. Charcoal from agricultural residues as alternative reducing agent in metal recycling. Biomass and Bioenergy 2012. doi:10.1016/j.biombioe.2011.12.043.
[66] Özçimen D, Ersoy-Meriçboyu A. A study on the carbonization of grapeseed and chestnut shell. Fuel Process Technol 2008;89:1041–6. doi:10.1016/j.fuproc.2008.04.006.
[67] Brewer CE, Brown RCLD a. Biochar characterization and engineering. Grad Teses Diss 2012:12284.
[68] Agirre I, Griessacher T, Rösler G, Antrekowitsch J. Production of charcoal as an alternative reducing agent from agricultural residues using a semi-continuous semi-pilot scale pyrolysis screw reactor. Fuel Process Technol 2013. doi:10.1016/j.fuproc.2012.07.010.
[69] Hernandez-Mena LE, Pécora AAB, Beraldo AL. Slow Pyrolysis of Bamboo Biomass: Analysis of Biochar Properties n.d. doi:10.3303/CET1437020.
[70] Ahmad M, Rajapaksha AU, Lim JE, Zhang M, Bolan N, Mohan D, et al. Biochar as a sorbent for contaminant management in soil and water: A review. Chemosphere 2014;99:19–23. doi:10.1016/j.chemosphere.2013.10.071.
[71] Solar J, de Marco I, Caballero BM, Lopez-Urionabarrenechea A, Rodriguez N, Agirre I, et al. Influence of temperature and residence time in the pyrolysis of woody biomass waste in a continuous screw reactor. Biomass and Bioenergy 2016;95:416–23. doi:10.1016/j.biombioe.2016.07.004.
[72] Silva MP, Moyano EL, Scopel AL. Potential applications of biochar and terpene-enriched bio-oil produced from a semi-arid native Asteraceae. J Anal Appl Pyrolysis 2017. doi:10.1016/j.jaap.2017.06.026.
[73] Özsin G, Pütün AE. Kinetics and evolved gas analysis for pyrolysis of food processing wastes using TGA/MS/FT-IR. Waste Manag 2017. doi:10.1016/j.wasman.2017.03.020.
[74] Yang X, Ma F, Yu H, Zhang X, Chen S. Effects of biopretreatment of corn stover with white-rot fungus on low-temperature pyrolysis products. Bioresour Technol 2011. doi:10.1016/j.biortech.2010.11.021.
[75] Gonz??lez JF, Rom??n S, Encinar JM, Mart??nez G. Pyrolysis of various biomass residues and char utilization for the production of activated carbons. J Anal Appl
54

Pyrolysis 2009;85:134–41. doi:10.1016/j.jaap.2008.11.035.[76] Downie A, Munroe P, Cowie A, Van Zwieten L, Lau DMS. Biochar as a
Geoengineering Climate Solution: Hazard Identification and Risk Management. Crit Rev Environ Sci Technol 2012;42:225–50. doi:10.1080/10643389.2010.507980.
[77] Olabi AG. Hydrogen and Fuel Cell developments: An introduction to the special issue on. The 8th International Conference on Sustainable Energy and Environmental Protection (SEEP 2015), 14 August 2015, Paisley, Scotland, UK. Int J Hydrogen Energy 2016;41:16323–9. doi:10.1016/j.ijhydene.2016.07.235.
[78] Olabi AG. The 3rd international conference on sustainable energy and environmental protection SEEP 2009 - Guest Editor’s Introduction. Energy 2010;35:4508–9. doi:10.1016/j.energy.2010.09.053.
[79] López A, de Marco I, Caballero BM, Laresgoiti MF, Adrados A. Influence of time and temperature on pyrolysis of plastic wastes in a semi-batch reactor. Chem Eng J 2011;173:62–71. doi:10.1016/j.cej.2011.07.037.
[80] Desai S, Galage C. Production and analysis of pyrolysis oil from waste plastic in kolhapur city. Int J Eng Res Gen Sci 2015;3:590–5.
[81] Pinto F, Costa P, Carita I. Effect of plastic waste composition on product yield. J Anal Appl Pyrolysis 1999;51:39–55.
[82] Schmidt M, Torn M, Abiven S, T. Dittmar G, Guggenberger I, Janssens M, et al. Persistence of soil organic matter as an ecosystem property. Nature 2011;478:49–56. doi:10.1038/nature10386.
[83] Shah J, Jan MR, Mabood F. Recovery of value-added products from the catalytic pyrolysis of waste tyre. Energy Convers Manag 2009;50:991–4. doi:10.1016/j.enconman.2008.12.017.
[84] López A, de Marco I, Caballero BM, Laresgoiti MF, Adrados A, Torres A, et al. Pyrolysis of municipal plastic wastes II: Influence of raw material composition under catalytic conditions. Waste Manag 2011;31:1973–83. doi:10.1016/j.wasman.2011.05.021.
[85] Aishwarya KN, Sindhu N. Microwave Assisted Pyrolysis of Plastic Waste. Procedia Technol 2016;25:990–7. doi:10.1016/j.protcy.2016.08.197.
[86] Demirbas M. Characterization of Bio-oils from Spruce wood via Pyrolysis. Energy Sources 2010;16:909–37.
[87] Onwudili JA, Insura N, Williams PT. Composition of products from the pyrolysis of polyethylene and polystyrene in a closed batch reactor: Effects of temperature and residence time. J Anal Appl Pyrolysis 2009. doi:10.1016/j.jaap.2009.07.008.
[88] Jung SH, Cho MH, Kang BS, Kim JS. Pyrolysis of a fraction of waste polypropylene and polyethylene for the recovery of BTX aromatics using a fluidized bed reactor. Fuel Process Technol 2010;91:277–84. doi:10.1016/j.fuproc.2009.10.009.
[89] Donaj PJ, Kaminsky W, Buzeto F, Yang W. Pyrolysis of polyolefins for increasing the yield of monomers’ recovery. Waste Manag 2012;32:840–6. doi:10.1016/j.wasman.2011.10.009.
[90] Abnisa F, Wan D. A review on co-pyrolysis of biomass: An optional technique to obtain a high-grade pyrolysis oil. Energy Convers Manag 2014;87:71–85.
[91] Paradela F, Pinto F, Gulyurtlu I, Cabrita I, Lapa N. Study of the co-pyrolysis of biomass and plastic wastes. Clean Technol Environ Policy 2009;11:115–22. doi:10.1007/s10098-008-0176-1.
[92] Ma S, Lu J, Gao J. Study of the Low Temperature Pyrolysis of PVC. Energy & Fuels 2002;16:338–42. doi:10.1021/ef0101053.
[93] Miandad R, Nizami AS, Rehan M, Barakat MA, Khan MI, Mustafa A, et al. Influence 55

of temperature and reaction time on the conversion of polystyrene waste to pyrolysis liquid oil. Waste Manag 2016;58:250–9. doi:10.1016/j.wasman.2016.09.023.
[94] Tiikma L, Tamvelius H, Luik L. Coprocessing of heavy shale oil with polyethylene waste. J Anal Appl Pyrolysis 2007. doi:10.1016/j.jaap.2006.12.029.
[95] Chang Y, Lai JY, Lee DJ. Thermodynamic parameters for adsorption equilibrium of heavy metals and dyes from wastewaters: Research updated. Bioresour Technol 2016;222:513–6. doi:10.1016/j.biortech.2016.09.125.
[96] Lee KH, Shin DH. Characteristics of liquid product from the pyrolysis of waste plastic mixture at low and high temperatures: Influence of lapse time of reaction. Waste Manag 2007;27:168–76. doi:10.1016/j.wasman.2005.12.017.
[97] Shen J, Wang X-S, Garcia-Perez M, Mourant D, Rhodes MJ, Li C-Z. Effects of particle size on the fast pyrolysis of oil mallee woody biomass. Fuel 2009. doi:10.1016/j.fuel.2009.05.001.
[98] Lei H, Ren S, Julson J. The effects of reaction temperature and time and particle size of corn stover on microwave pyrolysis. Energy and Fuels 2009. doi:10.1021/ef9000264.
[99] Scott DS, Czernik SR, Piskorz J, Radlein DSAG. Fast Pyrolysis of Plastic Wastes. Energy and Fuels 1990;4:407–11. doi:10.1021/ef00022a013.
[100] Asadullah M, Zhang S, Li C-Z. Evaluation of structural features of chars from pyrolysis of biomass of different particle sizes. Fuel Process Technol n.d.;91:877–81. doi:10.1016/j.fuproc.2009.08.008.
[101] Inyang M, Dickenson E. The potential role of biochar in the removal of organic and microbial contaminants from potable and reuse water: A review. Chemosphere 2015;134:232–40. doi:10.1016/j.chemosphere.2015.03.072.
[102] Tan X, Liu Y, Zeng G, Wang X, Hu X, Gu Y, et al. Application of biochar for the removal of pollutants from aqueous solutions. Chemosphere 2015;125:70–85. doi:10.1016/j.chemosphere.2014.12.058.
[103] Kambo HS, Dutta A. A comparative review of biochar and hydrochar in terms of production, physico-chemical properties and applications. Renew Sustain Energy Rev 2015;45:359–78. doi:10.1016/j.rser.2015.01.050.
[104] Council E. Council Directive 75/442/EEC. Waste management. 1975.[105] Eurostat. Sewage sludge production and disposal from urban wastewarer (in dry
substance (d.s.)). 2014.[106] Olajire OA. Optimisation of sewage sludge logistics in wastewater treatment plants
2009.[107] Sánchez ME, Lindao E, Margaleff D, Martínez O, Morán A. Bio-Fuels and Bio-Char
Production from Pyrolysis of Sewage Sludge n.d.[108] A.V. Bridgwater GG. Biomass Pyrolysis Liquids Upgrading and Utilization. England:
Elsevier Applied Science; 2012. doi:10.1007/978-94-011-3844-4.[109] Lin Y, Liao Y, Yu Z, Fang S, Ma X. A study on co-pyrolysis of bagasse and sewage
sludge using TG-FTIR and Py- GC / MS. Energy Convers Manag 2017;151:190–8. doi:10.1016/j.enconman.2017.08.062.
[110] Liu S, Wei M, Qiao Y, Yang Z, Gui B, Yu Y, et al. Release of organic sulfur as sulfur-containing gases during low temperature pyrolysis of sewage sludge. Proc Combust Inst 2015;35:2767–75. doi:10.1016/j.proci.2014.06.055.
[111] Liu T, Guo Y, Peng N, Lang Q, Xia Y, Gai C, et al. Nitrogen transformation among char, tar and gas during pyrolysis of sewage sludge and corresponding hydrochar. J Anal Appl Pyrolysis 2017;126:298–306. doi:10.1016/j.jaap.2017.05.017.
[112] Zhu J, Wan L, Chen H, Zhu Y, Yang L. Pilot Test of Co-pyrolysis Characteristics of 56

Wet Sewage Sludge and Sawdust in an External Heating Moving Bed. Energy Procedia 2017;105:570–5. doi:10.1016/j.egypro.2017.03.358.
[113] Jayaraman K, Gökalp I. Pyrolysis, combustion and gasification characteristics of miscanthus and sewage sludge. Energy Convers Manag 2015;89:83–91. doi:10.1016/j.enconman.2014.09.058.
[114] Kan T, Strezov V, Evans T. Effect of the Heating Rate on the Thermochemical Behavior and Biofuel Properties of Sewage Sludge Pyrolysis. Energy and Fuels 2016;30:1564–70. doi:10.1021/acs.energyfuels.5b02232.
[115] Jiang LB, Yuan XZ, Li H, Chen XH, Xiao ZH, Liang J, et al. Co-pelletization of sewage sludge and biomass: Thermogravimetric analysis and ash deposits. Fuel Process Technol 2016;145:109–15. doi:10.1016/j.fuproc.2016.01.027.
[116] Chan WP, Wang JY. Comprehensive characterisation of sewage sludge for thermochemical conversion processes - Based on Singapore survey. Waste Manag 2016;54:131–42. doi:10.1016/j.wasman.2016.04.038.
[117] Folgueras MB, Alonso M, Folgueras JR. Effect of sludge addition to coal on Na, K and S volatilisation in ashing process and ash fusibility. Fuel Process Technol 2015;138:714–23. doi:http://dx.doi.org/10.1016/j.fuproc.2015.07.013.
[118] Garcia G, Arauzo J, Gonzalo A, Sanchez JL, brego J. Influence of feedstock composition in fluidised bed co-gasification of mixtures of lignite, bituminous coal and sewage sludge. Chem Eng J 2013;222:345–52. doi:10.1016/j.cej.2013.02.073.
[119] Vamvuka D, Sfakiotakis S, Saxioni S. Evaluation of urban wastes as promising co-fuels for energy production – A TG/MS study. Fuel 2015;147:170–83. doi:10.1016/j.fuel.2015.01.070.
[120] Campoy M, Gómez-Barea A, Ollero P, Nilsson S. Gasification of wastes in a pilot fluidized bed gasifier. Fuel Process Technol 2014;121:63–9. doi:10.1016/j.fuproc.2013.12.019.
[121] Seggiani M, Vitolo S, Puccini M, Bellini A. Cogasification of sewage sludge in an updraft gasifier. Fuel 2012;93:486–91. doi:10.1016/j.fuel.2011.08.054.
[122] Atienza-Martínez M, Fonts I, Lázaro L, Ceamanos J, Gea G. Fast pyrolysis of torrefied sewage sludge in a fluidized bed reactor. Chem Eng J 2015;259:467–80. doi:10.1016/j.cej.2014.08.004.
[123] Folgueras MB, Alonso M, Díaz RM. Influence of sewage sludge treatment on pyrolysis and combustion of dry sludge. Energy 2013;55:426–35. doi:10.1016/j.energy.2013.03.063.
[124] Cao J-P, Li L-Y, Morishita K, Xiao X-B, Zhao X-Y, Wei X-Y, et al. Nitrogen transformations during fast pyrolysis of sewage sludge. Fuel 2013;104:1–6. doi:10.1016/j.fuel.2010.08.015.
[125] Azuara M, Fonts I, Barcelona P, Murillo MB, Gea G. Study of catalytic post-treatment of the vapours from sewage sludge pyrolysis by means of γ-Al2O3. Fuel 2013;107:113–21. doi:10.1016/j.fuel.2013.02.017.
[126] Nipattummakul N, Ahmed II, Kerdsuwan S, Gupta AK. Hydrogen and syngas production from sewage sludge via steam gasification. Int J Hydrogen Energy 2010;35:11738–45. doi:10.1016/j.ijhydene.2010.08.032.
[127] Alvarez J, Amutio M, Lopez G, Barbarias I, Bilbao J, Olazar M. Sewage sludge valorization by flash pyrolysis in a conical spouted bed reactor. Chem Eng J 2015;273:173–83. doi:10.1016/j.cej.2015.03.047.
[128] Pedroza MM, Sousa JF, Vieira GEG, Bezerra MBD. Characterization of the products from the pyrolysis of sewage sludge in 1 kg/h rotating cylinder reactor. J Anal Appl Pyrolysis 2014;105:108–15. doi:10.1016/j.jaap.2013.10.009.
57
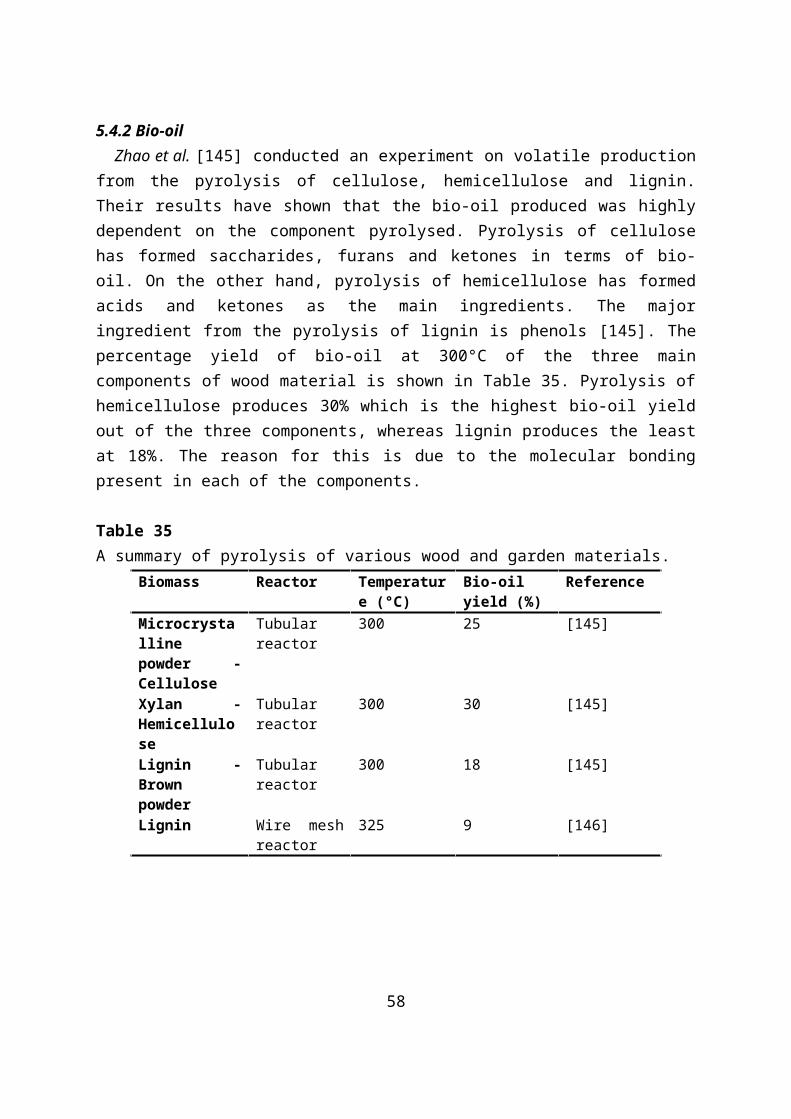
[129] Gil-Lalaguna N, Sánchez JL, Murillo MB, Rodríguez E, Gea G. Air-steam gasification of sewage sludge in a fluidized bed. Influence of some operating conditions. Chem Eng J 2014;248:373–82. doi:10.1016/j.cej.2014.03.055.
[130] Ogilvie D, Robinson P, Zender J. National Study of the Composition of Sewage Sludge New Zealand Water and Wastes Association. 1998.
[131] Sánchez ME, Menéndez JA, Domínguez A, Pis JJ, Martínez O, Calvo LF, et al. Effect of pyrolysis temperature on the composition of the oils obtained from sewage sludge. Biomass and Bioenergy 2009;33:933–40. doi:10.1016/j.biombioe.2009.02.002.
[132] Tomasi Morgano M, Leibold H, Richter F, Stapf D, Seifert H. Screw pyrolysis technology for sewage sludge treatment. Waste Manag 2017. doi:10.1016/j.wasman.2017.05.049.
[133] Piskorz J, Scott DS, Westerberg IB. Flash pyrolysis of sewage sludge. Ind Eng Chem Process Des Dev 1986;25:265–70. doi:0196-4305/86/1125-0265$01 .SO10 0.
[134] Lu " GQ, Low JCF, Liu CY, Lua AC. Surface area development of sewage sludge during pyrolysis. Fuel 1995;74:344–8.
[135] Lu H, Zhang W, Wang S, Zhuang L, Yang Y, Qiu R. Characterization of sewage sludge-derived biochars from different feedstocks and pyrolysis temperatures. J Anal Appl Pyrolysis 2013. doi:10.1016/j.jaap.2013.03.004.
[136] Agrafioti E, Bouras G, Kalderis D, Diamadopoulos E. Biochar production by sewage sludge pyrolysis. J Anal Appl Pyrolysis 2013. doi:10.1016/j.jaap.2013.02.010.
[137] Bandosz TJ, Block K. Effect of pyrolysis temperature and time on catalytic performance of sewage sludge/industrial sludge-based composite adsorbents. Appl Catal B Environ 2006. doi:10.1016/j.apcatb.2006.04.006.
[138] Hu S, Jess A, Xu M. Kinetic study of Chinese biomass slow pyrolysis: Comparison of different kinetic models. Fuel 2007. doi:10.1016/j.fuel.2007.02.031.
[139] Hossain MK, Strezov Vladimir V, Chan KY, Ziolkowski A, Nelson PF. Influence of pyrolysis temperature on production and nutrient properties of wastewater sludge biochar. J Environ Manage 2011;92:223–8. doi:10.1016/j.jenvman.2010.09.008.
[140] Fytili D, Zabaniotou A. Utilization of sewage sludge in EU application of old and new methods-A review. Renew Sustain Energy Rev 2008. doi:10.1016/j.rser.2006.05.014.
[141] Shi X, Wang J. A comparative investigation into the formation behaviors of char, liquids and gases during pyrolysis of pinewood and lignocellulosic components. Bioresour Technol 2014;170:262–9. doi:10.1016/j.biortech.2014.07.110.
[142] Dauenhauer P, Colby J, Balonek C, Suszynski W, Schmidt L. Reactive boiling of cellulose for integrated catalysis through an intermediate liquid. Green Chem 2009;11. doi:10.1039/B915068B.
[143] Liu Z, Han G. Production of solid fuel biochar from waste biomass by low temperature pyrolysis. Fuel 2015;158:159–65. doi:10.1016/j.fuel.2015.05.032.
[144] Méndez A, Fidalgo JM, Guerrero F, Gascó G. Characterization and pyrolysis behaviour of different paper mill waste materials. J Anal Appl Pyrolysis 2009;86:66–73. doi:10.1016/j.jaap.2009.04.004.
[145] Zhao C, Jiang E, Chen A. Volatile production from pyrolysis of cellulose, hemicellulose and lignin. J Energy Inst 2016. doi:10.1016/j.joei.2016.08.004.
[146] Yu J, Paterson N, Blamey J, Millan M. Cellulose, xylan and lignin interactions during pyrolysis of lignocellulosic biomass. Fuel 2017;191:140–9. doi:10.1016/j.fuel.2016.11.057.
[147] Bridgwater A V. Review of fast pyrolysis of biomass and product upgrading. Biomass and Bioenergy 2012;38:68–94. doi:10.1016/j.biombioe.2011.01.048.
[148] Universit RF, View D. Characteristics of biochar : biological properties Characteristics 58

of Biochar : Biological Properties 2009.[149] Brewer CE, Chuang VJ, Masiello CA, Gonnermann H, Gao X, Dugan B, et al. New
approaches to measuring biochar density and porosity. Biomass and Bioenergy 2014;66:176–85. doi:10.1016/j.biombioe.2014.03.059.
[150] Yokoo T, Miyafuji H. Reaction behavior of wood in an ionic liquid, 1-ethylpyridinium bromide. J Wood Sci 2014;60:339–45. doi:10.1007/s10086-014-1409-z.
[151] Yildiz S, Gezer ED, Yildiz UC. Mechanical and chemical behavior of spruce wood modified by heat. Build Environ 2006;41:1762–6. doi:10.1016/j.buildenv.2005.07.017.
[152] Hirata T, Inoue M, Fukui Y. Pyrolysis and combustion toxicity of wood treated with CCA. Wood Sci Technol 1992;27:35–47. doi:10.1007/BF00203408.
[153] Helsen L, Van Den Bulck E, Mullens S, Mullens J. Low-temperature pyrolysis of CCA-treated wood: Thermogravimetric analysis. J Anal Appl Pyrolysis 1999;52:65–86. doi:10.1016/S0165-2370(99)00034-0.
[154] Rath J, Wolfinger MG, Steiner G, Krammer G, Barontini F, Cozzani V. Heat of wood pyrolysis. Fuel 2003;82:81–91. doi:10.1016/S0016-2361(02)00138-2.
[155] Slopiecka K, Bartocci P, Fantozzi F. Thermogravimetric analysis and kinetic study of poplar wood pyrolysis. Appl Energy 2012;97:491–7. doi:10.1016/j.apenergy.2011.12.056.
[156] Demirbas A. Pyrolysis of ground beech wood in irregular heating rate conditions. J Anal Appl Pyrolysis 2005;73:39–43. doi:10.1016/j.jaap.2004.04.002.
[157] Garcia-Perez M. The Formation of Polyaromatic Hydrocarbons and Dioxins During Pyrolysis: A Review of the Literature with Descriptions of Biomass Composition, Fast Pyrolysis Technologies and Thermochemical Reactions 2008.
[158] Ringer M, Putsche V, Scahill J. Large-Scale Pyrolysis Oil Production: A Technology Assessment and Economic Analysis 2006. doi:10.2172/894989.
[159] McGrath T, Sharma R, Hajaligol M. An experimental investigation into the formation of polycyclic-aromatic hydrocarbons (PAH) from pyrolysis of biomass materials. Fuel 2001;80:1787–97. doi:10.1016/S0016-2361(01)00062-X.
[160] Lee Y, Park J, Ryu C, Gang KS, Yang W, Park YK, et al. Comparison of biochar properties from biomass residues produced by slow pyrolysis at 500°C. Bioresour Technol 2013;148:196–201. doi:10.1016/j.biortech.2013.08.135.
[161] Zheng H, Wang Z, Deng X, Zhao J, Luo Y, Novak J, et al. Characteristics and nutrient values of biochars produced from giant reed at different temperatures. Bioresour Technol 2013;130:463–71. doi:10.1016/j.biortech.2012.12.044.
[162] Mohan D, Pittman Charles U., Steele PH. Pyrolysis of Wood/Biomass for Bio-oil: A Critical Review. Energy & Fuels 2006;20:848–89. doi:10.1021/ef0502397.
[163] Lewtas J. Air pollution combustion emissions: Characterization of causative agents and mechanisms associated with cancer, reproductive, and cardiovascular effects. Mutat Res - Rev Mutat Res 2007. doi:10.1016/j.mrrev.2007.08.003.
[164] Ross AB, Jones JM, Chaiklangmuang S, Pourkashanian M, Williams A, Kubica K, et al. Measurement and prediction of the emission of pollutants from the combustion of coal and biomass in a fixed bed furnace. Fuel 2002;81:571–82. doi:10.1016/S0016-2361(01)00157-0.
[165] Lavric ED, Konnov AA, De Ruyck J. Dioxin levels in wood combustion - A review. Biomass and Bioenergy 2004;26:115–45. doi:10.1016/S0961-9534(03)00104-1.
[166] Khalili NR, Scheff PA, Holsen TM. PAH source fingerprints for coke ovens, diesel and, gasoline engines, highway tunnels, and wood combustion emissions. Atmos Environ 1995;29:533–42. doi:10.1016/1352-2310(94)00275-P.
[167] Us-Epa. Global Anthropogenic Non-CO2 Greenhouse Gas Emissions:1990-2020. 59

Environ Prot 2006:1–274. doi:EPA-430-R-06-003.[168] Cooper JA. Environmental impact of residential wood combustion emissions and its
implications. J Air Pollut Control Assoc 1980;30:855–61. doi:10.1080/00022470.1980.10465119.
[169] Conesa JA, Font R, Fullana A, Mart??n-Gull??n I, Aracil I, G??lvez A, et al. Comparison between emissions from the pyrolysis and combustion of different wastes. J Anal Appl Pyrolysis 2009;84:95–102. doi:10.1016/j.jaap.2008.11.022.
[170] Lehmann J, Stephen J. Biochar for Environmental Management: Science, Technology and Implementation. vol. 1. 2015. doi:10.4324/9781849770552.
[171] Hedberg E, Kristensson A, Ohlsson M, Johansson C, Johansson PÅ, Swietlicki E, et al. Chemical and physical characterization of emissions from birch wood combustion in a wood stove. Atmos Environ 2002;36:4823–37. doi:10.1016/S1352-2310(02)00417-X.
[172] Kao LW, Nañagas KA. Carbon monoxide poisoning. Emerg Med Clin North Am 2004;22:985–1018. doi:10.1016/j.emc.2004.05.003.
[173] Meredith T, Vale A. Carbon monoxide poisoning. Br Med J 1988;296:77–9.[174] Qian K, Kumar A, Zhang H, Bellmer D, Huhnke R. Recent advances in utilization of
biochar. Renew Sustain Energy Rev 2015;42:1055–64. doi:10.1016/j.rser.2014.10.074.[175] Ledesma EB, Kalish MA, Nelson PF, Wornat MJ, MacKie JC. Formation and fate of
PAH during the pyrolysis and fuel-rich combustion of coal primary tar. Fuel 2000;79:1801–14. doi:10.1016/S0016-2361(00)00044-2.
[176] Boström C-E, Gerde P, Hanberg A, Jernström B, Johansson C, Kyrklund T, et al. Cancer Risk Assessment, Indicators, and Guidelines for Polycyclic Aromatic Hydrocarbons in the Ambient Air. Environ Health Perspect 2002. doi:10.1289/ehp.02110s3451.
[177] Cremer D, Schmidt T, Bock CW. Theoretical Determination of Molecular Structure and Conformation. 14. Is Bicyclo[6.2.0]decapentaene Aromatic or Antiaromatic? J Org Chem 1985;50:2684–8. doi:10.1021/jo00215a018.
[178] McMurry J. Organic Chemistry. 2003. doi:10.1016/B0-08-043751-6/08302-X.[179] McGrath TE, Wooten JB, Geoffrey Chan W, Hajaligol MR. Formation of polycyclic
aromatic hydrocarbons from tobacco: The link between low temperature residual solid (char) and PAH formation. Food Chem Toxicol 2007;45:1039–50. doi:10.1016/j.fct.2006.12.010.
[180] Wiedemeier DB, Abiven S, Hockaday WC, Keiluweit M, Kleber M, Masiello CA, et al. Aromaticity and degree of aromatic condensation of char. Org Geochem 2015. doi:10.1016/j.orggeochem.2014.10.002.
[181] Britt PF, Buchanan AC, Kidder MM, Owens C, Ammann JR, Skeen JT, et al. Mechanistic investigation into the formation of polycyclic aromatic hydrocarbons from the pyrolysis of plant steroids. Fuel 2001;80:1727–46. doi:10.1016/S0016-2361(01)00058-8.
[182] WHO. Polycyclic aromatic hydrocarbons. WHO Guidel Indoor Air Qual Sel Pollut 2010:484. doi:10.1186/2041-1480-2-S2-I1.
[183] Johnsen AR, Wick LY, Harms H. Principles of microbial PAH-degradation in soil. Environ Pollut 2005;133:71–84. doi:10.1016/j.envpol.2004.04.015.
[184] Tuppurainen K, Halonen I, Ruokojärvi P, Tarhanen J, Ruuskanen J. Formation of PCDDs and PCDFs in municipal waste incineration and its inhibition mechanisms: A review. Chemosphere 1998. doi:10.1016/S0045-6535(97)10048-0.
[185] Everaert K, Baeyens J. The formation and emission of dioxins in large scale thermal processes. Chemosphere 2002;46:439–48. doi:10.1016/S0045-6535(01)00143-6.
[186] Altarawneh M, Dlugogorski BZ, Kennedy EM, Mackie JC. Mechanisms for formation, 60

chlorination, dechlorination and destruction of polychlorinated dibenzo-p-dioxins and dibenzofurans (PCDD/Fs). Prog Energy Combust Sci 2009;35:245–74. doi:10.1016/j.pecs.2008.12.001.
[187] Huang H, Buekens A. On the mechanisms of dioxin formation in combustion processes. Chemosphere 1995;31:4099–117. doi:10.1016/0045-6535(95)80011-9.
[188] Tuomisto J, Vartiainen T, Tuomisto JT. Synopsis on Dioxins and PCBs Compiled especially for administrators. Finland: 2011.
[189] McKay G. Dioxin characterisation, formation and minimisation during municipal solid waste (MSW) incineration: Review. Chem Eng J 2002;86:343–68. doi:10.1016/S1385-8947(01)00228-5.
[190] Dickson LC, Lenoir D, Hutzinger O. Quantitative Comparison of De Novo and Precursor Formation of Polychlorinated Dibenzo-p-Dioxins Under Simulated Municipal Solid Waste Incinerator Postcombustion Conditions. Environ Sci Technol 1992;26:1822–8. doi:10.1021/es00033a017.
[191] Bond T, Templeton MR. History and future of domestic biogas plants in the developing world. Energy Sustain Dev 2011. doi:10.1016/j.esd.2011.09.003.
[192] Czajczyńska D, Krzyżyńska R, Jouhara H, Spencer N. Use of pyrolytic gas from waste tire as a fuel: A review. Energy 2017;134:1121–31. doi:10.1016/j.energy.2017.05.042.
[193] Seadi TA, Rutz D, Prassl H, Köttner M, Finsterwalder T, Volk S, et al. Biogas Handbook. 2008. doi:10.1533/9780857097415.1.85.
[194] Nijaguna BT. Biogas Technology. Technology 2006;4:298. doi:8122413803.[195] Spuhler D. Trickling Filter | SSWM. Sustain Sanit Water Manag 2014.[196] Cherubini F. The biorefinery concept: Using biomass instead of oil for producing
energy and chemicals. Energy Convers Manag 2010. doi:10.1016/j.enconman.2010.01.015.
[197] Czernik S, Bridgwater A V. Overview of applications of biomass fast pyrolysis oil. Energy and Fuels 2004. doi:10.1021/ef034067u.
[198] Mortensen PM, Grunwaldt JD, Jensen PA, Knudsen KG, Jensen AD. A review of catalytic upgrading of bio-oil to engine fuels. Appl Catal A Gen 2011;407:1–19. doi:10.1016/j.apcata.2011.08.046.
[199] Xiu S, Shahbazi A. Bio-oil production and upgrading research: A review. Renew Sustain Energy Rev 2012;16:4406–14. doi:10.1016/j.rser.2012.04.028.
[200] Kim JS. Production, separation and applications of phenolic-rich bio-oil - A review. Bioresour Technol 2015;178:90–8. doi:10.1016/j.biortech.2014.08.121.
[201] Natural charcoal deodorant. Piperwai 2017. https://www.piperwai.com/ (accessed July 17, 2017).
[202] Mohan D, Sarswat A, Ok YS, Pittman CU. Organic and inorganic contaminants removal from water with biochar, a renewable, low cost and sustainable adsorbent - A critical review. Bioresour Technol 2014. doi:10.1016/j.biortech.2014.01.120.
[203] Ippolito JA, Laird DA, Busscher WJ. Environmental Benefits of Biochar. J Environ Qual 2012;41:967. doi:10.2134/jeq2012.0151.
[204] Van Wesenbeeck S, Prins W, Ronsse F, Antal MJ. Sewage sludge carbonization for biochar applications. Fate of heavy metals. Energy and Fuels 2014;28:5318–26. doi:10.1021/ef500875c.
[205] Ward BF. Tall Oil- Chemicals from a natural, renewable source. Proc Eight Cellul Conf Wood Chem Chall 1975;378:332–4.
[206] Jouhara H, Nannou TK, Anguilano L, Ghazal H, Spencer N. Heat pipe based municipal waste treatment unit for home energy recovery. Energy 2017. doi:10.1016/j.energy.2017.02.044.
61

[207] Swift T, Rose-Glowacki H, Moore M, Sanchez E. Economic Impact of Plastics-to-Oil Facilities in the U.S. 2014.
[208] V. C. Peacocke G. Techno-economic assessment of power production from the Wellman and BTG fast pyrolysis processes. 2004.
[209] Brown M., Herendeen R. Embodied energy analysis and EMERGY analysis: a comparative view. Ecol Econ 1996;19:219–35. doi:10.1016/S0921-8009(96)00046-8.
[210] Zhou L, Luo T, Huang Q. Co-pyrolysis characteristics and kinetics of coal and plastic blends. Energy Convers Manag 2009. doi:10.1016/j.enconman.2008.10.007.
62