· web viewmichigan educational assessment program technical report 2009-2010 a collaborative...
TRANSCRIPT

Michigan Educational Assessment Program
Technical Report
2009-2010
A Collaborative Effort of
Michigan Department of EducationBureau of Assessment and Accountability
and Measurement Incorporated
i

TABLE OF CONTENTS
Introduction to and Overview of Technical Report…………………………………………………… 1
Chapter 1: BACKGROUND OF THE MICHIGAN EDUCATIONAL ASSESSMENT PROGRAM (MEAP)……..2
1.1. Organizational Structure of Michigan Schools……………………………………………………… 41.2. Statewide Testing and Accountability Programs…………………………………………………..... 41.3. Current and Planned Assessments…………………………………………………………………… 61.4. Appropriate Uses for Scores and Reports………………………………………………………….... 7 1.4.1. Individual Student Reports……………………………………………………………………. 8 1.4.2. School, District, Intermediate School District, and State Reports……………………………. 81.5. Organizations and Groups Involved……………………………………………………………….... 12 1.5.1. Michigan Department of Education (MDE) Office of Educational Assessment & Accountability (OEAA)……………………………………………………… 12 1.5.2. Department of Information Technology (DIT)…………………………………………….… 12 1.5.2.1. Department of Educational Technology……………………………………………... 12 1.5.3. Center for Educational Performance and Information (CEPI)……………………………….. 13 1.5.4. Contractors…………………………………………………………………………………..... 13 1.5.4.1. Administration Contractor……………………………………………………………. 13 1.5.4.2. Development Contractors………………………………………………………….…. 14 1.5.4.3. Subcontractors…………………………………………………………………….….. 14 1.5.5. Educators……………………………………………………………………………………… 15 1.5.6. Technical Advisory Committee……………………………………………………………….. 17 1.5.7. Michigan State Board of Education……………………………………………………….…... 17
Chapter 2: Test Development…………………………………………………………………………. 18
2.1. Test Specifications…………………………………………………………………………………... 18 2.1.1. Item Writer Training ………………………………………………………………………… 18 2.1.2. Item Development……………………………………………………………………………. 18 2.1.3. Item Review………………………………………………………………………………….. 19 2.1.4. Field Testing…………………………………………………………………………………. 20 2.1.5. Data Review………………………………………………………………………………….. 20 2.1.6. Operational Test Construction……………………………………………………………….. 202.2. Test Blueprints……………………………………………………………………………………… 21 2.2.1. Test Structures for 2009 MEAP Content Tests………………………………………………. 212.3. Review of Field Test Items Provided by Development Contractor………………………………… 24 2.3.1. Tabulations of Item Characteristics………………………………………………………….. 24 2.3.2. Item Specifications…………………………………………………………………………… 24 2.3.3. Item Statistics………………………………………………………………………………… 24 2.3.4. Differential Item Functioning………………………………………………………………... 25
ii

2.3.5. Data Review………………………………………………………………………...………... 252.4. Pre-Field-Test Item Review……………………………………………………………………….... 25 2.4.1. Contractor Review…………………………………………………………………………… 25 2.4.2. OEAA Review……………………………………………………………………………….. 262.5. Field Testing………………………………………………………………………………………… 26 2.5.1. Field Testing Design…………………………………………………………………………. 26 2.5.2. Field Testing Sampling………………………………………………………………………. 272.6. Data Review………………………………………………………………………………………… 29 2.6.1. Data…………………………………………………………………………………………... 29 2.6.2. Statistics Prepared for Review Committees …………………………………………………. 29 2.6.3. Data Reviews…………………………………………………………………………………. 34 2.6.3.1. Bias/Sensitivity and Content Committee Review…………………………………… 34 2.6.3.2. Summary Tallies…………………………………………………………………….. 34 2.6.4. Item Revision Procedures…………………………………………………………………….. 372.7. Item Banking………………………………………………………………………………………... 38 2.7.1. Procedures……………………………………………………………………………………. 38 2.7.2. Data Included in Item Bank………………………………………………………………….. 40 2.7.3. Description of Item Bank…………………………………………………………………….. 402.8. Construction of Operational Test Forms………………………………………............................... 46 2.8.1. Design of Test Forms ………………………………………………………………………... 46 2.8.1.1. Review the Assessment Blueprints for the Operational Assessments…………………………………………………………….. 46 2.8.2. Item Selection……………………………………………………………………………….... 49 2.8.2.1. Select Assessment Items to Meet the Assessment Blueprints …………………………………………………………………………… 49 2.8.2.2. Assess the Statistical Characteristics of the Selected Assessment Items…………………………………………………………... 49 2.8.2.3. Review and Approve Test Forms ………………………………………………….... 512.9. Accommodated Test Forms…………………………………………………………………………. 51 2.9.1. Special Order Accommodated Testing Materials………………………................................ 51 2.9.2. Braille………………………………………………………………………………………… 52 2.9.3. Large Print………………………………………………………………………………….… 52 2.9.4. Oral Administration for Mathematics………………………………………………………... 52 2.9.5. Bilingual Tests……………………………………………………………………………….. 52
Chapter 3: Overview of Test Administration…………………………………………………………. 53
3.1. Test Administration…………………………………………………………………………….….… 533.2. Materials Return………………………………………………………………………………….….. 54
Chapter 4: Technical Analyses of Post-Administration Processing……………………………….… 57
4.1. Scanning Accuracy and Reliability…………………………………………………………………. 574.2. Multiple-Choice Scoring Accuracy…………………………………………………………………. 604.3. Erasure Analyses……………………………………………………………………………………. 604.4. Results of Constructed Response Scoring Procedures……………………………........................... 61
iii

4.4.1. Rangefinding and Rubric Review…………………………………………............................ 61 4.4.2. Rater Selection………………………………………………………………………………… 63 4.4.3. Rater Training …………………………………………………………………………….…. 644.5. Rater Statistics and Analyses……………………………………………………………………….. 66 4.5.1. Calibration……………………………………………………………………………………. 66 4.5.2. Rater Monitoring and Retraining …………………………………………............................ 67 4.5.3. Rater Dismissal ……………………………………………………………........................... 68 4.5.4. Score Resolution…………………………………………………………………………….... 68 4.5.5. Inter-Rater Reliability Results………………………………………………………………... 68 4.5.6. Rater Validity Checks……………………………………………………………………….... 68 4.5.7. Summary Statistics ………………………………................................................................. 68
Chapter 5: MEAP Reports……………………………………………………………………………. 69
5.1. Description of Scores……………………………………………………………………………….. 69 5.1.1. Scale Score………………………………………………………………….......................... 69 5.1.2. Raw Score……………………………………………........................................................... 69 5.1.3. Performance Level…………………………………………….............................................. 695.2. Scores Reported…………………………………………………………………………………….. 705.3. Appropriate Score Uses…………………………………………………………………………….. 70 5.3.1. Individual Students…………………………………………………………………………... 71 5.3.2. Groups of Students…………………………………………………………………………… 71 5.3.3. Item Statistics………………………………………………………………………………… 71 5.3.4. Frequency Distributions……………………………………………………………………… 73
Chapter 6: Performance Standard…………………………………………………............................ 74
6.1. Development of Standard Setting Performance Level Descriptors………………………………… 746.2. Standard Setting…………………………………………………………………………………….. 78
Chapter 7: Scaling……………………………………………………………………………………… 81
7.1. Summary Statistics and Distributions from Application of Measurement Models………………… 82 7.1.1. Summary Classical Test Theory Analyses by Form…………………………………………. 82 7.1.2. Item Response Theory Analyses by Form and for Overall Grade-Level Scales…………………………………………………………........................... 82 7.1.2.1. Step-by-Step Description of Procedures Used to Calibrate Student Responses, Using Item Response Theory……………………………………………. 82 7.1.2.2. Summary Post-Calibration Score Distributions……………………………………… 83 7.1.2.3. Summary Statistics on Item Parameter Distributions and Fit Statistics……………... 93 7.1.2.4. Test Information/Standard Error Curves………………………………..................... 96 7.1.2.5. Summary of Model fit Analyses…………………………………………………...... 1047.2. Scale Scores……………………………………………………………………………………...… 104 7.2.1. Description of the MEAP Scale…………………………………………………………...…. 104 7.2.2. Identification of the Scale, Transformation of IRT Results to MEAP Scale………………… 105 7.2.3. Scale Score Interpretations and Limitations………………………………………………...... 105
iv

7.2.4. Upper and Lower End Scaling………………………………………………………………… 106
Chapter 8: Equating…………………………………………………………………………………... 108
8.1. Rationale…………………………………………………………………………………………... 1088.2. Pre-equating……………………………………………………………………………………….. 108 8.2.1. Test Construction and Review……………………………………………………………… 108 8.2.2. Field-Test Items…………………………………………………………………………….. 108 8.2.3. Within-Grade Equating……………………………………………………………………... 109 8.2.3.1. Description of Procedures Used to Horizontally Equate Scores from Various Forms at the Same Grade Level ………………………………………..… 109 8.2.3.2. Item and Test Statistics on the Equated Metric, Test Information/ Standard Error Curves, and Ability Distributions………………………………...... 1098.3. Vertical Equating………………………………………………………………………………....... 1098.4. Ability Estimation……………………………………………………………………………….…. 1098.5. Development Procedures for Future Forms………………………………………………………... 111 8.5.1. Equating Field-Test Items………………………………………………………………….... 111 8.5.2. Item Pool Maintenance…………………………………………………………………….... 111
Chapter 9: Reliability……………………………………………………………………………….... 112
9.1. Internal Consistency, Empirical IRT Reliability Estimates, and Conditional Standard Error of Measurement……………………………………………………………….……. 112 9.1.1. Internal Consistency……………………………………………………………………….…. 112 9.1.2. Empirical IRT Reliability…………………………………………………………………..... 113 9.1.3. Conditional Standard Error of Measurement……………………………………………….... 115 9.1.4. Use of the Standard Error of Measurement…………………………………………….…..… 1159.2. Alternative Forms Reliability Estimates……………………………………………………….….... 1159.3. Score Reliability for the Written Composition and the Constructed-Response Items………….….. 116 9.3.1. Reader Agreement…………………………………………………………………….……... 116 9.3.2. Score Appeals………………………………………………………………………….…….. 1169.4. Estimates of Classification Accuracy………………………………………………………….….... 116 9.4.1. Statewide Classification Accuracy…………………………………………………….…….. 117
Chapter 10: Validity……………………………………………………………………………….…… 118
10.1. Content and Curricular Validity……………………………………………………………………. 118 10.1.1. Relation to Statewide Content Standards…………………………………………………... 118 10.1.1.1. MEAP Alignment Studies………………………………………………………... 119 10.1.2. Educator Input……………………………………………………………………………… 121 10.1.3. Test Developer Input……………………………………………………………………….. 121 10.1.4. Evidence of Content Validity………………………………………………………………. 12110.2. Criterion and Construct Validity……………………………………………………...................... 122 10.2.1. Criterion Validity…………………………………………………………………………... 122 10.2.2. Construct Validity………………………………………………………………………….. 12210.3. Validity Evidence for Different Student Populations………………………………………….…… 127
v

10.3.1. Differential Item Functioning (DIF) Analyses………………………………………….….. 127 10.3.1.1. Editorial Bias Review……………………………………………………..……… 128 10.3.1.2. Statistical DIF Analyses…………………………………………………………. 128 10.3.1.3. DIF Statistics for Each Item……………………………………………………... 129 10.3.2. Performance of Different Student Populations…………………………………………….. 129
LIST OF APPENDICES............................................................................................................................131Appendix A: MEAP Test Blueprint 2009 Fall.................................................................................131Appendix B: Summary Statistics of Matrix Sampling.....................................................................131Appendix C: Data Created for Field Test Items...............................................................................131Appendix D: Statistics Used on Item Labels...................................................................................131Appendix E: MEAP Fall 2009 Maturity Reports.............................................................................131Appendix F: Assessment Accommodation Summary Table............................................................131Appendix G: Sample Output for Key Check...................................................................................131Appendix H: Item Statistics.............................................................................................................131Appendix I: Standard Setting Technical Repost...............................................................................131Appendix J: Classical Item Statistics...............................................................................................131Appendix K: Scale Score Statistics and Performance Level Percentage.........................................131Appendix L: Histogram of Scale Score Distributions......................................................................131Appendix M: Summary of Item Response Theory Statistics...........................................................131Appendix N: Summary of Item Fit Statistics...................................................................................131Appendix O: Alpha Reliabilities......................................................................................................131Appendix P: Empirical IRT Reliabilities.........................................................................................131Appendix Q: Rater Agreement.........................................................................................................131Appendix R: Statewide Classification Accuracy.............................................................................131Appendix S: ELA Alignment Study Technical Report....................................................................131Appendix T: Mathematics Alignment Study Technical Report.......................................................131Appendix U: Science Alignment Study Technical Report...............................................................131Appendix V: Performance of Different Student Populations...........................................................131Appendix W: Histogram of Scale Score Distributions by Student..................................................131
vi

INTRODUCTION TO AND OVERVIEW OF TECHNICAL REPORT
This technical report is designed to provide information to Michigan coordinators, educators and interested citizens about the development procedures and technical attributes of the state-mandated Michigan Educational Assessment Program (MEAP). This report does not include all the information available regarding the assessment program in Michigan. Additional information is available on the Michigan Department of Education (MDE), Office of Educational Assessment & Accountability (OEAA) website.
This report outlines the necessary steps and presents supporting documentation so that educators can improve teaching and learning through the use of assessment results. The information in this report may be used to monitor school and individual student improvement over time. Additionally, this report outlines current “state of the art” technical characteristics of assessment and should be a useful resource for educators trying to explain to parents, teachers, school boards and the public alike the different ways in which assessment information is important.
This technical report includes 10 chapters:
Chapter 1 gives the general background of the MEAP assessment program, the appropriate uses for the scores and reports, and the organizations and groups involved in the development and administration of the program.
Chapter 2 describes details of the test specifications and test blueprints, as well as the full cycle of the test development process including item writing, pre-field-test item review, field testing, post-field-testing item review, item banking, and the construction of operational and accommodated test forms.
Chapter 3 provides an overview of test administration. Activities involved in the preparation for test administration, test administration process, test materials return, measures of test security, and the test accommodations for students with disabilities and students in ELL are presented in this chapter.
Chapter 4 presents the technical analyses of post-administration processing. Scanning accuracy and reliability, as well as the rater validity and reliability of scoring constructed responses items are discussed in detail.
Chapter 5 describes the score reporting of the assessment. It includes the descriptions of scale score, raw score and proficiency levels, the type of score reports, and the appropriate score uses.
Chapter 6 gives a detailed report of the development of performance level descriptors (PLDs), as well as the procedures, implementation, and results of performance standard setting process.
Chapters 7 through 10 describe the psychometric characteristics of the MEAP assessments. Step-by-step description of procedures used to calibrate student responses using item response theory, development of MEAP scale score, and the rationale and procedures of equating (including 3PL equating for writing) are described in Chapter 7 and 8. Alpha reliability, empirical IRT reliability, reader agreement, estimates of statewide classification accuracy of MEAP, validation of content validity, construct validity, and the performance of different student populations are described in Chapter 9 and Chapter 10.
There are also extensive appendices to this report. These are listed at the end of the main report text, and are made available separately due to their size.
1

CHAPTER 1: BACKGROUND OF THE MICHIGAN EDUCATIONAL ASSESSMENT PROGRAM (MEAP)
The Michigan Educational Assessment Program (MEAP) is a statewide assessment program initiated by the State Board of Education in 1969, mandated by the Michigan Legislature in 1970, supported by the governor, and funded by the legislature. The program’s purpose is to provide information on the status and progress of Michigan education in specified content areas to students, parents, teachers, and other Michigan citizens so individual students are helped to achieve the skills they lack and educators can use the results to review and improve the schools’ instructional programs.
The MEAP is administered in mathematics, English language arts (ELA, which includes reading, writing components, and an optional listening component), science, and social studies to students at the elementary, middle, and high school levels.
The MEAP assessments were developed to measure what Michigan educators believe all students should know and be able to achieve in the content areas. Assessment results paint a picture of how Michigan students and schools are doing when compared with standards established by the State Board of Education.
Current MEAP assessments are based on the Content Standards developed by Michigan educators and approved by the Michigan State Board of Education in 1995. MEAP assessments are criterion-referenced, meaning that each student’s results are judged and reported against a set performance standard. If a student meets the standard, the student meets expectations on the recommended state curriculum.
Educators from throughout Michigan continue to revise and update Michigan curriculumdocuments that serve as the basis for the MEAP and the development and ongoing improvement of the assessments. The Michigan Revised School Code and the State School Aid Act require the establishment of educational standards and the assessment of student academic achievement, but there is no state-mandated curriculum. Accordingly, the State Board of Education, with the input of educators throughout Michigan, approved a system of academic standards and a framework within which local school districts could develop, implement, and align curricula as they saw fit.
Key Legislation Regarding the MEAPThe MEAP was established by Act 451 of 1976. The Act, which has been amended many times, currently addresses elementary, middle school, and high school assessment.
The Individuals with Disabilities Education Act (IDEA) requires that all students with disabilities be assessed at the state level. In response to this legislation, the Michigan State Board of Education approved the Michigan Educational Assessment System (MEAS). It has three components: the MEAP, MI-Access, and ELPA (English Language Proficiency Assessment). MI-Access is designed for students for whom the Individualized Education Program (IEP) Team has determined that the MEAP assessments, even with assessment accommodations, are not appropriate for the student.
Students with disabilities can take part in one of three MI-Access assessments: Participation, Supported Independence, and Functional Independence. Scores for students taking the MI-Access Assessment are divided into three performance levels: Emerging, Attained, and Surpassed.
2

The ELPA was first administered in Spring 2006. This test is a customized assessment designed to be aligned with the Michigan English language proficiency standards, which were approved by the State Board of Education in April 2004. ELPA assesses academic and social language. It is divided into four grade-level spans: K–2, 3–5, 6–8, and 9–12, which correspond to the grade spans in Michigan’s English Language Proficiency standards. Proficiency levels are to include a basic, intermediate, and proficient level for each grade level assessed. Cut scores for the proficiency levels were determined during a standard setting in July 2006.
2007-2008 MEAP AdministrationWith the current program, all public school districts are required to assess students each year in grades 3–9 and once in high school. Grade 10 dual enrollees, grade 12 students, and adult education students are also assessed during the MEAP High School Administration (HSA) window. Students who have previously taken the MEAP HSA are also given the option to be reassessed so they can qualify for an endorsement, become eligible for a Michigan Merit Award scholarship, or receive a higher score.
The Fall 2007 MEAP administration was the second time all students in grades 3–8 were assessed in mathematics and reading, in compliance with the federal No Child Left Behind Act (NCLB). A science assessment was administered in fifth and eighth grades in Fall 2007 and high school in Fall 2007 and Spring 2008 to prepare for the 2008–9 NCLB science requirement.1
In Spring 2007, MEAP high school assessments was replaced with a new system of high school assessments called the Michigan Merit Examination (MME). The MME is based on the ACT college entrance examination, WorkKeys (an ACT work skills assessment), and several Michigan-developed components designed to assess Michigan curriculum that is not assessed by the ACT or WorkKeys. The goal is to help students as they transition to further schooling or work after graduating from high school.
The MME was implemented in grade 11 during the 2007–8 school year.
Starting in Fall 2007, students’ MEAP scores are divided into four performance levels: Not Proficient, Partially Proficient, Proficient, and Advanced. Students who place in either the Proficient or Advanced levels are considered to be “proficient” in that subject. Those who place in the Not Proficient or Partially Proficient levels are deemed to be “not proficient.”The performance levels are:
Level 1–exceeded Michigan standards;Level 2–met Michigan standards;Level 3–demonstrated basic knowledge and skills of Michigan standards;Level 4–considered to be at an apprentice level, demonstrating little success in
meeting Michigan standards.
Students attaining a performance level of 1, 2, or 3 on the MEAP High School Assessment receive a subject-area endorsement on their high school transcript for that subject.
In Fall 2007 MEAP assessment, over 80 percent of the students taking the fifth grade MEAP science, the third and fourth grade mathematics assessment, and the third, fourth, fifth, and sixth grade reading
1 By 2007-2008, all students are required to be tested in science at least once at each instructional level (elementary, middle, and high school).
3

assessment met or exceeded expectations. Over 70 percent met or exceeded expectations in the fifth, the sixth, the seventh, and the eighth grade mathematics assessment, the eighth grade science assessments, the sixth and ninth grade social studies assessments, the seventh and eighth grade reading assessments, and the third through eighth grade ELA composites.
1.1. Organizational Structure of Michigan Schools
Michigan’s 57 intermediate school districts provide leadership, services, resources, and programs to Michigan districts and schools. The intermediate school districts include more than 550 public school districts, which consist of approximately 4,500 school buildings and approximately 125,000 students per grade.
The approximately 2,200 home schooled students in the state are given opportunities to be assessed at their local public school district. Public school academies (charter schools) are also required to administer the MEAP assessments. There are approximately 190 public school academies in the state. The MEAP assessments are administered to all eligible students, including those with exceptional needs and English language learners.
The MEAP assessments are provided on an optional basis to nonpublic schools, including approximately 1,100 buildings with approximately 16,000 students per grade for the lower grades and 10,000 students per grade for the upper grades. Michigan law requires the state to provide assessment opportunities to middle and high school students who attend nonpublic schools that do not administer the MEAP assessments. This is accomplished through administration of the assessment at several assessment centers throughout the state. Participation of nonpublic schools and students is voluntary.
1.2. Statewide Testing and Accountability Programs
The State of Michigan has adopted accreditation and school accountability requirements that use results from the MEAP assessments as the key measure of student learning and school success. Michigan uses MEAP achievement data in combination with other important information to provide report cards to districts and schools. The report cards are made public and used in a variety of ways to hold schools accountable, help schools improve, and help parents make good decisions about their children’s education.
Taken together, Education YES!–A Yardstick for Excellent Schools from the Michigan-based accreditation system and Adequate Yearly Progress (AYP) from the NCLB form Michigan’s school accountability system. NCLB requires each state to have a single school accountability system addressing all public schools in the state and including AYP in conformance with the specific federal requirements.
Education YES! uses several components that are interlinked to present a complete picture of performance at the school level. Education YES! is a broad set of measures that looks at school performance and student achievement in multiple ways. Measures of student achievement in Michigan’s school accreditation system are
achievement status to measure how a school is doing in educating its student; achievement change to measure whether student achievement is improving or declining; achievement growth (delayed until 2007–8) to measure whether students are demonstrating at
least one year of academic growth for each year of instruction.
4

In addition, the Indicators of School Performance measure investments that schools are making in improved student achievement, based on indicators that come from research and best practice.
Scores on all three components of Education YES! have been converted to a common 100-point scale: 90–100, A; 80–89, B; 70–79, C; 60–69, D; and 50–59, F. Grades of D and F are not used for the school’s composite grade, where the labels D/Alert and Unaccredited are used.
In 2003–4, the composite school grade was derived from the individual school score and the school’s status in terms of Adequate Yearly Progress (AYP) under NCLB. The weighting of the components of Education YES! in the composite grade was as follows:
Education YES! Composite Score Weighting
Component Point Value
Until 2006-7 2007-8 and AfterSchool Performance Indicators 33 33Achievement Status 34 23Achievement Change 33 22Achievement Growth 22Total 100 100
For 2007, the weighting of the composite Education YES! score and grade is maintained. The scores for each content area are computed by averaging the Status and Change (or Adjusted Change) scores for the content area.
NCLB requires that AYP be calculated for each public school, each school district, and the state. The school or district must attain the target achievement goal in reading and mathematics or reduce the percentage of students in the non-proficient category (Not Proficient and Partially Proficient) of achievement by 10 percent (“safe harbor”). A school or district must also test at least 95 percent of its students enrolled in the grade level tested for the school as a whole and for each required subgroup. In addition, the school must meet or exceed the other academic indicators set by the state: graduation rate for high schools of 80 percent and attendance rate for elementary and middle schools of 85 percent. These achievement goals must be reached for each subgroup that has at least the minimum number of students. The subgroup size is the same for the school, school district, and the state as a whole. The subgroups are:
Major racial/ethnic subgroupso Black or African Americano American Indian or Alaska Nativeo Asian American, Native Hawaiian, or other Pacific Islandero Hispanic or Latino o Whiteo Multiracial
Students with disabilities Limited English proficient Economically disadvantaged
5

1.3. Current and Planned Assessments
In Fall 2007, the MEAP included the administration of: English language arts (ELA) assessments in grades 3–8 and high school (grade 12 as needed).
ELA consists of reading and writing components, where reading and writing have separate cut scores and there is a combined reading/writing cut score for ELA. In Fall 2007, the optional listening portion was eliminated.
Mathematics assessments in grades 3–8 and high school (grade 12 as needed) Science assessments at grades 5, 8, and high school (grade 12 as needed) Social studies assessments at grades 6, 9, and high school (grade 12 as needed).
In Spring 2008, Michigan Merit Examination (MME) was administered for high school juniors. The examination is based on ACT, WorkKeys, and Michigan-developed assessments.
Table 1.1 presents the MEAP assessment schedule for the 2007–2008 school year.
Table 1.1. 2006-7 MEAP Assessment Schedule
MEAP Test ScheduleAcademic Year 2007-2008
Window Dates Students Tested SubjectsFall 2007 10/14 - 10/30/2007 Grade 3 English language arts1
MathematicsGrade 4 English language arts1
MathematicsGrade 5 English language arts1
MathematicsScience
Grade 6 English language arts1
MathematicsSocial studies3
Grade 7 English language arts1
MathematicsGrade 8 English language arts1
MathematicsScience
Grade 9 Social studies3
Spring 2008 Click below to view the Spring 2008 MME Schedule:
http://www.michigan.gov/documents/MME_Schedule_2007_10_155406_7.pdf
1 The English language arts tests include reading and writing (the optional listening portion has been eliminated).2 The English language arts tests include both reading and writing, but not listening.3 The social studies assessments are given in Fall of 2007 at grade 6 (covering the later
6

elementary benchmarks) and at grade 9 (covering the middle school benchmarks).
1.4. Appropriate Uses for Scores and Reports
Following administration of the MEAP assessments, reports are provided to help educators understand and use the MEAP assessment results. Information from the MEAP assessments complies with NCLB. The reports provide educators, parents, and the public with an understanding of the status and progress of Michigan students.
Properly used, MEAP assessment results can: measure academic achievement as compared with expectations, and whether it is improving over
time; determine whether improvement programs and policies are having the desired effect; target academic help where it is needed.
In August 2005, the OEAA published an ethics document, Professional Assessment and Accountability Practices for Educators. Section 7 provides the following specific instructions for appropriate and ethical data reporting:
“School personnel will: Understand and comply with Michigan and United States laws that apply to the
handling of student data including but not limited to the Family Rights and Privacy Act (1997) and the Michigan Freedom of Information Act (1996).
Focus on student achievement for individual student and program improvement. Maintain student confidentiality at all times. Ensure that the information is reported to parents and teachers as soon as possible so
they can use it for determining the student’s strengths and weakness. Ensure that student information is accurate and is placed in the student’s permanent
records. Analyze score results in terms of student attainment of Grade Level Content
Expectations and MDE Benchmarks. Analyze score results in the context of the school program as a whole, not in
isolation. Remind your audiences that many factors affect test performance. Students come
from a variety of cultural backgrounds, health conditions, and educational experiences that affect their academic performance. (p. 28)
School personnel will not: Expose any personally identifiable information to anyone other than the student or
parents or legal guardian. (Public law requires the protection of student information). Report on sub-groups of students that would lead to inadvertent identification of
students. MEAP State results are reported for sub-group sizes of ten students per group or more. Smaller group sizes may inadvertently expose student identities.
Use student ID numbers, names, birthdates, gender, and ethnicity or race which appears on any public information or reports unless reporting names only for Merit Awards or other recognitions for achievement.” (p. 29)
7

Brief descriptions of MEAP score reports are provided below. More extensive descriptions with samples are included in the Guide to Reports, Grades 3–9 (Fall 2007, published January 2008). The guide also outlines information about the scale score, performance level, machine-scoring process, and hand-scoring process, and includes notes for interpreting score report data. The Guide to Reports is available at MDE website: http://www.michigan.gov/documents/mde/F07_Guide_to_Reports_sm_223910_7.pdf
1.4.1. Individual Student Reports
The Individual Student Report (ISR) provides a detailed description of each student’s performance in the content areas assessed on the MEAP Grades 3–9. The ISR is designed to help educators identify their students’ academic strengths and areas that may need improvement. Schools may include these reports in student record files.
At the top of the ISR, a student performance summary appears to the right of the student’s name and demographic information. The student performance summary contains the assessment form, the number of points the student earned out of the total number of possible points, the student’s scale score, and the performance level attained.
The major section of the ISR presents detailed information on the individual student’sperformance for each released assessment item. All items except field test items are included. The number of points earned out of the total number of possible points is reported for each strand assessed. Each strand is further subdivided into the primary Michigan benchmarks assessed. The information provided for each benchmark is:
the Grade Level Content Expectation (GLCE) code and descriptor; the item number in the Released Items document; the student’s response to that item number (the Response Code legend is provided in the lower
left corner of the ISR); the number of points earned out of the total number of possible points for that benchmark.
The Parent Report and Student Record Label are also printed for each student administered the MEAP Grades 3–9 or HSA. The Parent Report presents a summary description of the student’s performance by strand for each content area assessed on the MEAP, as well as scale scores and performance level information. Two copies of the Parent Report are produced—one for the parent and one for the school.
Student Record Labels show summaries of individual scale scores and performance levels in all content areas in label format. The labels are distributed to the schools for placement in the student record files (CA-60).
1.4.2. School, District, Intermediate School District, and State Reports
Summary Reports and Demographic Reports are produced at the school, district, intermediate school district (ISD), and state levels. For MEAP Grades 3–9, Feeder School Reports, which are comparable to Summary Reports, are distributed to the feeder schools and districts.
MEAP Grades 3–9 reports include Item Analysis Reports produced and distributed by class/group, school, district, and state.
8

For both the MEAP Grades 3–9 and the MEAP HSA, Class Rosters are distributed to class/groups and schools. The Class Rosters present summary score information by class for each strand and benchmark (GLCE) assessed within each content area. Each student’s name, identifying information, content area scale score, performance level, and detail information are listed.
Summary Reports provide a comparative set of mean scale score information for each grade level, summarized by school, district, ISD, and state. The Summary Reports are generated for three student populations:
all students; students with disabilities (SWD); all except students with disabilities (AESWD).
The top section of each Summary Report identifies the title of the report, the level of aggregation (school, district, ISD, state), the student population included in the report, the grade level, the assessment cycle, and the content area. School, district, and ISD names and codes are included as applicable.
The center section of each Summary Report shows summary data for each content area. Summary data reported includes the number of students assessed, the mean scale score, scale score margin of error, the percentage of students attaining each performance level, and the percentage of students who met or exceeded Michigan standards within each content area.
The last section of each MEAP Grades 3–9 Summary Report presents summary data for each domain or benchmark within each strand. The summary data reported includes the code and descriptor for each GLCE (mathematics) or benchmark (science and social studies). Similarly, the last section of the MEAP HSA Summary Reports provides summary data for each standard or benchmark within each strand. The summary data reported includes the code and descriptor for each benchmark.
Also printed for both the MEAP Grades 3–9 and the MEAP HSA Summary Reports are the assessment form assigned to the school, the number of students assessed using that form, the mean points earned, the total number of possible points, and the percentage of students earning each point value. This summary data includes aggregate and mean data for all students using the assessment form assigned to the school.
This last section is included only on the School Summary Reports. This summary data is not meaningful at the district or ISD level because each school was assigned a different form and the maximum number of possible points for each domain or benchmark varies, depending on the form administered. Each district will receive a copy of the School Summary Report for each school in the district.
Demographic Reports provide a summary breakdown of scores by demographic subgroup for each content area assessed. Summary data reported includes the number of students assessed in each subgroup, the mean scale score, the percentage of students attaining each performance level, and the percentage of students that met or exceeded Michigan standards in each content area. The Demographic Report is generated for three student populations:
all students; students with disabilities (SWD); all except students with disabilities (AESWD).
9

The top section of each Demographic Report identifies the title of the report, the level of aggregation (school, district, ISD, state), the student population included in the report, the grade level, and the assessment cycle. School, district, and ISD names and codes are included as applicable.
The main section of each Demographic Report lists the demographic subgroups and the total student population reported. Ethnicity subgroups are defined by federal requirements. (Refer to the ethnicity definitions in the MEAP Building Coordinator Handbook for the Academic Year 2007–2008 for definitions.) The remaining categories are reported by a yes or no response. No summary scores are provided for subgroups with fewer than ten students. The demographic subgroups reported are:
Gender; Ethnicity; Economically disadvantaged (ED); English language learners (ELL); Formerly limited English proficient (FLEP); Migrant.
The final section of each Demographic Report shows the number of students included in the subgroup, the mean scale score, the percentage of students attaining each performance level, and the percentage of students who met or exceeded Michigan standards in each content area.
This is a two-page report with ELA scores reported on one page. Mathematics, science, and social studies scores are reported on the second page.
Item Analysis Reports provide summary information for each selected response (multiple-choice) item and each constructed-response item on the MEAP Grades 3–9 assessment, including the primary Michigan benchmark (GLCE) measured by each item. The summary information reports the percentage of students selecting each response. The Item Analysis Report is generated for three student populations:
all students; students with disabilities (SWD); all except students with disabilities (AESWD).
The aggregate data is reported by class/group, school, district, and state.
The top section of each Item Analysis Report identifies the title of the report, the student population included in the report, the grade level, the assessment cycle, and the content area. The teacher name, class/group code, the school name and code, the district name and code, and the number of students assessed are provided.
The center section of each Item Analysis Report presents the following data for each multiple-choice item:
Released Item Number, the benchmark or GLCE being assessed, and the Item Type (core, extended core, linking, future core). The Fall 2007 Released Items documents for each grade level and content area are posted on the MEAP website at www.michigan.gov/meap. The Released Item Number for linking items references the previous grade level Released Items documents.
Percentage of students selecting each response is presented with a plus sign (+) denoting the correct response.
10

The last section of the Item Analysis Report presents the following data for each constructed-response or extended-response item:
Released Item Number, the benchmark or GLCE being assessed; mean score for the reported population; percentage of students achieving each score level on a constructed-response or extended-
response item; Number of student responses that received each Condition Code or Comment Code. The
condition codes and comment codes are not reported at the individual student level for the Fall 2007 assessments.
Condition Codes (student response receiving a 0 score) are:(A) Off-topic/Insufficient;(B) Written in a language other than English/Illegible;(C) Blank/Refused to respond;(D) No connection to the question (ELA only);(E) No reference to either reading selection (ELA only).
Comment Codes provide additional feedback to students and educators on the extended-response items in the ELA and social studies content areas. The numeric comment codes are defined on the reverse side of the Item Analysis Report.
Class Roster Reports provide summary score information by class for each strand and benchmark (GLCE) assessed in each content area, as well as detailed information for each student assessed. This report may include multiple pages to report all strands, benchmarks, and GLCEs.
The top section identifies the grade level reported, the assessment form used, the assessment cycle, and the content area. The teacher name, class/group code, the school name and code, and the district name and code are provided. A separate Class Roster Report is produced for each assessment form administered within a class/group.
The main section of the Class Roster lists each student’s name and identifying information. Each student’s scale score and performance level for the content area is reported. The following information for each benchmark is detailed by student:
benchmark or GLCE assessed; core type (for MEAP Grades 3-9: core, extended core, future core, or linking item); number of possible points; number of points earned by the student; Scores subtotaled by strand and core type (for MEAP Grades 3–9).
The last section reports the class/group mean score for each standard, benchmark (GLCE), strand, and core type.
1.5. Organizations and Groups Involved
1.5.1. Michigan Department of Education (MDE) Office of Educational Assessment & Accountability (OEAA)
11

A primary function of the Office of Educational Assessment and Accountability (OEAA) within the Michigan Department of Education (MDE) is to establish, develop, and conduct a state assessment system that fairly and accurately reflects the state’s content standards. These assessments include Michigan Educational Assessment Program (MEAP), MI-Access, English Language Proficiency Assessment, and in future years the Michigan Merit Examination (MME).
The OEAA staff directs the implementation of the statewide assessment programs. In addition to planning, scheduling, and directing all assessment activities, the staff is extensively involved in numerous item reviews, security, and quality control procedures.
OEAA is also responsible for assessment and accountability reporting, including the State of Michigan’s Education Yes!; the federal No Child Left Behind Act (NCLB); the National Assessment of Educational Progress (NAEP); special reports for legislators, educators, and other stakeholders; data for MDE programs and other state agencies; external research requests; the federal Individuals with Disabilities Education Act (IDEA).
1.5.2. Department of Information Technology (DIT)
Formed in October 2001 by executive order, the Department of Information Technology (DIT) was created to centralize and consolidate the technology resources in Michigan government. DIT’s strategic plan outlines five major goals:
expand Michigan’s services to reach anyone at any time from anywhere; transform Michigan services through sharing and collaboration; manage technology to provide better service and faster delivery; make Michigan a “Great Workplace” and the employer of choice for technology professionals; create a statewide community of partnerships.
Staff members from the DIT assist with preparing the draft School Report Card, including providing a process for reviewing and resolving appeals from elementary, middle, and high schools.
1.5.2.1. Department of Educational Technology
In March 2006, the MDE published the report Leading Educational Transformation for Today’s Global Society, which outlines Michigan’s educational technology plan. The report calls for leadership at all levels to meet the single goal: Prepare Michigan students to become productive citizens in a global society. The report specifies eight objectives with strategies, performance indicators, and action steps to focus current efforts and to utilize available state- level resources.
Objective 4 states: “Every Michigan educator will use data effectively for classroom decision making and school improvement planning through an integrated local and statewide decision support system.”
The Center for Educational Performance and Information will lead a collaboration of State of Michigan agencies to plan and implement comprehensive educational data management to meet federal and state reporting requirements and time lines.
12

1.5.3. Center for Educational Performance and Information (CEPI)
The Center for Educational Performance and Information (CEPI) collects and reports data about Michigan K–12 public schools. CEPI initiatives in data collection and reporting facilitate school districts’ compliance with NCLB and the MDE’s accreditation plan, Education Yes! CEPI is located in the Office of the State Budget.
State and federal laws require Michigan’s K–12 public schools to collect and submit data about students, educational personnel, and individual schools. Districts report their data to CEPI via the Michigan Education Information System (MEIS). These data are used for several purposes, including:
determining state aid payments; adequate yearly progress; accreditation, graduation/dropout rates; teacher qualifications; what constitutes a “safe” school.
CEPI maintains the State of Michigan’s database of school directory information, the School Code Master. The Report Card data that comes from the School Code Master includes:
names of superintendents and principals; school and district addresses and telephone numbers; e-mail and Web site addresses.
1.5.4. Contractors
1.5.4.1. Administration Contractor
In February 2005, the contract for the administration, scoring, and reporting of MEAP, MI-Access, and ELPA was awarded to Pearson Educational Measurement. The contract covers all assessment cycles for the 2005–6, 2006–7, and 2007–8 school years. Major Pearson Educational Measurement (PEM) activities include:
creating a schedule for the assessment administration, scheduling all tasks, subtasks, and activities to be conducted;
establishing and implementing required standard-setting processes; designing and constructing assessment forms; designing, proofing, and printing all assessment documents; packaging, distributing, and retrieving assessment materials; receiving, scanning, editing, and scoring the answer documents; scoring student responses; analyzing and managing item, form, and scoring element statistics; reporting student results; providing documentation and electronic data management.
1.5.4.2. Development Contractors
Measurement Incorporated was the development contractor for the MEAP from winter 2003 through Fall 2005. For the Fall 2005 administration, Measurement Incorporated provided the test forms, including items with item statistics and metadata.
13

In February 2005, Harcourt Assessment, Inc., was awarded the development contract for assessment items to be used for the MEAP administrations during the 2006–7, 2007–8, and 2008–9 school years. Assessment development work begins with selecting potential texts and writing an initial pool of items and prompts. Major Harcourt Assessment, Inc., activities include:
creating a coordinated schedule for item development and assessment development, creating all tasks, subtasks, and activities to be conducted;
inventorying existing assessment items and selecting and acquiring an item banking system used by the development contractor, the Item Development Team, and the OEAA;
developing and utilizing an accurate and secure method for transferring all data (including but not limited to items, statistics, committee decisions, and prompts) needed for items to be included in the field tests and operational assessments to, and from, the administration contractor;
organizing committee reviews of passages for use in assessment for content, bias, and sensitivity and selection of passages approved for use;
facilitating item writing by Michigan teachers consistent with the state curriculum standards, benchmarks, and expectations and the APA/AERA/NCME standards for educational and psychological testing (1999);
arranging informal item tryouts initially by item writers with small numbers of students; conducting committee reviews for content, bias, and sensitivity; analysis of item performance data;
and selection of items to be entered into the item pool for pilot testing; producing and managing systematic stand-alone pilot assessments with groups of approximately
100 students; developing, editing, and publishing subtests for embedded field-testing in operational assessments.
1.5.4.3. Subcontractors
Beck Evaluation and Testing Associates (BETA, now known as Questar Assessment, Inc.), working under a comprehensive plan with PEM, provides services for the MI-Access program. BETA services include:
development distribution standard setting scoring printing and distributing paper reports.
PEM scores the constructed-response items and posts reports to the Web site.
BETA coordinates myriad meeting activities required for the development and support of MI-Access.
BETA presented the recommended “cut” scores from the MI-Access standard setting committees to the Technical Advisory Committee and the State Board of Education.
Assessment and Evaluation Services (AES), working in coordination with PEM Psychometric Services, directed the technical services related to MEAP standard setting. AES presented the final recommendations for “cut” scores from the MEAP standard setting committees to the Technical Advisory Committee and the State Board of Education.
14

American Printing House for the Blind, Inc. (APH), under PEM subcontract, creates the Braille and enlarged print versions for the MEAP assessments. APH assists test developers, including state and federal departments of education, with best practices and appropriate accommodations for assessing blind and visually impaired students.
1.5.5. Educators
The purpose of the Michigan assessments is to accurately measure and report student achievement of the Michigan content standards—the MDE Benchmarks and Grade Level Content Expectations (GLCE). Testing procedures must be standardized in order to create a fair and equitable measure for all students. Educators who assist in developing and administering the assessments play crucial roles in helping to achieve fair and accurate student results.
The development of the Michigan assessments is a meticulous process involving thousands of Michigan administrators, teachers, and curriculum experts. The Michigan Revised School Code and the State School Aid Act require the establishment of educational standards and the assessment of students’ academic achievement. Accordingly, the State Board of Education, with the input of educators throughout Michigan, approved a system of academic standards and a framework within which local school districts could develop and implement curricula.
All current MEAP assessments are based on the Content Standards contained in the Michigan Curriculum Framework. The Michigan Curriculum Framework was developed after a review of the most current educational research and then released for a statewide field test review before State Board of Education approval in 1995.
The OEAA actively seeks the input and feedback in the development and implementation of assessment and accountability systems to further the educational goal of improving what students know and can do in relation to the state curriculum frameworks. Programs that utilize these committees include:
the MEAP, the assessment for most students in K–12 education programs throughout the State of Michigan;
the alternate assessment for students with disabilities (MI-Access); the English Language Proficiency Assessment (ELPA), a screening assessment for students new
to this country who have limited English proficiency.
This ensures that our assessments are high quality and gives Michigan educators a valuable professional development opportunity that increases their familiarity with the GLCEs and thereby enhances their teaching experience.
The MEAP offers field review opportunities in several locations around the state after the pilot tests are completed. These reviews give teachers an opportunity to go through the pilot tests in depth and offer feedback on the quality of the pilot tests and the items in the test booklets. These reviews are conducted under strict security and in confidentiality.
All committees use structured, nationally recognized processes for their work to ensure that the advice provided is clear, well documented, and efficiently obtained. The time and expertise of the committee members are valued. Below are brief descriptions of some of the key committees, their purposes, and characteristics of members.
15

Assessment Planning Committees are convened from across the state with members chosen to represent the educational professional organizations, OEAA staff, MDE curriculum staff, and local and intermediate school district educators. In the past, Assessment Planning Committees developed assessment blueprints as well as models or prototypes showing assessment developers, teachers, students, and the public the format and item types for future assessments.
Content Advisory Committees (CACs) review assessment items and key decisions to ensure that the content of items and tests measure important elements of the state curriculum frameworks in each subject and that each item is clearly worded for the students, has a best answer, and is factually consistent with the best knowledge in the field. Based on the advice of these committees and other key information, the OEAA will accept test items for use, drop items from further consideration, or edit items. Separate Content Advisory Committees are required for each subject tested and student age or grade span. Most committee members are very familiar with the subject, the related state curriculum frameworks, standards, benchmarks, and expectations, and hold detailed knowledge of the students being assessed. Some committee members have in-depth content expertise such as mathematicians who serve on the mathematics committee. Child development experts serve on several committees. The majority of the committee members must be current teacher experts at the grade and subject tested.
Bias and Sensitivity Committees (BSCs) review each text selection, item, and prompt for fairness, to assure that no group is unfairly advantaged or disadvantaged compared with any other group by any MEAP content. The committee rejects items that considers inappropriate, suggests revisions to some, and passes on the majority of the items to the next review committee.
Standard Setting Committees are charged with establishing performance levels that are used to report student results on the state assessments. For the MEAP, these committees developed the performance level descriptors (PLDs) and recommended cut scores for four levels. The standard setting committee is an advisory committee that looks at actual student assessments, item by item. The committee decides the performance level these assessment results represent, using clearly defined performance level descriptions, and discusses the rationale for the decision with the other committee members. The majority of standard setting committee members must be current teacher experts at the grade and subject tested. Other committee members include administrators, curriculum specialists, counselors, parents, and business leaders. Committees represent the geographic and ethnic diversity of the state.
Professional Practices Committee assisted with developing the document, Professional Assessment and Accountability Practices for Educators. This document, published in August 2005, presents the expected ethical conduct of educators who administer the assessments. For assessments to yield fair and accurate results, they must be given under the same standardized conditions to all students. Professional Assessment and Accountability Practices for Educators is intended to be used by districts and schools in the fair, appropriate, and ethical administration of the assessments.
1.5.6. Technical Advisory Committee
The Technical Advisory Committee (TAC) independently monitors all assessment development and implementation processes, including information gathered in field tests and review of item development.
16
The TAC may make recommendations for revisions in design, administration, scoring, processing, or use in the examination.
The TAC was first established in 1993 to assist the MDE in developing a high school proficiency assessment as a requirement for high school graduation as required by PA 118 of 1991. At that time, the purpose of the TAC was to assist the MDE in implementing provisions of the law. The TAC continues to be made up of individuals from Michigan and across the nation who are recognized experts in developing or reviewing high stakes assessment programs. The TAC advises and assists the OEAA to ensure the MEAP assessments are developed in keeping with technical guidelines that meet national standards.
1.5.7. Michigan State Board of Education
The State Board of Education provides leadership and general supervision over all public education, including adult education and instructional programs in state institutions, with the exception of higher education institutions granting baccalaureate degrees. The State Board of Education serves as the general planning and coordinating body for all public education, including higher education, and advises the legislature concerning the financial requirements of public education.
The State Board of Education established the standards at key checkpoints during Michigan students’ academic careers. The State Board of Education, with the input of educators throughout Michigan, approved a system of academic standards and a framework within which local school districts could develop and implement curricula. MEAP assessment results show how Michigan students and schools are doing when compared to standards established by the State Board of Education. MEAP assessments are criterion-referenced, meaning that the results are reported as performance against a standard. The standards are developed by Michigan educators and approved by the State Board of Education.
Chapter 2: Test Development
2.1. Test Specifications
17

As noted in the previous chapter, all MEAP tests are based on the model core academic content standards. A general description of development activities applying to all tests is provided below, followed by subject-specific descriptions.
MEAP staff, contractors, and Michigan educators worked together to develop the tests. The test development cycle included the following steps:
Item Writer Training Item Development Item Review Field Testing Field Test Item Review Operational Test Construction
2.1.1. Item Writer Training
Once item specifications are finalized, experienced contractors use customized materials to train item writers to produce items specifically for MEAP. Item Writer Training can last anywhere from three to five days and is conducted by contractor staff with MEAP staff oversight. The actual writing of items, including writers receiving feedback from contractor staff, takes anywhere from 4 to 8 weeks. All item writers are Michigan educators who have curriculum and instruction expertise and who have been recommended by their administrators. They also possess relevant degrees and experience, and many have previous experience in MEAP-specific item writing.
2.1.2. Item Development
The Michigan item writers draft test items in accordance with specifications approved by MEAP staff. Contractor staff then review the items internally and share them with MEAP staff for additional review. This internal reviews consists of meeting the following criteria:
Skill
Item measures one skill level.Item measures skill in manner consistent with specification.Item uses appropriate (realistic) level of skill.Item makes clear the skill to be employed.
Content
Item measures one benchmark.Item measures benchmark in manner consistent with specification.Item taps appropriate (important) aspect of content associated with benchmark.Item makes clear the benchmark or problem to be solved.
Relevance
Item calls for a realistic application of process to content.Item is not contrived.
18

Item is appropriate for the grade level to be tested.Item groups reflect instructional emphasis.
Accuracy
Item is factually accurate.Item contains only one correct or best response.If item pertains to disputed content, context for correct answer is clearlydefined (e.g., "According to... the correct solution is...").Item is unambiguously worded.
Format
Item contains no extraneous material except as required by the benchmark.Vocabulary is grade-appropriate and clear.Item contains no errors of grammar, spelling, or mechanics.Item responses are parallel and related to the stem.Item responses are independent.Item contains no clues or irrelevant distracters.Directions for responding to CR item are clear.CR item and rubric match.CR rubric is clear and easy to apply.Item is clearly and conveniently placed on the page.Item contains adequate white space for calculations as needed.Physical arrangement of item is consistent with benchmark or commonpractice (e.g., horizontal vs. vertical addition and subtraction, slash vs. horizontal fraction bar, notation, symbols, etc.).Keys for sets of MC items are balanced (i.e., equal numbers of A's, B's, C's, and D's).
Bias
Item is free of race and gender stereotypes.Item contains no material known or suspected to give advantage to any group.Item is free of insensitive language.Item sets that identify race or gender either directly or indirectly are balanced with reference to race and gender.Item content and format are accessible to students with disabilities.Item content and format are accessible to students with limited English proficiency.
2.1.3. Item Review
After the internal reviews take place, all MEAP items are reviewed by Michigan educators and/or members of a Michigan community that serve on one of two committees: Content Advisory Committee (CAC) or/and the Bias and Sensitivity Review Committee (BSC). Contractor staff train the CAC and BSC participants and facilitate the committee meetings. All items are typically first reviewed by the BSC and then the CAC.
19

An item rejected by the BSC may or may not get passed on the CAC for review. Each review is led by experienced contractor staff with MEAP staff in attendance, using prescribed guidelines and forms to indicate the final status of each item:
Accept: Each of the eight category conditions (importance, thematic, grammar, clarity, accuracy, validity, sound measurement, grade-appropriate) have been met or exceeded and the item appears suitable for field testing.
Modify: One or more of the category conditions have not been met or the item needs minor changes to make it acceptable. Reviewers provide recommendations on changes to be made to the item that will make the item suitable for field testing.
Reject: Several category conditions have not been met, or are suspect, or need radical changes to make the item acceptable. In such cases, the item may be vague or ambiguous, inappropriate, or not clearly related to the text or to the standard. Without severe modifications it is unlikely to be salvaged. Reviewers provide comments as to why the item should be rejected.
2.1.4. Field Testing
Items that have passed bias/sensitivity and content review are then eligible for field testing. MEAP field testing is carried out by embedding items in operational test forms.
2.1.5 Data Review
After field testing, contractor staffs analyze results and present them to the same groups listed under Item Review above (BSC and CAC). During these review committees, participants review the items with field test statistics. CAC members review performance data (percent correct, response distribution, raw score distribution, point biserial correlation with total score), while BSC members review data that would indicate differential item functioning (percent correct by group, chi-square and other statistics). Members have the option to accept or reject the item. In previous years, the Merit Award Board had final review authority over all test items. This function has recently shifted to the Office of Educational Assessment and Accountability (OEAA) within the Department of Education. Once items and their field test results have been presented to the OEAA and the OEAA has accepted them, they go into an eligible bank of items from which future operational tests may be constructed. Results from the Data Review meetings that occurred during the 2009-2010 administration cycle are discussed later in this chapter.
2.1.6 Operational Test Construction
Once items have been survived all reviews and field testing, they are placed in an item bank. Contractor staffs then select items from the bank that meet the test specifications (i.e., blueprint and psychometric specifications). They present these items to MEAP staff in several stages, first as one item per page, then as a draft formatted test, and finally as a final formatted test booklet. In this final stage, a spreadsheet accompanies the test, showing the item code, key, content standard, the statistical/psychometric information for each item, and the projected total test statistics.
2.2. Test Blueprints
20

This section provides an overview of the test blueprints for each subject and grade, accommodated materials, and item specifications that guide the building of the operational test forms. A comprehensive report of test blueprints is reported in Appendix A.
2.2.1 Test Structures for 2009 MEAP Content Tests
The 2009 MEAP assessment contains four content area tests: English Language Arts (ELA), mathematics, science, and social studies. The Reading and Mathematics tests span grades 3 to 8. For 2009, Writing was only administered in grades 4 and 7. Science is tested in grades 5 and 8, while Social Studies is tested in grades 6 and 9. The test structures are summarized in this section.
21

ELA
The MEAP English Language Arts Assessment is based on the Michigan GLCEs, which have been categorized as Core or Not Assessed at the State Level (NASL). ELA has been broken into two tests, Reading and Writing. Reading is assessed at grades 3-8 and Writing is assessed at grades 4 and 7. Each form of the Reading assessment includes a pair of related texts along with independent items and cross-text items. There are also independent texts. Texts are assessed using both multiple choice items and 3-point short answer items. The Writing assessment includes student writing samples, each with a set of multiple choice items. Students write a response to a student writing sample and to both a Narrative and Informational writing prompt. The Core designations of the GLCEs are available in the English Language Arts Assessable GLCEs document. The Reading assessment consists of three parts. (See Appendix A for ELA test blueprints). The field test portion generally makes up Part 3 of each form. The Writing assessment consists of five parts, with field test making up Parts 1 and 2. For both Reading and Writing assessment, one core form and 7 FT forms were constructed. The core and FT forms are identical across grades. The test structures for ELA forms are summarized in Tables 2.2.1.1 through 2.2.1.4.
Table 2.2.1.1 Test Structure for the Fall 2009 Grades 3-8 ELA Core Tests
Table 2.2.1.2 Test Structure for the Fall 2009 Grades 3-8 Reading FT Tests
Grade # MC Items # CR Items# Total FT per Grade
3-8 22 2 24
Table 2.2.1.3 Test Structure for the Fall 2009 Grades 4 and 7 Writing FT Tests
Grade # MC Items # CR Items# Total FT per Grade
4, 7 8 1 9
Mathematics
The MEAP Mathematics Assessment is based on the Michigan GLCEs, which are categorized as Core, Extended Core, Not Assessed at the State Level (NASL). Each mathematics form includes a common set of two MC items per Core GLCE, or one per Extended. Each form consists of two parts. Part 1 is the non-calculator part of the form with Part 2 containing the calculator portion. All Grade 3 items are non-
22
Grade # MC Items # CR Items # Total Core
3-8 30 1 31

calculator items. For 2009, the core forms for Mathematics consisted of common items plus one of two sets of matrix items. In addition, 7 FT forms were constructed. The test structure for grades 3 through 8 mathematics assessment forms is summarized in Table 2.2.1.4.
Table 2.2.1.4 Test Structure for the Fall 2009 Grades 3 through 8 Mathematics Core Tests
Grade # Core # Total Core
# FT # Field TestPer FormMC CR Extended MC CR
3 32 0 13 45 8 0 84 40 0 13 53 9 0 95 32 0 20 52 10 0 106 38 0 14 52 9 0 97 38 0 15 53 10 0 108 40 0 11 51 8 0 8
Science
For Science tests, each form consists of core and FT items. One core form and 7 FT forms were constructed for elementary school and middle school. The test structure for science tests is summarized in Table 2.2.1.5.
Table 2.2.1.5 Test Structure for the Fall 2009 Science Tests
Grade # MC Items
# CRItems
# Total Core # Field Test Item5 51 0 51 108 57 0 57 11
Social Studies
For the Social Studies tests, one core form and 7 FT forms was constructed for elementary school and middle school. The Grade 6 FT items were developed to the new Grade Level Content Expectations (GLCE) for grades 3-5. The Grade 9 FT items were developed to the new Grade Level Content Expectations (GLCE) for grades 6-8. The test structure for the social studies tests is summarized in Table 2.2.1.6.
Table 2.2.1.6 Test Structure for the Fall 2009 Social Studies Tests
Grade # MC Items # CR Items # Total Core # Field Test Item
6 40 0 40 159 40 0 40 15
23

Accommodations
Each operational test is available to students who require accommodations according to their IEP. Tests are available in Braille, large print, and audio CDs. For tests with embedded field test items, Form 1 of the test is the basis for the audio versions. All test forms are converted to large-print, however, Braille tests are typically the Form 1 and may or may not include field test items. For Fall 2009, unique Braille forms were administered for both Reading and Math. Given the nature of the Reading tests, these tests are not provided as tapes or audio CDs. Tests with accommodations are administered during the same testing window as the regular operational tests.
2.3. Review of Field Test Items Provided by Development Contractor
This section provides an overview of the review of field test items provided by the development contractor. Specific item review process at various test development stages are described in other sections of Chapter 2.
2.3.1 Tabulations of Item Characteristics
Tables 2.2.1.1 to 2.2.1.6 and Tables 2.8.1.1 to 2.8.1.6 provide the tabulations of item characteristics by assessments, including content area, type of item (core, extended core, etc.).
2.3.2. Item Specifications
MEAP employs Standards for Educational and Psychological Testing (AERA, APA, NCME, 1999) as a primary source of guidance in the construction, field testing, and documentation of the tests. The introduction to the 1999 Standards best describes how those Standards are and was used in the development and evaluation of MEAP tests: Evaluating the acceptability of a test or test application does not rest on the literal satisfaction of every standard in this document, and acceptability cannot be determined by using a checklist. (Standards, p. 4) Thus, the terms ‘target’ and ‘goal’ are used when referring to various psychometric properties of the tests. For example, while it is a goal of test development for each high school test to have a reliability coefficient of .90 or greater, it is not our intention to scrap a test with a reliability coefficient of .89. Instead, the test results would be published, along with the reliability coefficient and associated standard error of measurement.
2.3.3. Item Statistics
Because the MEAP tests are used in making individual decisions about students, they must be very reliable, particularly at cut points (the score points that separate adjacent achievement categories). Particularly at the middle and high school level, because Merit scholarships are involved, the reliability at the scholarship cut score must be very high. Target reliability coefficients of .90 (or higher) are therefore set for each test. Other psychometric properties include item difficulty, item discrimination, and differential item functioning. General statistical targets are provided below:
For Multiple-Choice (MC) Items
Percent correct: between 25 and 95 percentPoint biserial correlation with total score: .20 or greater
24

Mantel-Haenszel: Few Category C items
For Constructed-Response (CR) Items
Difficulty: any level as long as all score points are well representedCorrelation with total score: .30 or greater by-group statistics and score distributionsGeneralized Mantel-Haenszel: Few chi-square significant at .05 level of alpha
It should be pointed out that the point biserial correlations for MC items and the correlations for CR items assume embedded field testing and employ the base test total score, which is independent of the field tested item. These correlations refer to total scores with the influence of the item in question removed.
2.3.4. Differential Item Functioning
Items that disadvantage any identifiable subgroup of students are said to be biased and detract from the validity of the tests. While only human judges can determine whether or not an item is biased, item statistics can serve as a tool to help judges in their decisions. After field testing, the BRC reviews item statistics that detect differential item functioning (DIF). Specifically, Mantel-Haenszel statistics are used as measures DIF.
2.3.5. Data Review
As mentioned previously, once field testing is completed contractor staff analyze results and present them to the CAC and BSC committees for review. The CAC and BSC committees receive training on how to interpret the statistics presented to them. Statistical flags are also set for the committee members to draw attention to items that may not be performing as expected. The DIF statistics comparing Males with Females and White with Black students is converted into a user-friendly flag of A (no DIF), B (possible DIF), or C (probable DIF). Low point-biserial correlations (<.25) and p values (<.25) are signaled as well to draw committee members’ attention to items that do not connect well with other items on the test or may be too difficult.
Using DIF information, Michigan content standards (CAC committee only), and expert judgment, committee members vote to accept or reject items. For more detailed information concerning DIF statistics, please refer to Chapter 10, Section 10.3.1.
2.4. Pre-Field-Test Item Review
2.4.1. Contractor Review
The item-writing process begins during the summer. Pearson conducts either one or two training sessions, depending on the content area, to train teachers to write high quality items. The item writers work on items between those meetings, if applicable, with Pearson providing feedback as much as possible. Once the items have been submitted by the item writers and are back with Pearson content staff, the items are sent through various internal review rounds
Once this is completed, Pearson prepares the items for the first committee review meetings, which typically occur in the early fall. The committees consist of a face-to-face Bias/sensitivity Committee
25

(BSC) Review meeting (involving 10-15 Michigan educators) and a Content Advisory Committee (CAC) Review meeting (involving roughly the same number of educators). The BSC meetings may last from one to three days, while the CAC meetings typically last from two to four days. Groups are often broken out by grade span which allows grade-level educators to spend more time focusing on the nuances of each item and tweak them as they see fit.
After this round of reviews, items are approved by OEAA staff. Pearson then incorporates all changes into the items and prepares them for field testing.
When all changes have been incorporated into the items following this round of reviews, the items are ready to field test. They are placed on forms, reviewed internally again, sent to the OEAA for review, returned to Pearson for editing and revision, returned to the OEAA for sign-off, and reviewed for overall quality control one final time before they are sent to Pearson for printing.
2.4.2. OEAA Review
The Michigan item writers draft test items in accordance with specifications approved by MEAP staff. Pearson staff then review the items internally and confer with MEAP staff for additional feedback and approval. MEAP and Pearson staffs work very closely to ensure the items that are of the highest quality possible. These reviews, both internal and by OEAA staff, meet the following criteria: skill, content, relevance, accuracy, format, and bias. Detailed criteria reviewed by OEAA are provided in section 2.1.4.
2.5. Field Testing
2.5.1. Field Testing Design
OEAA conducts field testing by embedding matrix-sampled field-test items within multiple forms of operational assessments such that each field-test item appears on only one operational form, unless otherwise decided by OEAA. Field testing is conducted in such a way as to minimize the number of answer documents that must be produced (e.g. different answer documents are required when field testing open-ended items versus multiple choice items). The number of forms and embedded field test items is given in Table 2.5.1.
26

Table 2.5.1 Number of Forms and Field Test Items by Subject and Grade
Subject Grade # of formsTotal # of field test
items
Mathematics
3 7 564 7 635 7 706 7 637 7 708 7 56
Reading
3 7 1684 7 1685 7 1686 7 1687 7 1688 7 168
Science 5 7 708 7 77
Social Studies6 7 1059 7 105
Writing 4 7 637 7 63
2.5.2. Field Testing Sampling
Because OEAA employs pre-equating (the use of fixed item parameters from field testing) as a critical part of its equating and scaling methodology in grades 3-8, it is critical that field test items be calibrated with operational items in such a way that the pre-equated item parameters represent those parameters that would result were the field test items administered to all students. To assure this outcome, the multiple operational forms were randomly distributed to buildings using a stratified random sampling plan. The sampling plan identifies three strata within which a random assignment of Forms 1 through 7 should be made. Inherent in the design is that every building in the State will be identified as a Form 1, 2, 3, 4, 5, 6, or 7 building. No building should have to deal with any Initial Form that is different from this assignment (Of course, the Makeup and Accommodated forms, will not carry the building's designated Form number). Stratum I includes Detroit, Utica and Grand Rapids. Detroit has 27 buildings with ninth-grade students, who would be expected to take the social studies assessment. Grand Rapids has six, and Utica has seven. This is a total of 40 schools in these three districts that house ninth-grade students, or four schools per form of the social studies tests. Because of the diverse characteristics of these district populations, we would select four buildings in the Stratum to receive each given form of the ninth-grade social studies test booklets. There are so many elementary and middle schools in these districts that a random assignment of forms should ensure that a representative cross section of students will take each form.
27

Stratum II consists of seven districts with demographics that warrant special consideration for receiving more than one form. Flint, Saginaw, Highland Park, Muskegon Heights, Plymouth-Canton and Holland are each notable for their unique demographics. They should receive specific consideration for forms distribution, given multiple forms (randomly assigned) for each district but again having only one form assignment for a building. Dearborn schools are also in this stratum but will require slightly different handling due to the high proportion of Arabic students who are also ELLs in selected schools. After consulting internally and with Shereen Tabrizi of Dearborn Public Schools, it was determined that the following schools within the Dearborn district will be pre-designated as form 1 schools: Maples, McDonald, Salina International, Lowrey, Lowrey MS, Becker, McCollough. The rest of the Dearborn schools are to be assigned forms 2-7. In addition, 100 extra form 1s, per grade and content area, will be sent to the Dearborn Schools Central Office care of Shereen Tabrizi. Dearborn has been instructed to be proactive in the ordering of the other materials they will need for the ELL accommodations from MI.
Stratum III consists of all of the remaining districts. Each district should receive only one form of each test across all buildings within a given district. In other words, a district would receive the same form number for all of the assessments. These numbers should be assigned at random. For example, Ann Arbor Schools might be a "Form 3" district, with Form 3 being assigned to all grades of ELA, mathematics, science and social studies across the entire district.
It is critical that within strata 1 and 2 that all sampling be done without replacement according to the defined parameters of the strata. That is, the sampling plan will be carried out in such a way that the forms are distributed according to the stratum specific rules while also ensuring that all forms are distributed before a second school within a district can receive a given form that had already been assigned to another school within that district.
Stratum II was built upon the following variables where the MEAP was administered in previous years (some schools and grades did not previously administer the MEAP):
Percent limited English proficiency in the school building Percent ethnicity in the school building Total number of students
The stratified random form assignment process is summarized as follows. For each grade, for each subject (take Math for example):
1. Compute “population values” across all forms for all variables of interest: percentage of limited English proficiency; percentages of white, black, Hispanic and others for ethnicity.
2. Randomly assign form to each school.
3. Compute the same set of statistics (see step 1) for each form; also compute the sample size for each form
4. Compute the sum of the absolute difference between population values and sample values.
28

5. Repeat steps 2 through 4 for 5,000 times and pick out one sample - criteria are: (1) smallest difference between population values from step 1 and sample values from step 3 across the variables; (2) similar sample sizes across forms
The results of that matrix sampling are displayed in Appendix B. Statistics in Appendix B shows that the sample sizes across forms are relatively even, and the “form values” are very closely matched with the “population values”. The stratified random form assignment has been successfully achieved.
2.6. Data Review
After field-test administration, item analyses were conducted to prepare data for two more rounds of reviews: bias/sensitivity review and content review. This section describes data for the two reviews and these two post-field-test reviews.
2.6.1. Data
All field-test items were embedded in the live test forms for each test. After the calibration of live test forms, field-test items were calibrated and put onto the same scale as the live operational items. Appendix C lists all the statistics created for the field-tested items. The statistics for each field-test item can be summarized into nine categories.
1. General test information: test name, subject, grade, level; 2. Administration related information: year cycle, administration year, released position; 3. Specific item information: MEAP item ID, CID, item type, answer key, maximal score, maturity,
item function, character code, number of forms the item appears on, form numbers, test position, n-count (total, male, female, white, and black students), percent for each comment code, percent for each condition code;
4. Content-related information: strand, benchmark, grade level expectation, depth of knowledge, domain, scenario;
5. Option analysis: percent for each option and each score point (total, male, female, white, and black students), p-value or item mean (total, male, female, white, and black students), adjusted p-value, difficulty flag, item standard deviation, item-total correlation, biserial/polyserial correlation, corrected point-serial correlation, item-total correlation flag, option point-biserial correlation, flag for potential miskeying;
6. DIF analysis: Mantel Chi-square, Mantel-Haenszel Delta and its standard error, signed and unsigned SMD, SMD signed effect size, DIF category, and favored group for male vs female comparison and white vs. black comparison;
7. IRT parameters: b-parameter and its SE, step parameters and their respective SE, item information at cut points;
8. Fit statistics: mean-square infit, mean-square outfit, mean-square fit flag, misfit level;9. Data for creating plots: conditional item mean for decile 1 to 10 for each student group (total,
male, female, white, and black students) for creating conditional mean plots, 5th, 25th, 50th, 75th, 95th percentile for creating Box & Whisker plot for each student group (total, male, female, white, and black students) for each option and each score point.
These statistics were created by Measurement, Inc. and sent to Pearson for creating item labels for bias/sensitivity review and content review.
29

2.6.2. Statistics Prepared for Review Committees
Statistics from item analyses for field-test items were used to create item labels for the Data Review meetings. Different sets of statistics were prepared for MC and CR items for review committee. Table 2.6.2.1 displays all the statistics prepared for MC items for review committee. These include six categories.
1. General administration information: test name, grade, subject, and administration time;2. Item general information: CID, maturity, forms and positions;3. Item specific information: item type, key, p-value, n-count, Rasch difficulty, difficulty flag,
point-biserial correlation, point-biserial correlation flag, fit flag, option quality flag;4. Breakout group descriptives and optional analysis: percent of students selecting each option and
omit, option point-biserial correlations, and n-count for all and subgroups: male, female, white, and black students;
5. Differential Item Functioning: flag, and favored group for male vs. female and white vs. black;6. Review decision;
Table 2.6.2.2 displays all the statistics prepared for CR items for review committee. These include seven categories.
1. General administration information: test name, grade, subject, and administration time;2. Item general information: CID, maturity, forms and positions;3. Item specific information: item type, maximal score point, adjusted p-value, item mean, n-count,
Rasch difficulty, difficulty flag, item-total correlation, item-total correlation flag, fit flag, score point distribution flag;
4. Breakout group descriptives and score point distribution: percent of students obtaining each score point and omit and n-count for all and subgroups: male, female, white, and black students, omit point-biserial correlation;
5. Invalid code distributions: total invalid scores, frequency of students at each invalid code;6. Differential Item Functioning: flag, and favored group for male vs. female and white vs. black; 7. Review decision;
All statistics prepared for review committee for MC and CR items are explained in Appendix D. When the p-value for an MC item, or adjusted p-value for a CR item, or Rasch difficulty was out of the desired range, a difficulty flag was shown. When point-biserial correlation for an MC item or item-total correlation for a CR item was out of range, a point-biserial or item-total correlation flag was shown. If the mean square infit or outfit was out of desired range, a mean-square infit or outfit misfit flag was produced. If the DIF level for male vs. female or white vs. black comparison was higher than moderate, a DIF flag was turned on. When options did not function well or score point distribution was abnormal, a miskey flag was produced. The criteria used for flagging an MC or CR item are presented in Table 2.6.2.3.
30

Table 2.6.2.1 Item Label for a MC Item
MEAP Grade: 3 Subject: Math Admin: 2009
CID: 100000160320 GLCE: M.PS.02.02 □ Accept as isForm: 0903 □ Reject
Position: 9 □ Accept with revisionPassage:
Item Information
Type: MC P-value: 0.82 Difficulty Flag:
Key: C N-count: 15523 PB Correlation: 0.32 PB Correlation Flag:
Maturity: FT Option Quality Flag:
Breakout Group Descriptives and Option Analysis
N-countPercent of Students Selected Option
A B C D Omit
Gro
up
All 15523 11 7 82 * 0Male 7833 12 6 82 0
Female 7690 10 8 82 0White 10202 8 4 87 0Black 3725 17 14 69 0
Option PB Correlations -0.17 -0.28 0.32 -0.04
Differential Item Functioning
Reference/ Focal Group
Male/ Female
White/Black
Flag A BFavored
Group WHITE
GLCE Description:
Compare, add, subtract lengths
31

*Note: IRT statistics were not provided during the most recent data review (February 2010).
32

Table 2.6.2.2 Item Label for a CR Item
MEAP Grade: 3 Subject: Reading Admin: 2009
ID: 100000234324 Maturity: FT □ Accept as isForm: 0905 □ Reject
Position: 40 □ Accept with revisionPassage: Grandfather Buffalo
Item Information
Type: CR Adj. P value: 0.58 Difficulty Flag:Max: 3 Item Mean: 1.74 Item-Total Corr: 0.47 Item-Total Corr Flag:
N-count: 1981 Score Point Dist. Flag:
Breakout Group Descriptives and Score Point Distributions
N-count Item Mean
Percent of Students at Each Score Point0 1 2 3 4 5 6 Omit
Gro
up
All 1981 1.74 13 27 30 29 0Male 1006 1.66 15 28 31 26 0
Female 975 1.82 11 26 29 33 0White 1464 1.85 10 27 30 33 0Black 308 1.33 23 30 29 15 1
Omit PB Correlation -0.08
Condition Code DistributionPercent of Students at Each Condition Code
A B C D0 0 0 13
Differential Item Functioning
Reference/ Focal Group
Male/ Female
White/Black
Flag AA BBFavored Group WHITE
GLCEDescription:
Retell in sequence the major idea(s) and relevant details of grade-level narrative and informational text.
*Note: IRT statistics were not provided during the most recent data review (February 2010
33

Table 2.6.2.3 Flagging Criteria
Statistic Flag Flag Definition Flag Field
PVALPVAL
ADJPVAL
PLPHBLBH
For MC 4 options, if p-value LT .3 (PL) or GT .9 (PH)For MC 3 options, if p-value LT .38 (PL) or GT .9 (PH)For CR items, if adj. p-value LT .10 (PL) or GT .9 (PH)
DIFFICFL
ITOT CL If item-total correlation LT 0.25 (CL) ITOTFL
DIF_MFDIF_WB
ABC
AABBCC
For MC items:A: If either |MH Delta| is not significantly GT 0 (p < 0.05,
using either MH-Chi-Sq or standard error of MH Delta) or if the |MH Delta| is LT 1
B: If |MH Delta| is significantly GT 0 and is either GE 1 and LE 1.5 or is GE 1 but not significantly GT 1 (p < 0.05, using standard error of MH Delta )
C: If |MH Delta| is both GT 1.5 and significantly GT 1 (p < 0.05, using standard error of MH Delta)
For CR items:AA: If the Mantel Chi-Sq is not significant (p > 0.05) or the |
Effect Size| (ES) of SMD LE 0.17BB: If the Mantel Chi-Sq is significant (p < 0.05) and the |ES|
is GT 0.17 but LE 0.25CC: If the Mantel Chi-Sq is significant (p < 0.05) and the |ES|
is GT 0.25
DIF_MFDIF_WB
Categories A and AA are
not displayed in flag field
A, B, C, DM, S5, S6, O
APBBPBCPBDPBOPB
HLPONB
For MC items:If the keyed option is not the highest percentage (H)If any option LE 2% (L)If any non-keyed option pb-corr GT 0 (P), or if omit pb-corr
GT 0.03 (O)If the keyed option pb-corr LT 0 (N)
For CR items:For CR, if omit pb-corr GT 0.03 (O)For CR, if any score point LT 0.5% (L)For CR, if omit GT 20% (B)
MISKFL
*Note: IRT statistics were not provided during the most recent data review (February 2009).
Meaning of Flags:
PL … p-value low H … highest percentage is not a keyed optionPH … p-value high L … low percentage of any optionCL … correlation low between item and total
P … positive pb-correlation for any non-keyed option
A or AA … no or negligible DIF N … negative pb-correlation for the keyed optionB or BB … moderate DIF O … omit has a positive pb-correlationC or CC … substantial DIF B … blanks are over 20%
34

35
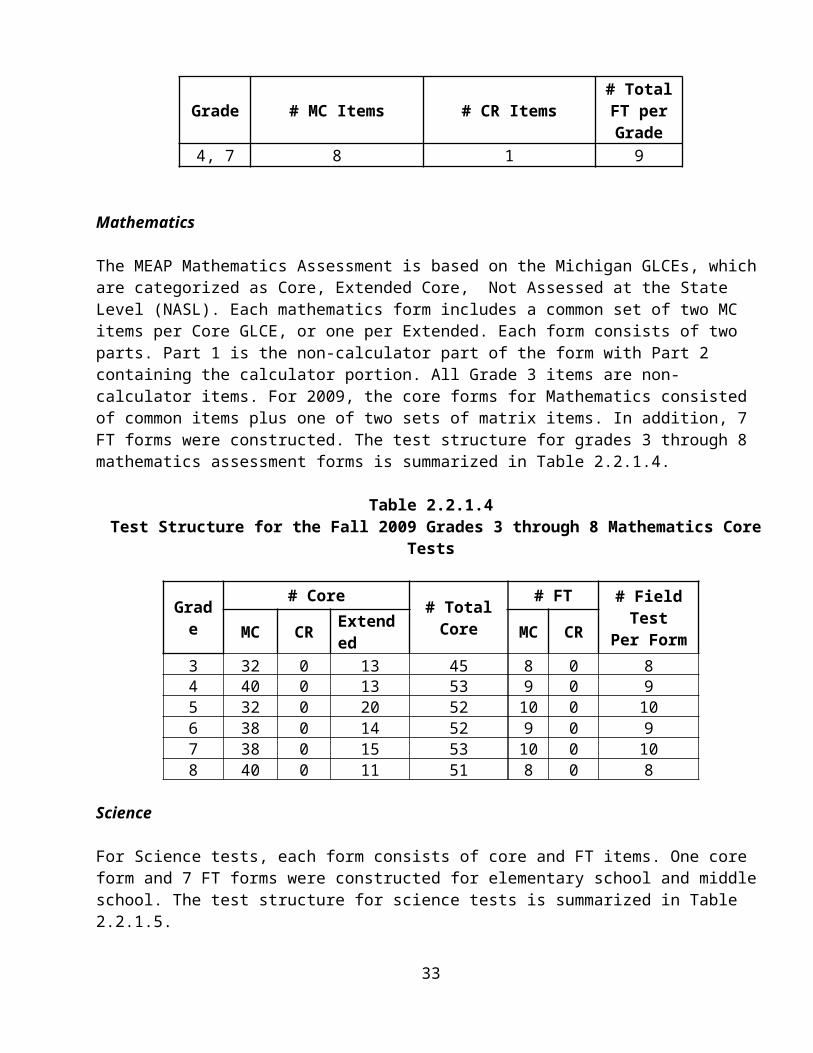
2.6.3. Data Reviews
2.6.3.1. Bias/Sensitivity and Content Advisory Committee Review
Pearson planned and conducted Bias/Sensitivity committees (BSC) followed by Content Advisory committees (CAC) on field tested items that were flagged either because of Differential Item Functioning (DIF) or any other content related item property (see flagging criteria on Table 2.6.2.3). The goal of these committees was to identify items that are eligible to be used as scorable items in future operational assessments. In these meetings, items may be either: a) accepted “as is” or b) rejected,
The administration contractor (Measurement, Inc.) scored the field test items and provided data analyses that are necessary for BSC and CAC meetings. Pearson assembled all materials for the meetings including the items, data and analyses of the items, agenda, training materials, security agreements, sign-in sheets, and the necessary records for committee sign-off on each item. Pearson conducted the meetings after obtaining approval from the OEAA on the agenda, training, and process. The first part of the item book contained items that were flagged for BSC reviews and the second part contained items flagged for CAC reviews. Some of the items for BSC reviews may have been also flagged for CAC reviews. Pearson completed a comprehensive report summarizing the results of these meetings including attendance, decisions on each item, data and statistical analyses, and final disposition of the items.
Pearson prepared items following field testing for reviews by a Bias/Sensitivity Committee and a Content Advisory Committee. Each committee met for face-to-face meetings lasting anywhere from a half day to one or more days depending on the number of flagged items. The reviews were guided by checklists to ensure that the items meet the criteria for inclusion in the item bank and for potential use on future examinations. Pearson reviewed the flagging and review criteria with the OEAA to be sure that all nuances of acceptability are captured correctly. The item statistics for each item were presented, along with a general orientation to interpretation and use of the data in item approval.
2.6.3.2. Summary Tallies
During Data Review, field-test items were scrutinized by both the BSC and CAC participants. One of two decisions was made for each item: accept or reject. The summary of the committee decisions based on item type regarding all the items is presented in Table 2.6.3.2.1 for bias/sensitivity review and Table 2.6.3.2.2 for content review.
36

Table 2.6.3.2.1Bias/Sensitivity Review Summary for Item Type after Field Test
Reading
Grade FT Items Flagged Item Accept#MC #CR #Total #MC #CR #Total #MC #CR #Total
3 154 14 168 13 4 17 11 4 154 154 13 167 6 1 7 6 1 75 154 14 168 6 4 10 6 4 106 154 14 168 23 6 29 21 6 277 153 14 167 12 7 19 12 6 188 154 14 168 31 4 35 30 4 34
Math
3 56 - 56 7 - 8 7 - 74 63 - 63 8 - 8 8 - 85 70 - 70 10 - 10 10 - 106 61 - 61 8 - 8 8 - 87 70 - 70 7 - 7 7 - 78 56 - 56 3 - 3 3 - 3
Social Studies
6 91 - 91 7 - 7 7 - 79 97 - 97 12 - 12 11 - 11
Science5 68 - 68 4 - 4 4 - 48 76 - 76 7 - 7 7 - 7
Writing4 16 7 23 3 0 3 3 - 37 16 7 23 2 2 4 2 2 4
37

Table 2.6.3.2.2Content Review Summary for Item Type after Field Test
Reading
Grade FT Items Flagged Item Accept#MC #CR #Total #MC #CR #Total #MC #CR #Total
3 154 14 168 40 0 40 18 - 184 154 13 167 33 0 33 16 - 165 154 14 168 47 0 47 32 - 326 154 14 168 55 0 55 37 - 377 153 14 167 49 0 49 32 - 328 154 14 168 58 0 58 45 - 45
Math
3 56 - 54 12 - 12 12 - 124 63 - 63 23 - 23 21 - 215 70 - 70 25 - 25 25 - 256 61 - 61 22 - 22 21 - 217 70 - 70 15 - 15 14 - 148 56 - 56 23 - 23 23 - 23
Social Studies
6 91 - 91 48 - 48 36 - 369 97 - 97 51 - 51 42 - 42
Science5 68 - 68 26 - 26 14 - 148 76 - 76 27 - 27 24 - 24
Writing4 16 7 23 10 5* 10 9 - 97 16 7 23 11 5* 11 9 - 9
*No Writing CR items were taken to data review since the content flagging criteria were determined to be irrelevant.
38

2.6.4. Item Revision Procedures
It is Pearson’s policy to leave post-field test items as intact as possible since they have data attached. Making major changes can negate that data. However, there are circumstances where the item may be revised.
Generally, the data review committee participants examine the items and either accepts them as is or rejects them. Occasionally, committee members suggest minor revisions that could improve the clarity or quality of the item. The OEAA must approve of any changes to the item, and if the committee or the OEAA believes that significant changes are required to improve the item, it is rejected as ready for operational use.
The committee’s recommendations are brought back to Pearson and entered into the system. At this time, the field tested items are available for use on operational forms. Items selected for operational use will be composed and reviewed by Pearson staff, then sent to the OEAA for review. Minor changes may be requested as the items are considered as a group. Once Pearson has made these revisions and the OEAA has approved the form, the Pearson quality assurance team reviews the form one final time before it is sent to the printer.
39

2.7. Item Banking
2.7.1. Procedures
Introduction
Pearson developed a secure item bank for grades K through 12 in the areas of Mathematics, English Language Arts, Science and Social Studies for OEAA. OEAA desires an electronic item bank software application that includes search, preview, and reporting functionality. They also desire this application to be secure (maintained by a password and other controls to be used for statewide high-risk assessment preparation).
Existing Architecture
File Maker Pro 7.0 software runs the Item Bank application. A Pearson developed Item Bank prototype has been modified to meet these requirements. The application runs as a secure web site. File Maker Pro 7.0 is a relational database with multiple tables. Each item and its assets are stored as an individual record.
Populate the Item Bank
A unique, seven-digit Corporate Identification Code (CID) was assigned to each item. All passages were assigned a unique passage code. The source word document was a compilation of each item, and associated passage if applicable, at a designated grade level and status. To prepare for the population into the item bank, each item was saved as an individual word document.
The individual word documents were converted to three formats: .pdf, .gif, and .txt. The .pdf file is used to build reports. The .gif format displays the item as it appeared in the most recent test administration. The .txt document is stored, but not visible to the user, in order to perform a search on any character within the item.
Data is imported in the Item Bank via Microsoft Excel spreadsheet. A unique relationship for all assets is defined by the Corporate Identification Number (CID). Image files are imported directly from the folders which they are grouped.
Data Verification Process:
Check for modifiable fields (exception is Comments field) Export data from FileMaker tables (into Excel or Access)
o Look for blank fieldso Look for duplicateso Look for anomalies in datao Assign a second reviewer to check data
Compare counts to prepared list
Quality Control Procedures for Item Bank
QC of Items: A hard copy of every item should be available, typically from the test booklet or final PDF.
40

A comparison of each item should be done by comparing the test booklet data and preview with the item text on the data screen and preview in the Item Bank for each item.
The hard copy from the book will only show the reviewer the stem, art, and options. The item text (on the Item Data screen) will not contain any formatting. The actual content
should be verified as correct. Use the Test Define to obtain the Metadata information for each item. The form number will be stored in the statistics table and should be checked during the QC of the
statistics. The Item Status and the "Item Not Appropriate" field information will be verified against the
“Released Position” field in the Test Define.
QC of Passages: A hard copy of each passage should be available (test booklet or final PDF). A comparison of each passage should be done by comparing the hard copy and preview with the
text on the passage data screen and preview in the Item Bank for each passage. The passage text (on the passage data screen) will not contain any formatting. The actual content
will be verified as accurate. Text should include titles; subtitles; by-lines; captions for photos, illustrations and drawings; titles and subtitles for photos, illustrations and drawings; footnotes; numbers; text and numbers within a graph, table or chart.
The metadata that is associated with a passage (passage title, author, word count, etc.) should be verified against the source document that was used to populate the item bank. This will be accomplished by comparing the source document with an exported list of these fields from the item bank for accuracy and completeness.
QC of Passages and Related Items: The Test Define is the source document to verify that all passages in the item bank are related to
the appropriate items. View each passage in the bank to verify that all appropriate items are linked to their respective
passage.
QC of Metadata: Export item metadata out of the item bank, import the data into an external database (Access),
and perform queries (null, unmatched, duplicate, and cross tab) to verify the data is linked together properly and that all data is accounted for.
Missing data must be populated before a final stats QC can take place. Once missing data has been accounted for and statistics have been populated, perform searches based on administration (year and season), grade, and form number. Verify counts against Test Defines for actual count of item type, item designation, and sequence numbers.
Compare the test booklets to the found set in the item bank. Test defines may also be cross-referenced at this time. In comparing the representation of the item in the item bank to the test booklets, the IBC should focus on:
o Year, Season, Form, CID, MEAP Item Code, Grade, Item Type, Art, Passages, Item Designation (CR or FT), Item Status, Item Not Appropriate, Item Preview, and Correct Answer (Item vs. Item Preview screens, Item vs. Stats screen).
41

QC of Statistics: Use the file from Psychometrics that contains all statistical information to QC the statistics
information. This is the statistical data received from Measurement, Inc. Export the records from the item bank (CID and all stats) into an external database (Access) and
compare it with the file provided by Psychometrics. Any missing data, duplicate data, or anomaly in any of the fields is an indication that further review and verification is needed.
QC of Functionality: Verify that the item bank functions as required:
o Fields that should be searchable or modifiable should have that functionality o Linking between tables of the item bank o Built-in search functions, such as viewing items associated with a passage, etc.o Verify that selected sets can be saved and exported from the bank.
A test-run of all reports should be executed to verify accurate performance. Verify that the saved forms, selected items, and found sets have been cleared before the final
compile.
2.7.2. Data Included in Item Bank
The data included in the item bank is the same as the data prepared after field test administration. Please refer to section 2.6.1 to get detailed information. Summary tallies of items available at each stage of maturity for each grade, subject, and content standard are presented in Appendix E.
2.7.3. Description of Item Bank
This section describes the functional capabilities of the File Maker Pro-based Item Bank. The Functionality sections of this document address the objectives that must be met for the item bank. The sections are organized to correspond with the functional areas of the bank for which the Pearson Information Technology Department is responsible.
IntroductionAn item bank performs three broad functions: (1) it acts as a repository for test items, passages, statistics, and associated attributes, such as metadata and art; (2) it permits the selection of items for test construction by multiple search criteria; and (3) it can generate a number of basic reports.
This document will discuss the functionality of these three aspects of an item bank.
Item Bank Use
The Item Bank is designed to offer three distinct functions:
Data Repository Test Construction Report Creation
The Data Repository is divided into three sections, with each section holding specific types of data:
42

Items Passages Statistics
In addition to each section of the Data Repository offering direct access to the data in that section, each is also linked to other sections based on the relationships between sections. Figure 2.7.3.1 shows the relationships.
Figure 2.7.3.1Data Repository Relationships
The user has the flexibility of beginning a task in any section. The links between sections allow the user to explore the available data based on customized criteria. For example, a user can begin searching in the Passages section using a specific set of criteria, then move to the Item section to view items associated with a particular passage or group of passages, and then view the statistical data associated with the item(s). The Test Construction function is maintained by a tool called Form Builder. This tool offers the ability to select items, assign items to a form, and provide sequence numbers.
The Report Creation function provides several standard reports that assist in organizing and viewing information about item and form content. These reports provide information to the test development team, psychometrics, and/or the individual creating the test.
Help buttons are available throughout the program to facilitate use of the Item Bank.
Functionality of the Data Repository
This section includes an overview of the major functionality of the data repository as it applies to each of the four data types—Items, Passages, Statistics, and Art. In the subsections that follow, the functionality for each of the data types is divided into the following functional areas.
Data Stored Navigation Buttons
43
Item
StatisticsPassage

Toolbar Buttons Search Fields Move to Other Sections
Items
The Items section offers several key features to assist the user. This section permits the user to review the item data, view a formatted preview of the item and those elements associated with it (i.e., passage, statistics, and art), search for items, and select specific items to include in test forms.
Data Stored
Each section stores data specific to that section. The data stored in the Items section includes all metadata associated with each specific item. The metadata section of the screen contains a variety of fields. Fields are either required or optional. A required field must be present for the item bank to function properly; whereas an optional field may be included on the screen at the discretion of the client. Current required fields in the item bank include Pearson Corporate ID (CID), Item Code (assigned by the client), and Item Type. Commonly used optional fields include: Grade, Correct Answer, Parent Item Code, and Previous Item Code. Item Status and Item Not Appropriate fields may be used to assist in tracking the archiving of items. A comments field is also available. This is the only field that the user can modify and store with the item; all other data fields can only be modified by the system administrator.
Navigation Buttons
There are four tabs within the item bank labeled Item, Statistics, Art, Passages, and Form Builder. The Item tab shows all available metadata fields for this section, even if a field is not being utilized. To view a snapshot of the formatted item, click on the container field in which the item resides. The Art tab offers a view of any art piece(s) associated with the item, the art piece(s) code, and a short description of the formatted item preview. The Passages tab will display all passages held in the item bank.
There are also four "arrow" buttons on the left side of the screen. These buttons enable navigation through a found set of items (A found set of items includes all items that the user has selected, whether it is the entire database of items or a subset of items). The first button takes the user to the first item in the found set. The second button allows the user to move sequentially, in ascending order, from one item to the next item. The third button allows the user to move sequentially, in descending order, from one item to the previous item. The fourth button takes the user to the last item in the found set.
Toolbar Buttons
The Items section also utilizes a toolbar to provide additional functions for navigating and selecting items. These functions include:
Multiple Records View—allows the user to access multiple items with select metadata Search—allows the user to specify one or more criteria for locating items Show All Records—allows the user to view all items Sort Records—allows the user to view the items in a predetermined field order Show All Selections—allows the user to view items selected while hiding all other items
44

Clear All Selections—allows the user to deselect items previously selected Select/Deselect Found Set—allows the user to either select or deselect a found set Reports—allows the user to access a complete list of reports
Search Fields
All item fields within the Item tab can be used to define search criteria specific to the user’s needs. A guide will appear on the search screen explaining the various ways criteria can be defined, including:
A specific value (e.g., search for standard code H) A range of values (e.g., search for a grade that is < 5) A phrase (e.g., search for a description containing “focuses on the topic”) A wild card value (*) (e.g., expand a search for comp* to return entries such as computer,
company, companion, etc.)
Once the user enters the data, this information becomes the search criteria. Criteria may be entered into any number of fields at one time. Additional searches on the resulting found set can be done to further refine the selection.
Move to Other Sections
The user can exit the Items section using several different methods. First, the user can click on a linked element of the item to go to that selected element. For example, if a passage code appears in the metadata of an item in the item tab, the user can click on that code to go to the passage in the Passages section. If the user clicks on the Statistical Data tab, it will link to all statistical data available for that item in the Statistics section.
Once a choice is made, the user will be redirected to the requested record.
Passages
The Passages section offers several key features. It allows the user to view a formatted preview of a selected passage and its associated elements, to review passage data, and to search for relevant passages.
Data Stored
The data stored in the Passages section includes all metadata associated with each passage. The Passage Code field is the only required field on the Passage Data screen. Passage Title, Word Count, Passage Type, and Paired Passage: Code and Title are all optional fields on this screen. A Comment field is also available and is the only field that the user can modify and store with the passage. As with other sections, only a system administrator can modify other stored data.
Once the user enters the data, this information becomes the search criteria. Criteria may be entered into any number of fields at one time. Additional searches on the resulting found set may be done to further refine the selection.
Statistics
The Statistics section can be used to review current and archived statistical data, review archived
45

standards/framework data, search for statistical data, and select items based on the statistical data to be included in test forms. Figure 9 is an image of the Statistics section.
Data Stored
There are several required fields for Statistics metadata that must be present for the Item Bank to operate. These fields include Pearson Corporate ID (CID), Year of Administration, Season of Administration, Form, and Item Type. Other fields are grouped under one of the following headings: Data, DIF (differential item functioning) Analysis, IRT (Item Response Theory) Item Analysis, and Option Analysis/Scoring. Statistics for items in the bank will not be available at the time of delivery of the item bank but will become available for populating as items are tested.
Navigation Buttons
Navigating in the Statistics section is more structured than in the other sections. Each statistic is directly related to one item; however, items do not have statistics at this time, as none of the items have been tested yet. After the Statistics section is populated, the navigation button in the left bar will allow the user to move through the current statistical data for the items. An Archive Statistics List tab is available to view past administration (archived) statistics, once that data becomes available. This tab will first ask if the user would like to view the current item’s past administration data or the past administration data for all of the items in the current found set. A list of past statistical data will be displayed. A click on any CID or Item Code will provide a link to archived statistical data for that item in that year of administration. While viewing the archived data, a tab is available to view the standard/framework of the item at the time that statistical data was gathered.
Functionality of Report Creation
The Report Creation section provides several standard reports that help the user organize and view information about item and form content. Each of these reports can be accessed from the Item Bank Report screen. Although the fields viewed on each report can be modified, the objective of each report does not change.
Item Card
The Item Card Report provides information for the current found set of items. Item metadata is placed at the top of the report followed by the past three administrations’ statistical data. A small preview of the item is also displayed at the bottom of the page.
Item Card by Form
The Item Card by Form Report offers information similar to that of the Item Card Report. The Item Card by Form Report organizes the specified items by their assignment to forms in the Form Builder section. As with the Item Card, this report also displays metadata at the top of the page with a small preview of the item at the bottom of the page. Additionally, the Item Card by Form will display the form name in the top right corner of the metadata. The second page of the report displays only basic metadata with a full-size preview of the item.
Passage Card
The Passage Card Report allows for the selection of individual passages to be printed. Passage
46

metadata is placed at the top of the card with a copy of the passage below the metadata. For multiple page passages, previews of each page will be shown on additional pages.
Found Set
The Found Set Report lists only a few basic metadata for the current found set of items in the Items section of the bank. This report allows the user to employ a search criteria to locate a set of items, give a custom heading describing the items located (e.g., items with a particular standard code or items associate with a specific passage), and print out a list view of item codes with related information followed by an item count.
Pull List
The Pull List Report provides a list view of items selected for a form and assigns a sequence number to be used during the composition process of building a form. Each item also displays selective metadata, including its standard(s).
Summary Statistics
The Summary Statistics Report provides mean and item-correlation averages for the items selected for placement on a form in order to create a form for a specific statistical value. Statistics are shown for items grouped at each standard level in the form. Total values for the form are shown at the end of the report.
Passage Analysis
The Passage Analysis Report provides mean and item-correlation averages of items associated with passages selected for placement on a form in order to create a form for a specific statistical value. Statistics are shown for each item associated with the passage at each standard level in the form. Total values for the standard are shown at the end of the report.
Statistics Export
The Statistics Export Report provides a comprehensive data report for all items, a found set, or individual forms. This file will include all statistical data associated with a given item.
47

2.8. Construction of Operational Test Forms
The Michigan Office and Educational Assessment and Accountability (OEAA), Measurement, Inc., and Pearson work collaboratively to develop and construct the operational test forms used to support the MEAP program. In 2009, operational test forms were developed for the following subject areas:
Reading: grades 3-8 Writing: grades 4 and 7 Mathematics: grades 3-8 Science: grades 5 and 8 Social Studies: grades 6 and 9
Test form development entails the following steps:
Review the assessment blueprints for the operational assessments Select assessment items to meet the content and process specifications of the assessment
blueprints Assess the statistical characteristics of the selected assessment items Review and approve test forms
The following sections discuss essential aspects, include guidelines, and identify important references to follow through the four-step process.
2.8.1. Design of Test Forms
The following section describes the detail of test forms design for MEAP program.
2.8.1.1. Review the Assessment Blueprints for the Operational Assessments As the name implies, the assessment blueprints identify the content and types of items to be included on the operational forms These specifications include benchmark and content targets (limits), general indicators of difficulty and other psychometric characteristics, as well as general physical indicators such as passage length and artwork parameters.
All MEAP assessments are designed to assess higher order thinking skills. Most items in all subject areas focus more on comprehension and application than on simple recall or recognition. Indeed, specifications for each assessment clearly include admonitions to avoid simple recall of trivial or unrelated facts.
The MEAP assessments use three different types of items; multiple choice (MC), constructed response (CR- Reading and Writing only), and writing prompts (Writing only). Each item is aligned to a specific domain, standard, and objective. The alignment information is used during the forms construction process to help ensure the forms meet the blueprints.
In addition to the operational items, each form also includes embedded field test items. To minimize location effects, field test slots occur in multiple locations in mathematics, science, and social studies.
48

Due to the nature of the ELA materials, a separate section of the assessment is reserved for the field test slots. From year to year, the number of field test slots on a form typically remains constant.
The following sections outline the assessment blueprints for all subject areas and grade that were used to construct the fall 2009 test forms.
Mathematics Content for Grades 3-8Mathematics items at grades 3-8 are identified as core or extended core. Core refers to the content most commonly taught at a grade level. Extended core refers to content that is typically taught at grade level but is narrower in scope and/or is supportive to the core. Since the grade 3-8 assessments are administered in the fall, each assessment is based on the grade level content expectations (GLCEs) from the previous grade. Table 2.8.1.1 shows the breakdown of the grade 3-8 mathematics assessments.
Table 2.8.1.1Fall 2009 Mathematics Grade 3-8 Assessments
Grade Core Extended Core
Future Core
Field Test Items
Total # of Items
Constructed Response Items
3 32 13 NA 8 53 04 40 13 NA 9 62 05 32 20 NA 10 62 06 38 14 NA 9 61 07 38 15 NA 10 63 08 40 11 NA 8 59 0
English Language Arts Content for Grades 3-8The Reading assessment consists of multiple parts. Each assessment consists of 3-4 reading texts of varying lengths. At each grade, the assessments have one paired text along with one independent text. At grades 4-8, there is an extra linking passage to allow for measuring student growth. Finally, each form contains embedded field test items.
For 2009, the Writing test form assessed writing via one writing prompt and a series of multiple choice questions. The Writing test made only administered as a field-test and only to grades 4 and 7. Tables 2.8.1.2 and 2.8.1.3 summarize the fall 2009 Grade 3-8 ELA assessments.
49

Table 2.8.1.2Fall 2009 Reading Assessments Grade 3-8
Table 2.8.1.3Fall 2009 Writing Assessments Grades 4 and 7
Science Content for Grades 5 and 8In science, items are classified according to strand. In addition to the three major science subject areas (Life, Earth, and Physical science), each form must also include a set number of items that address the process skills of Constructing and Reflecting. Tables 2.8.1.4 and 2.8.1.5 summarize the science assessments for grades 5 and 8, respectively.
Table 2.8.1.4Grade 5 Science Assessment
Strand MC Items
CR Items
Field-Test Items
Total Items
Total Points
Constructing New Scientific Knowledge
9 0 2 11 9
Reflecting on Scientific Information 6 0 - 6 6Using Life Science 12 0 2 14 12Using Physical Science 12 0 3 15 12Using Earth Science 12 0 3 15 12Total 51 0 10 61 51
Table 2.8.1.5Grade 8 Science Assessment
Strand MC Items
CR Items
Field-TestItems
Total Items
Total Points
Constructing New Scientific Knowledge
12 0 0-2 12-14 12
Reflecting Scientific Knowledge 6 0 - 7-8 6Life Sciences 15 0 1-3 16-18 15Physical Sciences 12 0 1-4 13-16 12Earth Science 12 0 1-2 13-14 12Total 57 0 8 67 57
50
GradeReading
CoreReading
Field Test TotalMC CR MC CR
3-8 30 1 16 2 51
GradeWriting
CoreWriting
Field Test TotalMC CR MC CR
4, 7 NA NA 8 1 9

Social Studies Content for Grades 6 and 9
Table 2.8.1.6 summarizes the blueprint for the social studies assessments
Table 2.8.1.6Social Studies Blueprint: Grades 6 and 9
Strand MC Items Total Items Field Test Items Total PointsHistory 10 10 * 10Geography 10 10 * 10Civics 10 10 * 10Economics 10 10 * 10Total 40 40 15 40
*Each field-test form consists of items from the appropriate strands as determined by Pearson and OEAA.
2.8.2. Item Selection
In addition to the content coverage requirements, the forms must also meet certain statistical targets. These targets are outlined in the next three sections below.
2.8.2.1. Select Assessment Items to Meet the Assessment Blueprints
Following field testing, the items are submitted for review to both the Bias Review Committees (BSCs) and the Content Advisory Committees (CACs). These committees, composed of Michigan educators and Michigan citizens, sort the field tested items and identify which items are eligible for inclusion in the operational item pool. There is a separate pool for each subject area and grade level assessed. It is from these pools that items are selected to meet the requirements outlined in the assessment blueprints.
Test forms are developed using the approved MEAP items. In addition to overarching content requirements for each test form developed, content experts and psychometricians consider requirements related to subdomains, graphics and other visual representations, passage and content dependent items, and clueing concerns.
2.8.2.2. Assess the Statistical Characteristics of the Selected Assessment Items
The statistical process begins with the work of the Data Review Committees, both the BSC and the CAC post field test. The committees evaluate the field test items using item statistics from classical measurement theory and item response theory models. From the work of these committees, a pool of items that are eligible to be used in constructing the operational forms is identified.
Because the MEAP assessments are used in making individual decisions about students, they must be very reliable, particularly at cut points (the score points that separate adjacent achievement categories). The targeted reliability coefficient is .90 (or higher) for each assessment.
Other psychometric properties include item difficulty, item discrimination, and differential item functioning. General item and form level statistical targets are provided below:
51

For Multiple-Choice (MC) Items Percent correct: .25 < p-value < .95 Point biserial >.25 Mantel-Haenszel: Few Category C items2
For Constructed-Response (CR) Items Difficulty: any level as long as all score points are well represented Correlation with total score: .30 or greater by group statistics and score distributions Generalized Mantel-Haenszel: Few chi-square significant at .05 level of alpha
To help ensure adequate coverage of a full range of achievement on the operational assessments, the draft forms are evaluated to see whether the following targets are met. As necessary, items are replaced on the draft forms until this distribution is approached.
Rash Item Difficulty % of items-2.00 to -1.00 25-0.99 to 0.00 250.01 to 1.00 251.01 to 2.00 25
Even with careful test form development, it is usually not possible to create alternate forms that are exactly equal with respect to difficulty. The MEAP assessments are being analyzed using the Rasch Partial Credit Model.
As the MEAP test forms are assembled, spreadsheets are used to track the statistics and other metadata (e.g., alignment) for the selected assessment items. Both classical and Rasch statistics are included. The statistics listed on the spreadsheets include item p-values, correlations, and Rasch item difficulties for multiple-choice items and item means, standard deviations, correlations, and Rasch step difficulty estimates for constructed-response items.
The above two steps require an iterative process to create test forms that are a combination of the content and statistical information. Working together, Pearson psychometricians and content experts replace items until both groups are satisfied with the forms. Through this iterative process of item selection, item content takes precedence over statistical characteristics.
2 For category C items, D’s absolute value is significantly greater than or equal to 1.5
52

2.8.2.3. Review and Approve Test Forms
Once Pearson staff have reached consensus on a test form, the form and associated information is submitted to OEAA staff for review and approval. Included in the test matrices are open slots for embedded field test items. The OEAA reviews the test forms to determine whether both content and statistical requirements are met.
Guidelines for test forms review include: Confirm that all assessment items were accepted by the OEAA and the committees Confirm that all blueprint requirements are met Confirm that all content considerations including content/skill/topic balance, correct keys, no
clueing, and correct graphics are met. Confirm that the item and mean difficulty levels are accurate and meet requirements Confirm that the assessments cover a full range of achievement levels
As necessary, OEAA and Pearson replace items that are identified by OEAA as problematic, either from a content or psychometric perspective. As items are replaced, the match of the newly revised test form to the specifications is updated and reviewed. This process continues until OEAA has approved each form.
2.9. Accommodated Test Forms
A testing accommodation is a change to the testing environment to assist a student with special needs so that assessment can mirror instruction as much as possible without invalidating test results. District and campus testing coordinators are responsible for communicating information about testing accommodations to test administrators and other interested individuals. Information about testing accommodations is also included in the test administrator manuals.
The decision to use a particular accommodation with a student should be made on an individual basis and should take into consideration the needs of the student and whether the student routinely receives the accommodation in classroom instruction and testing. If a student receives special education services, all accommodations must be documented in the student’s individualized education program (IEP).
Typically, accommodations allow for a change in one or more of the following areas: Presentation format
Test setting
Scheduling or timing
Response format
2.9.1. Special Order Accommodated Testing Materials
The following accommodated testing materials are provided for MEAP: Braille, Large Print, Short Segment, Oral Administration and Bilingual.
53
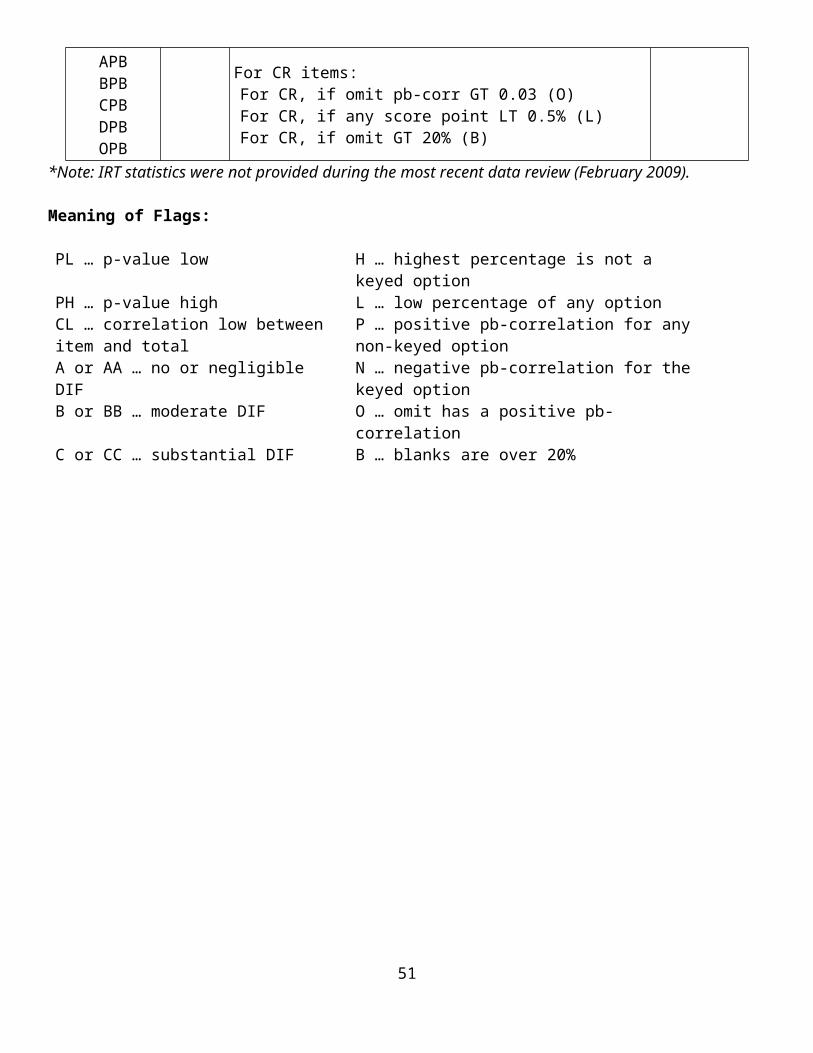
2.9.2. Braille
All test items are screened for adaptability to Braille. If an item not suitable for Braille is selected for use on a base-test form, an appropriate item would be substituted on the Braille form or the item would be dropped from the Braille form.
2.9.3. Large Print
All test items are screened for adaptability to large print. Text is enlarged to one of four font sizes based on the degree of visual impairment. The font sizes offered reflect the sizes of print being used in current instructional situations. Note: mathematics diagrams requiring measurement are not enlarged.
2.9.4. Oral Administration for Mathematics
Scripts are created for the mathematics base tests indicating the portion of each item that may be read aloud without compromising the mathematics. For example, if a problem requires students to indicate the largest number, the answers would not be read aloud. Students may have oral administrations using a cassette recording of the scripted test or by having a test administrator read the script aloud.
2.9.5. Bilingual Tests
Tests are translated into Spanish, Arabic, and Chaldean; the top language groups represented in the state after English. All tests include the English questions followed by the translated questions. Students may have tests interpreted on the day of testing for languages where a printed bilingual version is not available.
54

CHAPTER 3: OVERVIEW OF TEST ADMINISTRATION
3.1. Test Administration
For each administration, MI designs forms to assist the Assessment Coordinators with the successful receipt and return of test materials. These forms provide security and accountability during the fulfillment and distribution, test administration, and collection process.
Three months prior to the assessment window, MI receives a file from the OEAA containing a list of Assessment Coordinators for MEAP and their shipping and mailing addresses. The OEAA also provides a pre-ID file, which contains summary information about the number of students enrolled. These data files contain addresses, enrollments, secure document ID numbers, and other relevant information used to create shipping labels, packing lists, security forms, and control rosters. Below are descriptions of the materials and forms provided in the shipments.
Picking/packing lists. MI generates picking/packing lists for each district and school order that contain information specific to each district and school shipment. Materials are packaged by school and sent to the school or district, as indicated by the Assessment Coordinator.
MI provides secure packaging and distribution of materials for the MEAP program to ensure prompt, accurate, and secure delivery of test materials to district Assessment Coordinators. The materials for the MEAP program are packaged by building and then distributed to either the district or the school, depending on the option chosen by that particular district. Secure materials are numbered with a unique barcode identifier to assure 100% accountability during the process of picking, packing, distribution, and return of secure materials.
Quantities of materials provided for each school are calculated based on enrollment counts and overages using business rules that were developed with OEAA and documented in the Requirement Specifications for Enrollment Collection and Additional Orders. These specifications include rules about how enrollment counts are generated, overages are calculated, and bill of materials are determined for various items.
MI prints packing lists that indicate the number of test booklets being packaged and the number of shrink-wrapped packages, as well as all non-secure materials being shipped to the district or school. The packing list serves as a list to pick and pack assessment materials associated with each order. After the secure materials are picked, the secure materials barcodes are scanned and a secure materials list is generated which is included with the packing list. Packing lists also serve as inventory lists by providing a place for District and School Assessment Coordinators to check off materials they have received.
Shipping labels. MI enters the delivery information for the receiving district or school into the FedEx system and generates FedEx barcode shipping and tracking labels.
Materials return kits. MI assembles return kits for district Assessment Coordinators to use in returning materials to MI. The kits contain instructions for preparing completed materials for shipment to MI and all of the necessary control forms, materials identification labels, and pre-assigned FedEx shipping
55

labels and/or bills of lading. Return FedEx tracking numbers are pre-assigned to districts or schools in an effort to facilitate log in of materials. Materials identification labels are color-coded to distinguish boxes containing completed answer documents being returned for scoring from those containing secure test materials (i.e., test booklets).
The total number of pre-ID students by grade is reported in Table 3.1.1.; the total number of students tested is reported in Table 3.1.2.
Table 3.1.1Number of Pre-ID Students in Fall 2009
Grade Mathematics Reading Reading Session 2 Science Social Studies Writing
3 122077 122020 1220204 122740 122664 1226575 121692 121633 1217606 124373 124347 1244707 124353 124318 1242798 125464 125449 1255449 137723
Table 3.1.2Number of Students Tested in Fall 2009
Grade Mathematics Reading Reading Session 2 Science Social Studies Writing3 114743 114120 1138034 115820 115149 1146875 114933 114414 1157656 116467 116155 1173577 118006 118002 1175948 118908 118721 1197209 127659
3.2 Materials Return.
Shipping. In order to retrieve materials immediately after testing, while providing maximum flexibility to schools and districts, MI uses FedEx 2-Day Air service for the return of all assessment materials.
The upgrade in service level provides a rapid and consistent flow of material in an effort to meet the stringent time constraints required by OEAA for these assessments. This service guarantees delivery of materials no more than two days after pick-up in Michigan, and there is greater probability that all boxes from a district are delivered on the same date.
Return kits. Districts are provided with “Return Kits” containing all of the necessary labels and documentation that are used for returning their materials. The tracking numbers of the return labels provided to each district are entered into our internal tracking system database at the time of “Return
56

Kit” production. This process offers an accurate and expedient method of logging materials in upon return to MI.
Materials are prepared for return by the MEAP test coordinator. The directions for packaging and returning test materials are explained in detail in the MEAP Coordinator Manual supplied to each test coordinator. The coordinator packages the materials and applies the self-adhesive return label that is supplied in the “Return Kit” from their original shipment. The coordinator then calls a toll-free telephone number to arrange for pick-up of their materials.
Pick-up procedure. Pick-ups are usually made the same business day depending upon the time of day in which the call is made and the distance that FedEx must travel for the pick-up. Any pick-up that is not possible on the same day of the call is picked up by FedEx no later than the next business day and then promptly forwarded to MI for processing. This allows districts to return all materials immediately upon completion of the test administration. MI encourages districts to return materials as quickly as possible so that processing can begin promptly.
Login procedure. MI currently has a system in place that allows log in of all materials within 24 hours of receipt. Upon arrival at MI, all boxes are scanned into our tracking system database where they are logged in and checked against the tracking numbers that are pre-assigned to each district. This provides immediate information on the number of boxes received and their points of origin. Once the login of materials is complete, processing of materials begins at multiple workstations in an effort to meet or exceed the 72-hour requirement for scanning preparation. MI uses the data collected from the material login process to generate summary information known as the MEAP batting average reports. These reports are used to easily identify hot spots without browsing information for every district. The hot spots are then used to identify districts that need to be contacted about material returns.
Boxes containing non-scannable materials are examined to remove any scannable materials that may have been mixed in error. A separate or “redundancy” check is performed on each box by a second individual at this time to assure that all scannable materials from a particular district are processed together. Any materials located during these searches are placed immediately into the appropriate tote boxes according to the procedure outlined for other scannable materials. The tote boxes of used answer documents are then forwarded to our IT department for scanning and processing, while the boxes of non-scannable materials are held until all scannable materials are processed. The non-scannable boxes are retrieved as soon as possible, but no later than the completion of scannable material processing. The secure materials from those boxes are counted electronically and documented in order to provide information regarding the quantities of secure materials returned. For the 2009 administration, the security check-in process was completed ten weeks after receiving all materials.
Secure material check-in. MI performs a full security check-in using our Security Barcode Check-in Application (SBCA), to capture the booklet barcode number for each booklet returned. This process is labor intensive, but it provides a reliable method of capturing booklet barcode numbers upon return. During the full security check-in, test booklets are unpacked and then scanned at a workstation equipped with a barcode reader and a PC. The barcode of the box into which the booklets are stored, is linked to each set of scanned booklets. Test booklets are stored in boxes of a standard size used for the entire project. All of the barcodes scanned in each box are checked in the master database against the barcodes expected from that district. Any discrepancies are noted and a Security Report is generated, as
57

required. This report is used to inform districts of any secure materials that have not been returned to MI.
For Fall 2009 testing, secure and non-secure materials shipped and returned are reported in Tables 3.2.1 through 3.2.3.
Table 3.2.1Total Secure Documents Shipped in Fall 2009 Administration
Grade Mathematics Reading Session 1
Reading Session 2 Science Social Studies Writing
3 162883 150446 1503874 166223 161793 161743 1618185 165726 161070 161058 1657286 162832 157922 157859 1628647 163021 158246 158236 1583038 160301 148806 148759 1608129 174847
Total 980986 938283 938042 326540 337711 320121
Table 3.2.2Total Secure Documents Returned after The End of Testing Windows in Fall 2009 Administration
Grade Mathematics Reading Session 1
Reading Session 2 Science Social Studies Writing
3 161946 149602 1495234 165929 161487 161419 1615045 165439 160828 160800 1653796 162568 157702 157628 1626077 162797 157996 157989 1580858 160032 148541 148467 1605289 173690
Total 978711 936156 935826 325907 336297 319589
Table 3.3.3Total Secure Documents Not Returned in Fall 2009 Administration
Grade Mathematics Reading Session 1
Reading Session 2 Science Social Studies Writing
3 937 844 8644 294 306 324 3145 287 242 258 3496 264 220 231 2577 224 250 247 2188 269 265 292 2849 1157
Total 2275 2127 2216 633 1414 532
58

CHAPTER 4: TECHNICAL ANALYSES OF POST-ADMINISTRATION PROCESSING
4.1. Scanning Accuracy and Reliability
MI has extensive and proven procedures to ensure that we accurately and reliably scan answer documents and collect student responses in preparation for scoring. Our strict handling procedures make sure that each and every answer document is accounted for, tracked, and controlled through every phase of the scanning process. All scanning and scoring applications are fully tested and reviewed using structured testing methodologies before and continually monitored throughout live test materials processing. Any questionable scanned data is flagged for review and correction; thus producing only the highest quality results for reporting.
Tracking documents. MI has an application called ObjectTracker to track the location of a scan bin (batch) and its contents (header sheets and test/answer books) throughout processing. Matched batch-tracking barcode labels are affixed to a scan bin and its respective batch-tracking sheet, located on top of the headers and test/answer documents in the scan bin. The batch-tracking barcode is recorded in the ObjectTracker database, which allows us to identify specific scan bins associated with a given school/district and to determine its current status. Because the scan bin ObjectTracker barcodes are carefully scanned in and out of each processing area, it is easy to determine which department is currently in possession of the material. The ObjectTracker application verifies that all batches are accounted for and notifies MI if one is delayed at any particular processing area.
Cutting multi-page documents. Scan bins are first forwarded to the cutting area, where cutting personnel remove one scan bin at a time from the cart. The documents are cut using one of MI’s four Challenge paper cutters. The cutting operation converts the multi-page answer document into a stack of single sheets ready for scanning. The weight and BTS barcode of the scan bin are recorded in the ObjectTracker database at key points along the processing chain to maintain the integrity of the batch and ensure all documents retain their association with a specific batch.
Ensuring document integrity. When scannable materials are printed, each sheet has a scannable and human-readable lithocode value unique to that document. In the unlikely event that a scan bin is dropped at the cutting or pre-scanning stage, the unique lithocode allows answer document integrity to be verified at the scanner as well as when the data is transferred into the project database. Software validations at the scanner ensure that all pages of each student’s answer document are accounted for and contain the same lithocode; thus, any pages that are out of order can be easily corrected prior to any other processing.
Scanner verification and calibration. Scanning applications that include every scannable document are written using our Virtual Scoring Center™ (VSC™) document setup application. Each application is tested to ensure that the data derived from all grids appearing on the scannable document are: included in the export file, are accurately read, and return the correct value. A quality control sample of answer
59

documents (test deck) are created so that all possible responses are verified. This structured method of testing provides exact test parameters and a methodical way of determining that the output received from the scanner(s) is correct. The documents and the data file created from them are carefully compared to further ensure that results from the scanner are accurate according to the reporting rules provided by the OEAA staff. In addition, scanner calibration is verified at the time of testing, and scanners are re-calibrated to specifications prior to each staff shift change so calibration remains constant and precise. For the next MEAP administration, MI will add a calibration sheet as part of every batch to detect scanning problems before they have the chance to affect other batches.
Image scanning. The answer documents are scanned in the order they are received and all pages of each complete document are scanned at the same time using our eleven BancTec IntelliScan XDS color image scanners. The BancTec IntelliScan XDS scanner features a completely open paper path to dramatically improve document throughput. This paper path reduces the time to recover from paper jams and other complications that are common for scanners with more restrictive paper paths. Both sonic and vacuum double-sheet detection technology ensure that every sheet is scanned, allowing reliable interspersed scanning of multi-sized documents. In addition, BancTec has designed custom document integrity software for MI. This application detects out-of-sequence pages allowing operator correction before imaging, thus eliminating post scanning corrective action. The production control technician also weighs the batch when scanning is complete to verify that all the documents in the batch have been scanned. If any discrepancies are detected, the scanner operator submits the batch to a scanning supervisor who investigates and resolves the discrepancy.
To ensure that all sheets in the scan bin are scanned, the last sheet in every bin is an “End of Batch” sheet. If the End of Batch record does not appear in the data file that is imported into the MI database, an error alert is generated, and the technician makes a visual check of the scan bin. The data file is opened again, if necessary, and any missing sheet(s) are appended to the file creating a complete data file.
Data capture and validation. The scanning application saves the image data and corresponding index to our Storage Area Network (SAN) that provides fast, secure access to the images. As scan bins are scanned, image files and corresponding index files are created. Once a scan bin is completely scanned, the image and index files are imported from their locations on the SAN into the data capture side of VSC. VSC processes the images using master templates and creates a digital data file from the bubbled information on each page. The Batch Editing operation then uses the images to allow the batch-editing technician to resolve any data integrity issues including lithocode errors, or any image quality issues.
Using the procedures developed by MI and OEAA, MI combines the information from the various sources of data (headers and gridded information on answer documents). These multiple, redundant sources of information allow MI to detect discrepancies and ensure that each student is associated with the correct school, grade, and form. MI enforces data validation rules at each stage of processing to reduce last minute data clean-up and ensure the data is accurate, problem-free, and ready for reporting.
Secure material processing. After all used answer documents are scanned, the secure, unused third grade answer documents are scanned. This is part of our secure materials processing so that we retain an electronic record of all documents. If documents are located that contain live data, the documents are retrieved and put in scan bins for normal processing as live documents.
60

Data correction. Once all of the information is combined to create the student records, GPA executes data validation routines created specifically for the MEAP. These routines analyze the data and create error tables for answer documents containing questionable data. Common error detection routines include checks for the following situations:
Inconsistencies in school, grade, or form Inconsistencies in headers and answer documents Duplicate student barcodes within the same bin or another bin of answer documents Duplicate lithocodes Missing student barcodes Missing or incomplete demographics (such as a blank name) Double marks in the demographic and/or multiple-choice grids
MI utilizes a double data correction process to achieve the highest level of quality and accuracy in MEAP student data. Data correction operators use our sophisticated data correction application that retrieves flagged data records and highlights the problem field on a computer screen so it can be resolved. The operator compares the highlighted data to the scanned image of the answer document, and makes any necessary correction. Once an operator corrects a flagged record, the same flagged record is routed to a second data correction operator who repeats the data correction process. After a flagged record is edited by two operators, the data correction application checks that both operators have made identical corrections. In the event that two corrections differ, the record is routed to a supervisory staff member for a third and final resolution. This process continues until all flagged records are examined.
Test decks and customer acceptance tests. Test decks and Customer Acceptance Tests are used to verify that the scanning, scoring, and reporting processes are fully functional. First, requirements documents are developed to fully describe scanning, data correction, scoring, and reporting of data. Then test decks and Customer Acceptance Tests (CAT) are created based on those requirements. The test deck process has a very comprehensive set of rules, covering all required scenarios, which are applied to all appropriate grades and content areas. The test deck rules include specifics for handling multiple-answer documents and constructed response scores for a single student within a single content area, and for aggregating that data at the school, district, ISD, and state levels.
Each OEAA assessment test deck begins with answer documents that have been bubbled in order to meet every requirement defined by the OEAA as well as specific circumstances defined by MI. Then, more documents are created to represent all logical combinations of requirements and data variations. There is at least one test case for each scenario; each test case requires that we either validate the data that is being captured at scanning or manipulate the data correctly (calculations, overrides, etc.) to yield the appropriate results at the end of the process. In addition, some scenarios have multiple test cases and there are some scenarios that, although not necessary to validate the software functionality, are necessary to provide OEAA with scenarios for their own special analysis of particular assessment situations (such as Tested Roster).
The CAT process is divided into multiple stages. Each stage builds on the previous; therefore, OEAA must approve results of one stage before MI can perform the tasks associated with the next. The two stages that relate to scanning are discussed below:
61

The purpose of the first CAT (Scanning) is to confirm the accuracy of the scan data and that images are captured correctly for all document types. Hardcopies and images of the test deck documents are provided to OEAA as well as database tables.
The second CAT (Data Correction) verifies the accuracy of the data validation and entry systems, specifically that all invalid values in scanned data are sent to Data Correction, and that values entered during Data Correction are transferred accurately to the MI MEAP database.
4.2. Multiple-Choice Scoring Accuracy
After scanning and data editing, MI scores OMR multiple-choice data using scoring keys. MI uses multiple reviews for accuracy of scoring keys performed by independent staff:
Analyze the item responses of the students when a significant number of students have been scored in the system.
Produce a report that allows psychometrician and our personnel to match and review the keys against the percent of correct responses by item on each form and content area. Appendix G contains an example of the key check report.
Send same key check report to the OEAA for review. Each scored item is marked indicating what the answer was and what the scoring key indicates as
the correct answer. Questionable data is printed on an edit listing for resolution. Each question listed by the edit program is individually reviewed to determine if better or more
accurate information can be obtained.
4. 3. Erasure Analysis
The Erasure Analysis is performed on all operational multiple-choice responses once all scanning, data correction, and multiple-choice scoring are complete. Data for each student multiple-choice response is programmatically analyzed to determine if the response contains a mark that exceeds the mark threshold and if the lighter marks are potential erasures. Statistics are captured and aggregated at a school and district level to determine whether the school/district data is outside the state norm. Final results are provided to OEAA for review and analysis.
Mark Identification
The Virtual Scoring Center™ (VSC) Capture program processes a JPEG grayscale image and assigns a Hex value for each multiple-choice bubble. The Hex range is from 0 to 15; where Hex 0 is the lightest and represents no shading contained in the bubble and Hex 15 is the darkest and represents a dark, student filled bubble. A student selected response is captured when the Hex value for the bubble is Hex 12 (definite mark threshold) or above. A bubble detected in the range of 9 to 11 is captured as the student response if no other bubble for the multiple-choice question is above an 8. A bubble is considered an erasure if the Hex value for the bubble is greater than 5 and less than 12 and not identified as the student response.
Erasure Identification
62

Using the VSC Capture image processed Hex value for each bubble in a multiple-choice questions, each Hex value is analyzed to determine if an erasure is present. A flag is set for each bubble that is detected as an erasure. The iErasureA flag is set if the A bubble was erased, iErasureB is set if the B bubble was erased, and so on.
Erasure Analysis
The answer key for each test is used to compare the student selected response, the correct answer, and the erased bubble to determine multiple-choice erasure results. There are three results for an erased multiple-choice question: wrong answer to correct answer; correct answer to wrong answer; or wrong answer to wrong answer. A result flag is set for each erased multiple-choice case. The erasure analysis result set for the Fall 2009 administration is available on the MEAP SharePoint site.
4.4. Results of Constructed Response Scoring Procedures
The MEAP 3-8 statewide assessment includes measures in which the examinees must construct their own response for some of the questions. For example, examinees may be required to provide a two or three sentence response to a reading comprehension item, or demonstrate the appropriate use of a geometry formula. The procedure for scoring these responses is provided.
Outlined below is the scoring process Measurement Incorporated follows. This procedure is used to score responses to all MEAP constructed response or written composition items.
4.4.1. Rangefinding and Rubric Review
MI project leadership personnel have worked successfully with rangefinding committees from many states over the last three decades, and we conducted many successful rangefinding meetings during our previous contracts with the State of Michigan. We support this important element of the scoring process and will conduct both the Initial and Final rangefinding meetings, in coordination with OEAA staff, for each administration of MEAP. Rangefinding committees are convened for each grade level and content area of the assessment; for MEAP ELA, there are separate committees for the reading and writing tasks at each grade level.
MI understands that each rangefinding committee consists of OEAA staff, 5 to 8 Michigan teachers of the appropriate grade level (based on the answer to question #30) , and at least one project monitor or scoring director from MI. We currently have a number of MI project monitors available and scoring directors with experience in conducting rangefinding meetings for MEAP under previous contracts, and we added additional leadership staff that has previous experience in conducting rangefinding for other states. The meetings for each subject and grade level committee last for no longer than three days.
MI recruits and trains active Michigan teachers to be members of rangefinding committees for the subject and grade in which they teach. We use OEAA lists of potential rangefinding committee members to recruit participants. We train these teachers so they are prepared to apply scoring criteria to the constructed-response items being tested.
63
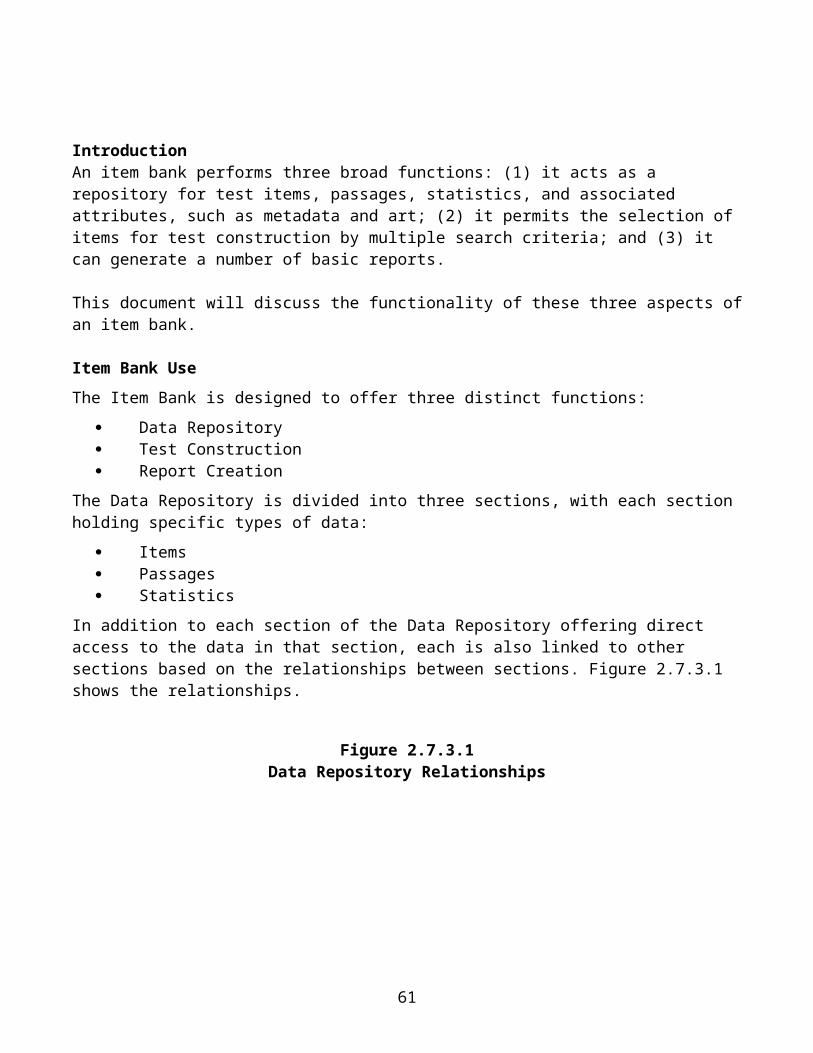
MI scoring staff facilitates the rangefinding meetings with several goals in mind. First, to accurately and consistently apply the rubric to each student response and to ensure the rubrics are viable. MI staff keeps careful records of all scoring decisions made at these meetings, including notes about which student responses are problematic to score and which are not. We document and archive the records of all of the decisions and provide them to the OEAA.
Another goal is to ensure that the participating Michigan educators feel confident about the rangefinding process and the resulting scoring decisions. Many Michigan educators inform us that rangefinding is their favorite of all professional development activities; this feedback gave us much satisfaction during our work on previous Michigan assessments
MI scoring directors have extensive experience in rangefinding situations and after rangefinding these same scoring directors construct the training materials and conduct the training of the readers. This continuity of leadership helps to ensure that the scoring criteria established at the rangefinding meetings are applied during training and scoring.
Initial rangefinding. The Initial rangefinding meeting occurs before the handscoring of the field tested constructed-response items. This round of rangefinding is to verify that all score points are represented and that the rubric is viable. Items may be discarded (or more likely, sent back to the development contractor for editing) at this stage. MI understands that Writing has pre-established rubrics while Reading has rubrics specific to the items themselves.
In order to provide a variety of responses and potential score points, MI leadership staff selects and copies representative field test responses in advance. We carefully select approximately 25 sample responses per item. Our psychometric staff works with the OEAA to identify a sample of districts for each item that represents students from across the state as well as a full range of student achievement. MI brings sufficient copies of the rangefinding responses to the meetings so that each participant has his/her own set. In addition, we provide all necessary supplies. We use previous MEAP operational training materials to train the members of the rangefinding committees.
Before any secure materials are distributed, all committee members are required to sign a confidentiality/nondisclosure form. MI keeps these forms on file for the duration of the contract. During the meetings, each committee member has a complete set of rangefinding materials with which to work. These materials are numbered so that we can account for them all at the end of the meetings. Each committee member is permitted to take notes on these sets. During the meetings, the committee members have access to all materials related to a particular item until no more discussion of that item is required. When discussion of an item is completed, all responses, rubrics, and item sheets associated with that item are collected before a new item is distributed. At the end of the rangefinding meetings, all materials are recycled under secure conditions.
Final versions of the scoring rubrics for the test items are produced based on the decisions made by the rangefinding committees. The revised rubrics and responses that were scored at the Initial rangefinding meeting are used to train the readers to score the field test sample. Readers for the field test scoring have previously qualified for and have scored the operational test items and have demonstrated a high degree of reliability. They are able to accurately apply the scoring criteria for the field test items after being trained with the rangefinding responses. In addition, during the
64

scoring of the field test items, any new scoring questions that are addressed by communication between the OEAA Staff and MI scoring leadership.
Final rangefinding. After the operational items have been selected for each assessment, MI conducts the Final rangefinding meetings.
Before the meetings, MI leadership staff selects and copies field test responses that represent all score points for each item as well as some unusual responses that were referred to the OEAA for decisions during the field test scoring. We select 125 field-tested responses for each item. MI assembles, copies, and brings these materials to rangefinding along with any supplies needed to conduct the meetings. All of the procedures for security instituted at the Initial rangefinding meetings are replicated at the Final meetings. We train the Final rangefinding committee members with the anchor responses and the rubrics that were finalized at the Initial rangefinding meetings.
The Final rangefinding meetings are conducted to establish “true” scores for a representative sample of student responses to the writing prompts and constructed-response tasks in each content area and at each grade level. We use feedback from the educators who participate in these meetings to select exemplar responses that are used to construct the materials for reader training (anchor sets, training/qualifying sets, validity/calibration sets). If any responses selected are not acceptable to the rangefinding committee or to the OEAA content specialists, or if the numbers of responses are not sufficient to construct the reader training materials, MI provides additional responses for review and approval by OEAA staff.
At the conclusion of each meeting, there is a final step in the rangefinding process. After the rangefinding responses have been discussed and have received a final score, the rangefinding committee sorts their responses into stacks by score point and rereads the responses at each score point to ensure consistency. MI scoring directors perform an additional check for consistency after the meetings are over. They read the sorted responses again and confer with the OEAA Office and the MI Handscoring Manager if there are problems with consistency.
MI’s considerable experience in rangefinding situations is brought to the MEAP assessments to ensure the continuation of solid criteria and consistent scores. We take great care to work with the OEAA and Michigan educators in developing guidelines which promote consistency in scoring in future years.
4.4.2. Rater Selection
MI maintains a large pool of qualified, experienced readers at each scoring center. We need only inform them that a project is pending and invite them to return. MI routinely maintains supervisors’ evaluations and performance data for each person who works on each scoring project in order to determine employment eligibility for future projects. We employ many of our experienced readers for this project and recruit new ones as well.
MI procedures for selecting new readers are very thorough. After advertising and receiving applications, MI staff review the applications and schedule interviews for qualified applicants. Qualified applicants are those with a four-year college degree, preferably in English, language arts,
65

education, or a related field. Each qualified applicant must pass an interview by experienced MI staff, write an acceptable essay, and receive good recommendations from references. We then review all the information about an applicant before offering employment.
In selecting team leaders, MI’s management staff and scoring directors review the files of all returning staff. They look for people who are experienced team leaders with a record of good performance on previous projects and also consider readers who have been recommended for promotion to the team leader position.
MI is an equal opportunity employer that actively recruits minority staff. Historically, our temporary staff on major projects averages about 51% female, 49% male, 76% Caucasian and 24% minority. MI strongly opposes illegal discrimination against any employee or applicant for employment with respect to hiring, tenure, terms, conditions, or privileges of employment, or any matter directly or indirectly related to employment, because of race, color, religion, sex, age, handicap, national origin, or ancestry.
MI requires all handscoring project staff (scoring directors, team leaders, readers, and clerical staff) to sign a Confidentiality/Nondisclosure Agreement before receiving any training or other secure project materials. The employment agreement indicates that no participant in training and/or scoring may reveal information about the test, the scoring criteria, or scoring methods to any person. A copy of this agreement is enclosed in Section 6: Work Samples.
4.4.3. Rater Training
All readers hired for MEAP handscoring are trained using the rubric(s) approved by the OEAA and responses selected during the rangefinding meetings. Readers are placed into a scoring group that corresponds to the subject that he/she has taught or studied. Within each group, readers are divided into teams consisting of one team leader and 10-15 readers. Each team leader and reader are assigned a unique number for easy identification of their scoring work throughout the scoring session.
After the contracts and nondisclosure forms are signed, and the introductory remarks are given by the scoring director, training begins. Reader training and team leader training follow the same format, except that team leaders are required to annotate each response in the training sets, while readers are encouraged to take notes. The scoring director presents the writing or constructed-response task and introduces the scoring guide (anchor set), then discusses, roomwide, each score point. This presentation is followed by practice scoring on the training/qualifying sets. The scoring director reminds the readers to compare each training/qualifying set response to anchor responses in the scoring guide to assure consistency in scoring the training/qualifying responses.
Each reader has a clean copy of the training/qualifying sets as well as a score sheet on which to record training set scores. Once the readers score these responses, they take their score sheets to their team leader. The team leader will record the percentage of correct scores both on the reader’s score sheet and on a logbook that is kept to record performance of all team members on all training/qualifying sets. This function is also performed by scoring directors during team leader training. The team leaders’ log books are submitted to the OEAA Office. If an OEAA representative
66

is on-site during team leader and/or reader training, the representative has access to these documents as each set is completed.
Because it is easy in a large group to overlook a shy reader who may be having difficulty, readers break into teams to discuss the responses in the training/qualifying sets. This arrangement gives readers an opportunity to discuss any possible points of confusion or problems in understanding the criteria. The scoring director will also “float” from team to team, listening to the team leaders’ explanations and adding additional information when necessary. If a particular response or type of response seems to be causing difficulty across teams, the scoring director discusses the problem roomwide to ensure that everyone hears the same explanation. Once each team has finished discussing the first set, the readers score the next set. Training continues until all training/qualifying sets have been scored and discussed.
Like team leaders, readers must demonstrate their ability to score accurately by attaining the qualifying agreement percentage established by the OEAA before they may read actual student responses. Any readers unable to meet the standards set by the OEAA are dismissed. All readers understand this stipulation when they are hired. MI is always sensitive to the need for accurate and consistent scoring, and any team leader or reader who is not able to demonstrate both accurate and consistent results during training is paid for time spent and dismissed.
Training is carefully orchestrated so that readers understand how to apply the rubric in scoring the responses, learn how to reference the scoring guide, develop the flexibility needed to deal with a variety of responses, and retain the consistency needed to score all responses accurately. In addition to completing all of the initial training and qualifying, a significant amount of time is allotted for demonstrations of the VSC handscoring system, explanations of how to “flag” unusual responses for review by the scoring director, and instructions about other procedures which are necessary for the conduct of a smooth project.
Reader training requires approximately three days (actual time varies by grade and content area). Readers generally work 7.0 hours per day, excluding breaks. Evening shift readers work 4.5 hours, excluding breaks. A typical reading schedule is shown below.
Day Shift8:15 a.m. – 10:00 a.m. Reading
10:00 a.m. – 10.15 a.m. Paid Break10.15 a.m. – 12:00 p.m. Reading12:00 p.m. – 12:45 p.m. Lunch12:45 p.m. – 2:00 p.m. Reading2:00 p.m. – 2:15 p.m. Paid Break2:15 p.m. – 4:00 p.m. Reading
Evening Shift5:00 p.m. - 6:45 p.m. Reading6:45 p.m. - 7:15 p.m. Dinner7:15 p.m. - 9:00 p.m. Reading9:00 p.m. - 9:15 p.m. Paid Break
67

9:15 p.m. - 10:15 p.m. Reading
4.5. Rater Statistics and Analyses
4.5.1. Calibration
A concern regarding the scoring of any open-response assessment is the reliability and accuracy of the scoring. MI appreciates and shares this concern and continually develops new and technically sound methods of monitoring reliability. Reliable scoring starts with good rangefinding meetings, development of detailed scoring rubrics and training materials, and thorough training sessions by experienced trainers. Quality results are achieved by daily monitoring of each reader. Unbiased scoring is ensured because the only identifying information on the student response is the identification number. Unless the students sign their names, write about their hometowns, or in some way provide other identifying information, the readers have no knowledge of them.
In addition to extensive experience in the preparation of training materials and employing management and staff with unparalleled expertise in the field of handscored educational assessment, MI constantly monitors the quality of each reader’s work throughout every project. Methods that are used to monitor readers’ scoring habits during Michigan handscoring projects include use of the following:
Reader Status Reports. MI has developed and operates a comprehensive system for collecting and analyzing scoring data. After the readers’ scores are submitted into the VSC handscoring system, the data is uploaded into the primary Project Command Center (PCC) servers located at our corporate headquarters in Durham, North Carolina. These scores are then validated and processed according to the specifications set out by the OEAA.
There are currently more than 20 reports available that can be customized to meet the information needs of OEAA and MI’s scoring department. We provide OEAA with reports that include the following data:
Reader ID and team Number of responses scored Number of responses assigned each score point (1-4 or other) Percentage of responses scored that day in exact agreement with a second reader Percentage of responses scored that day within one point agreement with a second reader Number and percentage of responses receiving adjacent scores at each line (1/2, 2/3, 3/4) Number and percentage of responses receiving nonadjacent scores at each line Overall reliability index (taken from exact agreements and one point discrepancies with other
readers) Number of correctly assigned scores on the validity responses
Updated “real-time” reports are available that show both daily and cumulative (project-to-date) data. These reports are available for access by OEAA staff via a secure website. Our reporting system provides 24-hour on-line access to the reader status reports through the use of a user name and password that is provided to the OEAA at the beginning of each test administration. This allows any
68

OEAA staff member with access to review a scoring report whenever they prefer. We discuss quality control procedures and reporting at the Kick-Off meetings and the OEAA lets us know if they want reports more comprehensive than those listed above. Sample reliability reports are included in Section 6.
The handscoring project monitors at each MI scoring center also have access to the PCC system and they provide updated reports to the scoring directors several times a day. MI scoring directors are experienced in examining these reports and using the information to determine the need for retraining of individual readers or the group as a whole. It can easily be determined if a reader is consistently scoring “too high” or “too low,” as well as the specific score points with which they may be having difficulty. The scoring directors share such information with the team leaders and direct all retraining efforts.
4.5.2. Rater Monitoring and Retraining
Team leaders spot-check (read behind) each reader’s scoring to ensure that he/she is on target, and conduct one-on-one retraining sessions about any problems found. At the beginning of the project, team leaders read behind every reader every day; we become more selective about the frequency and number of read-behinds as readers become more proficient at scoring. The Daily Reader Reliability reports and validity/calibration results are used to identify the readers who need more frequent monitoring.
Retraining is an ongoing process once scoring is underway. Daily analysis of the Reader Status Reports alert management personnel to individual or group retraining needs. If it becomes apparent that a whole team or a whole group is having difficulty with a particular type of response, large group training sessions are conducted. Standard retraining procedures include room-wide discussions led by the scoring director, team discussions conducted by team leaders, and one-on-one discussions with individual readers. It is standard practice to conduct morning room-wide retraining at MI each day, with a more extensive retraining on Monday mornings in order to re-anchor the readers after a weekend away from scoring.
Our quality assurance/reliability procedures allow our handscoring staff to identify struggling readers very early and begin retraining immediately. During the time when we retrain these readers, we also monitor their scoring intensively to ensure that all responses are scored accurately. In fact, the monitoring we do is also used as a retraining method (we show readers responses that they have scored incorrectly, explain the correct scores, and have them change the scores). Our retraining methods are very successful in helping readers to become accurate scorers.
69

4.5.3. Rater Dismissal
When read-behinds or daily statistics identify a reader who is unable to maintain acceptable agreement rates, the reader is retrained and monitored by scoring leadership personnel. A reader may be released from the project if retraining is unsuccessful. In these situations, all items scored by a reader during the timeframe in question can be identified, reset, and released back into the scoring pool. The aberrant reader’s scores are deleted, and the responses are redistributed to other qualified readers for rescoring.
4.5.4. Score Resolution
Each student response is scored holistically by a trained and qualified reader using the scoring scales developed and approved by the OEAA. There will be a blind 20% second read for reliability purposes.
4.5.5. Inter-Rater Reliability Results
Inter-rater agreement is expressed in terms of exact agreement (Reader Number One’s score equals Reader Number Two’s score) plus adjacent agreement (+/1 point difference). Tables 4.6.7.1 and Table 4.6.7.2 summarize the inter-rater reliability.
4.5.6. Rater Validity Checks
Scoring directors select responses from rangefinding which are loaded into the VSC system as validity responses. The “true” or rangefinding scores for these responses are entered into a validity database. These responses are sent out into the rooms each day to be scored by the readers. A validity report is generated that includes the response identification number, the score(s) assigned by the readers, and the “true” scores established by the rangefinding committee. A daily and project-to-date summary of percentages of correct scores and low/high considerations at each score point is also provided.
4.5.7. Summary Statistics
Summary statistics of inter-rater agreement and rater validity agreement for all the constructed-response items are presented in Appendix Q.
Inter-rater agreement as expressed by sum of perfect and adjacent percent of agreement ranges from 96.0% to 97.7%.
70

CHAPTER 5: MEAP REPORTS
5.1. Description of Scores
5.1.1. Scale Score
Scale scores are statistical conversions of raw scores that adjust for slight differences in underlying ability levels at each score point and permit comparison of assessment results across different test administrations within a particular grade and subject. Each year new test forms are developed. These new forms never contain exactly the same questions as the previous forms. In order to have a fair comparison across time, it is necessary to have a scale score that means the same across different administrations. On MEAP grades 3-9 assessment, scale score with a standard deviation of 25 is developed, and a score of X00 is assigned to a student of grade X who barely meets Michigan standards. For example, a score of 500 is assigned to a grade 5 student who barely meets Michigan standards. Scale scores are not comparable across grade levels. A scale score of 500 on the grade 4 assessment does not indicate that the fourth-grade student would be considered as meeting standards on the grade 5 assessment. Details of the development of MEAP scale scores are described in Chapter 7, section 7.2. The scale score is stable because it allows for students’ scores to be reported on the same scale regardless of which year they took the assessment, and which form of the assessment the student took.
Schools can use scale scores to compare the achievement of groups of students across years. These comparisons can then be used to assess the impact of changes or differences in instruction or curriculum. The scale score can be used to determine whether students are demonstrating the same skill and ability across cohorts within a grade and subject.
5.1.2. Raw Score
In addition to scale scores, sub-content raw scores are reported in the score reports. These scores are the sum of raw points earned as classified into specific content categories. Total raw scores are also reported. Several values that are derived from the raw scores are added to assist in interpreting the raw scores: maximum possible score points, percent correct and aggregate averages (for school and district level reports).
5.1.3. Performance Level
To help parents and schools interpret the reported score values, performance levels are identified. A performance level is a range on the score scale that corresponds to student achievement levels. The MEAP student performance levels are:
1. Advanced;2. Proficient;3. Partially Proficient; and4. Not Proficient.
The divisions between the levels are called cut scores. The cut scores are recommended by a panel comprised of educators and other stakeholders throughout the state. This panel uses detailed descriptions
71

of what students in each of the performance descriptions should know and be able to do. Based upon these detailed descriptions and actual assessment items, the panel recommends the score that best separates each performance level from the next. See Chapter 6 for detailed standard setting process. The Michigan State Board of Education approves the final cut scores and performance level ranges.
5.2. Scores Reported
Brief descriptions of MEAP score reports are provided below. More extensive descriptions with samples are included in the Guide to Reports, Grades 3–9 (Fall 2009).
Summary Report is a comparative set of mean scale score information for each grade level, summarized by school, district, ISD, and state. All content areas and levels of performance are reported. The report is generated for three student populations: All students; students with disabilities (SWD); and all except students with disabilities (AESWD).
Demographic Report provides a summary breakdown of scores by demographic subgroup for each content area assessed. Summary data reported includes the number of students assessed in each subgroup, the mean scale score, the percentage of students attaining each performance level, and the percentage of students that met or exceeded Michigan standards within each content area. The Demographic Report is generated for all students, SWD, and AESWD. The demographic subgroup scores are aggregated by school, district, ISD, and state. The demographic subgroups reported are gender, ethnicity, economically disadvantaged (ED), English language learners (ELL), formerly limited English proficient (FLEP), and migrant.
Feeder School Report is a summary report provided to feeder schools at transition grade levels. For example, District A has three elementary schools (K-5) feeding into one middle school (6-8). Each elementary school will receive a Feeder School Report summarizing the data for current sixth-grade students that were enrolled in their elementary school at the end of Grade 5.
Item Analysis Report provides summary information for each multiple-choice item, and each constructed response item on the assessment, including the primary Michigan benchmark (GLCE) measured by each item. The summary information reports the percentage of students selecting each response. The report is generated for all students, SWD, and AESWD. The aggregate data is reported by class or group, school, district, and state.
Class Roster Report provides summary score information by class, for each strand and benchmark (GLCE) assessed within each content area, as well as detail information for each student assessed.
Individual Student Report (ISR) provides a detailed description of each student’s performance in the content area assessed. It is designed to help educators identify the academic strengths of their students and the areas that may need improvement.
Student Record Label is provided for each student assessed during the Fall 2009 cycle. The labels are mailed to the school for placement in the student record file.
Parent Report provides a summary description of their student’s performance in each content area assessed. This report is designed to help parents and guardians identify the academic strengths of their student and areas that may need improvement.
5.3. Appropriate Score Uses
MEAP assessment results have several uses for individual students and for comparing the performance of groups.
72

5.3.1. Individual Students
Individual student scale score and performance level can be used to evaluate the student’s achievement compared to the standards set by the state. Assessment results yield from MEAP can also be used to compare the performance of an individual student to the performance of a similar demographic or program group or to an entire school or district. For example, the scores for a Hispanic student in a Title I program can be compared to the average scores of Hispanic students, Title I students, all the students in a district, or any combination of these aggregations.
Other scores provide information about academic areas of relative strength or weakness. The scores in strands and benchmarks (GLCE) can help educators identify the academic strengths of their students and the areas that may need improvement. The sub-scores are not as reliable as total test scores and should be used in conjunction with other evaluations of performance to provide a portrait of the student’s achievement.
5.3.2. Groups of Students
Test scores can be used to compare the performance of different demographic or program groups to each other. All scores can be analyzed within the same subject and grade for any single administration to determine which demographic or program group had, for example, the highest average performance, the lowest percent meeting minimum expectations, or the highest percent mastery of the “chance and data” objective on the MEAP mathematics tests.
Other scores can be used to help evaluate academic areas of relative strength or weakness. The sub-score strands provide information to help identify areas where further diagnosis may be warranted when a school’s performance is contrasted with the district’s or state’s.
Because the MEAP tests are designed to measure content areas within the required standards, considering test results by subject area and by objective may be helpful when evaluating curriculum, instruction and their alignment to standards. Generalizations from test results may be made to the specific content domain represented by the objective or set of objectives being measured on the exam. However, because the tests are measuring a finite set of skills with a limited set of items, generalizations should be made only to student achievement as measured on a particular test. All instruction and program evaluations should include as much information as possible to provide a more complete picture of performance.
In addition, all test scores can be compared to regional and statewide performance within the same subject area and grade for any administration.
5.3.3. Item Statistics
Appendix H provides item level statistics by grade and subject area for the MEAP. These statistics represent the item characteristics used most often to determine how a group of students performed on a particular item and whether an item functioned in an appropriate manner. The item mean is synonymous with the item p-value. For multiple-choice items it is the percent of all students that responded to an item
73

correctly. For constructed-response items it is the average of score points earned on the item. Adjusted mean can be used to compare the difficulty of dichotomous and polytomous items and it is computed by the formula below:
item_minitem_maxitem_min__
meanitemMeanAdj .
For multiple-choice items, the adjusted mean is the same as item mean.
Rasch item difficulty and its standard error are also provided in the table. The mean square fit (MNSQ) statistics are used to determine whether items are functioning in a way that is congruent with the assumptions of the Rasch mathematical model. Under these assumptions, how a student will respond to an item depends on the ability of the student and the difficulty of the item, both of which are on the same measurement scale. If an item is as difficult as a student is able, the student will have a 50-50 chance of getting the item correct. If a student is more able than an item is difficult (under the assumptions of the Rasch model), that student has a greater than 50% chance of answering the item correctly. On the other hand, if the item is more difficult than the student is able, he or she has a less than 50% chance of responding correctly. Rasch fit statistics estimate the extent to which an item is functioning in this predicted manner. Items showing a poor fit to the Rasch model typically have values in excess of 1.3. Items may not fit the Rasch model for several reasons, all of which relate to students responding to items in an unexpected way. For example, if an item appears to be easy but consistently solicits an incorrect response from high scoring students, the fit value will likely be over 1.3. Similarly, if a difficult item is answered correctly by several low ability students, a fit flag may be generated. In most cases the reason behind why students respond in unexpected ways to a particular item is unclear. However, on occasion it is possible to determine the cause of an item’s misfit by re-examining the item and its distracters. For example, if several high ability students miss an easy item, re-examination of the item may show that it actually has more than one correct response.
Two types of MNSQ values are presented in Appendix H, OUTFIT and INFIT. MNSQ OUTFIT values are sensitive to outlying observations. Consequently, OUTFIT values will be large when students perform unexpectedly on items that are far from their ability level. For example, easy items for which very able students answer incorrectly and difficult items for which less able students answer correctly. MNSQ INFIT values are sensitive to behaviors that affect students’ performance on items near their ability estimates. Therefore, high INFIT values would occur if a group of students of similar ability consistently responded incorrectly to an item at or around their estimated ability. For example, under the Rasch model the probability of a student with an ability estimate of 1.00 responding correctly to an item with a difficulty of 1.00 is 50%. If several students at or around the 1.00 ability level consistently miss this item such that only 20% get the item correct, a fit flag will likely be generated because the performance of the item is inconsistent with the expectations of the model. Mis-keyed items or items that contain cues to the correct response (i.e., students get the item correct regardless of their ability) may elicit infit flags. Tricky items, or items that may be interpreted to have double meaning may elicit outfit flags.
Item-total correlations provide another measure of the congruence between the way an item functions and our expectations. Typically we expect students with high ability (i.e., those who perform well on the MEAP overall) to get items correct, and students with low ability (i.e., those who perform poorly on the
74

MEAP overall) to get items incorrect. If these expectations are accurate, the point-biserial (i.e., item-total) correlation between the item and the total test score will be high and positive, indicating that the item is a good discriminator between high ability and low ability students. A correlation value above 0.20 is considered acceptable; values closer to 1.00 indicate greater discrimination. A test comprised of maximally discriminating items will maximize internal consistency reliability. The correlation is a mathematical concept, and therefore not free from misinterpretation. Often when an item is too easy or too difficult, the point-biserial correlation will be artificially deflated. For example, an item with a p-value of .95 may have a correlation of only 0.15. This does not mean that this is a “bad” item. The low correlation is simply a side-effect of the item difficulty. If the item is extremely easy to everyone, not just high scoring students, getting it correct results in a low correlation. Due to these potential misinterpretations of the correlation, it is important to remember that this index alone should not be used to determine the quality of an item. It should instead be used as an indicator to flag items that need further investigation.
5.3.4. Frequency Distributions
Appendix W provides scale score distributions in histograms by grade and subject area for the MEAP assessment. The scale score distributions classified by gender, ethnicity, economically disadvantaged, and limited English proficiency allow us to compare performance of different sub-groups of students in MEAP assessment.
75

CHAPTER 6: PERFORMANCE STANDARDS
6.1. Development of Standard Setting Performance Level Descriptors
In this section, a brief description of the development of standard setting performance level descriptors (PLDs) is presented. The purpose of the PLDs meetings was to develop specific PLDs within and across grades in each subject area for the Michigan Educational Assessment Program (MEAP). The meetings were convened over a two day period, September 23-24, 2005, following the content alignment study being conducted by Norm Webb. Teachers participating in the content alignment study stayed an extra day to develop the PLDs to be used at the MEAP standard setting in January, 2006. A sample of those teachers stayed an additional half day to align the newly developed grade level PLDs across all grades.
Panelists first were asked to review the general performance level descriptors (PLDs), which were brief two to three sentence descriptions of each level. These PLD highlighted the words and phrases that most distinguished one level from another. The group facilitator led a brief discussion around these distinguishing factors and then reiterated the need to operationalize the descriptors for a given grade. They then reviewed the subject specific PLDs, which were more detailed descriptions at each level. Panelists were given time to review the Assessment Blueprint and grade level content expectations (GLCEs) associated with the grade and subject for which they were writing PLDs.
Panelists were asked to use the general and subject specific PLDs, the assessment blueprint, and GLCEs to define expectations for students at each of the four proficiency levels: Level 1: Exceeded Michigan Standards, Level 2: Met Michigan Standards, Level 3: Basic Level, and Level 4: Apprentice. Panelists were reminded that the goal of the task was to operationalize the performance level descriptors to foster a common understanding of what it meant to be classified within a given level. Individuals contributed to a final list representing the general consensus.
Table 6.1.1 lists the tasks and timeframe of steps in the planning for and completing the specific standard setting performance level descriptors (SS PLDs).
76

Table 6.1.1 Tasks and Deliverables for Development of SS PLDs
Task/Deliverable Owner Deadline/Timeframe
Draft outline of SS PLDs plan PEM 6/7/05Feedback/edits to outline OEAA 6/14/05Finalize dates and location (need content staff to represent MEAP) OEAA 6/30/05General and subject specific PLDs defined OEAA 7/22/05Feedback/edits to plan OEAA 7/29/05Invite members to participate in committees OEAA 8/1/05SS PLDs development plan/script to OEAA PEM 8/12/05Feedback/edits to script OEAA 8/18/05Finalize script PEM 8/19/05Finalize list of attendees OEAA 8/30/05Train facilitators in Iowa City PEM 9/1/05Train facilitators in Austin PEM 9/6/05Facilitate committees to develop SS PLDs PEM 9/23-9/24/05SS PLD write-up PEM 10/27/05
Panelists
For pairwise grade SS PLDs: Panelists were familiar with the grade level and content area. In fact, most panelists taught in the grade level and content area for which they were developing SS PLDs. Since the MEAP was administered in the Fall, it was assessing content from the previous grade. For instance, grade 5 mathematics MEAP was assessing content from fourth grade. Following the content alignment study, the teachers stayed on an extra day (and a half) to write the SS PLDs. Table 6.1.2 lists the committee makeup by subject and grade. For ELA and math, each subject had three committees. Each committee was to be comprised of four teachers writing the SS PLDs: four for grades 3 and 4, four teachers writing the SS PLDs for grades 5 and 6, and four teachers writing the SS PLDs for grades 7 and 8. For science, the committee was to include the eight members from the content alignment study, for both grades 5 and 8 (each with four teachers per grade). Social studies was not undergoing content alignment, so teachers were brought in a half-day early to review the content before starting the SS PLD task, with a makeup similar to the science committees: four teachers for grade 6 and four teachers for grade 9. However, the target set of panelists were not met, and as seen in Table 6.1.2 below, there were fewer panelists than anticipated for each committee. In essence, none of the out-of-state teachers from the content alignment study stayed to help set the SS PLDs, and not all Michigan teachers came to either set of meetings. The only exception was in the science committee, where there was an abundance of Michigan science educators who participated. For each committee, there is a summary of the demographic information collected for each panelist attached to this report.
77

Table 6.1.2 Panelist distribution by grade
Subject Grade Target: Panelists Actual PanelistsELA 3/4 four teachers: two from Michigan and two
from out-of-statetwo Michigan educators
ELA 5/6 four teachers: two from Michigan and two from out-of-state
two Michigan educators
ELA 7/8 four teachers: two from Michigan and two from out-of-state
three Michigan educators
Math 3/4 four teachers: two from Michigan and two from out-of-state
four Michigan educators
Math 5/6 four teachers: two from Michigan and two from out-of-state
three Michigan educators
Math 7/8 four teachers: two from Michigan and two from out-of-state
three Michigan educators
Science 5/8 eight teachers: four from Michigan and four from out-of-state
seven Michigan educators
Social Studies
6/9 eight teachers: four from Michigan and four from out-of-state
four Michigan educators
There was also vertical alignment of SS PLDs, which was a second component to the meetings. The vertical alignment component of the SS PLDs brought together all panelists from the grade level committees in math for a total of 10 panelists and in ELA, for a total of seven panelists. The purpose of this super-committee was to align the SS PLDs across grades, in ELA and in math. There was no vertical alignment aspect to the science or social studies groups, since both subjects only had two grades being assessed.
Facilitators were consistent in using the script, agenda, and materials provided. For the math, ELA and science committees, panelists began the SS PLDs meetings at 1:00 pm on September 23, 2005. Since social studies was not undergoing content alignment, the social studies teachers began at 8:00 am to have a half-day to learn about the content alignment terminology as well as to become more intimately involved in understanding the test items and the content standards and benchmarks being measured by the MEAP assessments.
At 1:00 pm, teachers from all four subjects began their participation in the SS PLD meeting. OEAA introduced the need for aligned PLDs across grades as part of the standard setting process. Panelists then reviewed the general PLDs that described the four performance levels and reviewed the activities they would be involved in for the remainder of their time. Panelists were then divided into small groups, based on the grades and subjects they were participating in, for a total of eight separate committees. For ELA, there were three committees: one for grades 3 and 4, one for grades 5 and 6, and one for grades 7 and 8. Similarly, there were three such committees for mathematics. For science, there was one committee for grades 5 and 8, and for social studies there was one committee for grades 6 and 9.The ELA and math committees began by reviewing the content alignment terminology. This was to insure that the frame of reference of the panelists was thinking about how the performance levels were
78

to be aligned across grade levels. Science and social studies panelists did not participate in this activity. Social studies and science panelists began by elaborating on the general PLDs, to better understand the PLDs that were currently written and how to define the differences in performance levels. Committees would use a flip chart to expand the definition of each performance level using the general PLDs. They started by first defining Level 2 (met), then Level 3 (basic), Level 1 (exceeded), and lastly Level 4 (apprentice). ELA and math committees participate in this activity as soon as they finished reviewing the alignment review. Note: ELA panelists had the extra task of writing SS PLDs for both reading and writing. The SS PLDs for science were already written, which was not known until the beginning of the meetings, so the science committees reviewed the currently written SS PLDs using the same format of the script as the other subjects.
The panelists then reviewed the NAEP subject and grade-level specific PLDs to better understand how to frame their writing of the subject-specific PLDs. Committees then began writing subject and grade-level specific PLDs starting with the Level 2 (met) category. They would first start with the lower of the two grades they were reviewing, and then write the PLDs for the upper grade. This same process was followed for Level 3 (basic), Level 1 (exceeded), and lastly Level 4 (apprentice). One additional task was that once a new level of PLDs was written, the panelists were asked to compare and contrast the PLDs from the level above and below (e.g. comparing met to basic). This was to help them see how well they were aligning their PLDs across grades as well as within a performance level. Once the committees wrote all four levels, they were asked to review all four levels using the pairs of grades in their committees. They were allowed to make any edits at that time. At the end of this task, the social studies and science committees were finished and completed their evaluations. Math and ELA teachers took a lunch break before coming back to two super-committees, one per subject, to do the vertical alignment across all six grades.
In the vertical alignment committees, there were 10 math panelists representing all six grades and seven ELA teachers representing all six grades. Panelists were asked to review the SS PLDs created by the other three committees. They were asked to think about what characterized students at each of the four performance levels, first within grade and then across grades. This was so the panelists could preserve the PLDs at each grade level, as well as to show how such performance was aligned across all six grades. The two committees struggled with this task, as each committee wrote their SS PLDs in different ways, even when given the NAEP PLDs as an example and a chart for filling in the SS PLDs within a grade and performance level. The mathematics committee appeared to come away with a relatively vertically aligned set of SS PLDs across grades, while ELA was not able to do so. There was an issue in ELA where one of the panelists was highly opinionated and would not let the committees move forward. Given the size of the panel was so small, this panelist’s personality impacted the progress that could have been made in this committee.
The SS PLDs from the eight separate grade and subject-specific committees as well as the two sets of vertically aligned SS PLDs are forwarded to OEAA and MEAP staff for review and edits, prior to being used for standard settings in January, 2006. Those documents are available at OEAA. In addition, a complete report on SS PLDs is available at OEAA.
79

6.2. Standard Setting
In recent years the federal government has required an increase in achievement testing programs at the state level. The legislation supporting these requirements is included in the No Child Left Behind law. Because of the No Child Left Behind (NCLB) law, both MEAP and MI-Access had to initiate grade level assessments in grades 3-8 this Fall. As a result, each program has had to set performance standards (cut scores) for each content area and grade level assessed. The table below shows the grades and subject areas for which performance standards were set:
Grade Levels for Which Standards Were SetSubject Area MEAP MI-AccessEnglish language arts 3 - 8 3 - 8Mathematics 3 - 8 3 - 8Science 5, 8 --Social Studies 6, 9 --
The performance standards define the levels of performance for the statewide assessments used in Michigan. For MEAP, these are Level 1: Exceeds State Standards; Level 2: Met State Standards; Level 3: Basic; and, Level 4: Apprentice. For Mi-Access, the three levels are labeled as Surpassed Standard; Attained Standard; and, Emerging Toward the Standard.
Standard setting activities were carried out for each grade assessed in MEAP, for all grades, even those that were previously assessed, since the tests at these grades changed from 2004 to 2005. In these cases, the goal was to set standards that are similar to those set before, so as not to change dramatically the AYP determinations based on these performance standards. For newly assessed grades, the goal was to set performance standards that are consistent with the standards set for the grades previously assessed.
Standard setting was carried out by panels of educators working under the direction of the contractors for MEAP and staff of the Department. Each panel spent two or more days reviewing the assessment instrument(s) assigned to them, individually judging the level of performance that students would need to achieve for each of the four performance levels for each assessment, discussing these within their panel, and repeating this process up to three times, with additional performance information provided during each round.
Panelists made their final judgments on their own, and the resulting recommendations are a compilation of these individual judgments. Panelists were then asked to indicate their support for the standards that they set and the processes used to set them. The result of this effort is that panels recommended performance standards for each program, grade level and content area.
Standards were recommended for the MEAP assessments administered in the Fall of 2005 in Mathematics, Reading, and Writing at grades 3, 4, 5, 6, 7, and 8. Standards were recommended for the MEAP Science assessment at grades 5 and 8 and Social Studies at grades 6 and 9. In all test areas and grade levels, three cut scores were recommended which identify student work as Apprentice, Basic, Met, or Exceeded.
80

The procedure used for identifying the cut scores in writing was based on the classification of student work samples. For all other test areas a modified item mapping procedure was used. One of the unique features of this standard setting was the focus on setting standards for the entire system, i.e., grades 3 through 8 rather than simply focusing on one grade in isolation. For each test area there were two committees, one for the elementary grades (3 - 5) and one for the middle grades (6 - 8). At various points in the procedure, the two groups met together to discuss their understanding of the Performance Level Descriptors (PLDs) or to discuss the results of their ratings. In the end, the two committees shared responsibility for the development of a system of cut scores spanning the 6 grades which would produce results that would appear logical and consistent across grades.
In a typical item mapping standard setting, committee members are presented with an item ordered booklet. This booklet contains all test items (one to a page) arranged in order from the easiest item to the most difficult item based on student performance. Panelists are then instructed to think of a group of 100 students who are just barely meeting the standard. The panelist then decides if at least 50% of those students would be able to answer the question correctly. If the panelist decides that yes, at least 50% would answer the item correctly, then the next item in the booklet is reviewed. Eventually the panelist identifies an item where it does not appear that 50% would answer the item correctly. At that point, the panelist goes back to the previous item where 50% would answer correctly and places a bookmark on the item. This procedure never works this smoothly and there is always a gray area where it is difficult to decide on the exact item, but panelists eventually settle on an item for their bookmark. Panelists are then given the opportunity to discuss their ratings with others in their group and try to resolve some of the differences in judgments.
We followed the same procedure in these standard settings with one difference. In the ordered item booklet three items were identified as reference items. If selected, these items would produce cut scores such that the percentage of students in each of the four categories would form straight lines from grade 3 to grade 8. More specifically, in those grades where there were test results from last year, the reference items were selected to produce results similar to last year. After the committees produced their final recommendations for these grades, reference items were selected for the other grades which produced “smooth” results.
When this procedure was first conceived, there was concern that the use of reference items may unduly influence the judgments of the panelists taking away the need for their professional judgments. Based on the resulting cut scores and the information obtained from the survey each panelist completed at the end of the process, it appears that although the reference items gave them information on the “reasonableness” of the ratings, most committee members seldom picked the reference item for their bookmark. Instead, they used their professional judgment and their understanding of the PLDs to select what they considered the appropriate item. Therefore, the resulting cut scores did not produce straight lines in terms of student performance and there is variability across the grades reflecting the judgments of the committees.
Although most committee members selected items other than the reference items, the fact that those items were present in the item ordered booklets seems to have had the intended effect. That is, the resulting impact of the cut scores did not produce results with large variations across the grades. There are differences as one would expect in a standard setting, but when examining the entire system grades 3 through 8, the results seemed reasonable to the committees.
81

In the writing standard setting, committee members were given reference student work samples in grades 4 and 7, which if classified as indicated would have produced results similar to last year. After the committees completed their final recommendations and the cut scores were determined, reference student work samples were identified for grade 3, 5, 6, and 8. These were presented to the committees before they began the standard settings for the other grade levels.
The use of reference student work samples appears to have had the same effect on the panelists in the writing standard setting as the reference items did in the other standard settings. The panelists used the information, but did not feel constrained by it. There are variations in the results across grades, but the committee members felt that they were logical and reasonable.
Based on the notes from each of the rooms, the resulting cut scores, and the feedback from the surveys, it appears that the standard setting was implemented according to the intended plan and the committee members took their task seriously.
The complete standard setting report is provided in Appendix I. This report includes information on the standard setting methods, panel selection, technical issues, results, and feedback, and details this process for mathematics, reading, writing, science and social studies.
82

CHAPTER 7: SCALING
Rationale Behind Test Scaling
The basic score on any test is the raw score, which is the number of items correct. However, the raw score alone does not present a wide-ranging picture of test performance because it can be interpreted only in terms of a particular set of items. When new test forms are administered in subsequent administrations, other types of derived scores should be used to compensate for any differences in the difficulty of the items and to allow direct comparisons of student performance between administrations. Measurement Incorporated (MI), in cooperation with the Michigan Educational Assessment Program (MEAP), provides a derived scale score system for reporting performance on the MEAP.
Rasch Measurement Models
The Rasch Partial Credit Model (RPCM) is used to derive the scale score system for the MEAP. The RPCM, an extension of the Rasch model, accommodates the constructed response tasks associated with the MEAP.
The advantage of using IRT models in scaling is that all of the items measuring performance in a particular content area can be placed on the same scale of difficulty. The further value of the one-parameter (Rasch) model over more complex IRT models is that the Rasch model assumes that for each raw score point there is only one ability. This relationship allows the Rasch difficulty values for the individual items to be used in computing a Rasch ability level for any raw score point on any test constructed from these items, thereby allowing for scaling and longitudinal comparability.
The Rasch Partial Credit Model (RPCM) is an extension of the Rasch model attributed to Georg Rasch (1960), as extended by Wright and Stone (1979), and Wright and Masters (1982). The RPCM is used because of its flexibility in accommodating multiple-response category data and its ability to maintain a one-to-one relationship between the derived (i.e., scale) and the underlying raw score scale. The RPCM is the underlying scale score system that will facilitate the equating of multiple test forms and allow for comparisons of student performance across years. Additionally, such an equitable scale will facilitate the transfer of equivalent performance standards across the years. The RPCM is defined via the following mathematical measurement model where, for a given item involving m score categories, the probability of person n scoring x on prompt i is given by:
,)(exp
)(exp
0 0
0
im
k
k
jijn
x
jijn
xni
DB
DBP
where x = 0, 1, 2, . . . , m, and
0
0
. 0)(j
ijn DB
83
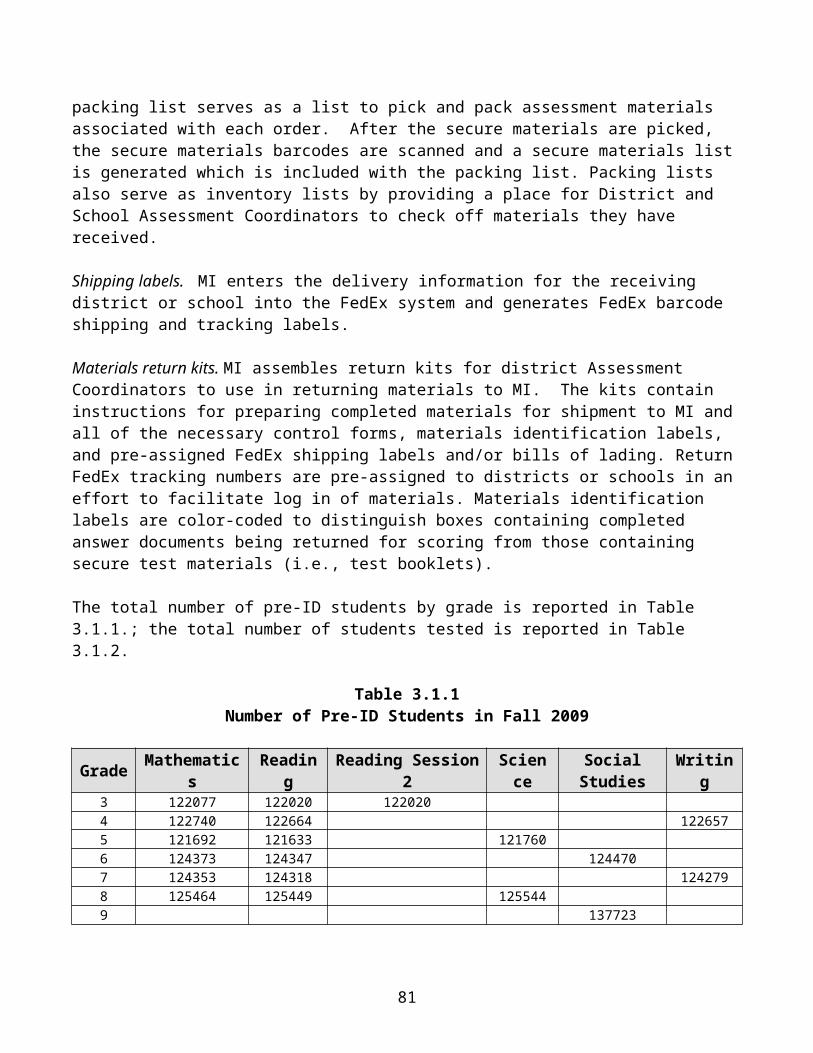
The RPCM provides the probability of a person scoring x on the mi step of task i as a function of the person’s ability (Bn) and the step difficulties of the m steps in task i (see Masters, 1982, for an example).
7.1. Summary Statistics and Distributions from Application of Measurement Models
Classical test theory (CTT) and item response theory (IRT) analyses are applied to MEAP data. Section 7.1.1 provides the summary of the CTT analyses, and section 7.1.2 is the summary of the IRT analyses.
7.1.1. Summary Classical Test Theory Analyses by Form
The tables in Appendix J provide summary classical test theory analyses by form, grade and subject. The mean p values for mathematics grade 3-8 are slowly decreasing (.62, .60, .57, .55, .52, and .50) and the mean point-biserial values range from .35 to .39 across grades. The mean p values for reading are around .65 to .70 across grade and the mean point-biserial values range from .31 to .44 across grade. For science, grades 5 and 8 have mean p values of .62 and .56, respectively and mean point-biserial values is .35 for both grades 5 and 8. For social studies, the grade 6 and 9 have mean p values of .58 and .60, respectively and the mean point-biserial values are .35 and .39, respectively.
7.1.2. Item Response Theory Analyses by Form and for Overall Grade-Level Scales
The assessments are analyzed using the Rasch Partial Credit Model and procedures implemented in WINSTEPS version 3.68.2. The statistical elements of the calibrating/scaling process are referred to as Rasch Calibration/Scaling as described in the WINSTEPS manual. Different versions of the same program may have subtle differences in how they implement the estimation routines, which on the surface appear to be consistent with past techniques. Because these changes may result in meaningful differences in estimation outcomes when applied to large testing populations, the version 3.68.2 was used for calibration activities.
7.1.2.1. Step-by-Step Description of Procedures Used to Calibrate Student Responses, Using Item Response Theory
The scaling design is referred to as a common item nonequivalent groups design (Kolen & Brennan, 2004). PEM (Pearson Educational Measurement) and OEAA work together to build the test forms based on the test blueprint and available statistical information from data field tested in previous years. All assessments (English language arts (ELA), mathematics, science, and social studies) use an embedded matrix sampling design for building and replenishing the item pool. For 2009, there are 7 forms for each subject. A sparse matrix that included all the scored items was created for each subject area by grade. A concurrent calibration was applied for each subject area by grade. Detailed procedures were provided in the sections below.
Calibration Steps for Mathematics, Reading, Science and Social Studies
1. Run WINSTEPS without anchored items (free-run)2. Do an anchor evaluation procedure:
a. Compute the ‘Mean-Mean’ equating constant =: EQK as the difference between the average of pre-equated Rasch values (scaled to 2008 operational year) and average of free-run Rasch values.
84

b. For all items, calculate the difference between the operational Rasch value + EQK and the pre-equated Rasch value.
c. Flag any item from consideration if the difference in absolute value is greater than 0.5.d. If there are no flagged items then stop, otherwise remove the flagged item with the
maximum difference from the item list and go to Step 2.a.3. The equated theta value is defined as:
EQKFreeRun
7.1.2.2. Summary Post-Calibration Score Distributions
The tables in Appendix K provide summary post-calibration score distribution by form, grade and subject (scale score distribution and performance level percentage). The overall summary post-calibration score distribution by grade and subject is presented in Table 7.1.2.2.1.
Table 7.1.2.2.1Fall 2009 Administration –Scale Score Distribution by Grade and Subject
With Performance Level Percentages
Scale Score % of Performance Level
Subject Grade Form N Mean SD Min MaxNot
ProficientPartially Proficient Proficient Advanced
MA 03 00 114723 330.45 21.90 233.00 420.00 0.08 5.04 43.06 51.82
MA 04 00 115798 429.96 23.21 320.00 542.00 0.34 7.35 46.89 45.42
MA 05 00 114914 526.22 32.58 414.00 674.00 3.56 16.81 36.12 43.51
MA 06 00 116457 624.59 28.66 475.00 755.00 2.33 15.49 34.11 48.07
MA 07 00 117984 725.29 28.42 631.00 860.00 1.05 16.58 32.37 50.00
MA 08 00 118891 818.43 27.61 677.00 957.00 8.09 21.20 25.70 45.00
RD 03 00 114090 331.10 24.30 192.00 420.00 1.04 9.03 50.94 38.98
RD 04 00 115113 433.69 33.06 291.00 527.00 2.02 13.77 46.84 37.38
RD 05 00 114400 531.27 29.26 385.00 624.00 5.06 9.62 41.48 43.83
RD 06 00 116145 626.15 22.05 483.00 726.00 2.00 10.18 60.67 27.14
RD 07 00 117939 725.51 28.18 572.00 821.00 6.59 11.15 45.91 36.35
RD 08 00 118696 822.94 24.10 690.00 918.00 3.28 13.06 52.58 31.07
SC 05 00 115757 525.29 28.04 422.00 660.00 3.08 15.79 42.50 38.63
SC 08 00 119711 819.38 25.69 692.00 960.00 4.96 18.74 45.83 30.48
SS 06 00 117352 614.82 23.62 515.00 723.00 10.42 15.97 31.10 42.51
SS 09 00 127631 917.20 28.90 773.00 1032.0 10.29 18.46 35.76 35.49
85

For mathematics, the mean scale scores for the overall grade level across grades are 330, 430, 526, 625, 725 and 818 with standard deviation between 22 and 33. Overall, the student performance is consistent across forms based on the observation from the scale score distribution and the performance level.
For reading, the mean scale scores for the overall grade level across grade are 331, 434, 531, 626, 726 and 823 with standard deviation between 22 and 29. Overall, the student performance is consistent across forms based on the observation from the scale score distribution and the performance level percentage.
For science, the mean scale scores for grade 5 and grade 8 are 525 and 819 with standard deviations for grade 5 and grade 8 are 28 and 26, respectively. Overall, the student performance is consistent across form, based on the observation from the scale score distribution and the performance level percentage.
For social studies, the mean scale scores for grade 6 and grade 9 are 615 and 917, respectively. The standard deviations for grade 6 and grade 9 are 24 and 29, respectively. Overall, the student performance is consistent across form, based on the observation from the scale score distribution and the performance level percentage.
Scale score histograms with the overlaid cut-score for the base forms by grade and subjects are displayed in Figures 7.1.2.2. Also the figures in Appendix L are the scale score histograms with the overlaid cut-score across form, grade, and subject. The visual displays share the same patterns as the tables in Appendix K; the student performance is consistent across form on scale score distribution and the performance level percentage. For mathematics, the histograms look smooth and in a normal distribution form. For reading, the histograms are not as smooth and normal as those for mathematics. The reading scale score distributions for are negatively skewed. There are several score gaps in the right end of the score distribution. For reading, the histograms are not as smooth as those for the other subjects because the test lengths are much shorter and the maximum raw score points are much smaller.
86
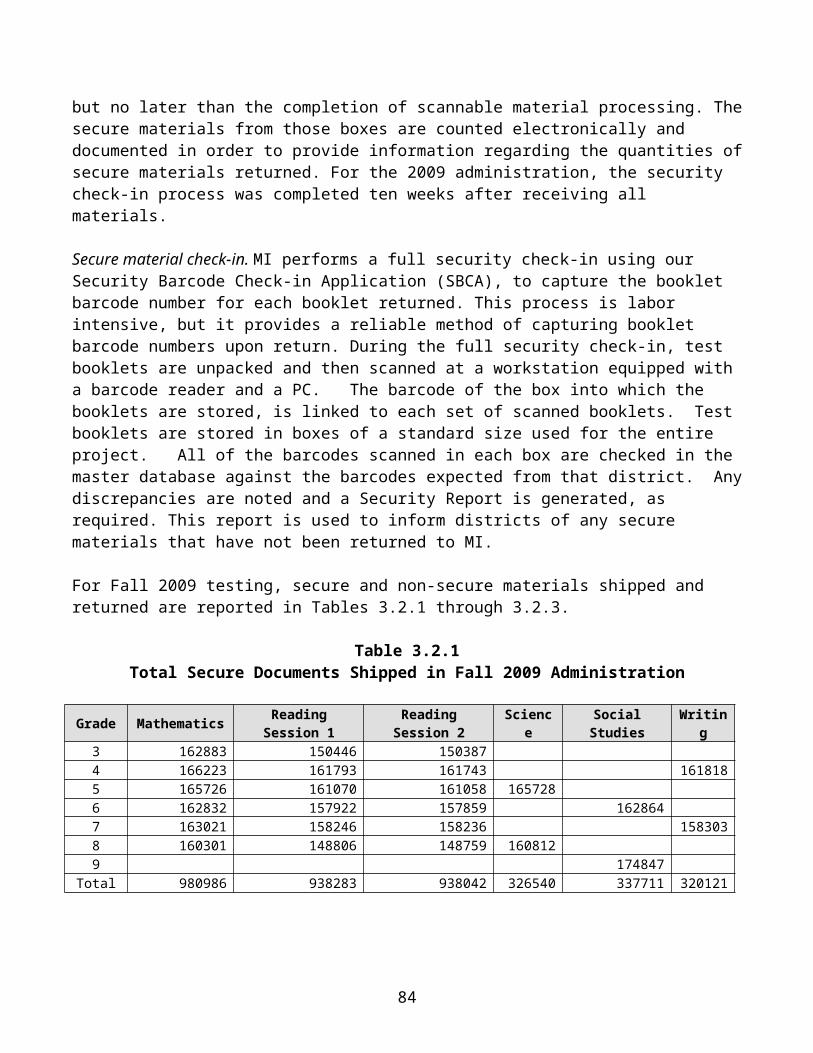
Fig ure 7.1 .2 .2 : Fall 2 009 A dm inis tration M athem atics 03 - Scale Score Dis tribu tionw ith Perform ance Level Cu tpoin t Overlay
PP P A
2 34 2 49 2 64 2 79 2 94 309 32 4 339 354 369 384 399 4140
1
2
3
4
5
6
7
8
Per
cen
t
M ean 330Std Deviation 2 1.90N
87

Fig ure 7.1 .2 .2 : Fall 2 009 A dm inis tration M athem atics 04 - Scale Score Dis tribu tionw ith Perform ance Level Cu tpoin t Overlay
PP P A
32 0 338 356 374 392 410 42 8 446 464 482 500 518 5360
1
2
3
4
5
6
7
8P
erce
nt
M ean 430Std Deviation 2 3.2 1N
Fig ure 7.1 .2 .2 : Fall 2 009 A dm inis tration M athem atics 05 - Scale Score Dis tribu tionw ith Perform ance Level Cu tpoin t Overlay
PP P A
414 434 454 474 494 514 534 554 574 594 614 634 654 6740
1
2
3
4
5
6
7
Per
cen
t
M ean 52 6Std Deviation 32 .58N

Fig ure 7.1 .2 .2 : Fall 2 009 A dm inis tration M athem atics 06 - Scale Score Dis tribu tionw ith Perform ance Level Cu tpoin t Overlay
PP P A
476 496 516 536 556 576 596 616 636 656 676 696 716 736 7560
1
2
3
4
5
6
7
8P
erce
nt
M ean 62 5Std Deviation
Fig ure 7.1 .2 .2 : Fall 2 009 A dm inis tration M athem atics 07 - Scale Score Dis tribu tionw ith Perform ance Level Cu tpoin t Overlay
PP P A
632 650 668 686 704 72 2 740 758 776 794 812 830 8480
1
2
3
4
5
6
7
Per
cen
t
M ean 72 5Std Deviation 2 8.42N 117984
M athem atics G rad e 07 Scale Score

Fig ure 7.1 .2 .2 : Fall 2 009 A dm inis tration M athem atics 08 - Scale Score Dis tribu tionw ith Perform ance Level Cu tpoin t Overlay
PP P A
678 698 718 738 758 778 798 818 838 858 878 898 918 938 9580
1
2
3
4
5
6
7
8P
erce
nt
M ean 818
Fig ure 7.1 .2 .2 : Fall 2 009 A dm inis tration Science 05 - Scale Score Dis tribu tionw ith Perform ance Level Cu tpoin t Overlay
PP P A
42 3 441 459 477 495 513 531 549 567 585 603 62 1 639 6570
1
2
3
4
5
6
7
8
Per
cen
t
M ean 52 5Std Deviation 2 8.04N

Fig ure 7.1 .2 .2 : Fall 2 009 A dm inis tration Science 08 - Scale Score Dis tribu tionw ith Perform ance Level Cu tpoin t Overlay
PP P A
692 712 732 752 772 792 812 832 852 872 892 912 932 9520
1
2
3
4
5
6
7P
erce
nt
M ean 819Std Deviation
Fig ure 7.1 .2 .2 : Fall 2 009 A dm inis tration Social S tud ies 06 - Scale Score Dis tribu tionw ith Perform ance Level Cu tpoin t Overlay
PP P A
516 531 546 561 576 591 606 62 1 636 651 666 681 696 7110
1
2
3
4
5
6
7
8
Per
cen
t
M ean

Fig ure 7.1 .2 .2 : Fall 2 009 A dm inis tration Social S tud ies 09 - Scale Score Dis tribu tionw ith Perform ance Level Cu tpoin t Overlay
PP P A
772 796 82 0 844 868 892 916 940 964 988 10120
1
2
3
4
5
6
7
8P
erce
nt
M ean 917
Fig ure 7.1 .2 .2 : Fall 2 009 A dm inis tration R ead ing 03 - Scale Score Dis tribu tionw ith Perform ance Level Cu tpoin t Overlay
PP P A
192 2 10 2 2 8 2 46 2 64 2 82 300 318 336 354 372 390 4080
1
2
3
4
5
6
7
8
Per
cen
t
M ean 331Std Deviation

Fig ure 7.1 .2 .2 : Fall 2 009 A dm inis tration R ead ing 04 - Scale Score Dis tribu tionw ith Perform ance Level Cu tpoin t Overlay
PP P A
2 93 311 32 9 347 365 383 401 419 437 455 473 491 509 52 70
1
2
3
4
5
6
7P
erce
nt
M ean 434
Fig ure 7.1 .2 .2 : Fall 2 009 A dm inis tration R ead ing 05 - Scale Score Dis tribu tionw ith Perform ance Level Cu tpoin t Overlay
PP P A
384 402 42 0 438 456 474 492 510 52 8 546 564 582 600 6180
1
2
3
4
5
6
7
8
Per
cen
t
M ean 531
Fig ure 7.1 .2 .2 : Fall 2 009 A dm inis tration R ead ing 06 - Scale Score Dis tribu tionw ith Perform ance Level Cu tpoin t Overlay
PP P A
483 501 519 537 555 573 591 609 62 7 645 663 681 699 7170
1
2
3
4
5
6
7
8
9P
erce
nt

Fig ure 7.1 .2 .2 : Fall 2 009 A dm inis tration R ead ing 07 - Scale Score Dis tribu tionw ith Perform ance Level Cu tpoin t Overlay
PP P A
572 592 612 632 652 672 692 712 732 752 772 792 8120
1
2
3
4
5
6
7
8
Per
cen
t
Fig ure 7.1 .2 .2 : Fall 2 009 A dm inis tration R ead ing 08 - Scale Score Dis tribu tionw ith Perform ance Level Cu tpoin t Overlay
PP P A
690 708 72 6 744 762 780 798 816 834 852 870 888 9060
1
2
3
4
5
6
7
Per
cen
t
M ean 82 3
95

7.1.2.3. Summary Statistics on Item Parameter Distributions and Fit Statistics
Item parameter distributions for grades and subjects are displayed in Figures 7.1.2.3. The tables in Appendix M provide summary statistics on item parameter distributions and fit statistics by form, grade, and subject.
For mathematics, the mean b parameter from grade 3 to grade 8 are 1.31, 1.19, .54, .79, 1.04, and .64 respectively, with standard deviation of .99, .97, 1.21, .84, .80, and .71. The mean infit statistics are around 1.0 with standard deviation between .08 and .12 across form and grade, and the mean outfit statistics are around 1.0 with standard deviation between .15 and .34.
For reading, the mean b parameter values from grade 3 to grade 8 are –.10, –.19, –.14, .08, –. 24, and .46 respectively with standard deviation of .85 .52, .87, 1.16, .80, and .68. The mean infit statistics are around 1.0 with standard deviation between .07 and .12 across grades and the mean outfit statistics are around 1.0 with standard deviation between 0.12 and 0.20.
For science grade 5 and grade 8, the mean b parameter values are .01 and .06 with standard deviation of .69 and .77, respectively. For social studies grade 6 and grade 9, the mean b parameter values are -.06 and -.39 with standard deviation of .51 and .49. Both science and social studies have mean infit and outfit statistics around 1.0 across grades.
Fig ure 7.1 .2 .3: M athem atics IR T - B Param eter Dis tribu tionfor M EAP Fall 2009
-1 .5000 1.50000
10
2 0
30
40
50
60
Per
cen
t
M ean 1.31Std Deviation 0.99N 54
03
-1 .5000 1.5000
M ean 1.19Std Deviation 0.97N 60
04
96

Fig ure 7.1 .2 .3: M athem atics IR T - B Param eter Dis tribu tionfor M EAP Fall 2009
-1 .5000 1.50000
10
2 0
30
40
50
60
Per
cen
t
M ean 0.75Std Deviation 0.87N 60
06
-1 .5000 1.5000
M ean 1.04Std Deviation 0.80N 62
07
Fig ure 7.1 .2 .3: Science IR T - B Param eter Dis tribu tionfor M EAP Fall 2009
-1 .7500 -0.7500 0.2 500 1.2 5000
5
10
15
2 0
2 5
30
Per
cen
t
M ean 0.01Std Deviation 0.69N 51
05
-1 .7500 -0.7500 0.2 500 1.2 500
94

Fig ure 7.1 .2 .3: Social S tud ies IR T - B Param eter Dis tribu tionfor M EAP Fall 2009
-1 .2 000 -0.4000 0.40000
5
10
15
2 0
2 5
30
35
Per
cen
t
M ean -0.06Std Deviation 0.51N 40
06
-1 .2 000 -0.4000
Fig ure 7.1 .2 .3: R ead ing IR T - B Param eter Dis tribu tionfor M EAP Fall 2009
-2 .4000 -0.6000 1.2 0000
10
2 0
30
40
50
Per
cen
t
M ean -0.10Std Dev iation 0.86N 31
03
-2 .4000 -0.6000 1.2 000
M ean -0.19S td Dev ia tion 0.52N 31
04
94

Fig ure 7.1 .2 .3: R ead ing IR T - B Param eter Dis tribu tionfor M EAP Fall 2009
-2 .4000 -0.6000 1.2 0000
10
2 0
30
40
50
Per
cen
t
M ean 0.08Std Deviation 1.17N 31
06
-2 .4000 -0.6000 1.2 000
M ean -0.24S td Dev ia tion 0.81N 31
07
-2 .4000
7.1.2.4. Test Information/Standard Error Curves
Figures 7.1.2.4 provide the test information function and conditional standard error curves by form, grade, and subject.
99

Figure 7 .1.2.4: Fall 2009 A dm in istration M athem atics 03 - In form ation Fu nctionand Standard Error Curves w ith Perform ance Level Over lay
100

Figure 7 .1.2.4: Fall 2009 A dm in istration M athem atics 04 - In form ation Fu nctionand Standard Error Curves w ith Perform ance Level Over lay
Figure 7 .1.2.4: Fall 2009 A dm in istration M athem atics 05 - In form ation Fu nctionand Standard Error Curves w ith Perform ance Level Over lay

Figure 7 .1.2.4: Fall 2009 A dm in istration M athem atics 06 - In form ation Fu nctionand Standard Error Curves w ith Perform ance Level Over lay
Figure 7 .1.2.4: Fall 2009 A dm in istration M athem atics 07 - In form ation Fu nctionand Standard Error Curves w ith Perform ance Level Over lay

Figure 7 .1.2.4: Fall 2009 A dm in istration M athem atics 08 - In form ation Fu nctionand Standard Error Curves w ith Perform ance Level Over lay
Figure 7 .1.2.4: Fall 2009 A dm in istration R ead ing 03 - In form ation Functionand Standard Error Curves w ith Perform ance Level Over lay

Figure 7 .1.2.4: Fall 2009 A dm in istration R ead ing 04 - In form ation Functionand Standard Error Curves w ith Perform ance Level Over lay
Figure 7 .1.2.4: Fall 2009 A dm in istration R ead ing 05 - In form ation Functionand Standard Error Curves w ith Perform ance Level Over lay

Figure 7 .1.2.4: Fall 2009 A dm in istration R ead ing 06 - In form ation Functionand Standard Error Curves w ith Perform ance Level Over lay
Figure 7 .1.2.4: Fall 2009 A dm in istration R ead ing 07 - In form ation Functionand Standard Error Curves w ith Perform ance Level Over lay

Figure 7 .1.2.4: Fall 2009 A dm in istration R ead ing 08 - In form ation Functionand Standard Error Curves w ith Perform ance Level Over lay
Figure 7 .1.2.4: Fall 2009 A dm in istration Science 05 - In form atio n Functionand Standard Error Curves w ith Perform ance Level Over lay

Figure 7 .1.2.4: Fall 2009 A dm in istration Science 08 - In form atio n Functionand Standard Error Curves w ith Perform ance Level Over lay
Figure 7 .1.2.4: Fall 2009 A dm in istration Social Stud ies 06 - In fo rm ation Functionand Standard Error Curves w ith Perform ance Level Over lay

Figure 7 .1.2.4: Fall 2009 A dm in istration Social Stud ies 09 - In fo rm ation Functionand Standard Error Curves w ith Perform ance Level Over lay
7.1.2.5. Summary of Model Fit Analyses
The tables in Appendix N show the summary of the item fit statistics. All subjects have 100 percent infit statistics within (0.5, 1.5) category. For outfit statistics 1.45 percent of mathematics grade 5 has the outfit statistic greater than 2.0. Overall, based on the infit and outfit statistics, all items fit the Rasch model.
7.2. Scale Scores
7.2.1. Description of the MEAP Scale
There are four performance levels for MEAP: Not Proficient, Partially Proficient, Proficient, and Advanced. Three cut-scores are needed to define the four performance levels. For MEAP Grades 3-8, the OEAA has decided to set the cut score for “Proficient on Michigan Standards” for a given grade to be X00 for grade X, such that 300 is the equivalent Proficient scale score for grade 3, 400 for grade 4, 500 for grade 5, 600 for grade 6, 700 for grade 7, and 800 for grade 8. To set a scale for each given grade, either two scale score points need to be set or one scale score point and the variability need to be set. To set the MEAP scale, a common standard deviation across grades is set at 25.

7.2.2. Identification of the Scale, Transformation of IRT Results to MEAP Scale
Tables 7.2.2.1 show the predetermined target s (Met Michigan standard) from the standard setting activities for MEAP tests and the scale scores. The MEAP scale scores were created from the following formula:
( )SSmet metSS SS
Where SS indicates the scale score, and indicates the value. The values of each variable (except for and SS ) are given in the following table for every grade and subject:
Table 7.2.2.1 Thetas from Standard Setting and Scale Scores for MEAP Grades 3-8
Subject Grade SS met metSS
Mathematics
3 1.322 25 0.430 3004 1.123 25 0.436 4005 0.945 25 -0.013 5006 0.990 25 0.144 6007 1.005 25 0.201 7008 0.961 25 -0.005 800
Reading
3 1.107 25 -0.302 3004 1.010 25 -0.540 4005 1.041 25 -0.332 5006 1.078 25 -0.167 6007 0.993 25 -0.117 7008 1.069 25 0.271 800
Science 5 0.875 25 -0.232 5008 0.918 25 -0.301 800
SocialStudies
6 1.053 25 -0.262 6009 0.963 25 -0.493 900
7.2.3. Scale Score Interpretations and Limitations
Because the scale scores associated with the On-Grade MEAP are not a vertical scale, care must be taken before any interpretation of individual scale score differences between grades is made. It is important to note, however, that only the passing achievement level is constant across grades or subjects. Comparisons of scale scores across subjects are even more suspect. In general, achievement levels are the best indicators for comparison across grade or subject. For future years, when a vertical scale is developed, more meaningful comparisons across grades will be possible.
The scale scores can be used to direct students needing remediation (i.e., students falling below Basic level), but scale score gain comparisons between individual students are not appropriate. It is acceptable

to compare gain scores for groups of students, because measurement precision is increased when scores are aggregated.
Because scale scores and number correct scores are on two distinct score metrics, users should be cautioned against over-interpreting differences in scale scores. As a hypothetical example for grade 4 mathematics, a student near the middle of the scale score distribution might change his or her scale score value by only four points (for example, from 400 to 404) by correctly answering five additional multiple choice questions. However, a student near the top of the scale score distribution may increase his or her scale score by 20 points with five additional questions correctly answered (for example, from 500 to 520). A similar phenomenon may be observed near the bottom of the score scale.
The primary function of the scale score is to be able to determine how far students are from the various proficiency levels without depending upon the changing raw scores. Additionally, schools will use the scale scores in summary fashion for comparisons of program evaluations across the years. For example, it is valid to compare the average grade 5 scale score in mathematics from one year to the average of the previous year. Interpretations of why the differences exist will depend on factors specific to individual schools.
7.2.4. Upper and Lower End Scaling
MEAP scale scores are a linear transformation from to scale scores, and there is no adjustment for the upper and lower scale scores. Table 7.2.4.1 shows the scale score ranges for all MEAP assessments.

Table 7.2.4.1Scale Score Ranges for MEAP Grades 3 - 8
Subject Grade Lowest SS Highest SS Range
MA 03 233 420 187
MA 04 320 542 222
MA 05 414 674 260
MA 06 475 755 280
MA 07 631 860 229
MA 08 677 957 280
RD 03 192 420 228
RD 04 291 527 236
RD 05 385 624 239
RD 06 483 726 243
RD 07 572 821 249
RD 08 690 918 228
SC 05 422 660 238
SC 08 692 960 268
SS 06 515 723 208
SS 09 773 1032 259

CHAPTER 8: EQUATING
8.1. Rationale
To maintain the same performance standards across different administrations, all tests must have comparable difficulty. This comparable difficulty is maintained from administration to administration at the total test level and, as much as possible, at the reporting strand level. A pre-equating procedure is applied on the MEAP. This equating design ensures that the level for any performance standard established by the MEAP on the original test is maintained on all subsequent test forms. Each test form consists of base items and field-test items. Base items are those items that are the same across all test forms within each subject and grade and count toward a student’s score. Field-test items are those being administered for the first time to gather statistical information about the items. They are also used for linking to future forms, for some administrations, and for generating school level scores. These items do not count toward an individual student’s score.
Technically, the 2009 administration of the grade 3-9 MEAP assessments were equated to Fall 2008. The details in this chapter explain the procedure that is used for equating 2009 and future forms to the 2008 scale.
8.2. Pre-equating
In the pre-equating process, a newly developed test is linked to a set of items that were previously used on one or more test forms. In this way, the difficulty level of the newly developed test can be equated through the linking items to previously administered tests. This procedure is known as common item equating. For the Fall 2009 administration, each new assessment is constructed from a pool of items that have been equated back to the 2008 test form.
8.2.1. Test Construction and Review
Test construction and review for the Fall 2009 MEAP were discussed in detail in section 2.8. Design of test forms and the item selection process were presented in section 2.8.
8.2.2. Field-Test Items
Once a newly constructed item has survived committee review and is ready for field-testing, it is embedded among the base-test items in a test booklet. The base-test items count toward the individual student’s score. For example, on the MEAP grade 5 science test for a particular administration, there are 7 forms containing the same base-test items. However, each form would also contain eight unique field-test items, which vary by form (The field-test items do not count toward an individual student’s score and may be used as equating or linking items to past or future tests).
For 2009 MEAP administration, a stratified form assignment design was used, to balance form distribution across various demographics. This form assignment procedure provides a diverse sample of

student performance on each field-test item. In addition, because students do not know which items are field-test items and which items are base-test items, no differential motivation effects are expected. To control for fatigue and start-up effects, all field-test items are placed in similar positions on each test form.
8.2.3. Within-Grade Equating
8.2.3.1. Description of Procedures Used to Horizontally Equate Scores from Various Forms at the Same Grade Level
Once the statewide data file has been edited, calibrations are performed on all base-test items regardless of the test form. The WINSTEPS (Linacre and Wright, 2004) program is used to estimate the Rasch item difficulty (RID) parameters and the constructed response task (step) parameters for the MEAP tests. Using pre-equated values from 2008 administration, item parameters are scaled using post equating procedure described in section 7.1.2.1. 8.2.3.2. Item and Test Statistics on the Equated Metric, Test Information/Standard
Error Curves, and Ability Distributions
The tables in Appendices M and N, and Figure 7.1.2.4 provided the item and test statistics on the equated metric, test information/standard error curves, and ability distribution. More detailed information can be found in sections 7.1.2.3 and 7.1.2.4.
8.3. Vertical Equating
Vertical linking was not created during year 2009. To make test development more efficient, vertical linking design was dropped from test design.
8.4. Ability Estimation
The item and step difficulties from the anchored calibration run are used in conjunction with actual student performance to obtain Rasch ability estimates for each possible raw score value. The generation of this raw score-to-Rasch ability is accomplished through a variation of the fundamental formulas in Rasch model measurement (Wright, 1977, p. 110) using the WINSTEPS computer program.
The process for obtaining Rasch ability estimates for the MEAP tests is complicated. This is because of the combination of dichotomously scored multiple choice items and polytomously scored constructed-response tasks. The procedure outlined by Masters and Evans (1986) adapted for this purpose is summarized in the following paragraphs.
First, using the item and step difficulty estimates from the anchored calibration run, follow this procedure:For each raw score R, begin by assuming AR = BR, where AR is the updated estimate from the procedure and BR is the initial ability estimate and is equal to:
ln × [R / (T – R)] ,

where T is the maximum score possible:
, 1
L
iimT
where L is the number of items on the test.
For each item i, calculate the following:
, exp1
X
jijRXR XAQ
where X = 1, 2, . . . , mi; δij are item parameters, and
,1
1
im
KKR
XR
XR
Q
QP
where X = 1, 2, . . . , mi, and
, 1
im
KKRi KPY
and
. 1
2
im
KKRi PKZ
The improved ability estimate is then calculated by
. ) (
1
2
1
L
iii
L
iiR
R
YZ
YRAB
This procedure represents one cycle or iteration in the calculation of the ability estimate. BR from this procedure is then used as the next cycle’s initial ability estimate (replacing AR) and the cycle continues. If the absolute difference between the initial and final ability estimate is less than 0.01, the cycles are terminated and the current BR value is used as the ability estimate (Masters and Evans, 1986, p. 365).

8.5. Development Procedures for Future Forms
8.5.1. Equating Field-Test Items
Field-test items are equated using WINSTEPS and anchored on all operational test items by grade and content area. This anchored calibration produces results that all of the field-test items are on the same scale as the base test.
The base test for future administrations will be equated to the 2009 scale by anchoring the common item difficulty values to those obtained in 2009 and allowing WINSTEPS to estimate the new item and task/step difficulty values to this anchored scale. The result is a base-test form with item and task/step difficulty values on the same scale as the original form administered in 2005.
8.5.2. Item Pool Maintenance
Pearson Educational Measurement (PEM), in conjunction with OEAA, implemented the statistical programming required to populate the MEAP item bank. Detailed description of the item bank is in Chapter 2, section 2.7.3.
Measurement Incorporated (MI) completed item level statistics for the Fall 2009 MEAP 3-9 Item Bank including both operational and field-test items. This was completed according to the specified layout by OEAA and PEM. Analysis was completed in two phases for the Fall 2009 MEAP administration. Completed item analyses were delivered to the PEM via the secure website in the ascribed layout.

CHAPTER 9: RELIABILITY
Reliability refers to the consistency and the precision of the scores obtained from a test as a measuring instrument. Of particular concern is the consistency with which the test measures the same individual on different occasions or with equivalent sets of items. Stated in another way, measures of reliability make it possible to estimate what proportion of total score variance is associated with random errors of measurement. Evidence of reliability, summarized typically by a reliability coefficient, is usually reported as an estimate of internal consistency or temporal stability. The extent to which errors of measurement are present in obtained scores is shown by the standard error of measurement (SEM).
9.1. Internal Consistency, Empirical IRT Reliability Estimates, and Conditional Standard Error of Measurement
In the following sections, estimates of reliability under classical test theory, the conditional standard error of measurement constructed under item response theory, and the use of standard error of measurement will be discussed in detail.
9.1.1. Internal Consistency
Internal consistency is a measure of how well a collection of items work together to measure the construct. Typically, this index is computed as coefficient alpha or Cronbach’s alpha. Coefficient alpha is a more general version of the common Kuder-Richardson reliability coefficients and can accommodate both dichotomous and polytomous items. The formula for Cronbach’s alpha is:
2
2
11 x
i
SD
SDk
k,
where
k = number of items,
iSD = standard deviation of item i,
xSD = standard deviation of the total scores.
Appendix O shows the coefficient alpha for each grade and subject. Other than the overall sample, the alphas are also computed by form, gender, ethnicity, social economic status (SES), and limited English proficiency (LEP).
Table 9.1.1.1 summarizes the coefficient alphas across forms in low and high ranges and median values for the overall population. Math median IRT reliabilities are between .88 and .92. Reading median IRT reliabilities are in the range of .77 to .89, Science and social studies median reliabilities are in the high 80’s. In conclusion, the MEAP assessments have a satisfactory degree of internal consistency as indicated by coefficient alphas.

By examining tables in Appendix O, similar conclusions also can be drawn from the comparisons between subgroups of gender, ethnicity, SES, and LEP. There is no obvious evidence that the alphas for subgroups, i.e., male versus female, are different. It is safe to conclude that the MEAP assessments are equally reliable for different subgroups.
Table 9.1.1.1Summary Statistics of Coefficient Alphas
Across Subjects and Grades
Subject Grade Low High Median
Mathematics 3 0.88 0.89 0.88
Mathematics 4 0.88 0.89 0.89
Mathematics 5 0.90 0.91 0.91
Mathematics 6 0.89 0.91 0.91
Mathematics 7 0.90 0.92 0.92
Mathematics 8 0.90 0.91 0.90
Reading 3 0.81 0.82 0.81
Reading 4 0.88 0.89 0.89
Reading 5 0.86 0.87 0.86
Reading 6 0.77 0.78 0.77
Reading 7 0.83 0.84 0.83
Reading 8 0.82 0.83 0.82
Science 5 0.88 0.89 0.89
Science 8 0.89 0.90 0.89
Social Studies 6 0.86 0.87 0.87
Social Studies 9 0.88 0.89 0.89
9.1.2. Empirical IRT Reliability
In IRT, the precision of a test is shown by standard error of theta associated with each theta estimate and the test information function, which is also conditional on theta. However, by using the theta and standard error estimates from IRT and the definition of reliability from classical test theory (CTT), it is possible to derive an empirical IRT reliability from the data produced by IRT analysis. The variance of the theta estimates for the group can be treated as observed score variance. From the standard error of theta estimates, a pooled error variance can be created as an estimate of error variance. An empirical IRT reliability can then be derived from the formula:
Empirical IRT Reliability = [Var (theta) – Var (error)] / Var (theta).

Appendix P shows the empirical IRT reliability for each grade and subject. The empirical IRT reliability coefficients are computed by form, gender, ethnicity, social economic status, and LEP group.
Table 9.1.2.1 summarizes the empirical IRT reliabilities across forms in low and high ranges and median values for the overall population. Math median IRT reliabilities are between .87 and .90. Reading median IRT reliabilities are in the range of .77 to .83, Science and social studies median reliabilities are in the mid to high 80’s. Reliabilities computed from empirical IRT approach yield similar results as alpha reliabilities.
In comparing IRT reliabilities between subgroups such as male vs. female, there is also no obvious evidence of differences in IRT reliabilities. It can be concluded that the MEAP are expected to be equally reliable for different subgroups such as gender, SES, ethnicity, and LEP.
Table 9.1.2.1Summary Statistics of Empirical IRT Reliabilities
Across Subjects and Grades
Subject Grade Low High Median
Mathematics 3 0.86 0.88 0.87
Mathematics 4 0.88 0.89 0.88
Mathematics 5 0.90 0.91 0.90
Mathematics 6 0.89 0.90 0.90
Mathematics 7 0.90 0.91 0.90
Mathematics 8 0.89 0.90 0.90
Reading 3 0.79 0.80 0.80
Reading 4 0.82 0.84 0.83
Reading 5 0.81 0.83 0.82
Reading 6 0.77 0.79 0.77
Reading 7 0.79 0.81 0.80
Reading 8 0.80 0.81 0.80
Science 5 0.86 0.88 0.87
Science 8 0.88 0.89 0.89
Social Studies 6 0.84 0.86 0.85
Social Studies 9 0.86 0.88 0.87

9.1.3. Conditional Standard Error of Measurement
As previously described, information function is used in item response theory to gauge the precision of a test. Item information function for one parameter Rasch model is:
iii PPI 1 ,where iP = the Rasch model.
It is clear that the item information is maximized when ability parameter equals item difficulty (that is, when iP = .5). When an item’s difficulty is well matched to an examinee’s ability, the item will yield the most information about the latent trait. In IRT, test information function is the sum of item information function in the test, and the conditional standard error of measurement for a given ability estimate is the reciprocal of the square root of the test information function.
Test information function and conditional standard error of measurement are presented in plots in chapter 7, section 7.1.2.4., by form, grade, and subject. The plots show that as the test information function increases, the conditional standard error of measurement decreases and vice versa.
9.1.4. Use of the Standard Error of Measurement
In CTT, standard error of measurement (SEM) is calculated by the following formula:
'1 XXxSEM ,where
x = standard deviation of the total test (standard deviation of the raw scores),
'xx = reliability estimate for the test.
In contrast to the conditional SEM produced under IRT, the SEM produced under CTT is considered to be less precise because it is likely to be influenced by the characteristics of the sample (sample dependent). In addition, there is only one SEM applied equally to every examinee in the sample regardless of the score level of the examinee.
The MEAP adopts conditional SEM produced under IRT in the interpretation and reporting of individual student scores. Conditional SEM is considered to be more accurate than the traditional SEM produced under CTT, both theoretically and practically. The conditional SEM based on test information function is a sample-free estimate because it is not influenced by the sample characteristics. It is influenced only by the model and item parameters.
9.2. Alternative Forms Reliability Estimates
At this time, no information regarding alternative forms reliability estimates is available for the technical report because no student takes more than one form of the MEAP during any test administration.

9.3. Score Reliability for the Written Composition and the Constructed-Response Items
9.3.1. Reader Agreement
To ensure that all written compositions and the constructed-response items generated for MEAP are reliably scored, MI uses several measures to gauge score reliability. One measure of reliability has been expressed in terms of reader agreement as obtained from the required second reading of a percentage of student responses. These data are monitored on a daily basis by the Scoring Monitor during the scoring process. Reader agreement data show the percent of perfect agreement of each reader against all other readers. For grades 3 - 8, 20 percent of all responses are given a second reading.
Reader agreement data do not provide a mechanism for monitoring drift from established criteria by all readers at a particular grade level. Thus, an additional set of data, known as validity scoring, is collected daily to check for reader drift and reader consistency in scoring to the established criteria. When MI team leaders identify ideal student responses, they route these to the scoring directors for preview. Scoring directors review the responses and choose appropriate papers for validity scoring. Validity responses are usually solid score point responses. The scoring directors confirm the true score and enter the response for validity scoring. Readers score a validity packet every week for reading and writing. Validity scoring is blind; because image based scoring is seamless, scorers do not know when they are scoring a validity packet. Results of validity scoring are regularly analyzed by MI scoring directors, and appropriate measures are initiated as needed, including the retraining or releasing of scorers. 9.3.2. Score Appeals
A district may appeal the score assigned to any student’s composition about which a question has been raised. In these instances, MI provides an individual analysis of the composition in question.
9.4. Estimates of Classification Accuracy
Every test administration will result in some error in classifying examinees. Several elements of test construction and guidelines around setting cut scores can assist in minimizing these errors. However, it is important to investigate the expected level of misclassification before approval of the final cut-scores. MI conducts analysis of the classification accuracy of assessments based on the cut-scores recommended by the educator panels. Under the IRT model, for a given ability score θ, the observed score is expected to be normally distributed with a mean of θ and a standard deviation of SE(θ). The expected proportion of examinees with true scores in any particular level k is:
d
ck SE
aSEbLevel
)()()Pr( ,
where a and b are scale points representing the score boundaries (cut-scores) for levels,

d and c are the scale points representing score boundaries for persons in levels, is the cumulative distribution function of the achievement level boundary, and φ is the normal density associated with the true score (Rudner, 2004).
To compute expected classification accuracy, the proportions are computed for all cells of a K by K classification table. The sum of the diagonal entries represents the overall classification accuracy for the test.
9.4.1. Statewide Classification Accuracy
Tables in Appendix R show the results of statewide classification accuracy by grade and subject. In the classification tables, the rows represent the theoretical true percentages of examinees in each achievement level while the columns represent the observed percentages. The diagonal entries represent the agreement between true and expected percentages of classified examinees. The sum of the diagonal representing total classification accuracy is presented in the bottom of the tables and summarized in Table 9.4.1.1. As Table 9.4.1.1 shows, the statewide classification accuracy rates range from 76.8% to 86.3% for Mathematics; 77.4% to 81.6% for Reading; and 77.5% to 78.8% for Science. Social Studies has lower classification accuracy rates compared to other subjects (73.2% to 76.8%).
Table 9.4.1.1 Summary of Statewide Classification Accuracy
Grade Mathematics Reading Science Social Studies
3 86.3 80.7
4 84.2 81.6
5 82.7 79.3 78.8
6 83.2 78.5 73.2
7 82.5 77.4
8 76.8 77.4 77.5
9 76.8
CHAPTER 10: VALIDITY
Validity refers to the extent to which a test measures what it is intended to measure and how well it does so. As stated in the Standards for Educational and Psychological Testing (1999), validity refers to the “degree to which evidence and theory support the interpretations of test scores entailed by the proposed uses of tests.” This statement shows that test validation is an ongoing process, which begins the moment that work on a test begins and continues throughout the life of the test. Validity is the process of continually accumulating and reviewing evidence from various resources to refine the utility of a test for making recommended interpretations consistent with the intended uses and interpretations of the test scores.
10.1. Content and Curricular Validity Content validity involves essentially the systematic examination of the test content to determine whether it covers the curricular standards to be measured. As stated in Chapter 1, the MEAP assessments are developed to measure what Michigan educators believe all students should know and be able to achieve in the content areas. Assessment results paint a picture of how Michigan students and schools are doing when compared with standards established by the State Board of Education. The MEAP is based on an extensive definition of the content the test is intended to assess and its match to the content standards. Therefore, the MEAP assessments are content-based and aligned directly to the statewide content standards.
10.1.1. Relation to Statewide Content Standards
From the inception of the MEAP, a committee of educators, item development experts, assessment experts, and OEAA staff met annually to review new and field-tested items. The OEAA has established a sequential review process, as illustrated in Figure 10.1.1. This process provides many opportunities for these professionals to offer suggestions for improving or eliminating items and to offer insights into the interpretation of the statewide content standards for the MEAP. These review committees participate in this process to ensure test content validity of the MEAP.
In addition to providing information on the difficulty, appropriateness, and fairness of these items, committee members provide a needed check on the alignment between the items and the content standards they are intended to measure. When items are judged to be relevant (i.e., representative of the content defined by the standards), this provides evidence to support the validity of inferences made (regarding knowledge of this content) with MEAP results. When items are judged to be inappropriate for any reason, the committee can either suggest revisions (e.g., reclassification or rewording) or elect to eliminate the item from the field-test item pool. Items that are approved by the content review committee are later embedded in live MEAP forms to allow for the collection of performance data. In essence, these committees review and verify the alignment of the test items with the objectives and measurement specifications to ensure that the items measure appropriate content. The nature and specificity of these review procedures provide strong evidence for the content validity of the MEAP.

Figure 10.1.1. MEAP Item Development/Review Cycle
10.1.1.1. MEAP Alignment Studies
Three alignment studies (ELA, mathematics, and science) were conducted on September 21, 22, and 23, 2005 in Lansing, Michigan.
ELA
For ELA, twelve reviewers, including language arts content experts, district language arts supervisors, and language arts teachers, met to analyze the agreement between the state’s language arts standards and assessments for grades 3 through 8. Eight reviewers were from Michigan, and four were experts with experience from other states.
The alignment between the assessments and the language arts standards at each grade was acceptable. The over-emphasis on one or two reading objectives on the assessment is not a critical alignment issue, since all of the other alignment criteria were fully met. The alignment between the assessments and the writing standard at each grade needs slight improvement. One to three more objectives for each grade need to have at least one corresponding item for the assessments to fully meet the Range-of-Knowledge Correspondence criterion. Reviewers were very consistent in assigning items to standards, but showed less consistency in assigning items to specific grade-level expectations. This implies some overlap in content covered by the grade-level expectations, or lack of clarity in the written statements. Because reviewers found it difficult to distinguish among many of the objectives, this lowered the reviewer
Committee Review
Field Test Data Analysis
Revision
MEAP Review
Write Items
Train Item Writers
Committee Review
Final Decision
Contractor Review
Create Item Specifications
MODIFY
REJECT
ACCEPT
START

agreement on the precise objective measured by an item. The reviewers observed that the coverage of content on the assessments improved over the grades. Reviewers indicated there were some very challenging items on the grade 7 and grade 8 assessments. The complete report on ELA alignment analysis can be found in Appendix S. The report consists of a description of the four criteria used to judge the alignment between Michigan Language Arts Academic Content Standards and one assessment for each grade, and includes a description of the alignment criteria used and a complete presentation of the findings.
Mathematics
For mathematics, thirteen reviewers, including mathematics content experts, district mathematics supervisors, mathematics teachers, and a mathematics education professor, met to analyze the agreement between the state’s mathematics standards and Michigan Educational Assessment Program assessments for six grades. Ten reviewers were from Michigan, and 3 were experts brought in from other states. Twelve to thirteen reviewers analyzed grades 3, 4, and 5 assessments, while 6 or 7 reviewers analyzed grades 6, 7, and 8 assessments. Because of time constraints the reviewers were divided into two groups to analyze the assessments for the higher grades. All of the reviewers participated in analyzing the depth-of-knowledge levels of the standards.
Overall, the alignment between the mathematics assessments and standards at five of the six grades is reasonable. The grade 6 assessment was fully aligned. Full alignment between the assessments at grades 4, 5, 7, and 8 and the previous grade standards could be achieved by replacing one item (grades 4, 5, and 8) or three items (grade 7) on each assessment. Full alignment for the grade 3 assessment and grade 2 standards would require replacing six items with items that measure content related to data and probability. Reviewers did have some problems coding items to specific standards because limits imposed on number size and type of number in the grade-level expectations did not fully coincide with the numbers used in the items. As a consequence, reviewers coded a relatively large number of items to the goal or standard rather than to specific grade level expectations. The lack of exact fit between an assessment item and a grade-level expectation could be due to the grade-level expectations being overly restrictive, or to test blueprint specifications that did not attend to the stated limits. Although, reviewers did code a relative high number of items to the goal or standard, this was not such a serious issue as to consider the assessments and standards not aligned. A complete report of the mathematics alignment study is included in Appendix T. The report consists of a description of the four criteria used to judge the alignment between Michigan Mathematics Academic Content Standards and one assessment for each grade, and includes the alignment criteria used and a complete description of the findings.
Science
For science, nine reviewers, including science content experts, the state science coordinator, district science supervisors, and science teachers met to analyze the agreement between the state’s science standards and the Michigan Educational Assessment Program assessments for grades 5 and 8. Five reviewers were from Michigan, and four were experts brought in from other states. Nine reviewers analyzed four of the six assessments, while four analyzed the grade 8 2004 assessment and six reviewers analyzed the grade 8 2005 assessment. Because of time constraints, the reviewers were divided into two

groups to analyze these two assessments. All of the reviewers participated in analyzing the depth-of-knowledge levels of the standards.
The Michigan science standards and assessments for grades 5 and 8 lack full alignment because one standard is not assessed. Reviewers at most only coded three items to Standard II (Reflecting on Scientific Knowledge) on any of the six forms analyzed. On most forms, reviewers found no items that they judged to correspond to objectives under this standard. Many of the objectives under this standard seek to have students develop an awareness of the nature of science or an application of science, which are more difficult to measure on an on-demand assessment. Considering the assessments and the other four standards for both grade levels, the alignment is reasonable, with only a few changes needed to achieve full alignment. If the three forms at each grade level are considered in aggregate, then the combined test is fully aligned with the four standards.
If each assessment form is thought of as a separate assessment, then only a few changes to each form are needed to achieve acceptable alignment between the assessment and the science standards. Each grade 5 form would need to have only one or two items replaced or added to meet the minimal acceptable levels on all four alignment criteria. The grade 8 forms would require from three to five additional items, or replaced items, to achieve an acceptable alignment on the four alignment criteria; in each case, for each of the six forms, it would be possible to retain the total number of items and have full alignment if existing items were replaced by new items. A full report of science alignment study is provided in Appendix U. The report consists of a description of the four criteria used to judge the alignment between Michigan Science Academic Content Standards for grades 5 and 8 and three assessments for each grade, and includes the alignment criteria used as well as a complete description of the findings.
10.1.2. Educator Input
Michigan educators provide valued input on the MEAP content and the match between the items and the statewide content standards. In addition, many current and former Michigan educators and some educators from other states work as independent contractors to write items specifically to measure the objectives and specifications of the content standards for the MEAP. Using a varied source of item writers provides a system of checks and balances for item development and review that reduces single source bias. Because many people with various backgrounds write the items, it is less likely that items will suffer from a bias that might occur if items were written by a single author. This direct input from educators offers evidence regarding the content validity of the MEAP.
10.1.3. Test Developer Input
The staff at the OEAA; the professional test developers from Harcourt Assessment, Inc.; and the measurement and assessment experts at PEM provide a long history of test development experience, including content-related expertise. The input and review by these assessment experts provide further support of the item being an accurate measurement of the intended objective. These reviews offer additional evidence of the content validation of the MEAP.
10.1.4. Evidence of Content Validity

As stated above, expert judgments from educators, test developers, and assessment specialists provide support for the alignment of the MEAP assessments with the statewide content standards. In addition, since expert teachers in the content areas were involved in establishing the content standards, the judgments of these expert teachers in the review process provides a measure of content validity. A match between the content standards and the components of the MEAP provides evidence that the assessment does indeed measure the content standards. The MEAP test blueprint discussed in sections 2.1 and 2.2 shows the number of assessment components, tasks, or items matching each content standard, providing documentation of the content validity of the assessment. A comprehensive presentation of the MEAP test specifications is attached in Appendix A.
10.2. Criterion and Construct Validity
10.2.1. Criterion Validity
Criterion validity refers to the degree to which a test correlates with other external outcome criteria. Criterion validity addresses how accurately criterion performance can be predicted from test scores. The key to criterion-related evidence is the degree of relationship between the assessment and the outcome criterion. To ensure a good relationship between the assessment and the criterion, the criterion should be relevant to the assessment and reliable.
As previously stated, test validation is an ongoing process that continues throughout the life of the test. At this point, the MEAP does not have any criterion-related validity to be reported. However, for the purposes of this technical report and with respect to the MEAP, additional criterion-related validity evidence will be collected and reported in an ongoing manner. These data are most likely to come from districts conducting program evaluation research, universities as well as special interest groups researching topics of local interest, as well as the data collection efforts of the OEAA.
10.2.2. Construct Validity
The construct validity of a test refers to the extent to which the test is said to measure a theoretical construct or trait. A structural equation modeling study conducted by Dr. Joseph Martineau of OEAA is summarized in this section as evidence of construct validity.
In order to demonstrate that the assessment scores are strongly related to variables they should be related to (e.g. prior achievement) and not strongly related to variables they should not be related to (e.g. student demographics), it is necessary to have at least two years of data for each student. Table 10.2.2.1 demonstrates where it is possible to conduct a valid analysis with two years of data for the same children.

Table 10.2.2.1 Student Achievement Data Available in OEAA Database
3 4 5 6 7 8 … HSWinter 2005 x x xFall 2005 x x x x x x xWinter 2005 x x xFall 2005 x x x x x x xWinter 2005 x x xFall 2005 x x xWinter 2005Fall 2005 x x x x x x x
MI-Access
MEAP
GradeAssessment Subject Cycle
Math & ELA
Science
ELA
Mathematics
Winter 2005 was the first assessment cycle in Michigan with strong student identifiers (or unique identifying codes). Therefore, it is the first year of data for which strong longitudinal links can be created. There is only one additional assessment cycle (Fall 2005) with data available for matching. Therefore, the Winter 2005 cycle of data is the only one that can validly serve to create a baseline for two cycles of data for each student. As shown in Table 10.2.2.1, there must be data in the winter 2005 cycle and data in the next grade for the Fall 2005 cycle to be able to match student data across multiple cycles. This is only available in MEAP for two grades in English Language Arts (ELA), for one grade in Mathematics, and not available at all for MI-Access because MI-Access was a new assessment in Fall 2005.
Therefore, this analysis is conducted only for two grades in MEAP ELA, and for one grade in MEAP Mathematics. It was determined not to conduct such analyses for any other grades because it is important to have prior achievement in the model. Where prior achievement is not contained in the model, the analysis of relationships as intended is misleading.
To analyze the relationships as intended, the structural equation model shown in Figure 10.2.2.1 was performed for each of the three possible analyses. The structural equation model as shown is a saturated model because all possible relationships among variables are included in the model. This saturation does not affect the results being interpreted for the purpose of this report. There are several pieces of the model. First, all possible covariances between exogenous variables (first order predictors) are included in the model to accommodate the relationships between those demographic variables. Second, each exogenous variable is designated as a predictor of both achievement scores. Third, the prior achievement is designated as a predictor of later achievement.
By designing the model in this way, it is possible to examine the direct effect of demographics on current achievement in light of the effect of prior achievement on current achievement. This can be compared to the overall effect of demographics on current achievement to determine how much of the relationship between demographics and current achievement can be explained by the relationship between prior achievement and current achievement.
Winter 2005Scale Score
Fall 2005Scale Score
Female
Limited EnglishProficient (LEP)
Formerly LEP
EconomicallyDisadvantaged
Asian
Black
Hispanic
NativeAmerican
Receives SpecialEducation Services
UnexplainedVariance
UnexplainedVariance
Figure 10.2.2.1. Basic Structural Equation Model
Grade 4 Mathematics Results
The effect sizes of the total and direct effects of the demographics on current achievement are presented in Table 10.2.2.2. Table 10.2.2.2 also gives the effect size reduction (in terms of percentages) in the relationship between demographics and current achievement that can be attributed to prior achievement.
As shown by Table 10.2.2.2, accounting for prior achievement reduces the effect of demographic variables on current achievement by anywhere from 40 to 71 percent. In addition, the effect size of prior achievement on current achievement from this model is 0.68. In other words, the effect of prior achievement on current achievement is from 5.3 to 136.0 times as large as the effects of demographic variables on current achievement. In addition, the magnitude of the effect size of prior achievement is a large effect size (0.60), while the magnitude of direct effect sizes of demographic variables are from negligible (0.005) to small (0.128).
Table 10.2.2.2Grade 4 Mathematics effect sizes of demographic variables on current achievement
Demographic VariableEffect Size
ReductionTotal DirectFemale -0.051 -0.025 51%Limited English Proficient (LEP) -0.051 -0.016 69%Formerly LEP 0.010 0.006 40%Economically Disadvantaged -0.198 -0.075 62%Multiracial -0.017 -0.005 71%Hispanic -0.054 -0.020 63%Black -0.255 -0.128 50%Asian 0.083 0.035 58%Native American -0.025 -0.009 64%Receives Special Education Services -0.208 -0.076 63%
In addition, while the data needed to assess teacher and/or school effects on student achievement (theoretically the most important predictor) is not available, percentage of variation remaining unexplained in current achievement from this model (39%) is high enough to allow for strong sensitivity to instruction even when accounting for prior achievement and demographics.
Grade 4 ELA Results
The effect sizes of the total and direct effects of the demographics on current achievement are presented in Table 10.2.2.3. Table 10.2.2.3 also gives the effect size reduction (in terms of percentages) in the relationship between demographics and current achievement that can be attributed to prior achievement.

Table 10.2.2.3Grade 4 ELA effect sizes of demographic variables on current achievement
Demographic VariableEffect Size
ReductionTotal DirectFemale 0.105 0.023 78%Limited English Proficient (LEP) -0.070 -0.024 66%Formerly LEP 0.010 0.005 50%Economically Disadvantaged -0.205 -0.096 53%Multiracial -0.008 -0.001 88%Hispanic -0.037 -0.016 57%Black -0.196 -0.091 54%Asian 0.052 0.028 46%Native American -0.023 -0.009 61%Receives Special Education Services -0.249 -0.107 57%
As shown by Table 10.2.2.3, accounting for prior achievement reduces the effect of demographic variables on current achievement by anywhere from 46 to 88 percent. In addition, the effect size of prior achievement on current achievement from this model is 0.61. In other words, the effect of prior achievement on current achievement is from 5.7 to 610.0 times as large as the effects of demographic variables on current achievement. In addition, the magnitude of the effect size of prior achievement is a large effect size (0.61), while the magnitude of direct effect sizes of demographic variables are negligible (0.001) to small (0.107).
In addition, while the data needed to assess teacher and/or school effects on student achievement (theoretically the most important predictor) is not available, percentage of variation remaining unexplained in current achievement from this model (49%) is high enough to allow for strong sensitivity to instruction even when accounting for prior achievement and demographics.
Grade 7 ELA Results
The effect sizes of the total and direct effects of the demographics on current achievement are presented in Table 10.2.2.4. Table 10.2.2.4 also gives the effect size reduction (in terms of percentages) in the relationship between demographics and current achievement that can be attributed to prior achievement.

Table 10.2.2.4Grade 7 ELA effect sizes of demographic variables on current achievement
Demographic VariableEffect Size
ReductionTotal DirectFemale 0.142 0.053 63%Limited English Proficient (LEP) -0.068 -0.021 69%Formerly LEP -0.007 -0.003 57%Economically Disadvantaged -0.184 -0.066 64%Multiracial -0.011 -0.006 45%Hispanic -0.042 -0.017 60%Black -0.221 -0.071 68%Asian 0.061 0.034 44%Native American -0.029 -0.012 59%Receives Special Education Services -0.303 -0.118 61%
As shown by Table 10.2.2.4, accounting for prior achievement reduces the effect of demographic variables on current achievement by anywhere from 44 to 69 percent. In addition, the effect size of prior achievement on current achievement from this model is 0.67. In other words, the effect of prior achievement on current achievement is from 3.7 to 223.3 times as large as the effects of demographic variables on current achievement. In addition, the magnitude of the effect size of prior achievement is a large effect size (0.67), while the magnitude of direct effect sizes of demographic variables are to negligible (0.003) to small (0.118).
In addition, while the data needed to assess teacher and/or school effects on student achievement (theoretically the most important predictor) is not available, percentage of variation remaining unexplained in current achievement from this model (40%) is high enough to allow for strong sensitivity to instruction even when accounting for prior achievement and demographics.
10.3. Validity Evidence for Different Student Populations
The primary validity evidence of the MEAP lies in the content being measured. Since the test measures the statewide content standards, which are required to be taught to all students, the test is expected to be valid for use with all subpopulations of students. Because the MEAP measures what is required to be taught to all students and is given under the same standardized conditions to all students, the tests have the same validity for all students.
Moreover, great effort has been made to ensure that the MEAP items are fair and representative of the content domain expressed in the content standards. Additionally, much scrutiny is applied to the items and their possible effect on minority or other subpopulations making up the population of Michigan. Every effort is made to eliminate items that may have ethnic or cultural biases.
10.3.1. Differential Item Functioning (DIF) Analyses
Two types of differential item functioning (DIF) are applied to the MEAP program in terms of editorial review and statistical DIF analyses.

10.3.1.1. Editorial Bias Review
In a typical editorial review, items are examined for three categories of bias: gender, ethnicity/class, and geographic region. The review process flags potentially biased items and codes them as follows:
Status: Are the members of a particular group shown in situations that do not involve authority or leadership?
Stereotype: Are the members of a particular group portrayed as uniformly having certain aptitudes, interests, occupations, or personality characteristics?
Familiarity: Is there greater opportunity on the part of one group to be acquainted with the vocabulary? Is there a greater chance that one group will have experienced the situation or have become acquainted with the processes presented by an item?
Offensive Choice of Words: Has a demeaning label been applied or has a male term been used where a neutral term could be substituted?
Other: Are there any other indications of bias?
Any potentially biased item is then edited to remove bias if possible. If that is not possible, the item is eliminated.
10.3.1.2. Statistical DIF Analyses
DIF statistics are used to identify items on which members of a focal group have different probability of getting the items correct from members of a reference group after they have been matched by means of the ability level on the test. In the MEAP DIF analyses, total raw score on the core items is used as ability-matching variable. Two comparisons are made for each item:
Males (M) versus females (F) White (W) versus Black (B)
For the MC items, the Mantel-Haenszel Delta DIF statistics are computed (Dorans and Holland, 1992) to classify test items in three levels of DIF for each comparison: negligible DIF (A), moderate DIF (B), and large DIF (C). An item is flagged if it exhibits B or C category of DIF using the following rules derived from National Assessment of Educational Progress (NAEP) guidelines (Allen, Carlson, & Zalanak 1999):
Rule 1: MH delta (MHD) not significantly different from 0 (based on alpha=|MHD| 1.0 are classified as A. [Note: The MHD is the ETS delta scale for item .05 or
difficulty, where the natural logarithm of the common odds ratio is multiplied by – (4/1.7)]Rule 2: MHD significantly different from 0 and {|MHD| 1.0 and 1.5} or
MHD not significantly different from 0 and |MHD| 1.0 are classified as B.Rule 3: |MHD| 1.5 and significantly different from 0 are classified as C.
The effect size of the standardized mean difference (SMD) is used to flag DIF for the CR items. The SMD reflects the size of the differences in performance on CR items between student groups matched on the total score. The SMD is the difference between the unweighted item mean of the focal group and the weighted item mean of the reference group. The weights applied to the reference group are applied so that the weighted number of reference group students is the same as in the focal group (within the

same ability group). The SMD is divided by the total group item standard deviation to get a measure of the effect size for the SMD. The SMD effect size allows each item to be placed into one of three categories: negligible DIF (AA), moderate DIF (BB), or large DIF (CC).
Rule 1: If the probability is >.05, classify the item as AA.
Otherwise:Rule 2: If |ES| is .17, classify as AA.Rule 3: If |ES| is .17 but .25, classify as BB.Rule 4: If |ES| is .25, classify as CC.
For both MC and CR items the favored group is indicated if an item was flagged.
10.3.1.3. DIF Statistics for Each Item
Every operational item in the Fall 2009 testing cycle had been field-tested in the Fall 2008 testing cycle. DIF analyses, extensive item analyses, and data review were performed to eliminate any possible bad and/or biased items. Data for embedded field-test items and operational items collected in the Fall 2009 testing cycle were analyzed again. In addition to the DIF analyses described above, detailed extensive item analyses were performed to establish complete item bank statistics. The content development contractor Pearson Educational Measurement (PEM) conducted item and data review processes for the field test items as described in section 2.6. PEM also conducted item selection and test form construction for Fall 2009 testing cycle. For the operational items, item statistics (including DIF statistics) are reported in Appendix H.
10.3.2. Performance of Different Student Populations
As previously described, great care has been taken in the process of test development to ensure that the items are fair and representative of the content domain expressed in the content standards. Additionally, every effort is made to eliminate items that may have gender, ethnic, or cultural biases through DIF analyses and qualitative content review. Even with all the effort to make the assessments fair, it is expected to see performance of various student populations being different. Tables in Appendix V show the student performance of MEAP assessment breakdown by gender, ethnicity, economically disadvantaged, and limited English proficiency. Figures in Appendix W depict the scale score distributions with the same breakdown.
In addition, DIF analyses are also conducted on accommodated forms that have sufficient numbers of students for DIF analyses. Table 10.3.2.1 summarizes results of DIF analyses on male versus female and white versus black. In Table 10.3.2.1, numbers of items classified as A (negligible DIF), B (moderate DIF), and C (large DIF) are tabulated. Overall, there are very low percentages of items that are classified as B or C.

Table 10.3.2.1 Summary of DIF analyses for MEAP Operational Items
Male vs
Female
White vs
Black
Accommodated vs
Non Accommodated
Subject Grade # ofItems A B C A B C A B C
Mathematics 3 54 52 2 0 54 0 0 46 7 14 60 59 1 0 56 4 0 57 3 05 69 65 4 0 66 3 0 68 1 06 60 59 1 0 55 5 0 58 2 07 62 57 5 0 62 0 0 61 1 08 51 50 1 0 50 1 0 51 0 0
Reading 3 31 30 1 0 31 0 0 30 1 04 31 30 1 0 31 0 0 31 0 05 31 29 2 0 31 0 0 31 0 06 31 31 0 0 31 0 0 31 0 07 31 30 1 0 31 0 0 31 0 08 31 28 3 0 31 0 0 31 0 0
Science 5 51 47 4 0 50 0 1 48 3 08 57 54 3 0 55 2 0 56 0 1
Social Studies 6 40 40 0 0 38 1 1 39 1 09 40 39 1 0 38 2 0 40 0 0
A = negligible DIFB = moderate DIFC = large DIF
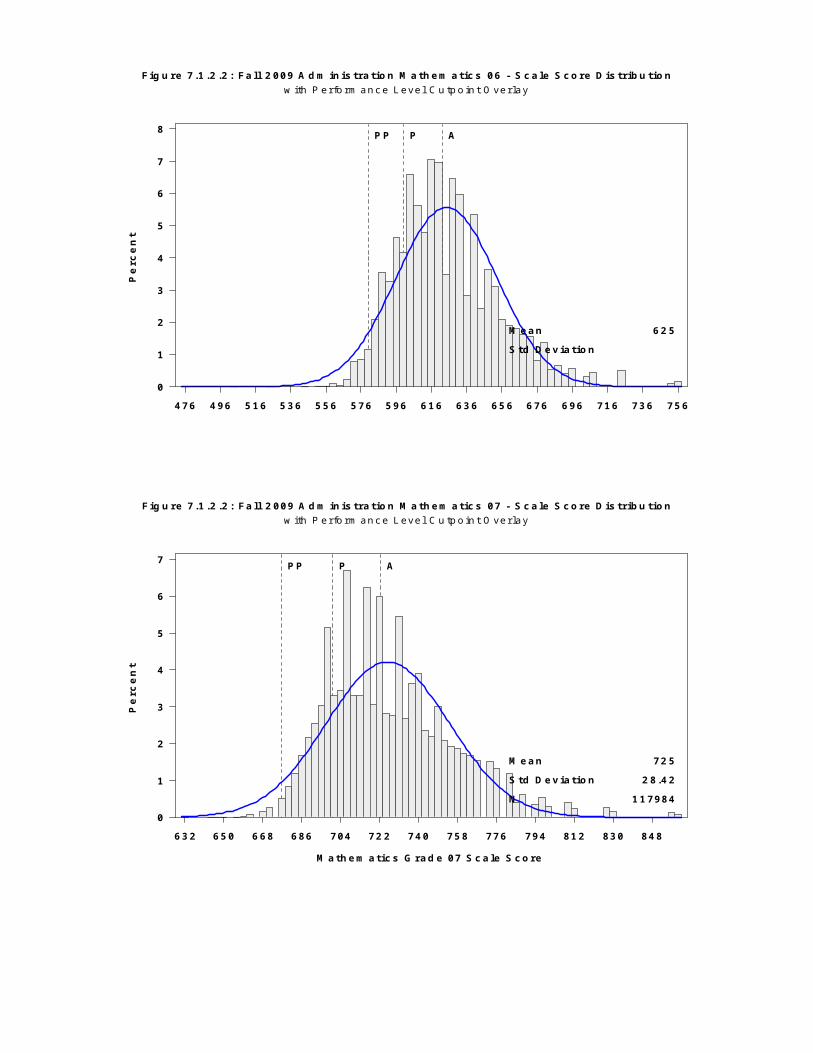
LIST OF APPENDICES
Appendix A: MEAP Test Blueprint 2009 Fall Appendix B: Summary Statistics of Matrix SamplingAppendix C: Data Created for Field Test ItemsAppendix D: Statistics Used on Item LabelsAppendix E: MEAP Fall 2009 Maturity ReportsAppendix F: Assessment Accommodation Summary Table Appendix G: Sample Output for Key CheckAppendix H: Item Statistics Appendix I: Standard Setting Technical Repost Appendix J: Classical Item StatisticsAppendix K: Scale Score Statistics and Performance Level PercentageAppendix L: Histogram of Scale Score DistributionsAppendix M: Summary of Item Response Theory StatisticsAppendix N: Summary of Item Fit StatisticsAppendix O: Alpha ReliabilitiesAppendix P: Empirical IRT ReliabilitiesAppendix Q: Rater AgreementAppendix R: Statewide Classification AccuracyAppendix S: ELA Alignment Study Technical ReportAppendix T: Mathematics Alignment Study Technical ReportAppendix U: Science Alignment Study Technical ReportAppendix V: Performance of Different Student PopulationsAppendix W: Histogram of Scale Score Distributions by Student