numberknowledge.comnumberknowledge.com/wp-content/uploads/2016/05/cost... · web viewmanagerial...
TRANSCRIPT
Managerial Accounting and Cost Concepts
This chapter explains that in managerial accounting the term cost is used in many different ways. The reason is that there are many types of costs, and these costs are classified differently according to the immediate needs of management. For example, managers may want cost data to prepare external financial reports, to prepare planning budgets, or to make decisions. Each different use of cost data demands a different classification and definition of costs. For example, the preparation of external financial reports requires the use of historical cost data, whereas decision making may require predictions about future costs. This notion of different costs for different purposes is a critically important aspect of managerial accounting.
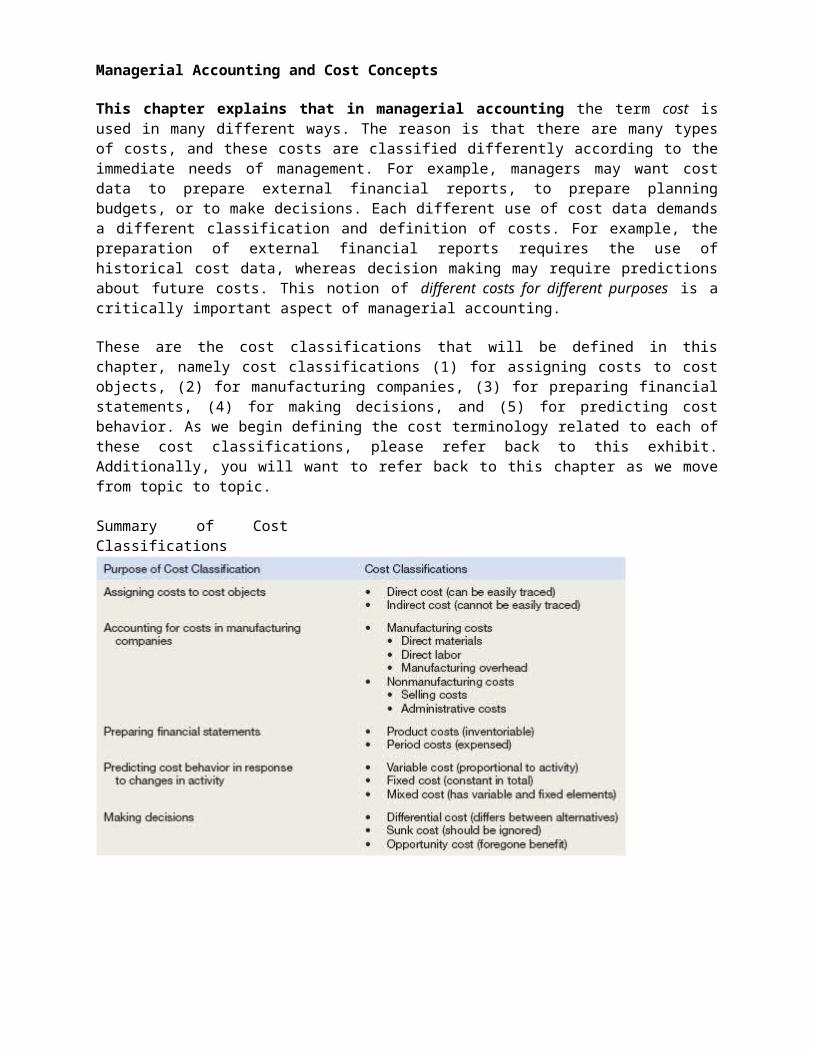
These are the cost classifications that will be defined in this chapter, namely cost classifications (1) for assigning costs to cost objects, (2) for manufacturing companies, (3) for preparing financial statements, (4) for making decisions, and (5) for predicting cost behavior. As we begin defining the cost terminology related to each of these cost classifications, please refer back to this exhibit. Additionally, you will want to refer back to this chapter as we move from topic to topic.
Summary of Cost Classifications

Assigning Costs to Cost Objects
Costs are assigned to cost objects for a variety of purposes including pricing, preparing profitability studies, and controlling spending. A cost object is anything for which cost data are desired—including products, customers, jobs, and organizational subunits.
For purposes of assigning costs to cost objects, costs are classified as either direct or indirect.
Direct Cost
A direct cost is a cost that can be easily and conveniently traced to a specified cost object. For example, if Reebok is assigning costs to its various regional and national sales offices, then the salary of the sales manager in its Tokyo office would be a direct cost of that office. If a printing company made 10,000 brochures for a specific customer, then the cost of the paper used to make the brochures would be a direct cost of that customer.
Indirect Cost
An indirect cost is a cost that cannot be easily and conveniently traced to a specified cost object. For example, a Campbell Soup factory may produce dozens of varieties of canned soups. The factory manager’s salary would be an indirect cost of a particular variety such as chicken noodle soup. The reason is that the factory manager’s salary is incurred as a consequence of running the entire factory—it is not incurred to produce any one soup variety.
To be traced to a cost object such as a particular product, the cost must be caused by the cost object.
The factory manager’s salary is called a common cost of producing the various products of the factory. A common cost is a cost that is incurred to support a number of cost objects but cannot be traced to them individually. A common cost is a type of indirect cost.
A particular cost may be direct or indirect, depending on the cost object. While the Campbell Soup factory manager’s salary is an indirect cost of manufacturing chicken noodle soup, it is a direct cost of the manufacturing division. In the first case, the cost object is chicken noodle soup. In the second case, the cost object is the entire manufacturing division.

EXERCISE 2–1 Identifying Direct and Indirect Costs Northwest Hospital is a full-service hospital that provides everything from major surgery and emergency room care to outpatient clinics.
For each cost incurred at Northwest Hospital, indicate whether it would most likely be a direct cost or an indirect cost of the specified cost object by placing an X in the appropriate column.

Cost Classifications for Manufacturing Companies
Manufacturing companies such as Texas Instruments, Ford, and DuPont separate their costs into two broad categories—manufacturing and nonmanufacturing costs.
There are three basic manufacturing cost categories—direct materials, direct labor and overhead.
Direct materials and direct labor are direct costs and manufacturing overhead is an indirect cost.
Direct Materials The materials that go into the final product are called raw materials. This term is somewhat misleading because it seems to imply unprocessed natural resources like wood pulp or iron ore. Actually, raw materials refer to any materials that are used in the final product; and the finished product of one company can become the raw materials of another company. For example, the plastics produced by Du Pont are a raw material used by Hewlett-Packard in its personal computers.
Raw materials may include both direct and indirect materials.
Direct materials are those materials that become an integral part of the finished product and whose costs can be conveniently traced to the finished product. This would include, for example, the seats that Airbus purchases from subcontractors to install in its commercial aircraft and the electronic components that Apple uses in its iPhones.
Indirect materials: Sometimes it isn’t worth the effort to trace the costs of relatively insignificant materials to end products. Such minor items would include the solder used to make electrical connections in a Sony HDTV or the glue used to assemble an Ethan Allen chair. Materials such as solder and glue are called indirect materials and are included as part of manufacturing overhead.
Direct Labor Direct labor consists of labor costs that can be easily (i.e., physically and conveniently) traced to individual units of product. Direct labor is sometimes called touch labor because direct labor workers typically touch the product while it is being made. Examples of direct labor include assembly-line workers at Toyota, carpenters at the home builder KB Home, and electricians who install equipment on aircraft at Bombardier Learjet.
Labor costs that cannot be physically traced to particular products, or that can be traced only at great cost and inconvenience, are termed indirect labor. Indirect labor is treated as part of manufacturing overhead. Indirect labor includes the labor costs of janitors, supervisors, materials handlers, and night security guards. Although the efforts of these workers are essential, it would be either impractical or impossible to accurately trace their costs to specific units of product. Hence, such labor costs are treated as indirect labor.

Manufacturing Overhead Comprised of everything related to the manufacturing of product except direct materials and direct labor.
Manufacturing overhead includes items such as indirect materials; indirect labor; maintenance and repairs on production equipment; and heat and light, property taxes, depreciation, and insurance on manufacturing facilities. Only those costs associated with operating the factory are included in manufacturing overhead. A company also incurs costs for heat and light, property taxes, insurance, depreciation, and so forth, associated with its selling and administrative functions, but these costs are not included as part of manufacturing overhead.
Nonmanufacturing Costs
Nonmanufacturing costs are often divided into two categories: (1) selling costs and (2) administrative costs.
Selling costs include all costs that are incurred to secure customer orders and get the finished product to the customer. Examples of selling costs include advertising, shipping, sales travel, sales commissions, sales salaries, and costs of finished goods warehouses.
Selling costs can be either direct or indirect costs. For example, the cost of an advertising campaign dedicated to one specific product is a direct cost of that product, whereas the salary of a marketing manager who oversees numerous products is an indirect cost with respect to individual products.
Administrative costs include all costs associated with the general management of an organization rather than with manufacturing or selling. Examples of administrative costs include executive compensation, general accounting, secretarial, public relations, and similar costs involved in the overall, general administration of the organization as a whole.
Administrative costs can be either direct or indirect costs. For example, the salary of an accounting manager in charge of accounts receivable collections in the East region is a direct cost of that region, whereas the salary of a chief financial officer who oversees all of a company’s regions is an indirect cost with respect to individual regions.

EXERCISE 2–2 Classifying Manufacturing Costs
The PC Works assembles custom computers from components supplied by various manufacturers. The company is very small and its assembly shop and retail sales store are housed in a single facility in a Redmond, Washington, industrial park. Listed below are some of the costs that are incurred at the company.
Required:
For each cost, indicate whether it would most likely be classified as direct labor, direct materials, manufacturing overhead, selling, or an administrative cost.
1. The cost of a hard drive installed in a computer.2. The cost of advertising in the Puget Sound Computer User newspaper.3. The wages of employees who assemble computers from components.4. Sales commissions paid to the company’s salespeople.5. The wages of the assembly shop’s supervisor.6. The wages of the company’s accountant.7. Depreciation on equipment used to test assembled computers before release to customers.8. Rent on the facility in the industrial park.

Cost Classifications for Preparing Financial Statements
When preparing a balance sheet and an income statement, companies need to classify their costs as product costs or period costs. To understand the difference between product costs and period costs, we must first discuss the matching principle from financial accounting.
Generally, costs are recognized as expenses on the income statement in the period that benefits from the cost. For example, if a company pays for liability insurance in advance for two years, the entire amount is not considered an expense of the year in which the payment is made. Instead, one-half of the cost would be recognized as an expense each year. The reason is that both years—not just the first year—benefit from the insurance payment. The unexpensed portion of the insurance payment is carried on the balance sheet as an asset called prepaid insurance.
The matching principle is based on the accrual concept that costs incurred to generate a particular revenue should be recognized as expenses in the same period that the revenue is recognized. This means that if a cost is incurred to acquire or make something that will eventually be sold, then the cost should be recognized as an expense only when the sale takes place—that is, when the benefit occurs. Such costs are called product costs.
Product Costs
For financial accounting purposes, product costs include all costs involved in acquiring or making a product. In the case of manufactured goods, these costs consist of direct materials, direct labor, and manufacturing overhead. Product costs “attach” to units of product as the goods are purchased or manufactured, and they remain attached as the goods go into inventory awaiting sale. Product costs are initially assigned to an inventory account on the balance sheet. When the goods are sold, the costs are released from inventory as expenses (typically called cost of goods sold) and matched against sales revenue on the income statement.
(Asset)Beginning Inventory
(Asset) + Cost of Good ManufacturedDirect MaterialsDirect LaborOverhead
(Asset) Goods Available for Sale
(Asset) Ending InventoryCost of Goods Sold
(Expense)

Period Costs
Period costs are all the costs that are not product costs. All selling and administrative expenses are treated as period costs.
For example, sales commissions, advertising, executive salaries, public relations, and the rental costs of administrative offices are all period costs. Period costs are not included as part of the cost of either purchased or manufactured goods; instead, period costs are expensed on the income statement in the period in which they are incurred using the usual rules of accrual accounting. Keep in mind that the period in which a cost is incurred is not necessarily the period in which cash changes hands. For example, as discussed earlier, the costs of liability insurance are spread across the periods that benefit from the insurance—regardless of the period in which the insurance premium is paid.
Prime Cost and Conversion Cost
Two more cost categories are often used in discussions of manufacturing costs—prime cost and conversion cost.
Prime costs are direct material and labor costs.
Conversion costs are direct labor and manufacturing overhead cost. These costs convert inert direct materials into a product.

To improve your understanding of these definitions, consider the following scenario: A company has reported the following costs and expenses for the most recent month:
These costs and expenses can be categorized in a number of ways, including product costs, period costs, conversion costs, and prime costs:

EXERCISE 2–3 Classification of Costs as Product or Period Cost
Suppose that you have been given a summer job as an intern at Issac Aircams, a company that manufactures sophisticated spy cameras for remote-controlled military reconnaissance aircraft. The company, which is privately owned, has approached a bank for a loan to help it finance its growth. The bank requires financial statements before approving such a loan. You have been asked to help prepare the financial statements and were given the following list of costs:
1. Depreciation on salespersons’ cars.2. Rent on equipment used in the factory.3. Lubricants used for machine maintenance.4. Salaries of personnel who work in the finished goods warehouse.5. Soap and paper towels used by factory workers at the end of a shift.6. Factory supervisors’ salaries.7. Heat, water, and power consumed in the factory.8. Materials used for boxing products for shipment overseas. (Units are not normally boxed.)9. Advertising costs.10. Workers’ compensation insurance for factory employees.11. Depreciation on chairs and tables in the factory lunchroom.12. The wages of the receptionist in the administrative offices.13. Cost of leasing the corporate jet used by the company’s executives.14. The cost of renting rooms at a Florida resort for the annual sales conference.15. The cost of packaging the company’s product.
Required:
Classify the above costs as either product costs or period costs for the purpose of preparing the financial statements for the bank.

Cost Classifications for Decision Making
Costs are an important feature of many business decisions. In making decisions, it is essential to have a firm grasp of the concepts differential cost, opportunity cost, and sunk cost.
Differential Cost and Revenue
Decisions involve choosing between alternatives. In business decisions, each alternative will have costs and benefits that must be compared to the costs and benefits of the other available alternatives. A difference in costs between any two alternatives is known as a differential cost. A difference in revenues (usually just sales) between any two alternatives is known as differential revenue. (If they are not different, then it is not a differential cost).
To illustrate, assume that Natural Cosmetics, Inc., is thinking about changing its marketing method from distribution through retailers to distribution by a network of neighborhood sales representatives. Present costs and revenues are compared to projected costs and revenues in the following table:
According to the above analysis, the differential revenue is $100,000 and the differential costs total $85,000, leaving a positive differential net operating income of $15,000 in favor of using sales representatives.
In general, only the differences between alternatives are relevant in decisions. Those items that are the same under all alternatives and that are not affected by the decision can be ignored. For example, in the Natural Cosmetics, Inc., example above, the “Other expenses” category, which is $60,000 under both alternatives, can be ignored because it has no effect on the decision. If it were removed from the calculations, the sales representatives would still be preferred by $15,000. This is an extremely important principle in management accounting that we will revisit in later chapters.

Opportunity Cost and Sunk Cost
Opportunity cost is the potential benefit that is given up when one alternative is selected over another. For example, assume that you have a part-time job while attending college that pays $200 per week. If you spend one week at the beach during spring break without pay, then the $200 in lost wages would be an opportunity cost of taking the week off to be at the beach. Opportunity costs are not usually found in accounting records, but they are costs that must be explicitly considered in every decision a manager makes. Virtually every alternative involves an opportunity cost.
A sunk cost is a cost that has already been incurred and that cannot be changed by any decision made now or in the future. Because sunk costs cannot be changed by any decision, they are not differential costs. And because only differential costs are relevant in a decision, sunk costs should always be ignored.
To illustrate a sunk cost, assume that a company paid $50,000 several years ago for a special-purpose machine. The machine was used to make a product that is now obsolete and is no longer being sold.

EXERCISE 2–7 Differential, Opportunity, and Sunk Costs
Northwest Hospital is a full-service hospital that provides everything from major surgery and emergency room care to outpatient clinics. The hospital’s Radiology Department is considering replacing an old inefficient X-ray machine with a state-of-the-art digital X-ray machine. The new machine would provide higher quality X-rays in less time and at a lower cost per X-ray. It would also require less power and would use a color laser printer to produce easily readable X-ray images. Instead of investing the funds in the new X-ray machine, the Laboratory Department is lobbying the hospital’s management to buy a new DNA analyzer.
For each of the items below, indicate by placing an X in the appropriate column whether it should be considered a differential cost, an opportunity cost, or a sunk cost in the decision to replace the old X-ray machine with a new machine. If none of the categories apply for a particular item, leave all columns blank.

Cost Classifications for Predicting Cost Behavior
Understand cost classifications used to predict cost behavior: variable costs, fixed costs, and mixed costs.
It is often necessary to predict how a certain cost will behave in response to a change in activity to budget and to make decisions. For planning purposes and decision making, a manager must be able to anticipate what will change and by how much.
Cost behavior refers to how a cost reacts to changes in the level of activity. As the activity level rises and falls, a particular cost may rise and fall as well—or it may remain constant.
If the cost rises and falls with activity, then it is a variable cost because it varies with a change in activity.
If the cost remains constant no matter the level of activity, it is a fixed cost.
For a cost object, it may not be practical to separate variable from fixed costs, the object will have costs components that are variable and fixed or mixed.
The relative proportion of each type of cost in an organization is known as its cost structure. For example, an organization might have many fixed costs but few variable or mixed costs. Alternatively, it might have many variable costs but few fixed or mixed costs.
Variable Cost
A variable cost varies in direct proportion to changes in the level of activity. Common examples of variable costs include cost of goods sold for a merchandising company, direct materials, direct labor, variable elements of manufacturing overhead, such as indirect materials, supplies, and power. For selling and administrative expenses, there are variable costs such as commissions and shipping costs.
For a cost to be variable, it must be vary in relation to something. That “something” is its activity base. The activity base of direct materials is production—when production increases so do direct materials. The activity base of selling commissions would be sales, as they increase sales increase. The activity base causes the variable costs to increase and has to be measurable. The activity base is often referred to as a costs driver—it drives the costs to either increase or decrease.
Some of the most common activity bases are direct labor-hours, machine-hours, units produced, and units sold.
Other examples of activity bases (cost drivers) include the number of miles driven by salespersons, the number of pounds of laundry cleaned by a hotel, the number of calls handled by technical support staff at a software company, and the number of beds occupied in a hospital.
While there are many activity bases within organizations, throughout this textbook, unless stated otherwise, you should assume that the activity base under consideration is the total volume of goods and services provided by the organization. We will specify the activity base only when it is something other than total output.
To provide an example of a variable cost, consider Nooksack Expeditions, a small company that provides daylong whitewater rafting excursions on rivers and serves gourmet meals to its guests from a caterer for $30 a person. The behavior of this variable cost, on both a per unit and a total basis, is shown below:

While total variable costs change as the activity level changes, it is important to note that a variable cost is constant if expressed on a per unit basis.
For example, the per unit cost of the meals remains constant at $30 even though the total cost of the meals increases and decreases with activity. The graph illustrates that the total variable cost rises and falls as the activity level rises and falls. At an activity level of 250 guests, the total meal cost is $7,500. At an activity level of 1,000 guests, the total meal cost rises to $30,000.
Variable and Fixed Cost Behavior

Fixed Cost
A fixed cost is a cost that remains constant, in total, regardless of changes in the level of activity. Examples of fixed costs include straight-line depreciation, insurance, property taxes, rent, supervisory salaries, administrative salaries, and advertising.
Unlike variable costs, fixed costs are not affected by changes in activity. Consequently, as the activity level rises and falls, total fixed costs remain constant unless influenced by some outside force—usually expansion.
To continue the Nooksack Expeditions example, assume the company rents a building for $500 per month to store its equipment. The total amount of rent paid is the same regardless of the number of guests the company takes on its expeditions during any given month.
Because total fixed costs remain constant for large variations in the level of activity, the average fixed cost per unit becomes progressively smaller as the level of activity increases.
If Nooksack Expeditions has only 250 guests in a month, the $500 fixed rental cost would amount to an average of $2 per guest. If there are 1,000 guests, the fixed rental cost would average only 50 cents per guest.
As a general rule, we caution against expressing fixed costs on an average per unit basis in internal reports because it creates the false impression that fixed costs are like variable costs and that total fixed costs actually change as the level of activity changes.

Summary of Variable and Fixed Cost Behavior

For budgeting purposes, fixed costs can be viewed as either committed or discretionary.
Committed fixed costs represent organizational investments with a multiyear planning horizon that can’t be significantly reduced even for short periods of time without making fundamental changes. Examples include investments in facilities and equipment, as well as real estate taxes, insurance expenses, and salaries of top management. Even if operations are interrupted or cut back, committed fixed costs remain largely unchanged in the short term because the costs of restoring them later are likely to be far greater than any short-run savings that might be realized.
Discretionary fixed costs (often referred to as managed fixed costs) usually arise from annual decisions by management to spend on certain fixed cost items. Examples of discretionary fixed costs include advertising, research, public relations, management development programs, and internships for students. Discretionary fixed costs can be cut for short periods of time with minimal damage to the long-run goals of the organization.

EXERCISE 2–4 Fixed and Variable Cost Behavior Guided Example 2-4
Espresso Express operates a number of espresso coffee stands in busy suburban malls. The fixed weekly expense of a coffee stand is $1,200 and the variable cost per cup of coffee served is $0.22.
Required:
1. Fill in the following table with your estimates of total costs and cost per cup of coffee at the indicated levels of activity for a coffee stand. Round off the cost of a cup of coffee to the nearest tenth of a cent.
2. Does the average cost per cup of coffee served increase, decrease, or remain the same as the number of cups of coffee served in a week increases? Explain.

The Linearity Assumption and the Relevant Range
Management accountants ordinarily assume that costs are strictly linear; that is, the relation between cost on the one hand and activity on the other can be represented by a straight line. Costs can be approximated within a narrow band of activity known as the relevant range by a straight line. The relevant range is the range of activity within which the assumption that cost behavior is strictly linear is reasonably valid. (Typically a period of time over which observations of the cost have been made).
Outside of the relevant range, a fixed cost may no longer be strictly fixed or a variable cost may not be strictly variable. Managers should always keep in mind that assumptions made about cost behavior may be invalid if activity falls outside of the relevant range.
The concept of the relevant range is important in understanding fixed costs.
For example, suppose the Mayo Clinic rents a machine for $20,000 per month that tests blood samples for the presence of leukemia cells. Furthermore, suppose that the capacity of the leukemia diagnostic machine is 3,000 tests per month. The assumption that the rent for the diagnostic machine is $20,000 per month is only valid within the relevant range of 0 to 3,000 tests per month. If the Mayo Clinic needed to test 5,000 blood samples per month, then it would need to rent another machine for an additional $20,000 per month.
Fixed costs typically increase as a result of commitments made in order to expand.
Fixed Costs and the Relevant Range

Mixed Costs
A mixed cost contains both variable and fixed cost elements. To continue the Nooksack Expeditions example, the company incurs a mixed cost called fees paid to the state. It includes a license fee of $25,000 per year plus $3 per rafting party paid to the state’s Department of Natural Resources. If the company runs 1,000 rafting parties this year, then the total fees paid to the state would be $28,000, made up of $25,000 in fixed cost plus $3,000 in variable cost. Exhibit 2–5 depicts the behavior of this mixed cost.
Mixed Cost Behavior
Even if Nooksack fails to attract any customers, the company will still have to pay the license fee of $25,000. This is why the cost line in Exhibit 2–5 intersects the vertical cost axis at the $25,000 point. For each rafting party the company organizes, the total cost of the state fees will increase by $3. Therefore, the total cost line slopes upward as the variable cost of $3 per party is added to the fixed cost of $25,000 per year.

We can see from this very simple example when there are no customers, the company still pays its mixed cost for electricity. Once customers are served, variable costs are incurred to serve each customer and the mixed cost of electricity increases for each customer. After a period, the company incurs a fixed cost of rent which does not change despite the number of customers served.
Customers Customers Customers Customers Customers Customers Customers0 22 50 100 500 272 750
Sales 5.00 - 110.00 250.00 500.00 2,500.00 1,360.00 3,750.00
CostsPatty 1.50 - 33.00 75.00 150.00 750.00 408.00 1,125.00 Buns 0.50 - 11.00 25.00 50.00 250.00 136.00 375.00 Cheese 0.35 - 7.70 17.50 35.00 175.00 95.20 262.50 Condiments 0.15 - 3.30 7.50 15.00 75.00 40.80 112.50
2.50 - 55.00 125.00 250.00 1,250.00 680.00 1,875.00
Electricity 45.00 45.00 56.00 70.00 95.00 295.00 181.00 420.00
Rent 500.00 500.00 500.00
Profit (45.00) (1.00) 55.00 155.00 455.00 (1.00) 955.00
Joe's Hamburgers

Because the mixed cost is represented by a straight line, the following equation for a straight line can be used to express the relationship between a mixed cost and the level of activity:
Because the variable cost per unit equals the slope of the straight line, the steeper the slope, the higher the variable cost per unit.
In the case of the state fees paid by Nooksack Expeditions, the equation is written as follows:
This equation makes it easy to calculate the total mixed cost for any level of activity within the relevant range. For example, suppose that the company expects to organize 800 rafting parties in the next year. The total state fees would be calculated as follows:
Therefore if a cost object (such as license fee or a company department) has mixed costs, this formula can be used to predict the changes when budgeting or making decisions.

The Analysis of Mixed Costs
Mixed costs are very common.
For example, the overall cost of providing X-ray services to patients at the Harvard Medical School Hospital is a mixed cost. The costs of equipment depreciation and radiologists’ and technicians’ salaries are fixed, but the costs of X-ray film, power, and supplies are variable. Most electricity is a mixed cost.
The fixed portion of a mixed cost represents the minimum cost of having a service ready and available for use.
The variable portion represents the cost incurred for actual consumption of the service, thus it varies in proportion to the amount of service actually consumed.
Managers can use a variety of methods to estimate the fixed and variable components of a mixed cost such as account analysis, the engineering approach, the high-low method, and least-squares regression analysis. We will focus on the high-low method, and least-squares regression analysis
The high-low and least-squares regression methods estimate the fixed and variable elements of a mixed cost by analyzing past records of cost and activity data.
We will use an example from Brentline Hospital to illustrate the high-low method calculations and to compare the resulting high-low method cost estimates to those obtained using least-squares regression.

Diagnosing Cost Behavior with a Scattergraph Plot
Sometimes the beginning step is to use a scatterplot in Excel to look at how the costs are behaving.
Assume that Brentline Hospital is interested in predicting future monthly maintenance costs for budgeting purposes. The senior management team believes that maintenance cost is a mixed cost and that the variable portion of this cost is driven by the number of patient-days. The hospital’s chief financial officer gathered the following data for the most recent seven-month period:
Scattergraph Method of Cost Analysis
1. The total maintenance cost, Y, is plotted on the vertical axis. Cost is known as the dependent variable because the amount of cost incurred during a period depends on the level of activity for the period.
2. The activity, X (patient-days in this case), is plotted on the horizontal axis. Activity is known as the independent variable because it causes variations in the cost. (Activity base or cost driver)
From the scattergraph plot, it is evident that maintenance costs do increase with the number of patient-days in an approximately linear fashion. In other words, the points lie more or less along a straight line that slopes upward and to the right. Cost behavior is considered linear whenever a straight line is a reasonable approximation for the relation between cost and activity.

Plotting the data on a scattergraph is an essential diagnostic step that should be performed before performing the high-low method or least-squares regression calculations. If the scattergraph plot reveals linear cost behavior, then it makes sense to perform the high-low or least-squares regression calculations to separate the mixed cost into its variable and fixed components. If the scattergraph plot does not depict linear cost behavior, then it makes no sense to proceed any further in analyzing the data.
The High-Low Method
If the relation between cost and activity can be represented by a straight line, then use the following steps to identify the variable cost portion of the mixed cost:
1. Identify the period with the lowest level and highest level of activity. 2. Identify the costs associated with the lowest level and highest level of activity. 3. In the numerator (top) subtract the lowest cost from the highest cost4. In the denominator (bottom) subtract the lowest level of activity from the highest.
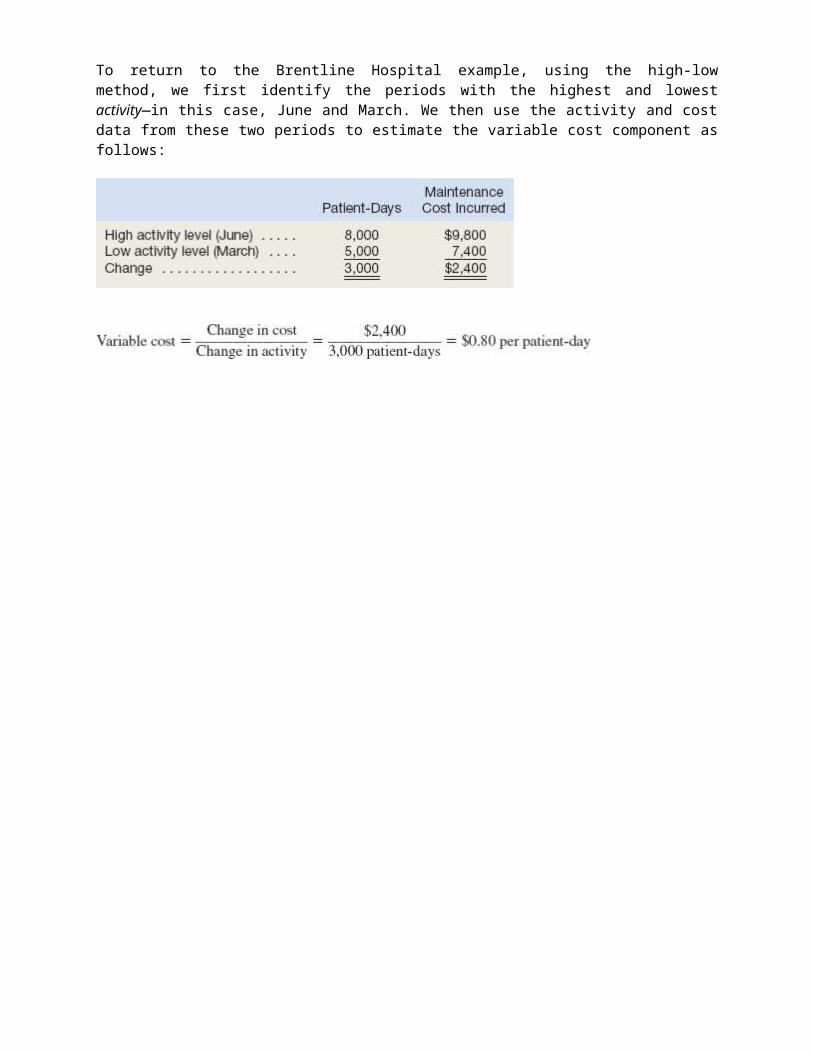
To return to the Brentline Hospital example, using the high-low method, we first identify the periods with the highest and lowest activity—in this case, June and March. We then use the activity and cost data from these two periods to estimate the variable cost component as follows:

Having determined that the variable maintenance cost is 80 cents per patient-day, we can now determine the amount of fixed cost. This is done by taking the total cost at either the high or the low activity level and deducting the variable cost element.
In the computation below, total cost at the high activity level is used in computing the fixed cost element:
Both the variable and fixed cost elements have now been isolated. The cost of maintenance can be expressed as $3,400 per month plus 80 cents per patient-day or as:
Steps for Hi Lo
1. Determine variable costs per unita. Identify the period with the lowest level and highest level of activity. b. Identify the costs associated with the lowest level and highest level of activity. c. In the numerator (top) subtract the lowest level activity cost from the highest activity
level costd. In the denominator (bottom) subtract the lowest level of activity from the highest.
2. Take either the high leval total cost and subtract the product of the variable cost per unit times the activity level at the high point
3. The remainder will be the fixed portion of the mixed cost.4. The formula can then be restated as Total cost = fixed + variable cost per unit (x volume) for
future planning or decision making.

EXERCISE 2–5 High-Low Method Guided Example 2-5
The Cheyenne Hotel in Big Sky, Montana, has accumulated records of the total electrical costs of the hotel and the number of occupancy-days over the last year. An occupancy-day represents a room rented out for one day. The hotel’s business is highly seasonal, with peaks occurring during the ski season and in the summer.
Required:
1. Using the high-low method, estimate the fixed cost of electricity per month and the variable cost of electricity per occupancy-day. Round off the fixed cost to the nearest whole dollar and the variable cost to the nearest whole cent.
2. What other factors other than occupancy-days are likely to affect the variation in electrical costs from month to month?

The Least-Squares Regression Method
The high-low method is very simple to apply, but it suffers from a major (and sometimes critical) defect—it utilizes only two data points. Generally, two data points are not enough to produce accurate results. Additionally, the periods with the highest and lowest activity tend to be unusual. A cost formula that is estimated solely using data from these unusual periods may misrepresent the true cost behavior during normal periods.
The least-squares regression method, unlike the high-low method, uses all of the data to separate a mixed cost into its fixed and variable components. A regression line of the form Y = a + bX is fitted to the data.
Fortunately, Microsoft Excel can carry out the computations required by the least-squares regression formulas. The data—the observed values of X and Y—are entered into the computer, and software does the rest.
Excel also provides a statistic called the R2, which is a measure of “goodness of fit.” The R2 varies from 0% to 100%, and the higher the percentage, the better. You should always plot the data in a scattergraph, but it is particularly important to check the data visually when the R2 is low. A quick look at the scattergraph can reveal that there is little relation between the cost and the activity or that the relation is something other than a simple straight line. In such cases, additional analysis would be required.

To perform regression analysis in excel, use the following steps: Please note if you have a version other than 2010, you will have to perform some research to find the steps. If all else fails, use the computer in the lab for the homework assignment(s) because it has version 2010 and above.
1. Make sure your excel program has regression as an Add-in. a. Under the file tab at the top of Excel, after Help, you should see an icon for Options. b. Click on this. On the left-hand side, second to last you should see Add ins.c. Click on this. Look to see if Analysis ToolPak is under Active Application Add-ins.
i. If not, click on it under Inactive Applications Add ins. ii. Check the box and click on Go.
iii. When the menu pops up, check the box next to Analysis ToolPak and click on OKiv. You have successfully added the Toolpak.
1. To double check, look under the data tab, look to the far right and there should be an icon for data analysis
d. Input your homework data to be analyzed into columns, the independent (activity) data should be in the column before the dependent (cost) data.
e. Click on the Insert tab, and then capture the two data columns with a mouse. f. Under the Charts tab, select Scatter and choose the chart without any lines.g. A scatter graph will automatically be produced. h. On the scatter graph, select the individual data points and right click. Select add trend
line. i. In Forecast section, under the backward section, type in the lowest activity levelj. On the trend line options menu, select linear, then at the bottom check the boxes next
to display equation on chart and display r-squared value on chart.

The Least-Squares Regression Worksheet for Brentline Hospital
To prepare a scattergraph plot, begin by highlighting the data in cells B4 through C10. From the Charts group within the Insert tab, select the “Scatter” subgroup and then click on the choice that has no lines connecting the data points. This should produce a scattergraph plot similar to the one shown in Exhibit 2A–2. Notice that the number of patient-days is plotted on the X-axis and the maintenance costs are plotted on the Y-axis.2 The data is approximately linear, so it makes sense to proceed with estimating a regression equation that minimizes the sum of the squared errors.
A Scattergraph Plot for Brentline Hospital

EXHIBIT 2A–4
Brentline Hospital: Least-Squares Regression Results
Traditional and Contribution Format Income Statements Prepare income statements for a merchandising company using the traditional and contribution formats.
Merchandising companies do not manufacture the products that they sell to customers. For example, Lowe’s and Home Depot are merchandising companies because they buy finished products from manufacturers and then resell them to end consumers.
The Traditional Format Income Statement
Traditional income statements are prepared primarily for external reporting purposes. Although the traditional income statement is useful for external reporting purposes, it has serious limitations when used for internal purposes. It does not distinguish between fixed and variable costs. Internally, managers need cost data organized by cost behavior to aid in planning, controlling, and decision making. The contribution format income statement has been developed in response to these needs.
The Contribution Format Income Statement
The crucial distinction between fixed and variable costs is at the heart of the contribution approach to constructing income statements. The unique thing about the contribution approach is that it provides managers with an income statement that clearly distinguishes between fixed and variable costs and therefore aids planning, controlling, and decision making.
The contribution approach separates costs into fixed and variable categories, first deducting variable expenses from sales to obtain the contribution margin. For a merchandising company, cost of goods sold is a variable cost that gets included in the “Variable expenses” portion of the contribution format income statement. The contribution margin is the amount remaining from sales revenues after variable expenses have been deducted. This amount contributes toward covering fixed expenses and then toward profits for the period.
The contribution format income statement is used as an internal planning and decision-making tool. Its emphasis on cost behavior aids cost-volume-profit analysis, management performance appraisals, and budgeting. Moreover, the contribution approach helps managers organize data pertinent to numerous decisions such as product-line analysis, pricing, use of scarce resources, and make or buy analysis.

Customers Customers Customers Customers Customers Customers Customers0 22 50 100 500 272 750
Sales 5.00 - 110.00 250.00 500.00 2,500.00 1,360.00 3,750.00
Variable CostsPatty 1.50 - 33.00 75.00 150.00 750.00 408.00 1,125.00 Buns 0.50 - 11.00 25.00 50.00 250.00 136.00 375.00 Cheese 0.35 - 7.70 17.50 35.00 175.00 95.20 262.50 Condiments 0.15 - 3.30 7.50 15.00 75.00 40.80 112.50 Electricity 0.50 11.00 25.00 50.00 250.00 136.00 375.00
3.00 - 66.00 150.00 300.00 1,500.00 816.00 2,250.00
Contribution Margin 2.00 44.00 100.00 200.00 1,000.00 544.00 1,500.00
Fixed CostsElectricity 45.00 45.00 45.00 45.00 45.00 45.00 45.00 45.00 Rent 500.00 500.00 500.00
Profit (45.00) (1.00) 55.00 155.00 455.00 (1.00) 955.00
Joe's Hamburgers
EXERCISE 2–6 Traditional and Contribution Format Income Statements
Cherokee Inc. is a merchandiser that provided the following information:
1. Prepare a traditional income statement.
2. Prepare a contribution format income statement.

Review Problem 1: Cost Terms
Many new cost terms have been introduced in this chapter. It will take you some time to learn what each term means and how to properly classify costs in an organization. Consider the following example: Porter Company manufactures furniture, including tables. Selected costs are given below:
1. The tables are made of wood that costs $100 per table.2. The tables are assembled by workers, at a wage cost of $40 per table.3. Workers assembling the tables are supervised by a factory supervisor who is paid
$38,000 per year.4. Electrical costs are $2 per machine-hour. Four machine-hours are required to produce a
table.5. The depreciation on the machines used to make the tables totals $10,000 per year. The
machines have no resale value and do not wear out through use.6. The salary of the president of the company is $100,000 per year.7. The company spends $250,000 per year to advertise its products.8. Salespersons are paid a commission of $30 for each table sold.9. Instead of producing the tables, the company could rent its factory space for $50,000 per
year.
Classify these costs according to the various cost terms used in the chapter. Carefully study the classification of each cost. If you don’t understand why a particular cost is classified the way it is, reread the section of the chapter discussing the particular cost term. The terms variable cost and fixed cost refer to how costs behave with respect to the number of tables produced in a year.
Review Problem 2: High-Low Method
The administrator of Azalea Hills Hospital would like a cost formula linking the administrative costs involved in admitting patients to the number of patients admitted during a month. The Admitting Department’s costs and the number of patients admitted during the immediately preceding eight months are given in the following table:

EXERCISE 2–9 Cost Terminology for Manufacturers [LO2–2, LO2–3]
Arden Company reported the following costs and expenses for the most recent month:
1. What is the total amount of product costs?2. What is the total amount of period costs?3. What is the total amount of conversion costs?4. What is the total amount of prime costs?
EXERCISE 2–10 Cost Behavior; Contribution Format Income Statement
Guided Example 2-10
Harris Company manufactures and sells a single product. A partially completed schedule of the company’s total and per unit costs over the relevant range of 30,000 to 50,000 units produced and sold annually is given below:
Complete the schedule of the company’s total and unit costs above.
1. Assume that the company produces and sells 45,000 units during the year at a selling price of $16 per unit. Prepare a contribution format income statement for the year.