viewing multiple graphs in r - statpower stuff/rmultiplegraphs.pdf · introduction recalling...
TRANSCRIPT
IntroductionRecalling Multiple Graphics Plots
Multiple Graphics Device WindowsMultiple Plots in One Graph
Viewing Multiple Graphs in R
James H. Steiger
Department of Psychology and Human DevelopmentVanderbilt University
P311, 2011
James H. Steiger Viewing Multiple Graphs in R
IntroductionRecalling Multiple Graphics Plots
Multiple Graphics Device WindowsMultiple Plots in One Graph
Viewing Multiple Graphs in R
1 Introduction
2 Recalling Multiple Graphics Plots
3 Multiple Graphics Device Windows
4 Multiple Plots in One Graph
James H. Steiger Viewing Multiple Graphs in R
IntroductionRecalling Multiple Graphics Plots
Multiple Graphics Device WindowsMultiple Plots in One Graph
Introduction
R has very powerful and flexible systems for creating andviewing graphics.However, by default, it opens one window when the firstgraph is plotted.As additional plots are created, the default behavior is tooverwrite the first graph.Here, we introduce methods for keeping graphs availableand/or displaying several graphs in a single figure.
James H. Steiger Viewing Multiple Graphs in R
IntroductionRecalling Multiple Graphics Plots
Multiple Graphics Device WindowsMultiple Plots in One Graph
Recalling Multiple Graphics Plots
On occasion, especially when doing a classroomdemonstration with R, you may wish to keep previousgraphs available so that you can go back to them easily.R has a system for doing that, although it is not“well-advertised.”We’ll illustrate it briefly for the PC. Apple and Linux userscan probably find a simple variant of these instructions.
James H. Steiger Viewing Multiple Graphs in R
IntroductionRecalling Multiple Graphics Plots
Multiple Graphics Device WindowsMultiple Plots in One Graph
Recalling Multiple Graphics Plots
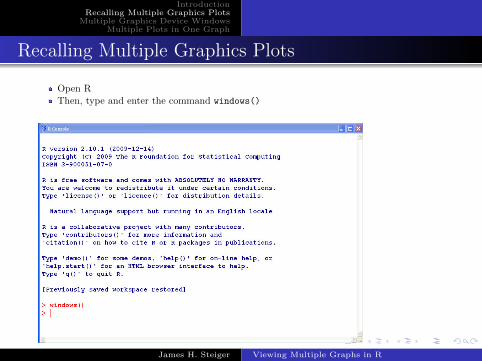
Open RThen, type and enter the command windows()
James H. Steiger Viewing Multiple Graphs in R
IntroductionRecalling Multiple Graphics Plots
Multiple Graphics Device WindowsMultiple Plots in One Graph
Recalling Multiple Graphics Plots
This will open up a blank Windows Graphics Devicewindow, and will shift the Windows “focus” to thatwindow, as shown on the next slide.
James H. Steiger Viewing Multiple Graphs in R

IntroductionRecalling Multiple Graphics Plots
Multiple Graphics Device WindowsMultiple Plots in One Graph
Recalling Multiple Graphics Plots
James H. Steiger Viewing Multiple Graphs in R
IntroductionRecalling Multiple Graphics Plots
Multiple Graphics Device WindowsMultiple Plots in One Graph
Recalling Multiple Graphics Plots
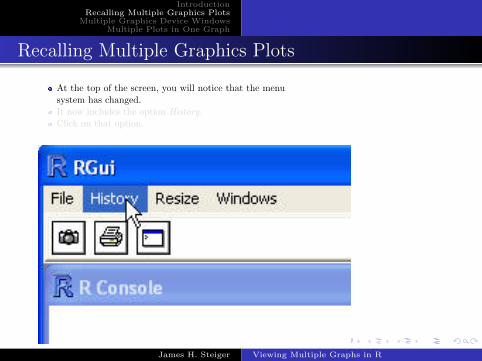
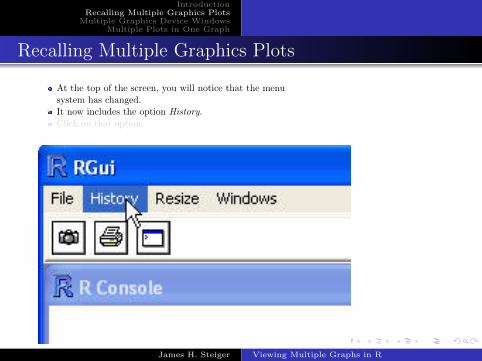
At the top of the screen, you will notice that the menusystem has changed.It now includes the option History.Click on that option.
James H. Steiger Viewing Multiple Graphs in R
IntroductionRecalling Multiple Graphics Plots
Multiple Graphics Device WindowsMultiple Plots in One Graph
Recalling Multiple Graphics Plots
At the top of the screen, you will notice that the menusystem has changed.It now includes the option History.Click on that option.
James H. Steiger Viewing Multiple Graphs in R

IntroductionRecalling Multiple Graphics Plots
Multiple Graphics Device WindowsMultiple Plots in One Graph
Recalling Multiple Graphics Plots
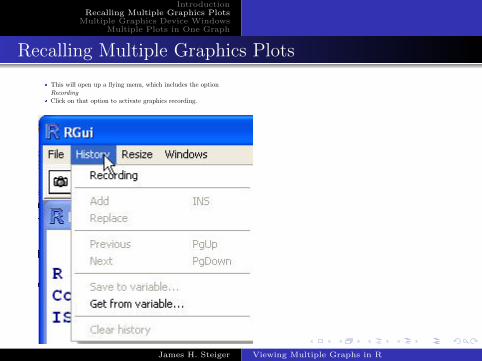
This will open up a flying menu, which includes the optionRecordingClick on that option to activate graphics recording.
James H. Steiger Viewing Multiple Graphs in R
IntroductionRecalling Multiple Graphics Plots
Multiple Graphics Device WindowsMultiple Plots in One Graph
Recalling Multiple Graphics Plots
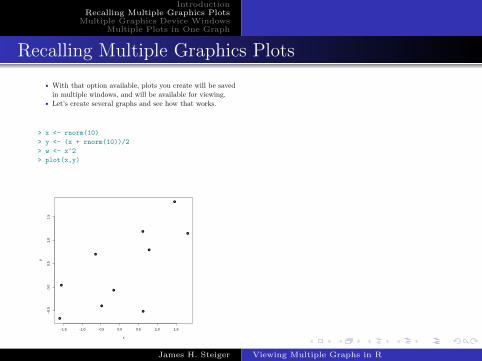
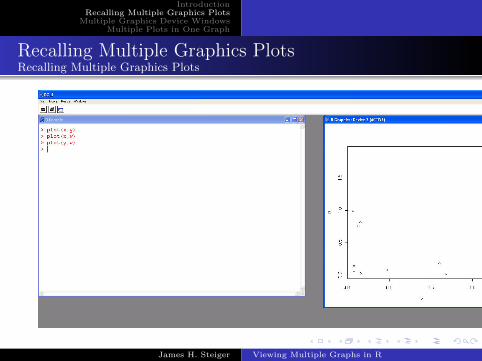
With that option available, plots you create will be savedin multiple windows, and will be available for viewing.Let’s create several graphs and see how that works.
> x <- rnorm(10)
> y <- (x + rnorm(10))/2
> w <- x^2
> plot(x,y)
●
●
●
●
●
●
●
●
●
●
−1.5 −1.0 −0.5 0.0 0.5 1.0 1.5
−0.
50.
00.
51.
01.
5
x
y
James H. Steiger Viewing Multiple Graphs in R
IntroductionRecalling Multiple Graphics Plots
Multiple Graphics Device WindowsMultiple Plots in One Graph
Recalling Multiple Graphics Plots
James H. Steiger Viewing Multiple Graphs in R
IntroductionRecalling Multiple Graphics Plots
Multiple Graphics Device WindowsMultiple Plots in One Graph
Recalling Multiple Graphics PlotsRecalling Multiple Graphics Plots
James H. Steiger Viewing Multiple Graphs in R
IntroductionRecalling Multiple Graphics Plots
Multiple Graphics Device WindowsMultiple Plots in One Graph
Recalling Multiple Graphics Plots
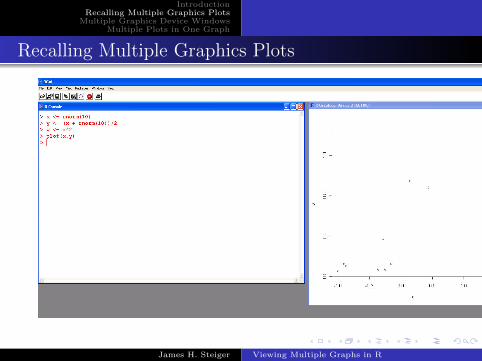
Now, with focus on the Graphics Device Window, you canpage through the graphs using the PageUp or PageDownkeys.You can also stop recording at any time by going back intothe history menu.
James H. Steiger Viewing Multiple Graphs in R
IntroductionRecalling Multiple Graphics Plots
Multiple Graphics Device WindowsMultiple Plots in One Graph
Recalling Multiple Graphics Plots
Now, with focus on the Graphics Device Window, you canpage through the graphs using the PageUp or PageDownkeys.You can also stop recording at any time by going back intothe history menu.
James H. Steiger Viewing Multiple Graphs in R
IntroductionRecalling Multiple Graphics Plots
Multiple Graphics Device WindowsMultiple Plots in One Graph
Multiple Graphics Device Windows
So far, we’ve explored a method for saving and recallingour plots while displaying them in one window.It is also possible to open several different windows, anddirect graphics to them, using the dev.cur() andwindows() commands.We’ll take a quick look at this in lecture. The key point isthat each windows graphics device window has a number,and you can direct output to a window by making it activeusing the dev.cur() command.
James H. Steiger Viewing Multiple Graphs in R
IntroductionRecalling Multiple Graphics Plots
Multiple Graphics Device WindowsMultiple Plots in One Graph
Multiple Graphics Device Windows
Eli Hooten, one of our students, has constructed somedemo code for this which I’ve placed in a file calledMultipleGraphWindows.txt on the website. This codeshould be used in conjunction with the data files from theChapter 2 lecture notes on Descriptive Statistics. (ThanksEli!)
James H. Steiger Viewing Multiple Graphs in R
IntroductionRecalling Multiple Graphics Plots
Multiple Graphics Device WindowsMultiple Plots in One Graph
Multiple Plots in One Graph
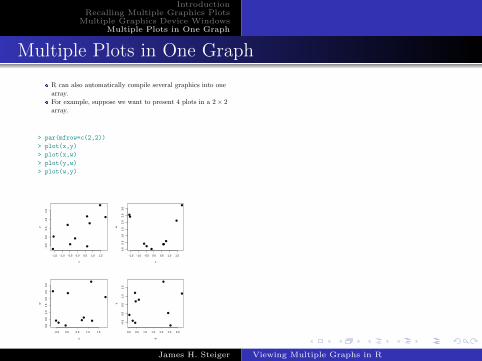
R can also automatically compile several graphics into onearray.For example, suppose we want to present 4 plots in a 2 × 2array.
> par(mfrow=c(2,2))
> plot(x,y)
> plot(x,w)
> plot(y,w)
> plot(w,y)
●
●
●
●
●
●
●
●
●
●
−1.5 −1.0 −0.5 0.0 0.5 1.0 1.5
−0.
50.
00.
51.
01.
5
x
y
●
●
●
●●
●
●
●●
●
−1.5 −1.0 −0.5 0.0 0.5 1.0 1.5
0.0
0.5
1.0
1.5
2.0
2.5
3.0
x
w
●
●
●
●●
●
●
● ●
●
−0.5 0.0 0.5 1.0 1.5
0.0
0.5
1.0
1.5
2.0
2.5
3.0
y
w
●
●
●
●
●
●
●
●
●
●
0.0 0.5 1.0 1.5 2.0 2.5 3.0
−0.
50.
00.
51.
01.
5
w
y
James H. Steiger Viewing Multiple Graphs in R