viewing grant balances job aid - university of...
TRANSCRIPT

Enterprise Reporting Query Studio Welcome to Query Studio! This course introduces the Enterprise Reporting Query Studio tool. We will begin with a brief overview of the Data Warehouse and then take a closer look at the various data packages. After building a familiarity with the Query Studio interface, we will complete exercises to introduce and reinforce your query-building skills. This guide was created with the efforts and support of many others. We would like to acknowledge the assistance of various myUFL users and Enterprise Systems team members for their helpful contributions. Thank you.
Instructional Objectives At the end of this course, you should be able to:
Describe the advantages of Query Studio and the Data Warehouse.
Demonstrate basics skills in Query Studio:
o Identify interface elements o Assemble a query using filters and other features o Save a query for later use o Export query data to another format such as PDF, Excel, csv, etc.
Build a report to serve your unit’s needs (FI, HR, Sponsored Research, and/or Student
Financials): o Describe the organization of data in the data packages o Use the Data Elements Guide to plan your query approach o Build, run, and save the report
Describe the steps for sharing a query to the Shared Folders section of Enterprise
Reporting
Recognize how to gain security access to Query Studio
Leverage helpful resources to continue your learning: o Reporting Services Staff o Reporting Services Workshops o myUFL Toolkits o Online reporting courses
Enterprise Reporting Query Studio – The Big Picture [page 1]

The Big Picture
Enterprise Reporting Data Warehouse and Query Studio Query Studio is an ad-hoc querying tool in Enterprise Reporting that allows you to ask a question of (i.e., query) the Data Warehouse. The Data Warehouse is a separate database that stores all PeopleSoft transactional data in a model that facilitates reporting and querying activities. It is dedicated to running reports and ad-hoc queries University users need so there is no impact on day-to-day operations such as hiring, requisitioning supplies, etc. A key difference between the Data Warehouse and PeopleSoft’s databases is the frequency with which the information is updated. With PeopleSoft being a live, transactional system, its databases are updated continuously. However, because the Data Warehouse is loaded with data from the PeopleSoft databases (a process involving the transfer of millions of rows of data) its information lags. The warehouse is updated overnight. Though the information in the Data Warehouse may lag behind that of the PeopleSoft databases, the Data Warehouse offers an advantage in that both financials and human resources information coexist in the Data Warehouse environment. This is not true in the PeopleSoft environment where financial information and human resources information are stored in separate databases. Query Studio also offers other advantages:
The visual interface requires no programming or knowledge of SQL to build your query
The fields and tables are named descriptively so you do not need to sort through cryptic names when assembling your query
Standard table joins have already been performed for you and criteria are easy to define
Built-in features allow you to enhance the layout of your query report easily
You will need the UF_ER_CRN_QUERY_STUDIO security role to access the Query Studio tool. Please note that the list of data packages you will have access to in Query Studio correlates with the other security roles you have established in myUFL.
Enterprise Reporting Query Studio – The Big Picture [page 2]

The Data Warehouse Let’s take a closer look at the components of myUFL and where Query Studio fits.
Exercise #1: Getting Familiar with Query Studio In this exercise, you will receive a quick introduction to Query Studio by navigating straight to a premade query saved in your My Folders area. You will get oriented to a report layout and apply data filters to change what information is displayed.
1. Log into http://my.ufl.edu/ with a GatorLink username and password. NOTE: Your instructor will provide you with a special account during class for training purposes.
2. From the myUFL menu, navigate to Enterprise Reporting > Access Reporting.
3. Use the provided Query Studio username and password to access Enterprise Reporting. NOTE: This is only for training purposes. Once you complete training and receive your security role, there will not be an extra authentication when accessing reporting.
PS FI
PS HRMS
ETL Data Warehouse
Data Packages
Cubes Standard views
(e.g., Department Ledgers)
Saved views (e.g., modified DL saved in My Folders)
Cubes are built with warehouse data after the warehouse is refreshed with PS data
Data packages are used when building all reports in Enterprise Reporting
Prompted reports
Delivered reports
Query Studio
Enterprise Reporting Query Studio – The Big Picture [page 3]

4. To use Enterprise Reporting with any version of Internet Explorer beyond version 8, enable Compatibility View by clicking the icon below.
5. Click the My Folders tab.
6. Click on Transaction Details by Dept. NOTE: This is a premade report that was built using Query Studio. You will have the opportunity to build new reports from scratch later in this training.
7. Click Run Report. (This will give you options for how to run the report.)
8. Click Preview with No Data. (This will allow you to build/manipulate the structure of the report before populating the report with data.)
Enterprise Reporting Query Studio – The Big Picture [page 4]

9. Notice the layout of the report.
10. Click on the DeptID filter (as seen below).
11. Replace the current DeptID filters with another department. In this example, use 62000000:
• Start by removing the current DeptIDs. Click Select All beneath the box displaying
the report’s current DeptID filters.
• Then click the Remove button.
Notice the filter icon and the items listed next to it. These items, such as current fiscal year and DeptID will filter the information displayed in the report.
Notice the various columns: DeptID, Transaction Detail, etc. Currently this report is not showing any meaningful information because data is turned off. It is a best practice to build the structure of your report first and then run it to display the appropriate data. You will learn how to do this later in this training.
Enterprise Reporting Query Studio – The Big Picture [page 5]

• Next enter 62 in the Keywords search box and click the Search button.
• Underneath the Results box, click Select All and then click the Insert button.
• Then click OK. Notice that the report now shows the DeptID filter as 62000000, 62010000, etc.
12. Click the Run button to display data in the report.
13. Repeat the steps 10-12, but change the DeptID filter to be your own department.
14. Click the Return button ( ) to return to the Enterprise Reporting home page.
Enterprise Reporting Query Studio – The Big Picture [page 6]
From the Beginning: Navigating to Query Studio and Building a Report
Navigating to Query Studio
1. Log into http://my.ufl.edu/ with your GatorLink username and password.
2. From the myUFL menu navigate to Enterprise Reporting > Access Reporting.
Please note for training purposes, a second authentication window will appear during the training session that does not appear in production use. You will be given a student account to log in with at this second login screen.
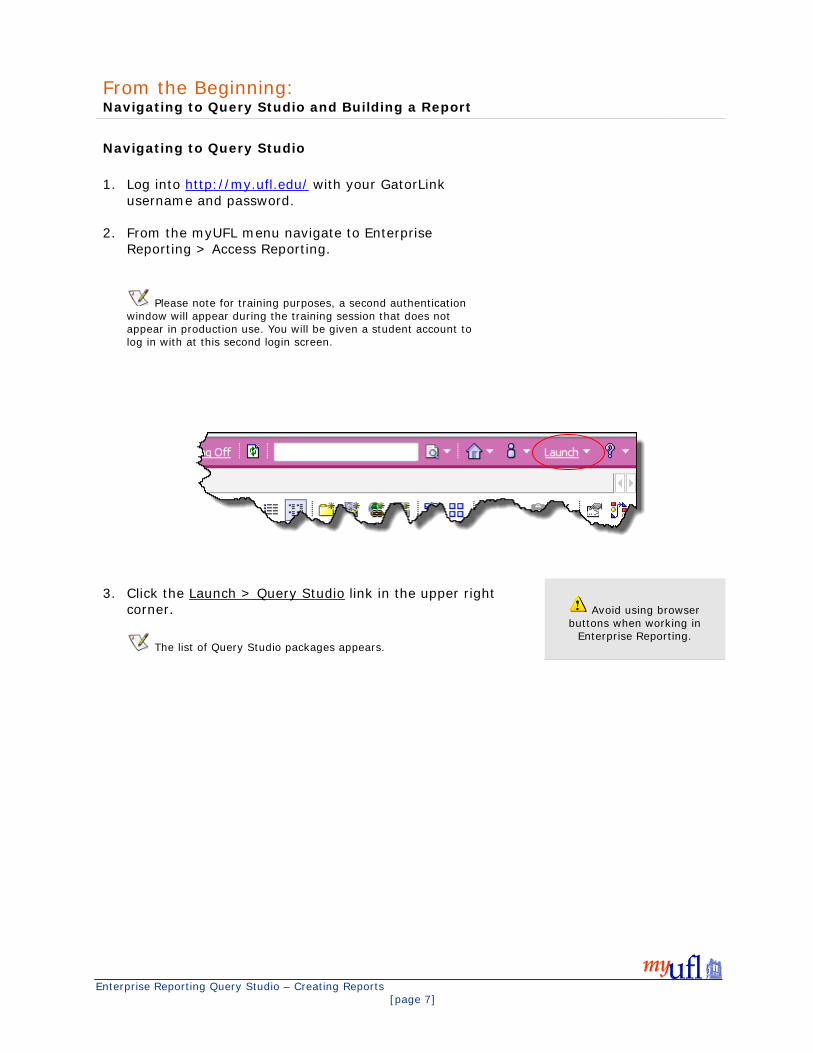
3. Click the Launch > Query Studio link in the upper right
corner.
The list of Query Studio packages appears.
Avoid using browser buttons when working in
Enterprise Reporting.
Enterprise Reporting Query Studio – Creating Reports [page 7]
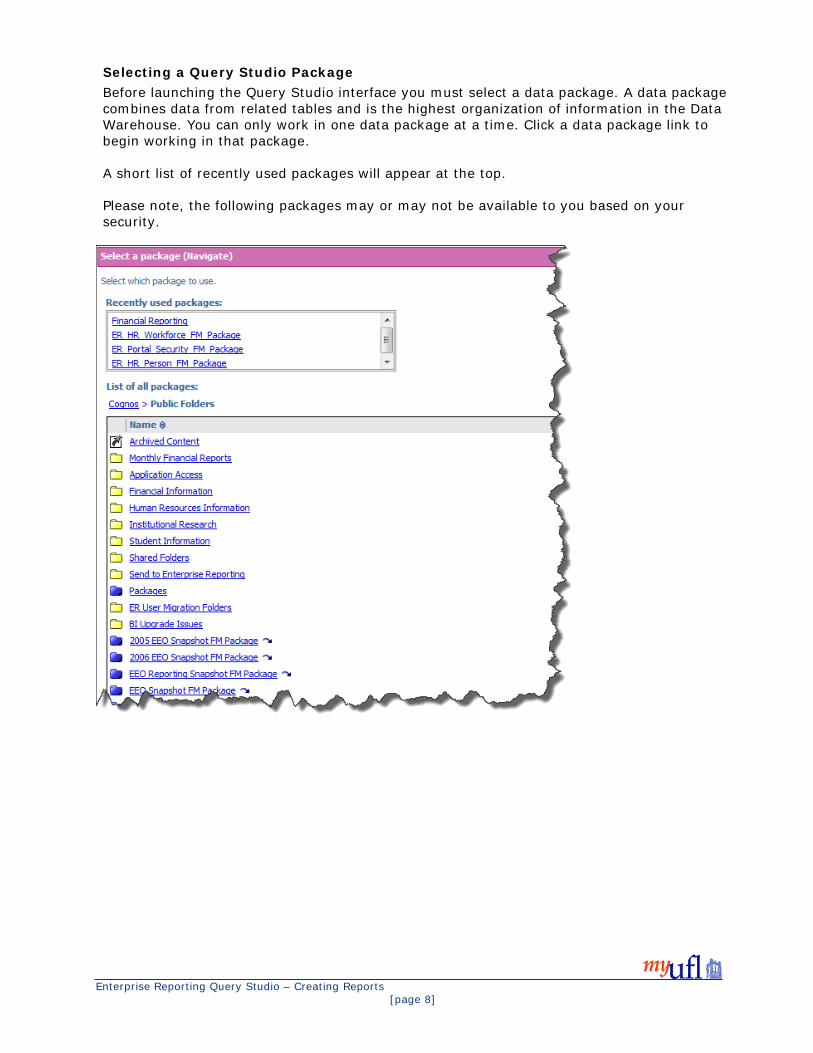
Selecting a Query Studio Package Before launching the Query Studio interface you must select a data package. A data package combines data from related tables and is the highest organization of information in the Data Warehouse. You can only work in one data package at a time. Click a data package link to begin working in that package. A short list of recently used packages will appear at the top. Please note, the following packages may or may not be available to you based on your security.
Enterprise Reporting Query Studio – Creating Reports [page 8]

Query Studio Interface Overview
The Main Menu The menu contains all the functions available from the shortcut buttons toolbar plus more. Based on the menu item you have selected, you will see varying options in the lower half of the menu area. Insert Data This menu allows you to select data from the package. The package holds all the query subjects (tables) available for reporting. Click on a folder or query subject to expand its contents and view the available query items. Query items are fields containing data you can add to your query report. They also can be measures or facts that hold quantitative data.
Package - A logical collection of data tables Query Subject - A single table that holds multiple Query Items Query Item - A field in the Query Subject table (UF ID, Last Name,
etc.). Measure or Fact - Quantitative data such as asset cost or
depreciation amount There are several methods you can use to add a query item to your report:
1. Single-click a query item and click the Insert button 2. Double-click a query item 3. Click and drag a query item 4. Click and drag a query subject to add all of its query items
You also can multi-select query items to insert more than one simultaneously.
Enterprise Reporting Query Studio – Creating Reports [page 9]

Edit Data Use the edit data commands to change how query items are displayed. Format commands change the way dates and numerical values appear. The Rename command changes the column header name of the query item, while not affecting the actual data. Change Layout These commands allow you to edit the aesthetic properties of the report such as adding graphics and crosstab diagrams, setting the page properties, and organizing data by groups or sections. Run Report The Run Report commands include options for processing report with all, limited or no preview data, catering to different resource capacity needs. By default, the “Preview with no data” option is selected. Several output options are available here including PDF, Excel, CSV and XML formats. Manage File This menu has options to create and save a report. There is also a report definition link that provides every report item and the details of the expressions for each. The Toolbar The toolbar buttons at the top provide a shortcut to commonly used functions. These functions are also found under the menu items on the left.
A B C D E F G H I J K L M N O P Q R S T U A. New Report – Create a New Report in the current Package B. Save – Save the report C. Save As – Save the report with a new name or location D. Cut – Cut the selected entries E. Paste – Paste the clipboard contents to the current location F. Delete – Delete the selected entries permanently from the report G. Undo – Undo previous action H. Redo - Redo previously undone action I. Run with All Data - Run the report using the full data source J. Filter - Add filtering criteria to query item K. Sort - Sort column by data appropriate criteria L. Summarize –Aggregate function such as Count, Min, Max, Total, and Average M. Calculate – Apply a mathematical operation to query item(s) N. Chart – Insert a chart O. Group – Allows grouping of similar information P. Pivot – Create a crosstab report with columns and rows Q. Ungroup – Undo previous Group function R. Create Sections – Show the value of a report item as the heading of a section S. Swap Rows and Columns – Inverse layout of crosstab information T. Collapse Group - Minimize detailed information of a group U. Expand Group - Display detailed information of a collapsed group
Enterprise Reporting Query Studio – Creating Reports [page 10]

Creating Reports In this section we will create several query reports to demonstrate various features of Query Studio and explore the more commonly used data packages. Exercises are grouped into three levels.
Level One exercises are step-by-step exercises you will perform with the instructor in class and independently in class.
Level Two exercises are step-by-step exercises you will perform independently in
class.
Challenge or level three exercises are scenario-based exercises you will perform independently in class.
Ultimate Challenge or the level four exercise is for you to decide what you want
to appear in the report. It is designed to be done in class, or independently back at your desk.
This training guide contains the following exercises:
Level 1 • Create an Employees by Status and Department Report • Create a list of Active Projects by PIs
Level 2
• Create a report for PCard Transaction over $1,000.00
Level 3 • Create a Citizenship Report • Create a Tenure Status Report
Level 4
• Ultimate Challenge Please note that these exercises provide instruction on building simplified reports for demonstration purposes only. However, your ad-hoc querying efforts should not replicate standard reports that already exist in the system.
Enterprise Reporting Query Studio – Creating Reports [page 11]

Exercise 2: (Level 1) Create an Employee by Status and Dept Report Scenario: Matthias would like you to generate a list of all employees in Enterprise Systems (p.k.a. Bridges) by their employment status. You will set up a query listing employees and define prompts for the Department. Add Data
1. Once you have logged into Enterprise Reporting, click the Launch > Query Studio link.
2. Click the ER_HR_Workforce_FM_Package link to open Query Studio and the package.
a. If you have recently used this package it will appear in the Recently Used box at the top of the page.
b. If you have not recently used this package, you will need to navigate to it by clicking on the page navigation. Go to page 2 and you will find it there. Subsequently, it will appear in your Recently Used box.
3. Click to expand the Job Information folder.
4. Click to expand the Job Fact table.
5. Select these fields: a. Double-click Employee ID b. Double-click Job Fact Current Flag c. Double-click Department d. Double-click Department Code
6. Click to collapse the Job Fact table.
7. Click to expand the Job Employee Status table.
8. Double-click Job Employee Status query item (within the table).
9. Click to collapse the Job Employee Status table.
10. Click to expand the Job Person Names table.
11. Select these fields: a. Double-click Name b. Double-click Name Type Code
12. Click to collapse the Job Person Names table.
Set filters to minimize the results
1. Select the Name Type Code column heading.
2. Click to set a filter on this column.
Enterprise Reporting Query Studio – Creating Reports [page 12]

3. Click the Pick Values from a List link.
4. A list of valid values for this field will appear. Select PRI (Primary) checkbox from the list.
5. Click OK.
6. Click the Job Fact Current Flag heading to select the column.
7. Click to set a filter on this column.
8. A list of valid values for this field will appear. Select Y checkbox from the list.
9. Click OK twice.
10. Now we will set a prompt for the report. Click the Department Code heading.
11. Click to set a filter on this column.
12. Click the Search for values link.
13. Type in 14 in the search field to search for department codes beginning with 14.
14. Click .
15. Click the Select all link to select all values it has found.
16. Click to add those values to your filter.
17. Click OK twice.
Grouping and Formatting
1. Click the Job Employee Status heading to select the column.
2. Click to group by this column and remove any redundant values.
3. Click the Title of the report to edit it.
4. Enter Employee List by Status in the Title field.
5. Uncheck each of the boxes.
6. Click OK.
7. Select the Department Code and Department column headings.
Enterprise Reporting Query Studio – Creating Reports [page 13]

8. Click the to Create a Section.
9. Now click to run your report.
10. Now click the Run Report link in the menu to view the report in a PDF format.
11. Click the View in PDF Format link.
12. Close the tab when you are finished reviewing the report.
13. Click to save your report. a. Enter a name for your report in the Name field. b. If necessary, click the Select another location… link to select your destination. c. Click the My Folder link at the top of the page to select this destination. d. Click OK to set this location. e. Click OK again to save your report.
Now let’s remove the filtered columns to improve the readability of our report.
14. Click the Job Fact Current Flag heading to select the column.
15. Click to delete the column.
16. When prompted about deleting the filter, uncheck the box and click OK.
17. Click the Name Type Code heading to select the column.
18. Click to delete the column.
19. When prompted about deleting the filter, uncheck the box and click OK.
20. Click to save your report.
A Step Further…
1. Highlight Department Code and Department.
2. Click the Calculation button.
3. Select Concatenation from the Operation dropdown list. NOTE: Concatenation means to combine two strings of information. In this example, we’ll combine the headers and data of two columns.
4. Enter a hyphen (-) in the Separator between report items field.
5. Click the Insert button.
6. Delete the Department Code (remember, do not delete the filter).
7. Delete the Department.
Enterprise Reporting Query Studio – Creating Reports [page 14]

8. Highlight Department Code - Department column heading.
9. Click the to create a section.
10. Click to save your report.
11. Click the Return button ( ) to return to the Enterprise Reporting home page.
Enterprise Reporting Query Studio – Creating Reports [page 15]
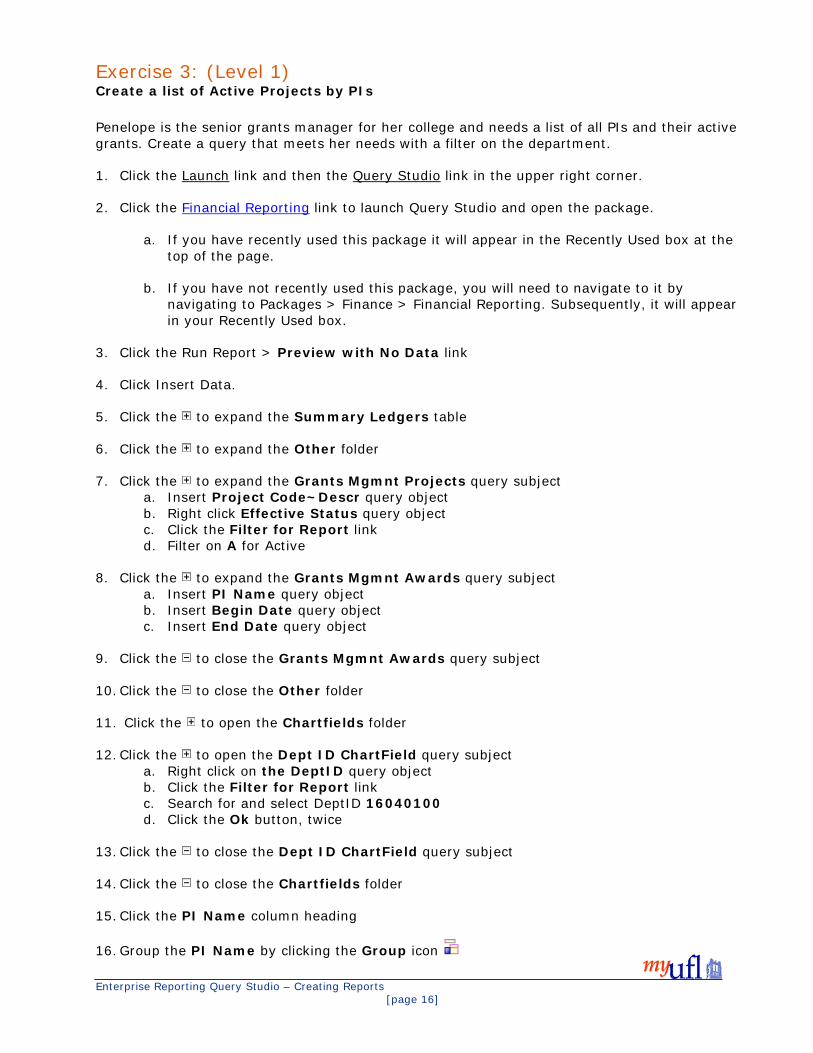
Exercise 3: (Level 1) Create a list of Active Projects by PIs Penelope is the senior grants manager for her college and needs a list of all PIs and their active grants. Create a query that meets her needs with a filter on the department.
1. Click the Launch link and then the Query Studio link in the upper right corner.
2. Click the Financial Reporting link to launch Query Studio and open the package.
a. If you have recently used this package it will appear in the Recently Used box at the top of the page.
b. If you have not recently used this package, you will need to navigate to it by navigating to Packages > Finance > Financial Reporting. Subsequently, it will appear in your Recently Used box.
3. Click the Run Report > Preview with No Data link
4. Click Insert Data.
5. Click the to expand the Summary Ledgers table
6. Click the to expand the Other folder
7. Click the to expand the Grants Mgmnt Projects query subject a. Insert Project Code~Descr query object b. Right click Effective Status query object c. Click the Filter for Report link d. Filter on A for Active
8. Click the to expand the Grants Mgmnt Awards query subject a. Insert PI Name query object b. Insert Begin Date query object c. Insert End Date query object
9. Click the to close the Grants Mgmnt Awards query subject
10. Click the to close the Other folder
11. Click the to open the Chartfields folder
12. Click the to open the Dept ID ChartField query subject a. Right click on the DeptID query object b. Click the Filter for Report link c. Search for and select DeptID 16040100 d. Click the Ok button, twice
13. Click the to close the Dept ID ChartField query subject
14. Click the to close the Chartfields folder
15. Click the PI Name column heading
16. Group the PI Name by clicking the Group icon Enterprise Reporting Query Studio – Creating Reports [page 16]

17. Click the Title a. Enter Active Projects by PI in the title field b. Remove the check marks for Show filters c. Remove the check marks for Show sorts d. Remove the check marks for Show suppression
18. Click the Ok button
19. Click the Run button
20. Click the Run Report menu option
21. Select Preview with No Data
22. Click the Save as icon a. Save as Active Projects by PI b. Your location should be My Folders c. Click the OK button
A Step Further – Add Employee ID/Employee Name to your query and filter by date
1. Group by Project Code~Descr by clicking the Group icon
2. Click the to open the ChartField folder
3. Click the to open the Employee ID Chartfield query subject a. Insert the EmplID~Employee Name query item
4. Click the to close the Employee ID Chartfield query subject
5. Click the to close the Chartfields folder
6. Click on the End Date column
7. Click to set a filter on this column
8. Use the calendar to enter June 30, 2014 into the From field
9. Click OK twice
10. Click the Run button
11. Click the Run Report menu option
12. Select Preview with No Data
13. Click the Save icon
Enterprise Reporting Query Studio – Creating Reports [page 17]

Exercise 4: (Level 2) Create a report for PCard Transactions over $1,000.00 Jane wants to view all PCard expenditures in the current month that exceeds $1,000. She will set up query listing PCard expenditures and define prompts for the date range.
1. Click the Launch link and then the Query Studio link in the upper right corner.
2. Click the Financial Reporting link to launch Query Studio and open the package.
3. Click the Run Report > Preview with No Data link.
4. Open PCard Transaction Details.
5. Open Chartfields folder and make the following selections: a. Filter on DeptID~Desc for 16% (% symbol indicates all DeptIDs beginning with 16)
6. From the PCard Transaction Line Distribution query subject, select: a. Cardholder UFID b. Cardholder Name c. Transaction Date d. Transaction Number
7. Group by the Transaction Date field and set the filter to Prompt every time the report
runs.
8. From the Account Chartfield folder, select the Account Code~Descr.
9. PCard Transaction Line Distribution, select Quantity and Merchandise Amount.
10. Select the Quantity and Merchandise Amount headings and create a calculation to multiply them.
11. Delete the Quantity field and the Merchandise Amount field.
12. Filter so you only get transactions equal to or greater than $1,000.00.
13. Select the Cardholder UFID and Cardholder Name. Group them.
14. Name the query PCard Transactions > $1000.00.
15. Hide the Filters, Sorts and Suppression.
16. Select Preview with No Data.
17. Save the query as PCard Transactions > $1000.00.
Enterprise Reporting Query Studio – Creating Reports [page 18]

Exercise 5: (Level 3) Create a Citizenship Report
Janet would like you to create a report listing all employees in her department and their current citizenship classification and VISA type and expiration date. Key information
• Data Package: ER HR Workforce FM Package
• Query Subjects: Citizen, Names, and Job Fact, Job Employee Status, VISA Permit
Information
• Query Items: Department Code, Employee ID, Job Fact Current Flag, Name, Citizenship
Status, Visa Permit Type, and Visa Expiration Date
• Filter on: Department Code (16%), Job Fact Current Flag (Y), Job Employee Status
(Active), VISA select all, and “Leave out missing values”
• Section by: Department Code
• Group by: Citizenship Status,
• Concatenate: Employee ID and Name
o Name the Concatenated field: Employee ID ~ Name o Delete: Employee ID Delete Name o Group by Employee ID ~ Name
Report Item
Expression
Department Code [ERModel].[Job Fact].[Department Code]
Citizenship Status [ERModel].[Citizen].[Citizenship Status]
Employee ID [ERModel].[Names].[Employee ID]
Name [ERModel].[Names].[Name]
VISA Permit Type [ERModel].[Visa Permit Information].[VISA Permit Type]
Expiration Date [ERModel].[Visa Permit Information].[Expiration Date]
Job Fact Current Flag [ERModel].[Job Fact].[Job Fact Current Flag]
Job Employee Status [ERModel].[Job Employee Status].[Job Employee Status]
Enterprise Reporting Query Studio – Creating Reports [page 19]
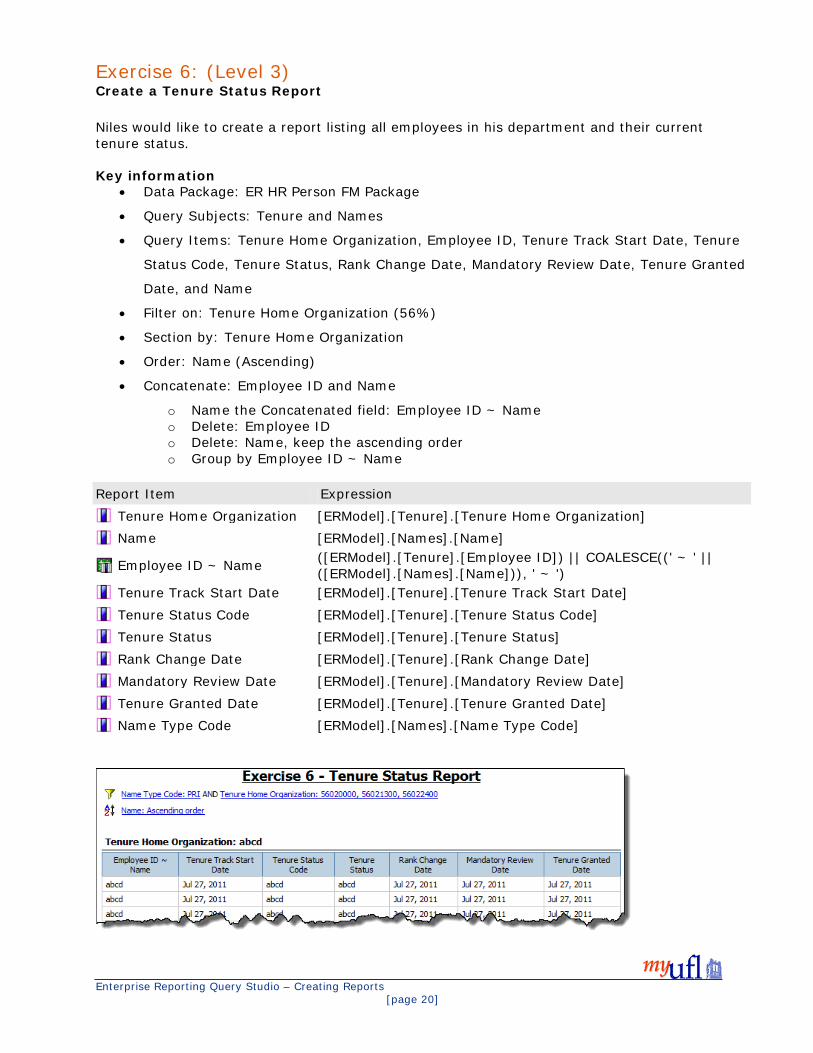
Exercise 6: (Level 3) Create a Tenure Status Report Niles would like to create a report listing all employees in his department and their current tenure status. Key information
• Data Package: ER HR Person FM Package
• Query Subjects: Tenure and Names
• Query Items: Tenure Home Organization, Employee ID, Tenure Track Start Date, Tenure
Status Code, Tenure Status, Rank Change Date, Mandatory Review Date, Tenure Granted
Date, and Name
• Filter on: Tenure Home Organization (56%)
• Section by: Tenure Home Organization
• Order: Name (Ascending)
• Concatenate: Employee ID and Name
o Name the Concatenated field: Employee ID ~ Name o Delete: Employee ID o Delete: Name, keep the ascending order o Group by Employee ID ~ Name
Report Item
Expression
Tenure Home Organization [ERModel].[Tenure].[Tenure Home Organization]
Name [ERModel].[Names].[Name]
Employee ID ~ Name
([ERModel].[Tenure].[Employee ID]) || COALESCE((' ~ ' || ([ERModel].[Names].[Name])), ' ~ ')
Tenure Track Start Date [ERModel].[Tenure].[Tenure Track Start Date]
Tenure Status Code [ERModel].[Tenure].[Tenure Status Code]
Tenure Status [ERModel].[Tenure].[Tenure Status]
Rank Change Date [ERModel].[Tenure].[Rank Change Date]
Mandatory Review Date [ERModel].[Tenure].[Mandatory Review Date]
Tenure Granted Date [ERModel].[Tenure].[Tenure Granted Date]
Name Type Code [ERModel].[Names].[Name Type Code]
Enterprise Reporting Query Studio – Creating Reports [page 20]
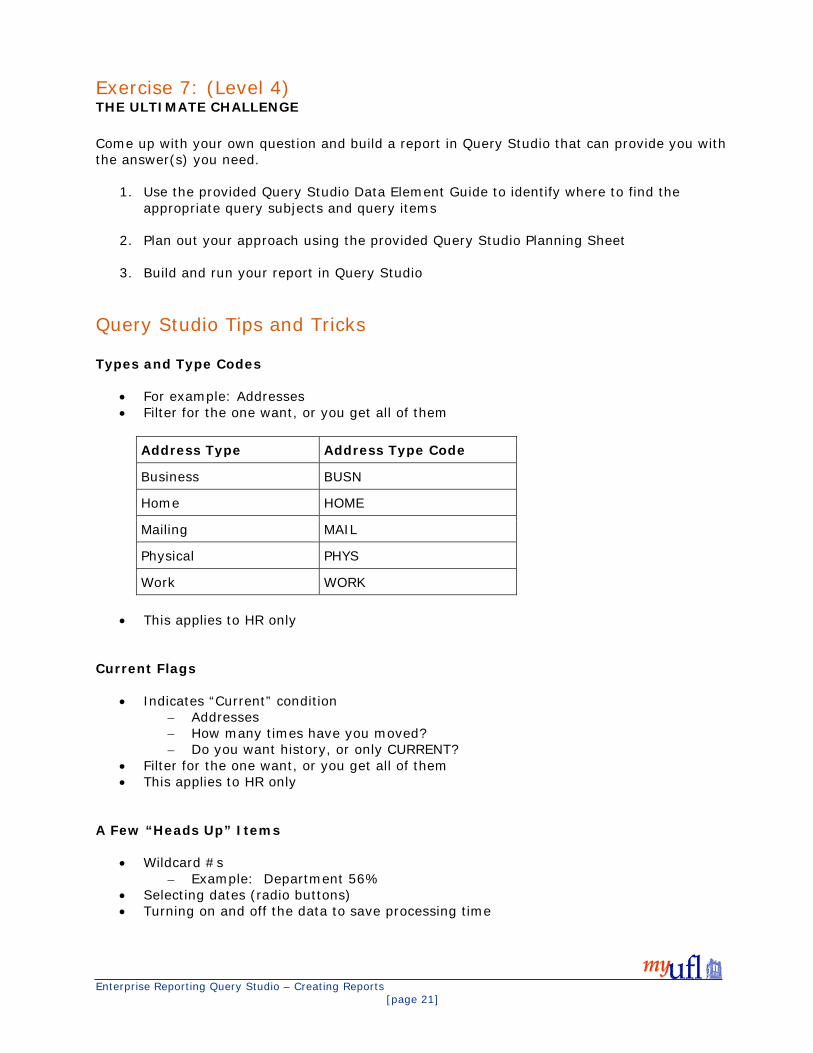
Exercise 7: (Level 4) THE ULTIMATE CHALLENGE Come up with your own question and build a report in Query Studio that can provide you with the answer(s) you need.
1. Use the provided Query Studio Data Element Guide to identify where to find the appropriate query subjects and query items
2. Plan out your approach using the provided Query Studio Planning Sheet
3. Build and run your report in Query Studio Query Studio Tips and Tricks Types and Type Codes
• For example: Addresses • Filter for the one want, or you get all of them
Address Type Address Type Code
Business BUSN
Home HOME
Mailing MAIL
Physical PHYS
Work WORK
• This applies to HR only Current Flags
• Indicates “Current” condition – Addresses – How many times have you moved? – Do you want history, or only CURRENT?
• Filter for the one want, or you get all of them • This applies to HR only
A Few “Heads Up” Items
• Wildcard #s – Example: Department 56%
• Selecting dates (radio buttons) • Turning on and off the data to save processing time
Enterprise Reporting Query Studio – Creating Reports [page 21]

Make sure to click OK when you see the following message:
The Best Experience
• Internet Explorer with Compatibility Mode turned on
• Remember to log out of Enterprise Reporting rather than simply closing the browser window
– This insures that there are no processes left running from your session
• For more detailed instructions on IE Compatibility Mode, visit the UF Help Desk Wiki page: http://tinyurl.com/iecompmode.
Query Studio Resources Getting access Upon completion of training, please request the Query Studio security role from your Department Security Administrator (DSA). Your completion of training will be verified automatically and you will be added to the Query Studio Listserv. UF_ER_CRN_Query Studio Query Studio Listserv The Query Studio listserv is available to you once you have been assigned the Query Studio role. It provides relevant messages from Enterprise Systems and allows you to share tips with other Query Studio users. [email protected] Shared Folders
• Collaboration area for Query Studio users
Enterprise Reporting Query Studio – Creating Reports [page 22]
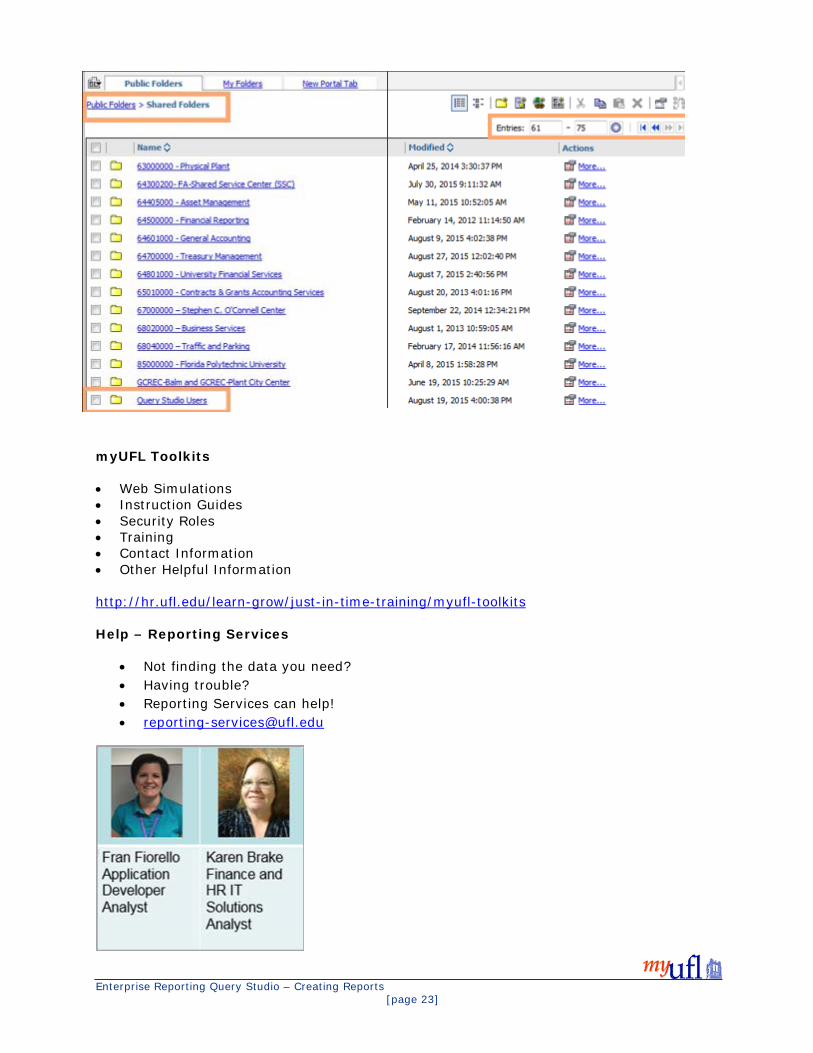
myUFL Toolkits • Web Simulations • Instruction Guides • Security Roles • Training • Contact Information • Other Helpful Information http://hr.ufl.edu/learn-grow/just-in-time-training/myufl-toolkits Help – Reporting Services
• Not finding the data you need? • Having trouble? • Reporting Services can help! • [email protected]
Enterprise Reporting Query Studio – Creating Reports [page 23]

UF Computing Help Desk
• 392-HELP or [email protected] • Include details:
– Browser Information – Navigation – Error Messages – Expected Results
• Include your UFID and/or GatorLink username Summary
Enterprise Reporting Query Studio – Creating Reports [page 24]
Congratulations, you have reached the end of the course! At this time, you should now be able to:
Describe the advantages of Query Studio and the Data Warehouse.
Demonstrate basics skills in Query Studio:
o Identify interface elements o Assemble a query using filters and other features o Save a query for later use o Export query data to another format such as PDF, Excel, csv, etc.
Build a report to serve your unit’s needs (FI, HR, Sponsored Research, and/or
Student Financials): o Describe the organization of data in the data packages o Use the Data Elements Guide to plan your query approach o Build, run, and save the report
Describe the steps for sharing a query to the Shared Folders section of Enterprise
Reporting
Recognize how to gain security access to Query Studio
Leverage helpful resources to continue your learning: o Reporting Services Staff o Reporting Services Workshops o myUFL Toolkits o Online reporting courses
Enterprise Reporting Query Studio – Creating Reports [page 25]

Appendix: Data Source Icons
Each object in the data source has a representative icon. You can insert all of the following objects in a report, except for packages and dimensions.
Icon Object
Package, which contains the objects you can insert in a report.
Namespace, used to organize objects.
Query subject, which represents a table in the database.
In relational data sources, query item, which represents a column of qualitative data in the database, such as product name or country.
In dimensional data sources, level attribute, which represents a property of a level.
A member is a unique item within a hierarchy. For example, Camping Equipment and 4 Man tent are members of the Products Hierarchy.
Dimension, which represents a broad grouping of descriptive data about a major aspect of a business, such as products, dates, or markets.
Hierarchy, which represents a collection of dimensional members organized into a tree structure.
Level, which is a set of members that have common attributes. For example, a geographical dimension might contain levels for country, region, and city.
Multiple levels can exist within a level hierarchy, beginning with the root level. The root level is the parent and rollup of all members in the first level. It is used to obtain a rollup of all values across the hierarchy and to provide a convenient point to start drilling.
Measure or fact, a query item that represents a column of quantitative data in the database, such as revenue or quantity.
Measures folder, which contains hierarchical measures.
Model filter.
Folder, used to organize data items. You cannot import a folder into your report.
Enterprise Reporting Query Studio – Creating Reports [page 26]