vietnam food price paper 071213 - cornell...
TRANSCRIPT

1
Distributional impacts of the 2008 global food price spike in Vietnam
Andy McKay and Finn Tarp
Keywords: food prices, rice, Vietnam, transmission
JEL categories: O1, O5, Q18
McKay:
Department of Economics, 279 Jubilee, University of Sussex, Falmer, Brighton, BN1 9SL,
UK. Email: [email protected]; telephone: +44 1273 678739.
Tarp:
UNU-WIDER, Katajanokanlaituri 6B, FI-00160, Helsinki, Finland. Email:
[email protected]; telephone +358-9-615 991;
and
Department of Economics, University of Copenhagen, Øster Farimagsgade 5, DK-1353
København K, Denmark. Email: [email protected]; Telephone: +45 35323041
This paper was prepared as a contribution to: New Directions in the Fight Against Hunger and
Malnutrition - A Festschrift in Honor of Per Pinstrup-Andersen.

2
Abstract
Agriculture and food cultivation production remains a key sector in the Vietnamese economy
in terms of productive activities, income generation and national export earnings. Higher
world market prices should therefore in principle have a beneficial impact on rural farmers.
This is based however on the assumption that world prices are transmitted and that farmers
have the capacity to respond. In addition, many poorer farm households may be net
consumers. Using data from the Vietnam Access to Resources Household Survey (VARHS)
and the Vietnam Household Living Standard Survey (VHLSS) combined with available
macro-data, this paper investigates how global price changes appear to have impacted on rural
welfare in Vietnam during the period 2006 to 2012.
In this paper we study the case of rice in Vietnam, in the content of the 2008 food price spike.
We analyze the responses of domestic producer and consumer prices, and discuss the policy
actions taken by the government to help reduce the impact on consumers as well as to
continue to encourage production. We also look at the distributional impact of the resulting
domestic price changes, using data from a specialist rural household survey to look at
production response. Vietnam was effective in taking policy actions to limit the extent of
transmission of the world price changes; and more poorer households benefitted from the
price increase than lost.
3
1 Introduction
The point of departure of the present paper is that the global economy is passing through a
period of profound change (Addison et al. 2011). The global economy is still recovering from
the global financial crisis which originated in the north. The south has been affected in a
variety of ways including reduced export demand and reduced private financial flows. In the
background, climate change remains unchecked potentially threatening to undermine
development progress achieved over the past decades. In addition to this, the world prices of
food and fuel have increased substantially, particularly in 2008 but sustained since then.
Assuming the restoration of global economic growth, this is likely to lead to a continuation of
the increase in food and energy prices, which are now structurally linked in new ways.
This has led to suggestions that malnutrition, hunger and poverty have increased as a result.
But did this actually happen? In this paper we study how consumers and producers fared in
one specific country case, Vietnam, with a focus on a critically important crop, namely rice.
As a key part of this we analyse how the Vietnamese Government responded to the crisis.
This underlines the importance of understanding how increased food prices are transmitted to
consumers and producers and how they respond.
Vietnam is a populous south east Asian economy with a particular economic and political
history in the middle of a dynamic Asian development experience. Following the Doi Moi
policy reforms in 1986, Gross Domestic Product (GDP) grew steadily at 7.6% a year for
around five years. Growth accelerated to 9.8% in the early 1990s until 1998, when it levelled
off to 7% following the Asian crisis. Shortly after this higher growth was re-established, but
then dropped again following the world financial crisis in 2008. Despite these fluctuations,

4
the annual average growth rate has been at 7% or above for nearly 25 years. When a country
grows at 7% a year, income is doubled in about 10 years; over a period of 25 years people
become 5 times richer. So the average Vietnamese person who was earning US$1.25 in 1990
is now earning around US$6 assuming that growth was equally distributed.
More than two-thirds of the Vietnamese population was born after 1975 and the younger
generation is living in a radically different Vietnam from the country that was reunited in
1975. One of the most remarkable changes is a substantial decrease in absolute poverty.
Vietnam has seen the sharpest drop of the share of the population living in absolute poverty in
the world. Some observers have erroneously concluded that poverty has increased more
recently. They overlook that the latest poverty assessment suggesting that poverty is around
20% of the population is based on a poverty line of US$2.25 a year. This is almost double the
poverty line used in previous poverty assessments. Without doubt Vietnam has reduced
poverty at rates that even surpass those of China.
Debate about the drivers behind Vietnam’s economic success and its sustainability continues.
There is widespread agreement that high savings and investment has played a key role. In
contrast, the role of technical progress has tended to be discounted. However, Abbott, Tarp
and Wu (2012) estimate that a significant share of the difference between GDP and
employment growth is due to technical change, including technical progress in agriculture.
These factors have also helped underpin rapid growth in the agricultural sector. The key crop
for Vietnam is rice, which is grown by smallholders throughout Vietnam, and it plays a
central role in ensuring national food security. This is an overriding policy concern following

5
the traumatic experience of the early 1980s where major food shortages were experienced. In
fact, it is difficult to overstate the economic and political importance of rice to the Vietnamese
economy and the development experience. Since the1980s , substantial progress though has
been achieved , with Vietnam moving from being a net importer of rice to a major world
exporter in 1989. Reflecting the critical food security concerns, government restricts farmers
to grow rice on specific land areas, and a major share of land continues to be allocated to
growing rice. Increasingly this is also motivated by export targets established within the
national planning framework (Markussen et al., 2011).
In this paper we focus on how global changes in the rice price in 2008 impacted on consumers
and producers in Vietnam, and try to assess distributional impact. As an integral part of this,
we analyse and assess government policies related to rice production and prices. This
provides a critical lens for understanding agricultural policies in Vietnam and other low and
lower-middle income countries for which agriculture is a critical sector (Hai and Talbot,
2013). We are in this analysis fortunate to be able to draw not only on generally available
macroeconomic data but also on a unique panel data set in rural Vietnam covering the period
2006 to 2012, the Vietnam Access to Resources Household Survey (VARHS), as well as the
national Vietnam Household Living Standards Survey (VHLSS).
This paper is structured in the following way. In the next section we summarize the extensive
literature looking at the welfare impact of food price changes, in particular the extensive
literature which followed the 2008 crisis. In section 3 we discuss the data used in this paper
and section 4 provides further information on the policymaking framework, as well as
contextual background on the nature of livelihoods and production in rural Vietnam. We ,

6
identify a number of the factors which are important influences on rice production and
consumption. Section 5 then presents empirical evidence on the nature and impact of rice
price changes, while section 6 provides interpretation and concludes.
2 Literature reviewi
The question of the impact of a price change on producers and consumers is a core and
widely studied question in economics; the price changes may be a consequence of many
factors such as tax changes or, as here, changes in the world price of a traded commodity. A
wide body of consumer and producer theory, as well as a range of applied general equilibrium
approaches, have been used to analyse this question. In a developing country context this has
commonly been pursued in the context of an agricultural household model. A classic example
is the study by Deaton (1989), looking at the welfare and other impacts of a change in the rice
price in Thailand, which recognized the key distinction between net consumers (who lose
from food price increases) and net producers (who gain). In a similar analysis in Bangladesh,
Ravallion (1990) highlights the importance of also taking account of the labour position of the
household. Many other empirical studies look at the impact of food price increases; for
instance Barrett and Dorosh (1996) find that in Madagascar the beneficial effects of a rice
price increase are highly concentrated among wealthier farmers. Jensen et al. (2010)
demonstrate the intricacies of measuring price incentives in an economy-wide general
equilibrium context.
The impact of changes in prices on consumers and producers though also depends on the
extent to which they are transmitted to the poor (Winters et al. 2004, section 4.1). In the 1980s
it was regularly argued that getting the prices right meant complete liberalization with a view

7
to having full pass through and being fully aligned with world prices. The analytic basis for
this position has since been questioned. It is first of all far from clear that governments should
abstain from stabilizing prices to some extent. Second, given real world departures from the
perfectly competitive model, such as transport and transactions costs, full pass through is
unlikely to ever happen. Intervention is often a second best policy measure in the context of
exceptional price changes (Abbott 2011; Martin and Anderson 2011).
Viewed from a slightly different perspective there were at the time of the 2008 price spike
very widely expressed concerns about its likely poverty, malnutrition and mortality impact.
While a blog by the Chief Economist for Africa of the World Bank suggested the possibility
of 700,000 excess deaths, a study by Friedmann and Schady (2009) predicted much lower
numbers of 30,000 to 50,000 (with a differential effect on girls). UNICEF, World Food
Programme and others issued warnings about the potentially severe impact of the food price
increase and the international media followed suit.
There was also a succession of quick-response empirical studies carried out at this time. Many
of these were published in a supplement issue of Agricultural Economics in late 2008. In this
issue, a study by Ivanic and Martin (2008), based on surveys in 10 countries, predicted a
global rise of poverty of around 3 percentage points. This estimate was higher in urban areas
than rural areas, though the impact was marginally lower (around 2.7%) when estimated wage
responses were taken into account.
The same journal issue included many country studies, which almost all recognized the net
consumer/net producer distinction. For instance, in Thailand a general equilibrium analysis

8
suggested that the negative effect on consumers dominated the positive impact on net
suppliers (Warr 2008); in Mozambique the impact of the fuel price increase dominated any
food price impact (Arndt et al. 2008); in Hunan province in China no adverse nutritional
effect was found because of substitution to cheaper food sources (Jensen and Miller 2008);
and in Uganda the impact of food price increases was limited because of the extent of
dependence on consumption from own production (Benson et al., 2008).
While the World Bank study of Ivanic and Martin expressed concerns about large poverty
impacts (and similar judgements were raised at the time on the World Bank website), the
empirical studies show a diversity of experience, mostly identifying adverse effects. Some of
this analysis though did not have adequately capture government response and general
economy-wide equilibrium effects.
A general equilibrium study for Vietnam (Coxhead et al. 2008) showed limited transmission
of the price increase, but also highlighted the importance of the labour market as a moderating
influence. In a later study for Vietnam, Vu and Glewwe (2011), applying Deaton’s (1989)
approach, find a net positive welfare effect of the food price increase; the average decrease in
welfare for those made worse off is more than offset by the average increase in welfare for
those that gain. In addition, Abbott et al. (2012) show wide sectoral variation and imperfect
price transmission from world prices to domestic markets from 1999 to 2008. Thurlow et al.
(2011) develop a dynamic computable general equilibrium to decompose impacts of the
global commodity and financial crisis. These results indicate that the 2008 commodity price
increased employment and reduced poverty by favouring labour intensive exports, especially
agriculture.

9
Government measures taken in a number of countries to reduce the transmission of the price
spike to domestic markets included export restrictions, removal of import tariffs, releasing
buffer stocks, introducing subsidies, fiscal policy and expanding safety nets. Some countries
pursued these policies more actively and more effectively than others. Elleby and Hansen
(forthcoming) find that Vietnam was the only one of eight Asian rice producing countries that
managed to effectively limit the extent to which world food price instability was transmitted
to the domestic price.
This points to the challenging question of why some countries are able to define and
implement these policies more effectively than others. A recent important contribution in this
regard is the joint Gates/UNU-WIDER/Cornell University political analysis, Food Price
Policy in an Era of Market Instability, spearheaded by Per Pinstrup Andersen. This included
14 country case studies,ii with conclusions drawn based on a synthesis of these.
3 Data
In this paper we rely on aggregate time series on rice prices available from a variety of
international sources, but predominantly on two key sets of household surveys: the VHLSS
national household survey, and a specialist in-depth survey of rural Vietnam, referred to as
VARHS, which also provides the key source of contextual information for much of the
discussion in the next section. From the VHLSS, we use data on consumption and production
of rice as a basis to identify net consumers and net producers; we also use this to compute
average purchase and sale prices at the household level.

10
The VARHS survey was conducted in the rural areas of 12 provinces, by the University of
Copenhagen in conjunction with the Central Institute for Economic Management (CIEM), the
Institute for Labour Science and Social Affairs (ILSSA) and Central for Agricultural Policy
Consulting of the Institute for Policy and Strategy for Rural Development (CAP/IPSARD).
The 12 provinces were selected to facilitate the use of the survey as an evaluation tool for
Danida supported development programmes in Vietnam. Seven of the 12 provinces are
covered by the Danida business sector support programme (BSPS), and five are covered by
the agricultural and rural development (ARD) programme. The provinces supported by the
agricultural support programme are located in the North West and Central Highlands, so these
relatively poor and sparsely populated regions are over-sampled. Our sample is statistically
representative at the provincial though not at the national level.
VARHS was conducted as a panel survey in 2006, 2008, 2010, and 2012, with 2,080
households included in all four waves; and larger numbers of households are available for
shorter periods. The survey collected detailed plot-level information on land transactions,
property rights, mode and time of acquisition, and other plot characteristics. It also provides
detailed information at the household level on agricultural inputs, outputs and investment, in
addition to general information about individuals and households (CIEM 2007, 2009, 2011,
2013).
4 Context
Levels of rice production and productivity in Vietnam were very low and declining in the
early years of the newly unified country in 1975, especially in the north (Pingali and Xuan
1992). In this period rice was still cultivated on a collective basis, but in 1981 Vietnam moved

11
to an individual contract system of production requiring a fixed amount of rice be sold to the
state at a fixed price while allowing the farmer to sell any surplus, similar to the household
responsibility system established in China in 1979. In Vietnam its introduction resulted in
important increases in productivity over the following years (Pingali and Xuan, 1992).
Significant further reforms were introduced in a series of measures following from the
initiation of Doi Moi reform process in 1986, with land reforms playing a major role. The
reforms of 1987, implemented in 1988, provided households with increased tenure security in
relation to use rights for land; this was confirmed in a further reform in 1993 which initiated
the process of issuing farmers with land use certificates (or redbooks), giving them among
other things the right to buy and sell land (though subject to land ceilings).
The 1988 reforms decentralized input supplies; and privatized output markets such that
farmers were no longer required to supply the state, but could sell to private traders. In
addition the 1988 and 1993 reforms nominally gave farmers the ability to make decisions over
their cultivation and the use of their land. Yet in implementing the land policies, the
government was concerned about the impact on rice production and marketing, and so
revisions were made in 1998 and 2001 that made it clear that any change of use within rice
growing areas was only allowed within the existing physical planning framework of central
and local government (Vasavakul 2006; Markussen et al. 2011). The implication of this is that
farmers are obliged to grow rice on at least 35% of total agricultural land, and these
restrictions are particularly enforced in the Red River and Mekong Deltas, the main rice
growing areas. These restrictions are made clear in the redbooks, which specify for which
purposes land is to be used.

12
Markussen, Tarp and van den Broeck (2011) summarize the situation as follows:
‘Twenty four years after the introduction of the Doi Moi reform process ... households sell
their production output to private buyers, trade land and sell labor on the private market. At
the same time the state … retains a hugely important role in economic life. The state
intervenes actively in the land market, supplies many inputs in agricultural production,
strongly dominates formal markets for financial services, and plays a key role in a large
number of local organizational activities. More specifically, authorities intervene heavily in
farmers’ choice of crops, and while the land law gives households the right to sell, rent,
exchange, mortgage, and bequeath their land, many farmers do not have the right to decide
how to use their plots.’
The VARHS survey data they analyse show that half the plots in the survey face restrictions,
even if 74% have Land Use Certificate (LUC). It is also notable that in the 2008 data they use,
still farmers do not have land use certificates for 26% of their plots.
The 25 years since the implementation of the reforms in 1988 have seen many important
changes in rural Vietnam, but the importance of rice still remains in 2013. In 1988 agriculture
was the dominant activity, with rice being crucially important. Data for 1993 shows that
nearly two thirds of income came from agriculture (Niimi et al. 2003). In 2000, nearly 10% of
Vietnamese value added came from rice (Tarp et al. 2002).
It is certainly the case that livelihoods are now much more diversified in rural Vietnam, with

13
large numbers of households engaged in non-farm activities; at the same time the large
majority of households still farm and most of them grow rice.
Analysis of the VARHS survey data provides important insights in relation to land, rice
cultivation and marketing. As a direct result of the egalitarian land allocation process in the
1980s and 1990s, land fragmentation is widespread in Vietnam, especially in the northern
plains area. The mean farm size is less than a hectare, and households on average have around
5 plots, more in the north. Often these are at some distance from the home. Most plots
operated by households were allocated by the state, most households have never participated
in the land sales market and the share of households participating in the rental market is small,
even if the relative importance of markets is rising (Luu Duc Khai, Markussen, McCoy and
Tarp, 2013).
The data also confirm that most households cultivate rice, though just over half of them sold
in 2006. By 2008 and 2010 both the proportion of households selling and the share of their
output sold had increased (Cazzuffi et al., 2011). In most areas household sell to traders,
though some sell to individuals. Some households sell consistently, but many only sell from
time to time; those with larger land areas or more irrigated land are more likely to sell; poorer
households and those headed by ethnic minorities are less likely to sell.
The panel data collected by VARHS has been used to assess the dynamics of welfare in rural
Vietnam (McKay and Tarp, 2013). The results show significant progress on average in terms
of each of the welfare measures they consider (food consumption, income, and assets). At the
same time, they also show quite a lot of diversity with a significant minority of households

14
becoming worse off over this period. Ethnic minorities show significantly less progress than
the majority kinh population, and there are also important geographic variations with some
provinces showing very little progress. Households in which one or more younger person has
left also progress significantly better than those without such migrants. The extent to which
households are engaged in agriculture though is not significantly associated with welfare
progress; households with a high reliance on agriculture and those with a low reliance on
agriculture both number among those who advanced over the period and those who fell back.
5 Empirical evidence on the rice price changes and their distributional impact
In this section, to analyse the impact of the rice price increase. We start by looking at
aggregate price data to document the magnitude and timing of the shock, and then use the
VHLSS data to identify net producers and consumers. We also use this data to study trends in
consumer and producer prices at the regional and consumption quintile levels, and then use
VARHS to do a detailed analysis of production response and sales.
Patterns of price changes
As a backdrop to the analysis, the evolution of the world rice price since 2000 is presented in
Figure 1. This shows very clearly the very large price spike in 2008; but equally clearly the
underlying increasing trend since at least 2000. The average US dollar price of rice increased
by a factor of 2.13 between 2006 and 2008, with most of this increase happening between
2007 and 2008 when the world price almost doubled. It fell by about a quarter from 2008 to
2010, and then continued to increase at the underlying trend. The reasons for the 2008 food
price spike have been widely discussed; the focus here is on the impact of these price
variations in Vietnam, a country where almost everyone consumes rice and where around half
15
or the national population and around 80% of the rural population produce it.
[INSERT FIGURE 1 approximately here]
As the exchange rate of the Vietnamese Dong against the US dollar changed little over the
2006-08 period, this is more or less the impact on Vietnam as well. Figure 2 shows the
evolution of the domestic retail and producer prices of rice over the same period. The
producer price increased by a factor of 1.88 between 2006 and 2008, less than the world price
increase; but the retail price increased by a similar magnitude to the world price, by a factor of
2.09. In both cases the increases are more spread out in time than the world price increase.
Overall it would appear that consumers were confronted with the world price increases almost
in full over this period, whereas the price producers received increased a bit less.
[INSERT FIGURE 2 approximately here]
The VHLSS survey data can also be used to compute the evolution of the prices paid by
consumers. The price for ordinary rice was 4,990 Dong per kilogramme in 2006, increasing
by to 8,580 in 2008 (an increase of 72.1%) and 10,840 Dong in 2010 (increase of 26.3%) per
kilogramme of ordinary rice bought. These data are based on prices actually paid by
individual consumers and computed so as to be nationally representative; the survey data
suggest a smaller increase in consumer prices between 2006 and 2008 than the aggregate
price series, though a slightly larger one between 2008 and 2010.
Both VHLSS and VARHS enable estimates to be made of the prices received by farmers

16
selling rice. According to VHLSS the average producer price was 2,470 Dong per
kilogramme in 2006, 4,050 in 2008 (an increase of 63.8%) and 4,930 in 2010 (21.8%
increase); according to VARHS the figures are 2,600 in 2006, 4,200 in 2008, 5,530 in 2010
and 6,050 in 2012.
Although there are some small differences between VHLSS and VARHS in relation to the
magnitude of increase in producer prices, the survey data suggests smaller magnitudes of
increase in both consumer and producer prices than the aggregate price series do. This survey
data probably gives a more accurate measure of the prices paid by consumers or received by
farmers than the aggregate time series data. This said, the differences can also reflect quality
adjustments on the part of consumers or monopsony power on the part of traders not passing
on the full benefit of price increases to producers. It is clear that whichever source of data is
chosen, there were substantial increases in both the retail and producer price of rice in
Vietnam between 2006 and 2008; but the more credible survey data suggests that both
consumer and producer prices increased less than world prices.
The survey data can also be used to consider differences in prices paid or received between
different categories of households. The retail price paid consistently increases with the
consumption quintile, which might be considered as an indication of quality. There is not a
consistent pattern of geographic variation, although rice does tend to be slightly higher in the
Red River Delta region than elsewhere. Producer prices tend to be higher in each year in the
northern half of the country than in the south, but here there is no consistent pattern of
variation with consumption quintiles.

17
Producers, net producers and consumers of rice
A sharp increase in the price of rice will have an adverse effect on net consumers of rice and a
positive impact on net producers, other things being equal. The VHLSS surveys collect
information on both consumption and production of rice, both with a 12 month reference
period, and are therefore quite a good basis to identify net consumers and net producers.
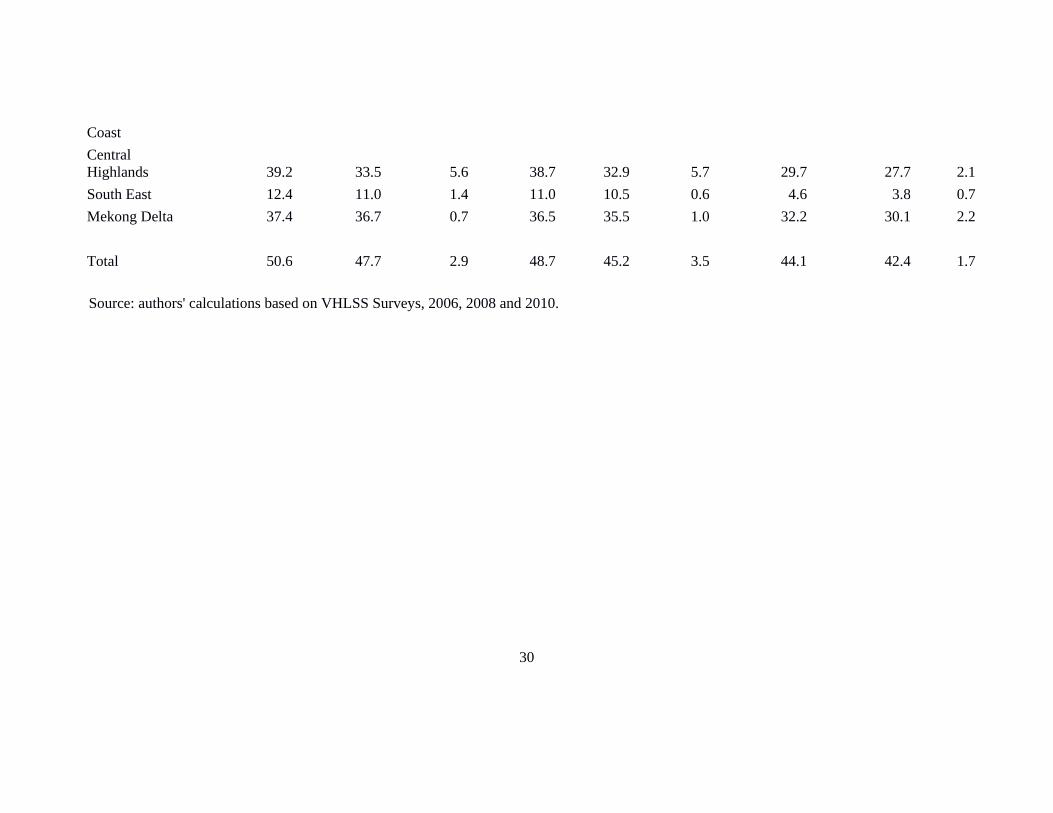
Table 1 shows the number of households producing rice in the three VHLSS survey years,
and among these the number who are net producers and net consumers, disaggregated by
consumption quintile and geographic region.
[INSERT TABLE 1 approximately here]
According to VHLSS, 51% of households in the entire country grew rice in 2006, falling
slightly to 49% in 2008 and 44% in 2010; it is clear though that in all of these years a
significant majority of rural households grow rice. In all years, the percentage of households
growing rice are much higher in the northern regions compared to the southern, and are
highest of all in the north east and north west. Closely related to this, the percentage of rice
growers decreases significantly with the quintile; even in 2010 almost 64% of those in the
lowest quintile grow rice.
More than 90% of these rice producers (more than 95% in 2010) produce in excess of their
consumption requirements. Small numbers of rice producing households are net consumers.
The proportion of households that are net consumers increases to a small extent between 2006
and 2008, when the rice price increased most, but even in 2008 only a small minority of rice
producers are net consumers. In other words most producing households should in principle

18
benefit if they sell and receive a higher producer price.
Net consumers are a minority among rice producers in all regions and all quintiles, but there
are significant variations. The incidence of net consumers is highest in the first quintile (net
consumers tend on average to be poorer, being much more highly represented in the bottom
quintile in all years) and in the north west. In 2008 nearly a third of rice producers in the north
west were net consumers and so are likely to have been adversely effected by the rice price
increase.
Non-producing consumers of rice clearly suffer from the rice price increase. On average this
group, a significant proportion of which is urban, are much better off than those that produce
rice; Table 2 compares the average per capita real total consumption of rice producers with
non-producers, and the rice producers contrasts net consumers with net producers. The mean
consumption of households producing rice is less than half that of non-producers, taking
account of all the differences in relative prices. In other words rice producers i.e. smallholders
are much poorer, reflecting urban/rural differences. This is not to say that there are not some
poor households among the non-producing group; 9.6% of these households were in the first
quintile in 2006 (and so 90.4% were not). These households are more likely to be in the North
Central Coastal region or the Central Highlands.
[INSERT TABLE 2 approximately here]
Among the rice producers, the average consumption of net consumers is significantly less
than that of net-producers, and this differential widens in 2008. Among these producers, net
19
consumers were poorer to start with in 2006; and were significantly harder hit by the rice
price increase. As already seen, and especially in 2008, many of these net consumers are in
the north west, where the proportion of ethnic minorities in the population is high. In other
words, the losers from the price shock would appear in particular to be poorer households in
this region. This potentially explains in part the results already discussed above from the
welfare dynamics analysis using VARHS.
In summary rice producers tend to be the poorer households in Vietnam. The very large
majority are producing in excess of their consumption requirements. These households
benefited from the rice price increases. Non-producing consumers certainly suffer; but the
vast majority of these households are non-poor. These are the main headline messages. But it
is important not to neglect other facts. Not many rice producers are net consumers but those
that are tend to be very poor; and some non-producing consumers are also very poor.
Accordingly, the impact of the rice price shock in 2008 no doubt lifted a significant numbers
of households above the poverty line, while at the same time pushing smaller numbers into
poverty or deeper poverty. We also note that the share of net consumers significantly reduced
between 2008 and 2010 and now turn to analysing the production response.
The production response
How then did farmers respond to the higher price? The VARHS survey collects detailed
information on household production, and constitutes a panel of 2,080 households covering
the period 2006 2008, 2010 and 2012. Table 3 provides summary information to assess the
changes in production behaviour over this period. 77% of these households grew rice in 2006;

20
the number declines marginally over the following six years (this finding is also confirmed by
VHLSS). This though is also a period over which the number of households required to grow
rice by restrictions imposed by the commune authorities generally reduced. The output of rice
increases consistently over this period, even taking into account the slightly smaller number
of households farming in later years. In other words production has certainly increased.
Particularly striking in 2008 is the sharp increase in the number of households selling rice
compared to 2006, no doubt incentivised by the higher rice price as well as a good harvest in
that year. The extent of selling falls off a bit in later years, and remains higher than 2006. In
terms of production technique, by 2010 significantly more farmers are now using improved
varieties of seeds, and this remains higher in 2012 than it was in 2008.
[INSERT TABLE 3 approximately here]
It seems clear that rice producing households have responded to the increased rice price by
producing more and selling more on average. This is not the case in all provinces, the
strongest and most consistent response being observed in the southern high production
province of Long An; elsewhere the patterns differ.
6 Conclusions
The spike in the international rice price in 2007-8 was indeed exceptional, with the price
doubling in a year. Looked at over the period from 2000 to date, it appears much more as a
large but temporary deviation around a long term upward trend. It was though a major issue
of policy concern at the time, both nationally and internationally, with UNICEF, the World
Bank and the World Food Programme all predicting dramatic adverse consequences.

21
Internationally calls were made for action to alleviate expected poverty and malnutrition
consequences, with little attention to providing an overall balanced assessment of the
situation.
As the world’s second rice exporter, Vietnam stood to benefit in aggregate from this, but
maybe surprisingly reduced its export quota and later imposed an export ban. These steps
were widely discussed and subjected to severe criticism at the time, both within and outside
Vietnam, arguing that this contributed to undermining the global rice market and deprived
producers of higher incomes as a result. Our somewhat different assessment is that the
Vietnamese Government took these steps as it was primarily concerned to ensure national
food security in these exceptional times. In particular, early 2008 crop predictions emerging
from the national planning system suggested a poor harvest, and food stocks were running
down.
In parallel government has throughout the past two decades sought to assure a steady increase
in producer prices rather than allowing prices to vary substantially in response to short term
market fluctuations. In addition, the government sought to alleviate price impacts by granting
exemptions from taxes on consumers (VAT) and producers (CIT). The combined effect of
these actions was to limit the increase of both the consumer price and producer price of rice,
while keeping their relative levels reasonably constant. While in fact producer prices did
actually increase slightly less than consumer prices over this period, several other
compensatory actions were subsequently taken to support producers, including exemption
from land taxes, increased extension support and increased credit.
22
The government also announced in late 2009 that it would implement a US$3.3bn stimulus
package for agriculture and rural development. The producer price continued to increase in
2009 and 2010, even though the world price fell in this period. In other words the government
smoothed out the increase in the price received by producers over this period, while keeping a
keen eye on food security and consumer prices. In addition, during the same period the prime
minster ordered business to buy paddy rice at a floor price which would ensure 30% profits
for farmers.
As the very large majority of rice producers in Vietnam produce in excess of their
consumption requirements, they benefitted from these policies, increased their production
levels and in time became more likely to adopt improved seeds. Non-producing households
do lose out, though they tend to be much better off on average. In addition there was a small
minority of producers who were net consumers, and who also lost out. These households were
disproportionately likely to live in the north west, to be poor and to be comprised of ethnic
minorities.
Overall this analysis suggests that the Vietnamese Government acted quite effectively in
extremely difficult circumstances, in line with the conclusions above of Elleby and Hansen
(forthcoming) suggesting that it acted more effectively than many other countries in
responding to extraordinary price fluctuations. Moreover our analysis shows that by and large
poorer households, being net producers, were the beneficiaries while the losers tended to be
relatively wealthy non-producing consumers.

23
References
Abbott, P. C. 2011. Export restrictions as stabilization responses to food crises. American
Journal of Agricultural Economics 94(2): 428-434.
Abbott, P., F. Tarp, and C. Wu. 2012. Transmission of world prices to the domestic market in
Vietnam. Mimeo.
Addison, T., C. Arndt, and F. Tarp. 2011. The triple crisis and the global aid architecture.
African Development Review 23(4): 461-478.
Admassie, A. 2013. The political economy of food price: The case of Ethiopia. WIDER
Working Paper 2013/001. Helsinki: UNU-WIDER.
Arndt, C., R. Benfia, N. Maxiliano, A. M. D. Nucifero, and J. T. Thurlow. 2008. Higher fuel
and food prices: impacts and responses for Mozambique. Agricultural Economics 39:
497-511.
Babu, S. C. 2013. Policy process and food price crisis: A framework for analysis and lessons
from country studies. WIDER Working Paper 2013/070. Helsinki: UNU-WIDER.
Baltzer, K. 2013. International to domestic price transmission in fourteen developing
countries during the 2007-08 food crisis. WIDER Working Paper 2013/031. Helsinki:
UNU-WIDER.
Barrett, C. B. and P. A. Dorosh. 1996. Farmers’ welfare and changing food prices: non-
parametric evidence from rice in Madagascar. American Journal of Agricultural
Economics 78(3), 656-669.
Benson, T., S. Mugarura, and K. Wanda. 2008. Impacts in Uganda of rising food prices: the
role of diversified staples and limited price transmission. Agricultural Economics 39:
513-524.
Bryan, S. 2013. A cacophony of policy responses: Evidence from fourteen countries during

24
the 2007/08 food price crisis. WIDER Working Paper 2013/029. Helsinki: UNU-
WIDER.
Cazzuffi, C., A. McKay, Luu Duc Khai, Nguyen The Long and Thuy Do Minh. 2011.
Constraints to market participation in agriculture in Vietnam. CIEM Working Paper
Hanoi.
Chapoto, A. 2013. The Political Economy of Food Price Policy: The Case of Zambia. WIDER
Working Paper 2012/100. Helsinki: UNU-WIDER.
Chirwa, E., and B. Chinsinga. 2013. Dealing with the 2007/08 global food price crisis: The
political economy of food price policy in Malawi. WIDER Working Paper 2013/030.
Helsinki: UNU-WIDER.
CIEM. 2007. Vietnam access to resources household survey characteristics of the Vietnamese
rural economy: 2006 Survey.
CIEM. 2009. Vietnam access to resources household survey characteristics of the Vietnamese
rural economy: 2008 Survey.
CIEM. 2011. Vietnam access to resources household survey characteristics of the Vietnamese
rural economy: 2010 Survey.
CIEM. 2013. Vietnam access to resources household survey characteristics of the Vietnamese
rural economy: 2012 Survey.
Coxhead, I., Vu Hoang Linh, and Le Dong Tam. 2008. Global market shocks and poverty in
Vietnam: The case of rice. Agricultural Economics 39: 575-592.
Deaton, A. 1989. Rice prices and income distribution in Thailand: A non-parametric analysis.
Economic Journal 99, 1-37.
Elleby, C. and H. Hansen. 2013. Domestic food prices in Asia and the rice crisis. Food Policy,
forthcoming.

25
Friedmann, J., and N. Schady. 2009. How many more infants are likely to die in Africa as a
result of the global financial crisis? World Bank Policy Research Working Paper 5023,
World Bank, Washington, DC.
Ganguly, K., and A. Gulati. 2013. The political economy of food price policy: The case study
of India. WIDER Working Paper 2013/034. Helsinki: UNU-WIDER.
Ghoneim, A. F. 2013. The Political Economy of Food Price Policy in Egypt. WIDER
Working Paper 2012/096. Helsinki: UNU-WIDER.
Hai, N. M., and T. Talbot. 2013. The political economy of food price policy: the case of rice
in Vietnam, WIDER Working Paper 2013/035, UNU-WIDER, Helsinki.
Hai, N. M., and T. Talbot. 2013. The political economy of food price policy: The case of rice
prices in Vietnam. WIDER Working Paper 2013/035. Helsinki: UNU-WIDER.
Huang, J., J. Yang, and S. Rozelle. 2013. The political economy of food pricing policy in
China. WIDER Working Paper 2013/038. Helsinki: UNU-WIDER.
Ivanic, M., and W. Martin. 2008. Implications of higher global food prices for poverty in low
income countries. Agricultural Economics 39: 405-416.
Jensen, H. T., S. Robinson, and F. Tarp. 2010. General equilibrium measures of agricultural
bias in fifteen developing countries. American Journal of Agricultural Economics
92(4): 1136-1148.
Jensen, R. T., and N. H. Miller. 2008. The impact of food price increases on caloric intake in
China. Agricultural Economics 39: 465-476.
Kirsten, J. F. 2012. The Political Economy of Food Price Policy in South Africa. WIDER
Working Paper 2012/102. Helsinki: UNU-WIDER.
Luu Duc Khai, T. Markussen, S. McCoy, and F. Tarp. 2013. Access to land: Market and non-
market land transactions in rural Vietnam. In S. Holden, K. Otsuka, and K. Deininger

26
(eds), Land Tenure Reforms in Asia and Africa: Assessing Impacts on Poverty and
Natural Resource Management. Palgrave Macmillan.
Markussen, T., K. van den Broeck, and F. Tarp. 2011. The forgotten property rights: Evidence
on land use rights in Vietnam’. World Development 39(5): 839-850.
Martin, W., and K. Anderson. 2011. Export restrictions and price insulation during
commodity price booms. American Journal of Agricultural Economics 94(2): 422-
427.
McKay, A., and F. Tarp. 2013. Diversity among rapid transformation: welfare dynamics in
rural Vietnam, 2006 to 2012.
Mueller, B., and C. Mueller. 2012. The Impact of the 2007–08 Food Price Crisis in a Major
Commodity Exporter. WIDER Working Paper 2012/095. Helsinki: UNU-WIDER.
Nhate, V., C. Massingarela, and V. Salvucci. 2013. The political economy of food price
policy: Country case study of Mozambique. WIDER Working Paper 2013/037.
Helsinki: UNU-WIDER.
Niimi, Y., P. Vasaduva-Dutta, and L. A. Winters. 2003. Trade liberalisation and poverty in
Vietnam. PRUS Working Paper No. 17, University of Sussex.
Nzuma, J. M. 2013. The political economy of food price policy: The case of Kenya. WIDER
Working Paper 2013/026. Helsinki: UNU-WIDER.
Olomola, A. S. 2013. The political economy of food price policy in Nigeria. WIDER
Working Paper 2013/016. Helsinki: UNU-WIDER.
Pingali, P., and V. T. Xuan. 1992. Vietnam: Decollectivization and rice productivity growth.
Economic Development and Cultural Change 40(4): 697-718.
Raihan, S. 2013. The political economy of food price policy: The case of Bangladesh.
WIDER Working Paper 2013/002. Helsinki: UNU-WIDER.

27
Rausser, G. C., and H. de Gorter. 2013. US policy contributions to agricultural commodity
price fluctuations, 2006–12. WIDER Working Paper 2013/033. Helsinki: UNU-
WIDER.
Ravallion, M. 1990. Rural welfare effects of food price changes under induced wage
responses: Theory and evidence for Bangladesh, Oxford Economic Papers 42, 574-
585.
Resnick, D. 2013. Personalistic policy-making in a vibrant democracy: Senegal’s fragmented
response to the 2007/08 food price crisis. WIDER Working Paper 2013/015. Helsinki:
UNU-WIDER.
Swinnen, J., L. Knops, and K. van Herck. 2013. Food price volatility and EU policies.
WIDER Working Paper 2013/032. Helsinki: UNU-WIDER.
Tarp, F., D. Roland-Holst, and J. Rand. 2002. Trade and income growth in Vietnam: Estimates
from a new social accounting matrix’. Economic Systems Research 14(2): 157-184.
Thurlow, J., F. Tarp, S. McCoy, N. M. Hai, C. Breisinger, and C. Arndt. 2011. The impact of
the global commodity and financial crises on poverty in Vietnam. Journal of
Globalization and Development 2(1).
Vasavakul, T. 2006. Agricultural land management under Doi Moi: Policy makers’ views.
Chapter 11 in S. P. Marsh, G. MacAuley, and P. V. Hung (eds). Agricultural
Development and Land Policy in Vietnam. Australian Centre for International
Agricultural Research, Sydney.
Vu, L., and P. Glewwe. 2011. Impacts of rising food prices on poverty and welfare in
Vietnam. Journal of Agriculture and Resource Economics, 36(1): 14-27.
Warr, P. (2008). World food prices and poverty incidence in a food exporting country: A
multihousehold general equilibrium analysis for Thailand. Agricultural Economics 39:

28
525-537.
Watson II, D. D. 2013. Political economy synthesis: The food policy crisis. WIDER Working
Paper 2013/050. Helsinki: UNU-WIDER.
Winters, L. A., N. McCulloch, and A. McKay. 2004. Trade liberalization and poverty: The
evidence so far. Journal of Economic Literature 42(1): 72-115.
i We are grateful to Chiara Cazzuffi for her help in identifying key articles for this literature review. ii Chapoto (2012); Ghoneim (2012); Kirsten (2012); Mueller and Mueller (2012); Admassie (2013); Babu (2013); Baltzer (2013); Bryan (2013); Chirwa and Chinsinga (2013); Ganguly and Gulati (2013); Hai and Talbot (2013); Huang et al. (2013); Nhate et al. (2013); Nzuma (2013); Olomola (2013); Raihan (2013); Rausser and de Gorter (2013); Resnick (2013); Swinnen et al. (2013); Watson II (2013).

29
Tables and Figures
Tables
Table 1: Shares of net producers and net consumers of rice in Vietnam
2006 2008 2010
% producing rice
of which: % producing
rice of which: % producing
rice of which:
net producers net consumersnet
producers net
consumers net producers net
consumersby quintile: Lowest 75.6 68.5 7.1 73.0 62.9 10.1 63.6 60.2 3.42nd 70.3 66.5 3.8 68.0 63.4 4.6 55.8 53.5 2.33rd 61.4 59.0 2.4 55.6 53.0 2.5 48.6 46.9 1.74th 41.7 40.1 1.6 40.7 39.1 1.6 35.5 34.9 0.7Highest 13.9 13.4 0.5 16.1 15.8 0.3 17.0 16.6 0.4 by region: Red River Delta 64.8 62.7 2.2 63.2 60.8 2.5 58.5 57.7 0.8North East 70.3 66.4 4.0 68.7 62.9 5.8 68.9 67.3 1.6North West 72.8 59.0 13.9 73.6 50.3 23.3 69.3 64.8 4.5North Central Coast 68.7 64.2 4.5 64.9 58.6 6.3 65.8 62.6 3.3
South Central 57.6 54.1 3.5 55.7 52.4 3.2 46.9 45.0 1.9
30
Coast Central Highlands 39.2 33.5 5.6 38.7 32.9 5.7 29.7 27.7 2.1South East 12.4 11.0 1.4 11.0 10.5 0.6 4.6 3.8 0.7Mekong Delta 37.4 36.7 0.7 36.5 35.5 1.0 32.2 30.1 2.2 Total 50.6 47.7 2.9 48.7 45.2 3.5 44.1 42.4 1.7 Source: authors' calculations based on VHLSS Surveys, 2006, 2008 and 2010.

31
Table 2: Average total real per capita consumption 2006 2008 2010 Mean median mean median mean median net producers 4487.4 4011.7 6316.4 5451.5 11647.1 10126.8net consumers 3730.9 3162.7 4654.2 4159.7 8474.6 7271.6nonproducers 8805.7 6919.7 11382.8 8944.7 21303.1 16482.2 Note: 2010 data in 2010 prices; others are in 2006 prices; in thousands of Vietnamese Dong. Source: authors' calculations based on VHLSS Surveys, 2006, 2008 and 2010. Table 3: Production characteristics for VARHS sample households
% growing
rice average output % selling
% using improved
seeds
% subject to crop
restrictions
average sales price (1000 VND/kg)
2006 76.9 2308 38.4 38.2 57.5 2.60 2008 73.5 2349 56.1 35.2 39.4 4.20 2010 70.9 2416 40.2 55.8 26.0 5.53 2012 68.8 2760 40.1 47.7 35.4 6.05
Source: authors' calculations based on VARHS Surveys 2006, 2008, 2010 and 2012.

32
Figure 1
Source: World Bank, Commodity Markets Outlook, July 2013, Data Supplement. Figure 2
Source: Retail: IRRI, World Rice Statistics online: Producer: FAOSTAT.