vietnam by numbers 03 2020 - vinacapital.com...march 2020 –page 1 march 2020 vietnam by numbers...
TRANSCRIPT

March 2020 – Page 1
March 2020 Vietnam by Numbers
• We introduce Vietnam by Numbers, which looks at the key economic and sector data pertinent to Vietnam primarily through charts.
• The same set of charts and tables will be monitored and presented each month. Any commentary will be limited to the key changes that transpired and will be given the ‘less is best’ treatment, essentially letting the figures do the talking.
• The charts and tables are broadly arranged along the categories of global/regional, domestic, and sector related. The publication gives readers a quick snapshot of key macro, market, or sector data and is used for internal or external presentations or needs.
GLOBAL MACRO INDICATORS
Fig 1. Global GDP forecasts (%) Fig 2. OECD Leading Indicator
Source: CEIC, VinaCapital Source: Bloomberg, VinaCapital
As of Mar 2020
Fig 3. OECD Business & Consumer Confidence Indicator Fig 4. VIX, S&P 500
Source: Bloomberg, VinaCapital
As of Mar 2020 Source: Bloomberg, VinaCapital
As of 31/3/2020
Fig 5. Brent Oil Price vs. Bbg Industrial Metals Index Fig 6. 10 Year Gov’t bond yields (US, EU, JP) vs FED Fund Rate
Source: Bloomberg, VinaCapital
As of 31/3/2020 Source: Bloomberg, VinaCapital
As of 31/3/2020
2.9 2.9
5.64.9
2.3
6.1
01234567
2019E
2021E
2019E
2021E
2019
2021E
2019
2021E
2019
2021E
2019
2021E
World EU EmergingAsia
ASEAN-5 US China94
96
98
100
102
104
94
96
98
100
102
104
Consumer Confidence Business Confidence
500
1500
2500
3500
4500
0
20
40
60
80
100
2008
2009
2010
2011
2012
2013
2014
2015
2016
2017
2018
2019
2020
VIX Index (LHS) S&P 500
92.1
24.90.0
50.0
100.0
150.0
200.0
250.0
2010 2011 2012 2013 2014 2015 2016 2017 2018 2019 2020
Bbg Industrial Metals Index Brent oil price USD/barrel
-2
-1
0
1
2
3
4
2014 2015 2016 2017 2018 2019 2020
10Y US Gov't Yield 10Y Japan Gov't Yield10Y EU Gov't Yield FED Fund rate

March 2020 – Page 2
March 2020 Vietnam by Numbers
Fig 7. Global Manufaturing PMI, IP & Trade Growth
Fig 8. ASEAN 4 – Sovereign CDS spreads
Source: Bloomberg, VinaCapital
As of 31/3/2020 Source: Bloomberg, VinaCapital
As of Mar 2020
40
45
50
55
-5
0
5
10
Dec-16 Jun-17 Dec-17 Jun-18 Dec-18 Jun-19 Dec-19
CPB Trade Vol index YoY CPB World IP YoYJPM global mfg PM SA (RHS)
0
50
100
150
200
250
300
350
2015 2016 2017 2018 2019 2020
PH TH ID VN

March 2020 – Page 3
March 2020 Vietnam by Numbers
VIETNAM MACRO INDICATORS
Fig 9. Vietnam – Annual GDP YoY Growth (%) Fig 10. Vietnam – Quarterly GDP YoY Growth (%)
Annual growth forecast: 2020 VNC: is forecast by VinaCapital
Source: MPI, CEIC, VinaCapital Quarterly growth forecast 2020: is forecast by MPI
Source: CEIC, VinaCapital
Fig 11. Vietnam - GDP per Capita (USD) Fig 12. ASEAN – Real GDP YoY Growth (%)
Source: GSO, VinaCapital Source: CEIC, VinaCapital
Fig 13. Vietnam – Real GDP by Industry GDP
Source: CEIC, VinaCapital Fig 14: ASEAN – Real GDP
Source: CEIC, VinaCapital
7.0
6.0
4.0
012345678
2010 2011 2012 2013 2014 2015 2016 2017 2018 2019 2020MPI
2020VNC
6.97
4.55.1
6.7 6.8
0123456789
Q1 Q2 Q3 Q4 Q1 Q2 Q3 Q4 Q1 Q2 Q3 Q4 Q1 Q2 Q3 Q4 Q1 Q2 Q3 Q4
2016 2017 2018 2019 2020E
18982043 2089 2192
23832528
2705
0
500
1000
1500
2000
2500
3000
2013 2014 2015 2016 2017 2018 2019
7.0
5.04.3
5.9
0.7
2.4
012345678
2017
2018
2019
2017
2018
2019
2017
2018
2019
2017
2018
2019
2017
2018
2019
2017
2018
2019
Vietnam Indonesia Malaysia Philippines Singapore Thailand
2012 2013 2014 2015 2016 2017 2018 Jun-19 Sep-19 Dec-19 Mar-20GDP, YoY Growth 5.5 5.6 6.4 7.0 6.7 6.9 7.1 6.7 7.5 7.0 3.8Agri., Forestry and Fishery 2.9 2.6 3.4 2.4 1.4 2.9 3.8 2.0 2.0 1.6 0.1Industry and Construction 7.4 5.1 6.4 9.6 7.6 8.0 8.9 9.1 10.2 7.9 5.2Services 6.7 6.7 6.2 6.3 7.0 7.4 7.0 6.9 7.3 8.1 3.3Net indirect taxes -1.6 6.4 7.9 5.5 6.4 6.3 6.1 6.7 6.6 6.4 4.9% share of GDPAgri., Forestry and Fishery 17.6 17.2 16.8 16.1 15.3 14.8 14.3 17.6 13.0 13.0 10.2Industry and Construction 33.2 33.1 33.2 34.2 34.6 35.0 35.6 35.2 36.0 37.0 36.8Services 37.9 38.4 38.4 38.3 38.6 38.8 38.8 36.1 39.8 39.2 40.4Net indirect taxes 11.3 11.4 11.6 11.5 11.5 11.4 11.3 11.1 11.1 10.9 12.5
VN ID MY PH SG TH VN ID MY PH SG THGDP, YoY Growth 7.1 5.2 4.7 6.2 3.4 4.6 7.0 5.0 4.3 5.9 0.7 4.5Private consumption 7.3 5.1 8.0 5.6 4.2 2.6 5.0 7.6 5.8 3.7 1.4Government consumption 6.3 4.8 3.3 13.0 2.9 3.8 3.2 2.0 10.5 2.8 2.2Gross Capital Formation 8.6 6.6 1.4 12.9 -3.4 - 4.4 -2.1 1.5 -0.2 -61.1Change in stocks 3.9 55.6 - 46.4 25.0 -32.5 -34.2 - - -25.6 18.4Net Exports: Goods & Services - 0.5 11.4 - 13.3 0.0 -38.5 8.9 - -0.7 0.0% share of GDPPrivate consumption 67.7 54.9 57.0 68.5 37.0 14.7 54.9 58.8 68.4 38.1 14.6Government consumption 6.4 8.0 12.5 11.1 10.1 23.9 7.9 12.2 11.6 10.3 23.9Gross Capital Formation 31.4 33.4 24.6 30.5 25.0 2.4 33.3 23.1 29.2 24.8 0.9Change in stocks 3.0 1.9 -1.1 0.3 2.1 5.9 1.2 -1.4 -0.3 1.6 6.9Net Exports: Goods & Services -6.7 0.9 7.0 -10.4 27.2 0.0 2.2 7.3 -9.4 26.8 0.0
2018 2019

March 2020 – Page 4
March 2020 Vietnam by Numbers
Fig 15 Vietnam – CPI, PPI (YoY, %) Fig 16. Vietnam – CPI (%)
As of March 2020 Source: CEIC, VinaCapital As of March 2020 Source: CEIC, VinaCapital
Fig 17. Vietnam – CPI Key Categories (%) Fig 18. ASEAN – CPI (YoY, %)
As of March 2020 Source: CEIC, VinaCapital As of Feb 2020, VN: As of March 2020 Source: CEIC, VinaCapital
Fig 19. Vietnam – CPI Breakdown (%)
Source: CEIC, VinaCapital
Fig 20. Vietnam – PMI Fig 21. Vietnam vs. Asia PMI
As of Mar 2020 Source: IHS Markit, VinaCapital As of Mar 2020 Source: IHS Markit, VinaCapital
4.9
3.0
1.1
-2
0
2
4
6
Mar
-16
Jun-
16
Sep-
16
Dec-
16
Mar
-17
Jun-
17
Sep-
17
Dec-
17
Mar
-18
Jun-
18
Sep-
18
Dec-
18
Mar
-19
Jun-
19
Sep-
19
Dec-
19
Mar
-20
CPI (YoY) Core CPI PPI
4.9
-0.7-1.0
-0.5
0.0
0.5
1.0
1.5
2.0
0
1
2
3
4
5
6
7
2016 2017 2018 2019 2020
YoY MoM (RHS)
-1
1
3
5
7
Food Housing HealthTranspo Others CPI
0.3
1.3
2.6
0.7
3.0
4.9
-2
0
2
4
6
8
2016 2017 2018 2019 2020
SG ID MY PH TH VN
2016 2017 2018 Oct-19 Nov-19 Dec-19 Jan-20 Feb-20 Mar-20CPI, yoy Growth 4.7 2.6 3.0 2.2 3.5 5.2 6.4 5.4 4.9Core inflation yoy Growth 1.9 1.3 1.7 2.0 2.2 2.8 3.3 2.9 3.0Foods and Foodstuffs 2.9 -1.8 5.1 2.7 5.6 9.2 10.9 9.3 10.4Housing & Const'n Materials 3.3 4.7 1.1 2.9 3.7 5.1 6.3 5.5 4.5Health and Personal Care 55.7 27.8 3.7 8.8 8.9 3.0 3.1 3.3 3.3Transportation -1.1 6.0 0.2 -3.2 -2.1 3.5 7.5 4.6 -2.6% contribution for yoy growthFoods and Foodstuffs 19.7 -23.3 61.2 42.3 57.0 62.7 60.8 61.7 75.8Housing & Const'n Materials 9.7 26.4 6.0 20.4 16.5 15.2 15.2 15.9 14.1Health and Personal Care 53.4 50.3 6.1 19.7 12.6 2.9 2.4 3.0 3.3Transportation -2.0 20.3 0.7 -13.2 -5.6 6.2 10.8 8.0 -4.9Others 19.2 26.3 26.1 30.8 19.5 13.0 10.7 11.4 11.7
41.940
45
50
55
2012 2013 2014 2015 2016 2017 2018 2019 2020
41.9
48.3
40
45
50
55
60
Mar-17
Jun-17
Sep-17
Dec-17
Mar-18
Jun-18
Sep-18
Dec-18
Mar-19
Jun-19
Sep-19
Dec-19
Mar-20
Asia Vietnam

March 2020 – Page 5
March 2020 Vietnam by Numbers
Fig 22. Currency (%, vs USD) Fig 23. DXY Index & VND/USD Exchange Rate
As of 31/3/2020 Source: Bloomberg, VinaCapital
As of 31/3/2020 Source: Bloomberg, VinaCapital
Fig 24. VND Trading Bands Fig 25. Vietnam – Bond Yields (%)
Source: Bloomberg, Fiinpro, VinaCapital
As of 31/3/2020 Source: Bloomberg, VinaCapital
As of 31/3/2020
Fig 26. Vietnam – Government bond issuing rate Fig 27. Vietnam - Total value of OMO and T-bill issued
Source: HNX, VinaCapital Source: HNX, Bloomberg, VinaCapital
Fig 28. Vietnam – Top Exports Markets in 2019 Fig 29. Vietnam – Top Exports Products in 2019
Source: Customs, VinaCapital Source: Customs, VinaCapital
-2.1
0.1
-1.9
-5.8
4.2
-14.7
-1.7
1.1
-5.2-4.5
3.3
-0.3-2.0
1.4
-5.6
0.8
8.6
-9.1
4.4
0.22.8
-20
-15
-10
-5
0
5
10
2018
2019
2020
YTD
2018
2019
2020
YTD
2018
2019
2020
YTD
2018
2019
2020
YTD
2018
2019
2020
YTD
2018
2019
2020
YTD
2018
2019
2020
YTD
VN ID MY PH SG TH DXY
72
77
82
87
92
97
102
107
20000
21000
22000
23000
24000
2011 2012 2013 2014 2015 2016 2017 2018 2019 2020
VND/USD DXY Currency (RHS)
19500
20500
21500
22500
23500
24500
2013 2014 2015 2016 2017 2018 2019 2020
Interbank rate Lower bandUpper Band Unofficial Market
1
2
3
4
5
6
1Y 2Y 3Y 5Y 10Y 15Y
23%
16%
16%9%
8%
7%
20%US
China
EU
ASEAN
Japan
South Korea
Others
20%
14%
12%
7%7%
4%
3%3%
2%
28%
Mobile &spare partsPCs & electronic itemsTextiles & garmentsFootwearMachinery & equipmentWood & wooden productsTransportation vehiclesFisheryIron & steelOthers

March 2020 – Page 6
March 2020 Vietnam by Numbers
Fig 30. Vietnam – Overview of Imports/Exports
Source: Customs, Mar-GSO, VinaCapital
Fig 31. Vietnam - Investment YoY Growth by Sector (%) Fig 32. Vietnam – Investment Weight By Sector (%)
Source: MOF, CEIC, VinaCapital Source: MOF, CEIC, VinaCapital
Fig 33. Vietnam – Registered & Disbursed FDI, Cumulative YTD (USDbn) Fig 34. Vietnam – Registered FDI Breakdown in 2019
Source: CEIC, VinaCapital Source: CEIC, VinaCapital
Fig 35. Vietnam – Direct Investment vs Portfolio Investment Fig 36. Vietnam – Current Account & Balance of Payments
Source: SBV, CEIC, VinaCapital Source: SBV, CEIC, VinaCapital
USD bn 2012 2013 2014 2015 2016 2017 2018 2019 YTD-Mar20Total Imports and Exports 228.3 264.1 298.1 327.6 351.4 428.1 480.6 517.3 115.3Total Exports 114.5 132.0 150.2 162.0 176.6 215.1 243.7 264.2 59.1
%yoy 18.2 15.3 13.8 7.9 9.0 21.8 13.3 8.4 0.5Total Imports 113.8 132.0 147.8 165.6 174.8 213.0 236.9 253.1 56.3
%yoy 6.6 16.0 12.0 12.0 5.6 21.9 11.2 6.8 -1.9Trade Surplus/ Deficit 0.7 0.0 2.4 -3.6 1.8 2.1 6.8 11.1 2.8 Domestic companies 53.8 57.6 63.6 68.3 72.4 85.2 94.9 108.4 23.1 FDI companies 59.9 74.4 84.2 97.2 102.4 127.8 141.9 144.6 33.2
2015 2016 2017 2018 2019
Total investment 11.9 8.9 12.3 11.2 10.2
State 6.8 7.3 6.9 3.9 2.6
Non-State 12.8 9.5 17.1 18.5 17.3
Foreign-Sector 19.9 10.4 12.8 9.6 8.1
Total investment/GDP 26.3 26.4 26.5 33.5 33.938.1 36.9 40.2 40.4 39.9 38.0 37.5 35.7 33.3 31.0
36.1 38.5 38.1 37.7 38.4 38.7 38.9 40.6 43.3 46.0
25.8 24.5 21.6 21.9 21.7 23.3 23.6 23.7 23.4 22.9
2010 2011 2012 2013 2014 2015 2016 2017 2018 2019
Investment State Investment Non-State FDI
12.5
-8.0
41.7
-13.9 -11.8
28.88.7
16.09.0
10.8
9.1 6.7
-6.6-20
0
20
40
60
80
100
120
(5) - 5
10 15 20 25 30 35
FDI Registered (exl. Purchased stocks) (USD bn)FDI Disbursement (USD bn)%yoy FDI Regis.(RHS)%yoy FDI Disb. (RHS)
65%10%
7%
3%2%
13%
ManufacturingReal Estate ActivitiesWhsle, Retail TradeElec., Gas, Air Con SupplyConstructionOthers
8.4 8.9 9.211.8 12.6
14.115.5
11.3
1.9 1.40.1
-0.1
0.02.1 3.0 3.0
-5
0
5
10
15
20
2012 2013 2014 2015 2016 2017 2018 2019
Direct Investment (USD bn) Porfolio Investment (USD bn)
3.0
5.3
-4
-2
0
2
4
6
2014 2015 2016 2017 2018 9M2019
Current Account/GDP (%) BOP/GDP (%)
March 2020 – Page 7
March 2020 Vietnam by Numbers
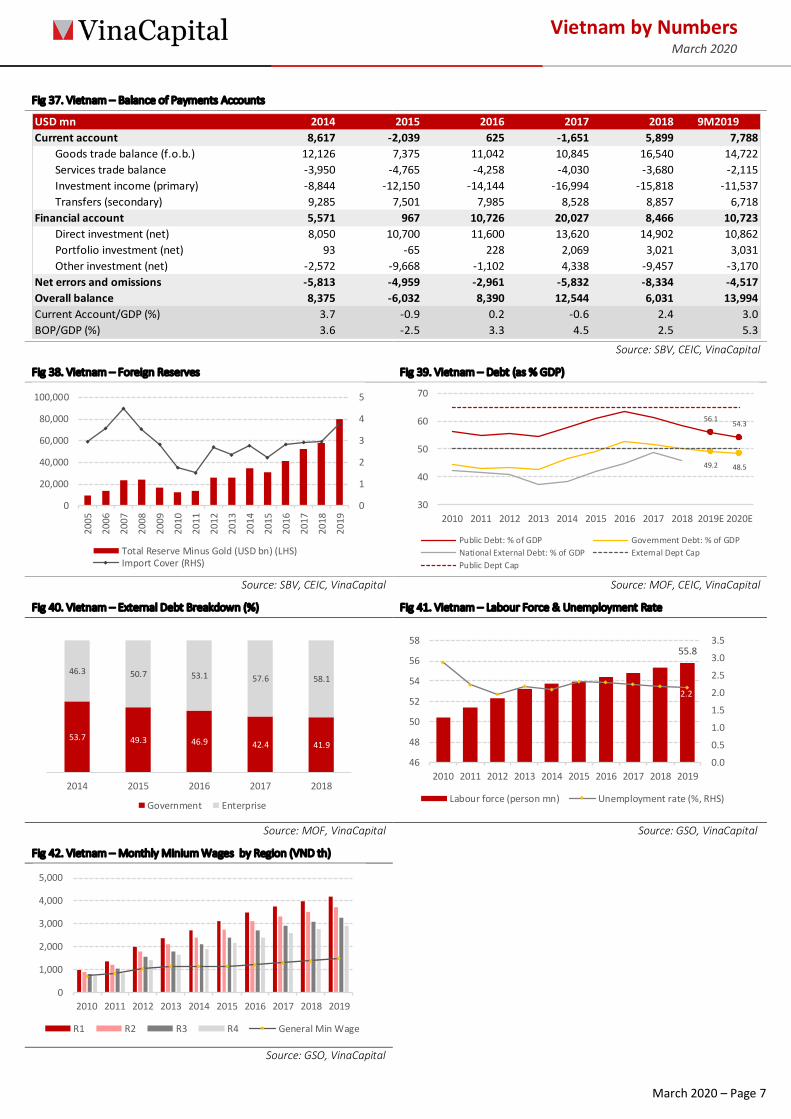
Fig 37. Vietnam – Balance of Payments Accounts
Source: SBV, CEIC, VinaCapital
Fig 38. Vietnam – Foreign Reserves Fig 39. Vietnam – Debt (as % GDP)
Source: SBV, CEIC, VinaCapital Source: MOF, CEIC, VinaCapital
Fig 40. Vietnam – External Debt Breakdown (%) Fig 41. Vietnam – Labour Force & Unemployment Rate
Source: MOF, VinaCapital Source: GSO, VinaCapital
Fig 42. Vietnam – Monthly Minium Wages by Region (VND th)
Source: GSO, VinaCapital
USD mn 2014 2015 2016 2017 2018 9M2019Current account 8,617 -2,039 625 -1,651 5,899 7,788
Goods trade balance (f.o.b.) 12,126 7,375 11,042 10,845 16,540 14,722Services trade balance -3,950 -4,765 -4,258 -4,030 -3,680 -2,115Investment income (primary) -8,844 -12,150 -14,144 -16,994 -15,818 -11,537Transfers (secondary) 9,285 7,501 7,985 8,528 8,857 6,718
Financial account 5,571 967 10,726 20,027 8,466 10,723Direct investment (net) 8,050 10,700 11,600 13,620 14,902 10,862Portfolio investment (net) 93 -65 228 2,069 3,021 3,031Other investment (net) -2,572 -9,668 -1,102 4,338 -9,457 -3,170
Net errors and omissions -5,813 -4,959 -2,961 -5,832 -8,334 -4,517Overall balance 8,375 -6,032 8,390 12,544 6,031 13,994Current Account/GDP (%) 3.7 -0.9 0.2 -0.6 2.4 3.0BOP/GDP (%) 3.6 -2.5 3.3 4.5 2.5 5.3
0
1
2
3
4
5
0
20,000
40,000
60,000
80,000
100,000
2005
2006
2007
2008
2009
2010
2011
2012
2013
2014
2015
2016
2017
2018
2019
Total Reserve Minus Gold (USD bn) (LHS)Import Cover (RHS)
56.1 54.3
49.2 48.5
30
40
50
60
70
2010 2011 2012 2013 2014 2015 2016 2017 2018 2019E 2020E
Public Debt: % of GDP Government Debt: % of GDPNational External Debt: % of GDP External Dept CapPublic Dept Cap
53.7 49.3 46.9 42.4 41.9
46.3 50.7 53.1 57.6 58.1
2014 2015 2016 2017 2018
Government Enterprise
55.8
2.2
0.0
0.5
1.0
1.5
2.0
2.5
3.0
3.5
46
48
50
52
54
56
58
2010 2011 2012 2013 2014 2015 2016 2017 2018 2019
Labour force (person mn) Unemployment rate (%, RHS)
0
1,000
2,000
3,000
4,000
5,000
2010 2011 2012 2013 2014 2015 2016 2017 2018 2019
R1 R2 R3 R4 General Min Wage

March 2020 – Page 8
March 2020 Vietnam by Numbers
VIETNAM BANKING SYSTEM
Fig 43. VND Deposit Rate by Term Fig 44. Vietnam – Loans as % of GDP
Source: Bloomberg, VinaCapital
As of 31/03/2020 Source: SBV, Bloomberg, VinaCapital
Fig 45. Vietnam – Breakdown Loans (%) Fig 46. Vietnam – NIM (%)
Source: Data of 11 banks under Vincapital coverage Source: Data of 11 banks under Vincapital coverage
Fig 47. Vietnam – Credit YoY Growth (%) Fig 48. Vietnam – Credit & Deposit YoY Growth (%)
Source: SBV, Bloomberg, VinaCapital Source: SBV, Bloomberg, VinaCapital
Fig 49. Vietnam – LDR (%) Fig 50. Vietnam – NPLs to Gross Loans
Source: Data of 11 banks under Vincapital coverage Source: Data of 11 banks under Vincapital coverage
0
1
2
3
4
5
6
ON 1W 1M 3M
95.2 97.0 100.8111.0
122.3130.0 130.3 135.6
0
30
60
90
120
150
2012 2013 2014 2015 2016 2017 2018 2019
25.9 30.5 34.2 37.0 40.5 45.5 47.5 49.5 51.5 18.8 14.8 12.3 9.9 8.1
7.5 7.0 6.5 6.0
52.3 51.6 50.2 49.6 48.3 43.8 42.3 40.8 39.3
2014 2015 2016 2017 2018 2019 2020E 2021E 2022E
Retail loans SOE loans FDI loans Corp loans
2.89
3.15 3.08
3.29 3.42
3.61 3.53 3.58 3.62
2.4
2.6
2.8
3.0
3.2
3.4
3.6
3.8
2014 2015 2016 2017 2018 2019 2020E 2021E 2022E
21.0
37.7
29.8
10.98.9
12.514.2
17.3 18.3 18.2
13.9 13.710.4 10.7 10.9
0510152025303540
12.5
14.2
17.318.3 18.2
13.9 13.7
23.0
19.4
14.3
17.7
14.1
12.813.9
10
12
14
16
18
20
22
24
2013 2014 2015 2016 2017 2018 2019
Deposit Growth Credit Growth
85.1
89.8 89.9
93.5 94.0 95.4 94.8 94.3 93.8
80
85
90
95
100
2014 2015 2016 2017 2018 2019 2020E 2021E 2022E
1.83 1.95 2.00
1.71 1.70
1.48
2.25 2.36
1.92
1.0
1.2
1.4
1.6
1.8
2.0
2.2
2.4
2.6
2014 2015 2016 2017 2018 2019 2020E 2021E 2022E

March 2020 – Page 9
March 2020 Vietnam by Numbers
Fig 51. Vietnam – CAR (%) Fig 52. Vietnam – Total Assets & Regulatory Capital YoY Growth (%)
Source: IMF, CEIC, VinaCapital Source: IMF, CEIC, VinaCapital
Fig 53. Vietnam – ROA (%) Fig 54. Vietnam – ROE (%)
Source: Data of 11 banks under Vincapital coverage Source: Data of 11 banks under Vincapital coverage
Fig 55. Vietnam – Fee to Total Income Fig 56. Vietnam – Reserve Cover
Source: Data of 11 banks under Vincapital coverage Source: Data of 11 banks under Vincapital coverage
10.310.9
9.4 9.49.9 9.5 9.5
10.6
14.0
12.612.1
12.711.8 11.5 11.2
10.6
6
8
10
12
14
16
2012 2013 2014 2015 2016 2017 2018 2019
State-Owned Banks JSC Banks
30.5
34.0
-5.8
27.5
2.8
20.4
10.4 12.4
12.0
40.4
18.9 5.413.9
10.3
15.7
16.4 18.6
10.9
-10
0
10
20
30
40
50
2010 2011 2012 2013 2014 2015 2016 2017 2018
Total Assets Growth Regulatory Capital Growth
1.04 1.01 1.00
1.20
1.36
1.56
1.40 1.39 1.45
0.6
0.8
1.0
1.2
1.4
1.6
1.8
2014 2015 2016 2017 2018 2019 2020E 2021E 2022E
11.4 11.8 12.8
16.2 17.3
18.6
15.5 14.4 14.4
8
10
12
14
16
18
20
2014 2015 2016 2017 2018 2019 2020E 2021E 2022E
9.1 9.5 9.4 9.9 11.3
12.4 12.5 13.7
15.4
02468
1012141618
2014 2015 2016 2017 2018 2019 2020E 2021E 2022E
82.4
69.1 66.5
73.9
83.2
89.9
59.4 58.8
69.0
40
50
60
70
80
90
100
2014 2015 2016 2017 2018 2019 2020E 2021E 2022E

March 2020 – Page 10
March 2020 Vietnam by Numbers
VIETNAM DOMESTIC CONSUMPTION
Fig 57. Retail Sales & GDP per Capita (USD) Fig 58. Vietnam - Retail Sales & Consumer Confidence (%)
Source: CEIC, VinaCapital Source: CEIC, VinaCapital
Fig 59. Vietnam – FMCG Growth (yoy) by Category in 4 cities Fig 60. Vietnam – FMCG Growth (yoy) by Category in Rural Areas
Source: Kantar Panel Source: Kantar Panel
Fig 61. ASEAN – Internet Penetration Fig 62. Vietnam – FMCG Sales by Retail Channel
Source: Internet World Stats Jan 2020 Source: Euromonitor International
Fig 63. ASEAN – % Share of E-Commerce to Total Retail Sales Fig 64. ASEAN –E-Commerce Value Growth (yoy)
Source: Euromonitor International Source: Euromonitor International
-
500
1,000
1,500
2,000
2,500
3,000
2013 2014 2015 2016 2017 2018 2019
Retail sales per capita (US$) GDP per capita (US$)
0
30
60
90
120
150
0
3
6
9
12
15
Jun-
16
Sep-
16
Dec-
16
Mar
-17
Jun-
17
Sep-
17
Dec-
17
Mar
-18
Jun-
18
Sep-
18
Dec-
18
Mar
-19
Jun-
19
Sep-
19
Dec-
19
Mar
-20
RS (inflation adj.) RS Consumer confidence (RHS)
2.3
-0.7
3.9
0.7
6.3 5.85.56.8
3.44.3
13.5
6.7
-3
0
3
6
9
12
15
FMCG Dairy Beverage Packagefoods
PersonalCares
Home Care
2018 MAT P9 2019
6.47.9 8.1
3.9
9
2.8
8.8
15.3
8.4
4.5
14.9
3.5
0
5
10
15
20
FMCG Dairy Beverage Packagefoods
PersonalCares
Home Care
2018 MAT P9 2019
68.5
171.3
26.4 22.2
79.0
5.257.0
70.462.6
81.4
40.8
72.188.4 81.7
Vietnam Indonesia Malaysia Myanmar Philippines Singapore Thailand
Internet Users (mn) Internet Penetration (%)
2017 2018 2017 2018 2019 2017 2018 2019 2017 2018 2019
Vietnam Malaysia Singapore Thailand
Convenience Stores Hypermarkets SupermarketsModern Grocery Retailers Traditional Grocery E-CommerceOthers
1.1 1.5 1.8 2.0 1.7 2.12.8
3.3
4.7 4.45.2
6.8
8.39.2
1.3 1.7 1.92.9
4.4
012345678910
2015
2016
2017
2018
2015
2016
2017
2018
2019
2015
2016
2017
2018
2019
2015
2016
2017
2018
2019
Vietnam Malaysia Singapore Thailand
47.8 48.3
32.925.0
62.6
24.9
36.5
25.4
48.7
14.117.9
31.423.8
10.5 12.0
30.2
21.1
53.060.6
010203040506070
2015
2016
2017
2018
2015
2016
2017
2018
2019
2015
2016
2017
2018
2019
2015
2016
2017
2018
2019
Vietnam Malaysia Singapore Thailand
March 2020 – Page 11
March 2020 Vietnam by Numbers
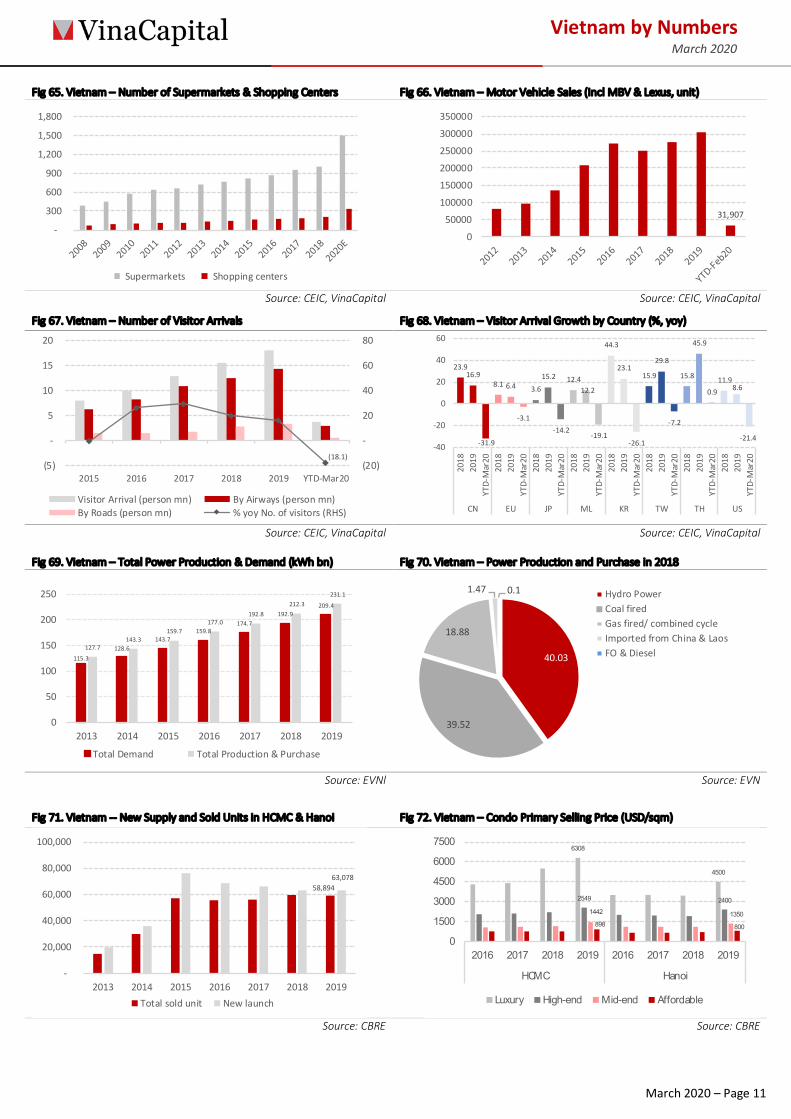
Fig 65. Vietnam – Number of Supermarkets & Shopping Centers Fig 66. Vietnam – Motor Vehicle Sales (Incl MBV & Lexus, unit)
Source: CEIC, VinaCapital Source: CEIC, VinaCapital
Fig 67. Vietnam – Number of Visitor Arrivals Fig 68. Vietnam – Visitor Arrival Growth by Country (%, yoy)
Source: CEIC, VinaCapital Source: CEIC, VinaCapital
Fig 69. Vietnam – Total Power Production & Demand (kWh bn)
Fig 70. Vietnam – Power Production and Purchase in 2018
Source: EVNl Source: EVN
Fig 71. Vietnam -- New Supply and Sold Units in HCMC & Hanoi Fig 72. Vietnam – Condo Primary Selling Price (USD/sqm)
Source: CBRE Source: CBRE
-
300
600
900
1,200
1,500
1,800
Supermarkets Shopping centers
31,907
0
50000
100000
150000
200000
250000
300000
350000
(18.1) (20)
-
20
40
60
80
(5)
-
5
10
15
20
2015 2016 2017 2018 2019 YTD-Mar20
Visitor Arrival (person mn) By Airways (person mn)By Roads (person mn) % yoy No. of visitors (RHS)
23.916.9
-31.9
8.1 6.4
-3.1
3.615.2
-14.2
12.412.2
-19.1
44.3
23.1
-26.1
15.9
29.8
-7.2
15.8
45.9
0.911.9
8.6
-21.4-40
-20
0
20
40
60
2018
2019
YTD-Mar20
2018
2019
YTD-Mar20
2018
2019
YTD-Mar20
2018
2019
YTD-Mar20
2018
2019
YTD-Mar20
2018
2019
YTD-Mar20
2018
2019
YTD-Mar20
2018
2019
YTD-Mar20
CN EU JP ML KR TW TH US
115.3128.6
143.7159.8
174.7192.9
209.4
127.7143.3
159.7177.0
192.8212.3
231.1
0
50
100
150
200
250
2013 2014 2015 2016 2017 2018 2019
Total Demand Total Production & Purchase
40.03
39.52
18.88
1.47 0.1 Hydro PowerCoal firedGas fired/ combined cycleImported from China & LaosFO & Diesel
58,894 63,078
-
20,000
40,000
60,000
80,000
100,000
2013 2014 2015 2016 2017 2018 2019Total sold unit New launch
6308
4500
2549 2400
1442 1350898 800
0
1500
3000
4500
6000
7500
2016 2017 2018 2019 2016 2017 2018 2019
HCMC Hanoi
Luxury High-end Mid-end Affordable

March 2020 – Page 12
March 2020 Vietnam by Numbers
VIETNAM CAPITAL MARKETS
Fig 73. MSCI Index vs. VNIndex (%) Fig 74. VN-Index & MSCI Global Index Performance
As of 31/3/2020 Source: Bloomberg, VinaCapital
As of 31/3/2020 Source: Bloomberg, VinaCapital
Fig 75. Stock Market Performance (%) Fig 76. PER (x)
As of 31/3/2020 Source: Bloomberg, VinaCapital
As of 31/3/2020 Source: Bloomberg, VinaCapital
Fig 77. Vietnam – Foreign Investors Transactions (VND bn) Fig 78. Average Daily Turnover (USD mn)
As of 31/3/2020 Source: Fiinpro, VinaCapital
As of 31/3/2020 Source: Bloomberg, VinaCapital
Fig 79. Vietnam – AUM of ETF
As of 31/3 2020 Source: Bloomberg, VinaCapital
-11.2
24.0
-21.7-10.4
25.2
-21.4-16.6
15.4
-23.9
-11.3
5.2
-31.0
-9.3
7.7
-31.1-40
-20
0
20
40
2018
2019
2020
YTD
2018
2019
2020
YTD
2018
2019
2020
YTD
2018
2019
2020
YTD
2018
2019
2020
YTD
Global DevelopedMkt.
EmergingMkt.
ASEAN VN-Index
5060708090
100110120130
Jan-18 Apr-18 Jul-18 Oct-18 Jan-19 Apr-19 Jul-19 Oct-19 Jan-20
Global Developed Mkt. Emerging Mkt.ASEAN VN-Index
VN ID MY PH SG TH2015 6.1 -12.1 -3.9 -3.9 -14.3 -14.0
2016 14.8 15.3 -3.0 -1.6 -0.1 19.8
2017 48.0 20.0 9.4 25.1 18.1 13.7
2018 -9.3 -2.5 -5.9 -12.8 -9.8 -10.8
2019 7.7 1.7 -6.0 4.7 5.0 1.0
2020 YTD -31.1 -27.9 -15.0 -31.9 -23.0 -28.7
-40-20
0204060
VN ID MY PH SG TH2015 12.5 26.8 18.0 19.8 13.3 21.9
2016 16.5 26.2 16.9 19.4 12.2 16.6
2017 19.0 25.1 16.7 23.4 11.0 18.9
2018 16.4 19.4 18.8 18.9 11.1 15.9
2019 16.0 20.1 18.6 17.1 12.2 18.9
2020 YTD 10.3 13.2 15.0 11.6 9.6 13.2
06
12182430
2016 2017 2018 2019 YTD 2020
Buy 89,538.3 169,309.0 265,162.3 162,390.6 37,334.9
Sell (97,267.3) (142,881.5) (221,789.1) (155,689.1) (42,879.2)
Net (7,729.0) 26,427.5 43,373.3 6,701.4 (5,544.2)
(300,000)
(200,000)
(100,000)
0
100,000
200,000
300,000
0.13
0.390.24
0.10
0.83
1.86
0.0
0.5
1.0
1.5
2.0
2018
2019
YTD-20
202018
2019
YTD-20
202018
2019
YTD-20
202018
2019
YTD-20
202018
2019
YTD-20
202018
2019
YTD-20
20
VN ID MY PH SG TH
0
2
4
6
0
500
1000
1500
Mar-14 Mar-15 Mar-16 Mar-17 Mar-18 Mar-19 Mar-20
Premia MSCI (USD mn) VFMVN30 (USD mn)VanEck (USD mn) FTSE (USD mn)Total AUM/Freefloat Mkt Cap(%)
March 2020 – Page 13
March 2020 Vietnam by Numbers
Classified: Internal
Disclaimer
© 2020 VinaCapital Fund Management JSC (VCFM). All rights reserved. This report has been prepared and is being issued by VCFM or one of its affiliates for internal distribution in Vietnam. The information herein is based on public and other sources believed to be reliable. Except for information about VCFM, VCFM makes no representation about the accuracy of such information. Opinions, estimates and projections expressed in this report represent the current views of the author at the date of publication only. They do not necessarily reflect the opinions of VCFM and are subject to change without notice. VCFM has no obligation to update, amend or in any way modify this report or otherwise notify a reader thereof in the event that any of the subject matter or opinion, projection or estimate contained within it changes or becomes inaccurate. Neither the information nor any opinion expressed in this report constitutes an offer, or an invitation to make an offer, to buy or to sell any securities or any option, futures, or other derivative instruments in any jurisdiction. Nor should it be construed as an advertisement for any financial instruments. Officers of VCFM may have a financial interest in securities mentioned in this report or in related instruments. This research report is prepared for general circulation and for general information only. It does not have regard to the specific investment objectives, financial situation or particular needs of any person who may receive or read this report. Investors should note that the prices of securities fluctuate and may rise and fall. Past performance, if any, is no guide to the future. Financial instruments discussed in this note may not be suitable for all investors. Investors must make their own financial decisions based on their independent financial advisors as they believe necessary and based on their particular financial situation and investment objectives. This report may not be copied, reproduced, published, or redistributed by any person for any purpose without the express permission of VCFM in writing.