victorian employers’ chamber of commerce and … · victorian employers’ chamber of commerce...
TRANSCRIPT

Victorian Employers’ Chamber of Commerce and Industry
Victorian Skills Survey
www.vecci.org.au�
Published by the Victorian Employers’ Chamber of Commerce and Industry
486 Albert Street
East Melbourne VIC 3002
Phone: (03) 8662 5333
April 2007
© Copyright Victorian Employers’ Chamber of Commerce and Industry (VECCI)
No part of this publication may be reproduced, stored or transmitted in any form or by any means without the prior written permission of VECCI.
This publication has been produced as a joint research initiative of the Education and Training Adviser (ETA) Project and the Positive Ageing Workforce Project. The ETA Project is funded under the Australian Government’s Industry Training Strategies Programme, run by the Department of Education, Science and Training. The Positive Ageing Workforce Project is funded by the Department for Victorian Communities.
VECCI would also like to acknowledge the assistance provided by the National Centre for Vocational Education Research in analysing the results of this Survey.
VECCI VICTORIAN SKILLS SURVEY
�

VECCI VICTORIAN SKILLS SURVEY
�
Background to VEccI SkIllS SurVEy ........................ 2
Background ................................................................... 3
taBlES ............................................................................... 4
kEy rESultS...................................................................... 5
ExEcutIVE Summary ..................................................... 6
IntroductIon ................................................................. 8
dIScuSSIon ....................................................................... 9
SuGGESTIoNS foR fuRThER RESEARCh .........................12
KEy PolICy IMPlICATIoNS .............................................13
rESultS ............................................................................14
RESPoNSE RATES ............................................................14
BuSINESS PRofIlE ...........................................................14
VACANCIES AND RECRuITMENT .....................................15
BuSINESS IMPACT / SKIll RElATED ISSuES ......................19
WoRKfoRCE DEMoGRAPhICS ...................................... 21
rEfErEncES ..................................................................... 24
appEndIx I ...................................................................... 25
SuRVEy quESTIoNNAIRE ............................................... 25
appEndIx II ..................................................................... 30
NoN-RESPoNSE To INDIVIDuAl quESTIoNS ................. 30
appEndIx III .................................................................... 31
oThER PRIMARy BuSINESS ACTIVITIES .......................... 31
appEndIx IV .................................................................... 32
VACANCIES foR SKIllED AND APPRENTICE/TRAINEE PoSITIoNS By INDuSTRy ............. 32
appEndIx V ..................................................................... 36
oThER SKIllED VACANCIES AND APPRENTICE/TRAINEE VACANCIES ................................. 36
appEndIx VI .................................................................... 39
Contents
VECCI VICTORIAN SKILLS SURVEY
�
At the start of 2006, I launched the VECCI Victorian Skills Survey, which was the first state-wide survey covering all industry sectors to be undertaken in this way. Its aim was to ascertain the extent to which employers have been impacted upon by skill and labour shortages. The results have in part confirmed what we already knew – that employers are finding it difficult to recruit skilled workers, and that this was impacting on productivity and the wider economy.
The report has also shown that the impact of skill and labour shortages is more widespread than first thought. The solution will require a commitment from industry, government and the community to solve this challenge, and a new openness in our attitudes to employment, careers, retirement, secondary and post-compulsory education and training, and migration.
VECCI has been working for some time to raise employer awareness of the issues of skill shortages and the ageing of the population, and I would like to acknowledge the support of our funding partners, the Victorian Government, through the Department for Victorian Communities, and the Australian Government through the Department of Education, Science and Training.
VECCI currently works with the Australian Government through the Department of Education, Science and Training to promote to employers the benefits of the Training System and the use of apprenticeships and traineeships to develop the skills required by business.
VECCI also works with the Victorian Government through the Department for Victorian Communities (Office of Senior Victorians) to promote to industry the impacts of an ageing workforce and the need to recruit, retain and retrain older workers as part of the Grey Matters project (Positive Ageing Workforce Education Project).
The challenge of meeting Victoria’s labour supply needs for business and industry is significant, as the high demand for skilled labour and the demographic shift moving through Australia’s population is resulting in a highly competitive labour market.
faced with the current labour shortages and a further tightening of the labour pool in the near future, we must do more to utilise the potential of the 2.6 million working age Australians who receive welfare support.
We must ensure that as the population ages and the available number of Victorians of working age diminishes, those who can work are equipped with the right skills and motivation to do so.
our schools must ensure that students are prepared appropriately for further study and work, and have the choice of study options to take them where they want to go – be it higher education, TAfE, or an apprenticeship.
Our training system should be flexible and responsive to the needs of business and industry to ensure that the skills developed by our private and public institutions provide workers with the skills and knowledge that will lead to sustained and valued employment. It must also ensure that we maximise the productive capacity of our workforce.
With a diminishing workforce population, we must ensure that we maximise the workforce participation rate. We must encourage workers to remain in the workforce for longer, be willing to retrain and recruit a diverse range of employees, and foster mutually flexible working arrangements. Those with barriers that restrict their capacity to work must have appropriate support from Government to re-enter the labour market.
The Victorian Employers’ Chamber of Commerce and Industry has been active in raising employer awareness of the twin challenges of skilled labour shortages and demographic change, and bringing solutions to the table with Government to ensure that our economic prosperity is maintained.
The challenge for employers now is to be more flexible in their recruitment and make a greater commitment to structured training to address skills issues.
Neil Coulson
Chief Executive Officer
Victorian Employers’ Chamber of Commerce and Industry
Background to VECCI Skills Survey
VECCI VICTORIAN SKILLS SURVEY
�
A skilled workforce provides a competitive edge. It is vital to improving and maintaining our living standards and is a key driver of increased productivity and economic growth.
Victoria’s labour market faces a number of challenges: an ageing population, difficulties in attracting new entrants into traditional trades, and broad-based labour and skills shortages.
for this reason VECCI undertook the Victorian Skills Survey, a key recommendation of the VECCI Victoria Summit held in November 2005, to ascertain the impact that labour market challenges were having on Victorian businesses.
It is projected that should the workforce continue to retire at the current average retirement age, that in the next decade, a significant proportion of the 3.7 million baby boomers of our current 10.2 million workforce may retire, having a significant impact on the nation’s labour supply.
In fact, projections by the Department of Employment and Workplace Relations (DEWR) indicate that by as soon as 2010, Victoria will face a shortfall of 50,000 workers due to our ageing population.
labour force participation declines sharply with age and it is expected that baby boomer retirement patterns over the next 15 years will see the Australian workforce grow by only 57,000 per year for the whole decade of 2020. This compares with an estimated 175,000 new entrants to the workforce currently per year.
The effects of skill and labour shortages are already being felt by employers. The VECCI Victorian Skills Survey found that 53% of businesses had found it difficult to recruit skilled workers in the past 6 months.
This shortfall is already having an impact on productivity, with 58% of employers indicating that skill shortages was having a negative impact on the productivity of their business.
Victorian skill shortages mirror national trends and continue to limit business growth in a number of industry sectors. There are state-wide recruitment difficulties in many trades and professions, and in many regional areas skill shortages and problems recruiting and retaining staff continue to hamper further growth.
A number of factors are working to constrain Victoria’s long-term stock of skills. They include:
The ageing of the existing workforce
falling numbers of new entrants to the workforce
Structural changes within industry sectors
The skill level of existing workers
The first of these factors - a substantial increase in the median age of the Victorian population – is one of the most pressing but many employers are not fully aware of the impact of an ageing workforce and have yet to plan for change.
for instance, in some occupations, particularly in traditional trade areas, average age rates exceed 50 years. Strategies need to be in place to develop and/or replace potentially lost skills, otherwise there will be an enormous impact on workforce participation rates as these older workers retire.
The VECCI Victorian Skills Survey found that while 99% of those employers surveyed had some knowledge of the ageing workforce, nearly two thirds (63%) had not conducted an age profile of their business and only 41% were aware of the retirement intentions of their older workers.
–
–
–
–
–
The implications on businesses, particularly small to medium sized enterprises, could affect their sustainability, profitability and overall viability.
In terms of labour supply, the workforce entrants for the next 12 years are already in school, and with only a slight projected increase in their number, this will be insufficient to meet projected labour demand in the future.
Attracting young people to work in some industries and/or finding other suitable applicants for entry-level positions has become a pressing challenge for many employers.
Background
VECCI VICTORIAN SKILLS SURVEY
�
Table 1: Survey type and VECCI Membership 14
Table 2: Number of businesses by Statistical Division 14
Table 3: your Primary Business Activity: 14
Table 4: how many staff do you currently employ? 14
Table 5: Do you currently employ staff from 15 the following groups?
Table 6: over the past 6 months, have you found it difficult to recruit . . . 15
Table 7: What actions have you taken to fill 16 vacancies in your business?
Table 8: What actions do you intend to take 16 to fill vacancies in your business?
Table 9: What recruitment sources have you used 17 to fill vacancies in your business?
Table 10: What recruitment sources do you intend 17 to use to fill vacancies in your business?
Table 11: how many vacancies does your business have 32 for skilled and apprentice/trainee positions?
Table 12: Skilled Vacancies by Industry 17
Table 13: occupations with 1% or more of 18 Total Skilled Vacancies
Table 14: Apprentice/Trainee Vacancies by Industry 18
Table 15: occupations with 1% or more of 19 Total Apprentice/Trainee Vacancies
Table 16: What impact, if any, are skill shortages 19 having on the productivity of your business?
Table 17: I have been unable to fill a vacancy in my business, 19 and I would consider sponsoring an overseas worker.
Table 18: I don’t have any difficulty recruiting for vacancies 20 in my business but would consider sponsoring an overseas worker if I did.
Table 19: Please indicate the type of training undertaken 20 in your business in the past 6 months.
Table 20: Please indicate the type of training that you plan 21 to undertake in the next 6 months.
Table 21: how would you rate your knowledge of the 21 term “Ageing Workforce”?
Table 22: Do you believe an ageing workforce is 21 having a direct affect on your business?
Table 23: Do you think it is likely to be an issue in the future? 39
Table 24: Are you recruiting and/or retaining older 22 workers (45+)?
Table 25: If yes, is this because you have had difficulties 22 in recruiting younger people (under 45)?
Table 26: Do you offer training/retraining opportunities 23 to all staff regardless of age?
Table 27: Have you conducted an age profile of your business? 23
Table 28: Are you aware of the retirement intentions 23 of your older workers?
Table 29: If yes, have you analysed the effects of these 23 intentions on your business/organisation?
Table 30: National Trades and Professions Skill Shortages, 10 Australia, 2005
Table 31: Not Stated Analysis 30
Table 32: other Primary Business Activities 31
Table 33: Other Specified (<5 vacancies) - Skilled Vacancies 36
Table 34: Other Specified (<5 vacancies) – 38 Apprentice/Trainee Vacancies
Tables

VECCI VICTORIAN SKILLS SURVEY
�
Analysis of 1,281 Victorian business responses to the VECCI Skills Survey has found that:
Businesses experience difficulties in filling vacancies with over half of businesses finding it difficult to recruit skilled people to vacancies over the past 6 months; and half of businesses finding it difficult to recruit experienced people to vacancies over the past 6 months.
of businesses that employ apprentices and trainees, 28.3% found it difficult to recruit people to undertake an apprenticeship or traineeship with their business over the past 6 months.
Businesses reported 1,845 skilled vacancies, with the vacancies mainly occurring in the industries of Transport and Storage; health and Community Services; Metal and Engineering; Wholesale and Retail Trade; Manufacturing; Electricity, Gas & Water Supply; and Accommodation, Café, Restaurant.
Businesses reported 717 apprentice/trainee vacancies. over one-third of total apprentice/trainee vacancies were for the occupation of Call Centre Agent; and other occupations with the most apprentice/trainee vacancies were: Aged or Disabled Person Carer, and Welder/Boiler Maker.
over half of businesses (58.4%) felt that skill shortages were having a negative impact on the productivity of their business, with 10.7% reporting a very negative impact.
–
–
–
–
–
Nearly two-thirds (63.7%) of surveyed businesses believe that an ageing workforce is not having a direct affect on their business. of these respondents, only 20.9% had undertaken an age profile assessment of their workforce. In contrast, over one-third (34.0%) of businesses did feel that an ageing workforce was having a direct affect on their business.
Sponsoring an overseas worker would be considered in the future by nearly a quarter (24.3%) of responding businesses if they had difficulty in recruiting for a vacancy. however, of those that currently had been unable to fill a vacancy, this figure falls to 16.3% that would consider sponsoring an overseas worker, and then only 4.2% reported they intend to fill a vacancy by seeking a skilled migrant from overseas when considered along side other recruitment options such as advertising for a qualified tradesperson or retraining current staff.
Regional Victorian businesses (56%) responding to the survey was more acutely affected by the difficulty in recruiting skilled workers compared to metropolitan business (50%) respondents.
–
–
–
Key Results

VECCI VICTORIAN SKILLS SURVEY
�
Survey Scope and Objectives
This report provides an analysis of the Victorian Employer’s Chamber of Commerce and Industry (VECCI) Victorian Skills Survey distributed to Victorian enterprises in April 2006.
The survey was conducted to assist VECCI in understanding the extent and nature of skills shortages impacting on Victorian industry and to assist in developing appropriate policy and program recommendations in response.
The survey comprised 21 questions in four major sections: Business Profile, Vacancies and Recruitment, Business Impact/Skill Related Issues, and Workforce Demographics.
A total of 7,469 businesses were invited to complete the survey. The survey achieved a response rate of 17.2% with 1,281 surveys being available for analysis.
Profile of RespondentsThe following characteristics describe the major features of the 1,281 Victorian businesses that responded to the survey.
fifty-eight percent of businesses that responded have a primary business site located in the ABS Statistical Division of Melbourne, with the next highly represented Statistical Division being Barwon with 7.7% of businesses.
All industry areas were represented to some degree by respondents with Manufacturing (15.0%) and Wholesale and Retail Trade (12.9%) being the two most highly represented.
over half (56.5%) of the surveyed businesses responding are small businesses that employ between 1 and 20 staff.
Eleven percent of businesses that responded currently employ an Indigenous Australian, 89.5% a person over the age of 45, 20.3% persons with a physical or intellectual disability, and 52.1% of businesses currently employ culturally and linguistically diverse persons.
–
–
–
–
Key findings relating to Vacancies and Recruitment:
over half (52.6%) of the surveyed businesses that responded to the survey found it difficult to recruit skilled people to vacancies over the past 6 months. Also, half of the surveyed businesses found it difficult to recruit experienced people to vacancies over the past 6 months.
of responding businesses that employ apprentices and trainees, 28.3% found it difficult to recruit people to undertake an apprenticeship or traineeship with their business over the past 6 months.
The most common actions taken by responding businesses in the past 6 months to fill vacancies were retraining current staff (42.0%) and advertising for a qualified tradesperson (34.9%). Just over 18% of businesses sought a mature aged worker (45 years+) to fill vacancies and 18.4% advertised for an apprentice or trainee.
over the past 6 months, 4.5% of businesses that responded sought a skilled migrant (from overseas), and 4.1% employed a person with a disability with appropriate skills, to fill vacancies in their business.
The most popular recruitment source used by more than half (52.5%) of businesses responding to fill vacancies in the past 6 months was newspaper advertisements. other frequently used recruitment sources included internet advertisements (37.8%), recruitment agencies (34.4%), and Job Network providers (23.7%). labour hire agencies were used by 13.3 % of businesses and 12.1% of businesses used a Group Training Company.
The 1281 businesses responding reported 1,845 skilled vacancies. The vacancies mainly occurred in the following industries:
Transport and Storage, 16.4%
health and Community Services, 11.3%
Metal and Engineering, 10.5%
Wholesale and Retail Trade, 8.3%
Manufacturing, 7.2%
Electricity, Gas & Water Supply, 6.3% and
Accommodation, Café, Restaurant, 5.5%
•
•
•
•
•
•
•
The 1281 businesses responding reported 717 apprentice/trainee vacancies. over one third (36.3%) of these vacancies were reported by businesses in the Property and Business Services industry.
Key findings relating to Business Impact / Skill Related Issues:
over half of the surveyed businesses responding (58.4%) reported that current skill shortages were having a negative impact on the productivity of their business, with 10.7% reporting a very negative impact.
Nearly 4 in 10 (39.4%) businesses consider that current skill shortages were having no impact on their productivity. Two percent of businesses felt that current skill shortages were having a positive impact on their productivity.
over half (52.1%) of the surveyed businesses responding said that while they have been unable to fill a vacancy in their business, they would not consider sponsoring an overseas worker.
Nearly a quarter (24.3%) of businesses responding said that while they do not have any difficulty recruiting for vacancies in their business, they would still consider sponsoring an overseas worker.
Non-accredited training (provided in the workplace) was popular among surveyed businesses, with 56.5% of businesses responding undertaking this type of training in the past 6 months. Nearly a quarter (22.8%) of businesses undertook non-accredited off the job training (at a provider location) in the past 6 months.
over a third (39.4%) of businesses responding undertook accredited training (provided in the workplace) in the past 6 months with 33.9% undertaking accredited off the job training (at a provider location).
In the past 6 months, employer sponsored/supported undergraduate learning was undertaken by 13.3% of businesses that responded and 11.7% of businesses undertook employer sponsored/supported post graduate learning.
–
–
–
–
–
–
–
–
Executive Summary

VECCI VICTORIAN SKILLS SURVEY
�
Key findings relating to Workforce Demographics:
Nearly all (98.8%) businesses responding consider themselves to have some knowledge of the term “Ageing Workforce”.
Nearly two thirds (63.7%) of responding businesses believe that an ageing workforce is not having a direct affect on their business, with a similar proportion indicating they have not conducted an age profile of their businesses.
Nearly three quarters (74.7%) of businesses responding indicated that they were recruiting and/or retaining older workers (45years+).
The proportion of responding businesses that are aware of the retirement intentions of their older workers is approximately the same as the proportion of businesses who are not aware (40.9% aware, 41.6% not aware). of the businesses that are aware of the retirement intentions of their older workers, nearly 85% have analysed the effects of these intentions on their business/organisation.
Key findings relating to regional and metropolitan Victoria:
Businesses are experiencing difficulties in filling vacancies, with over half of businesses (53%) finding it difficult to recruit skilled people to vacancies over the 6 months ahead of filling in the survey, with the problem being more acute in regional Victoria (56%) than metropolitan Melbourne (50%);
of businesses that employ apprentices and trainees, 28% found it difficult to recruit people to undertake an apprenticeship or traineeship with their business over the past 6 months, with metropolitan-based businesses (31%) facing more difficulties in this respect than regional businesses (26%).
over half of businesses (58%) felt that skill shortages were having a negative impact on the productivity of their business, with a higher number of regional respondents (61%) reporting this than metropolitan respondents (56%). Breaking this down, 10.7% reporting a very negative impact – more metropolitan-based businesses (11.2%) than regional based businesses (9.8%), however, reported a very negative impact.
–
–
–
–
–
–
–
Survey Key Findings and Response
Key issues from the VECCI Survey:Businesses are finding it difficult to find skilled workers.
A quarter of businesse have found it difficult to recruit an Australian Apprentice.
un-skilled and semi-skilled occupations have highest number of vacancies.
Skill shortages are having a significant negative impact on productivity.
The large majority of businesses do not believe or have considered how the ageing of the workforce will have an impact on them.
less than 5% of businesses plan to recruit a skilled migrant for a hard to fill position.
Regional areas are acutely more affected by skill and labour shortage than metropolitan areas.
Responses to Issues:Increase skill levels of the workforce.
Improve take up of apprenticeships by making it more attractive for businesses and individuals.
Improve workforce participation.
Ensure businesses are aware of ageing workforce issues and how to plan for them.
Increase take up of skilled migrantion option to increase skilled workforce.
Ensure regional areas have access to training resources.
Ensure regional areas are able to attract increased population.
Policy Implications
There are a number of shorter and longer term policy implications to be considered by Victorian and Australian Governments:
The take up of apprenticeships needs to be increased by addressing negative perceptions, encouraging adults into apprenticeships, offering financial support to apprentices to balance lower training wages, and reducing apprenticeship duration through the implementation of competency based assessments and completions, and greater use of Recognition of Prior learning arrangements.
1.
2.
3.
4.
5.
6.
7.
1.
2.
3.
4.
5.
6.
7.
–
The interaction of education, training and industry needs to be further integrated to ensure school leavers are provided with greater choice and are better prepared for the transition to work. This interaction should focus on models that improve links between industry and schools, such as the Coburg Senior high School, where industry is a partner in the development of the curriculum and provides places for VET in Schools and Australian School Based Apprenticeships.
Mature aged workers must be able to access the training system that sufficiently recognise prior skills, and focus on retraining and re-skilling older workers in the workplace.
There is a need for a further increase in Victoria’s share of national migration in order to meet skills and labour gaps over the short to medium term. There also needs to be greater recognition of transition and settlement issues among migrants with appropriate support provided.
funding of the Victorian training system needs to respond to meet the growth in demand of skilled labour.
National reform of training system which impacts on licensing, mutual recognition of qualifications, outcomes based auditing of Registered Training organisations, intermediate qualifications, achievement of competency based completions of Australian Apprenticeships, and removal of barriers to School-based Apprenticeships need to be implemented in full.
Industry supports the Welfare to Work reforms and other initiatives to increase workforce participation, however risk issues for industry need to be addressed through the provision of work readiness programs for recipients in order to manage their effective transition to work.
The imbalance in supply of labour for regional centres needs to be addressed by inbound migration strategies.
–
–
–
–
–
–
–
VECCI VICTORIAN SKILLS SURVEY
�
This report provides an analysis of the results of the Victorian Employer’s Chamber of Commerce and Industry (VECCI) Victorian Skills Survey distributed to Victorian enterprises in April 2006.
The results section of this report discusses survey response rates before presenting an analysis of each of the 21 questions within the four sections of the survey, the sections being: Business Profile, Vacancies and Recruitment, Business Impact/Skill Related Issues, and Workforce Demographics.
Where possible, a comparison of findings of VECCI Survey businesses to a Victorian Business Profile and Vacancy Statistics is also presented.
In addition, a discussion of the key messages from the VECCI Survey is included. This section looks at the themes from the survey and how this compares to what was found in other recent employer surveys. A brief outline of relevant Government programs currently operating is also included.
The National Centre for Vocational Education Research (NCVER) undertook the analysis of the data results and assisted VECCI in the drawing out of key findings from the survey.
The Victorian Skills Survey was distributed via email, newsletter article and hardcopy to 7,469 Victorian businesses in April 2006.
Businesses were asked to complete the survey from 7 April 2006 to 28 April 2006. Responses were accepted into May 2006.
The VECCI Victorian Skills Survey instrument consisted of 5 pages including a cover page. A copy of the questionnaire can be found in Appendix I.
The survey comprised 21 questions in sections as follows:
Business Profile (4 questions),
Vacancies and Recruitment (6 questions),
Business Impact/Skill Related Issues (3 questions), and
Workforce Demographics (8 questions).
As part of the data validation process, the original survey data file provided by VECCI was reviewed.
–
–
–
–
–
Introduction
VECCI VICTORIAN SKILLS SURVEY
�
The Victorian Skills Survey conducted by VECCI highlights a number of issues for Victorian employers. This section looks at some of these issues and compares findings to what other recent employer surveys have found. While it is not possible to directly compare results from the different surveys due to differences in methodologies, it is possible to view the different themes emerging from the surveys and interpret the findings compared to what was found in the recent VECCI survey. Not all data is available specifically for Victoria. Where state level data was available, figures have been noted.
Recruitment difficulties The recent VECCI survey highlights that employers are experiencing significant recruitment difficulties, especially in relation to skilled and experienced people (53% and 51% respectively, Table 6).
In addition the recruitment of apprentices and trainees, while a lesser problem, still poses a challenge with 28% of employers looking to recruit apprentices or trainees reporting difficulty.
The Survey of Employer use and Views of the VET System (SEuV) conducted by the National Centre for Vocational Education Research (NCVER) in 2005 also identified recruiting issues. of all Victorian employers, 37% had experienced difficulty recruiting staff in the last 12 months. This compares to 41% across all employers in Australia. The overwhelming reason given by employers for these difficulties was a shortage of skilled people in the industry (69% of employers who had experienced some level of difficulty in recruiting staff).
further, more than half of the businesses responding to the VECCI Survey (58%) felt that current skill shortages were having a negative impact on the productivity of their business and of those, 10% reported it was having a very negative impact.
However, a significant percentage of responding employers (40%) reported that skill shortages were having no impact at all. It could be expected that this will change if the supply of skilled labour is not improved while at the same time those currently with skills retire from the workforce over the next decade.
The Allen Consulting Group’s World Class Skills for World Class Industries Report prepared for the Australian Industry Group (Ai Group) in 2005, found that nearly three-quarters of the employers who responded noted the inability to secure skilled staff as the main barrier to their success over the next three years.
Employers responding to the Allen Consulting World Class Skills survey were reported skill shortages were resulting in higher overtime levels (72%), added costs to production (67%) and reduced productivity (63%). The actions proposed by employers, to overcome skill shortages in the next three years, had a heavy focus on training: retrain existing staff (88%) and increase investment in training (87%).
The combined effects of demographic change and strong economic growth with sustained labour demand, has over time has led to a shortfall in supply of skilled tradespeople, semi skilled professionals and unskilled workers.
Projections by the Department of Employment and Workplace Relations (DEWR) indicate that by 2010, Victoria will face a shortfall of 50,000 workers due to the affects of demographic change.
labour force participation declines sharply with age and it is expected that baby boomer retirement patterns over the next 15 years will see the Australian workforce grow by only 57,000 per year for the whole decade of 2020. This compares with an estimated 175,000 new entrants to the workforce currently per year.
There is broad agreement in the three surveys that Australian employers are experiencing skills shortages and it is having an impact on their business (VECCI, 2006; NCVER, 2005; World Class Skills, 2005).
To overcome these difficulties businesses responding to the VECCI Survey indicated they were retraining existing staff (42%) and advertising for qualified tradespeople (35%) to fill the vacancies in their business.
The significant response by surveyed businesses to retrain existing workers to fill vacancies indicates there should be provision for accredited training to existing workers by Government to support the up skilling of existing workers and raise their productive capacity.
Businesses responding to the survey also indicated that recruiting mature aged workers was their third preference for filling a vacancy, after retraining existing staff or advertising for a qualified tradesperson, and ahead of advertising for an apprentice or trainee or seeking a school based apprentice.
This suggests that employers are seeking workers with significant work experience, with one possible explanation being that older workers are viewed as being better prepared for work and are more productive for their immediate needs.
Discussion
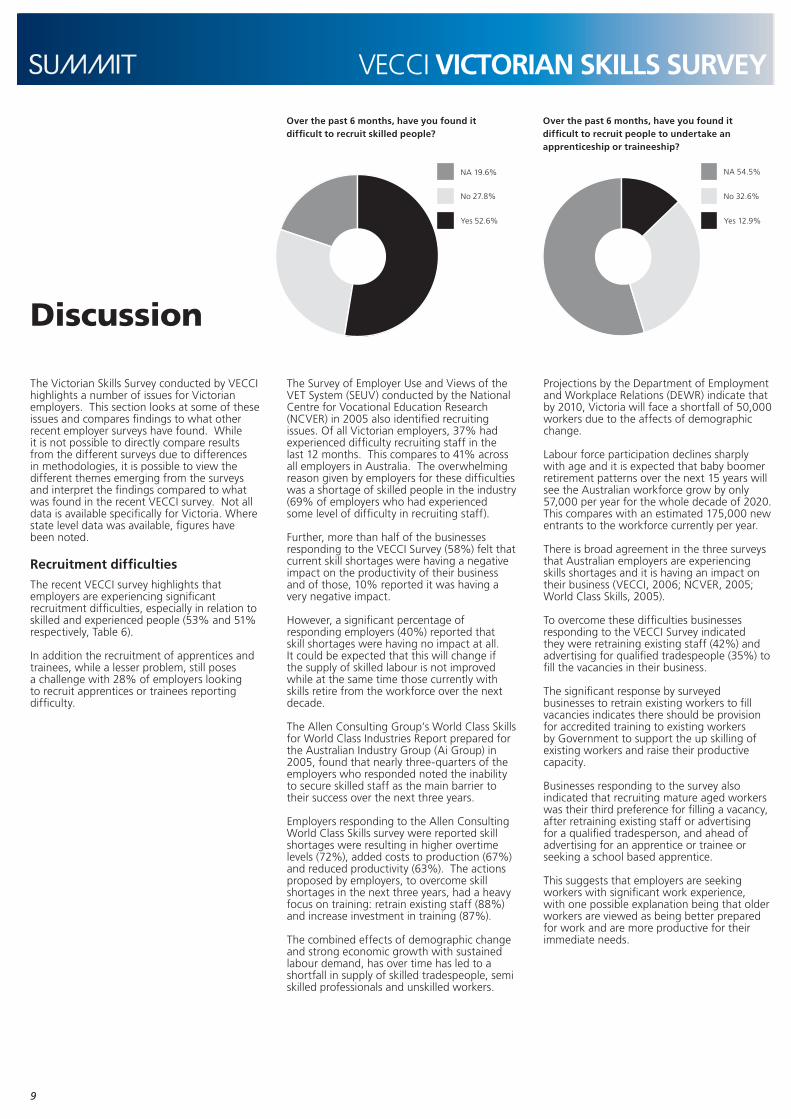
Over the past 6 months, have you found it difficult to recruit skilled people?
NA 19.6%
No 27.8%
yes 52.6%
Over the past 6 months, have you found it difficult to recruit people to undertake an apprenticeship or traineeship?
NA 54.5%
No 32.6%
yes 12.9%

VECCI VICTORIAN SKILLS SURVEY
�0
Newspaper and Internet advertisements (53% and 38% respectively) along with recruitment agencies (34%) were the most common recruitment sources used to fill vacancies in the business. These approaches are similar to those reported in the Survey of Employer use and Views of the VET System (NCVER, 2005) though the retraining of current employees was only nominated by 14% of Australian employers in this survey, compared to the 42% of businesses responding to the VECCI survey.
With many businesses reporting that they are advertising and recruiting directly via newspaper and Internet advertisements, opposed to using a Job Network Provider, Recruitment Agency or Group Training Company, it is critical that employers are aware of the significant changes that the labour market is undergoing, and the challenge this will present.
Although nearly 99% of responding businesses reported having at least a limited awareness of the “ageing workforce”, only 1 in 5 have conducted an age analysis of their work force, and only 40.9% are aware of the retirement intentions of their older workers.
This suggests that there is a gap between the required and actual knowledge of employers to undertake best practice recruitment. The changing demographics of the Australian labour market and wider population, and the impact that Welfare to Work reforms as well as reforms to increase workforce participation, will have a significant impact on the make up of potential job seekers which in turn will have serious consequences for employers.
19.4% of employers, or less than 1 in 5, indicated they had advertised for an apprentice or trainee to fill a vacancy in their business. While over half of businesses reported difficulty in recruiting skilled or experienced workers, it would appear that many businesses are unable or unwilling to increase the supply of qualified workers by offering apprenticeships and trainees to meet the high demand.
Vacanciesusing a list primarily sourced from the Migration occupation in Demand list compiled by the Department of Employment and Workplace Relations (DEWR), businesses responding to the VECCI Survey indicated the number of vacancies they currently had for skilled and apprentice/trainee positions in each of the listed occupations.
for skilled vacancies, the top three occupations were aged or disabled person carer (6.9%), sales assistant (6.6%) and taxi driver (5.4%). None of these occupations had a DEWR assigned In Demand Indicator.
over one-third of all industries reported more than 5% of total reported skilled vacancies. Those industries were: transport and storage (16.4%), health and community services (11.3%), metal and engineering (10.5%), wholesale and retail trade (8.3%), manufacturing (7.2%), electricity, gas and water supply (6.3%) and accommodation, café and restaurant (5.5%).
over one-third of all apprentice/trainee vacancies of businesses responding to the VECCI survey were for call centre agents. The other top two occupations with vacancies were aged or disabled person carer (3.1%) and welder/boiler maker (3.1%). Welder/boiler maker was the only occupation with a DEWR in Demand Indicator. It was listed as a state-wide shortage (a qualifying comment applies).
The industries that had more than 5% of apprentice/trainee vacancies were: property and business services (36.3%), accommodation, café and restaurants (7.9%), wholesale and retail trade (7.0%), metal and engineering (6.8%) and manufacturing (6.3%).
This compares to the federal Government’s 2005 assessment of national skill shortages in the national trades and professions (Table 34).
Table 30: National Trades and Professions Skill Shortages, Australia, 2005
Trades Professions
Engineering trades Child care
Vehicle trades Engineers
Electrical/ electronics trades
Accountants
Construction trades Registered nurses
food trades Enrolled nurses
Wood trades health specialists
Source: Department of Employment and Workplace Relations 2005, Australian Jobs 2005, www.dewr.gov.au, p15
While the skilled and apprentice/trainee vacancies reported in the survey are not all skill shortage occupations, they are occupations with significant numbers of vacancies and present opportunities for those entering the workforce.
0 10 20 30 40 50
Action taken in the past 6 months
Advertise for an apprentice or trainee
Seek a skilled migrant (from overseas)
Seek a mature aged worker (45+)
Employ a person with a disability with appropriate skills
Recruit a School Based New Apprentice
Retrain current staff
other
What actions have you taken to fill vacancies in your business?Action taken in the past 6 months %
0 10 20 30 40
Transport and Storage
health and Community Services
Metal and Engineering
Wholesale and Retail Trade
Manufacturing
Electricity, Gas & Water Supply
Accommodation, Cafe, Restaurant
Top 7 industries by number of skilled vacancies.Industry %
0 10 20 30 40
Property and Business Services
Accommodation, Cafe, Restaurant
Wholesale and Retail Trade
Metal and Engineering
Manufacturing
health and Community Services
Construction
Top 7 industries by number of apprentice/trainee vacancies.Industry %

VECCI VICTORIAN SKILLS SURVEY
��
Type of training
Results from the VECCI survey indicate that responding businesses have a preference for training at the workplace rather than the provider’s location. Non-accredited training provided in the workplace was more popular than accredited training in the workplace. In the survey, responding businesses were also asked about their training intentions in six months time with the preference for non-accredited training in the workplace again being expressed.
The Survey of Employer use and Views of the VET System (NCVER, 2005) did not collect information on the location of the training but looked at the various ways employers use the VET system to meet their skill needs. This included employing apprentices and trainees, providing staff with nationally recognised and unaccredited training. This survey also found employers having a preference for unaccredited training.
Nearly a quarter of employers provided nationally recognised training to employees (accounts for 59% of employees) and 28% employed apprentices or trainees (accounts for 54% of employees). Similar levels were reported for Victorian employers: 24% for nationally recognised training and 28% for apprenticeships and traineeships. Just over half of all employers provided unaccredited training (46% for Victorian employers) and 79% provided informal training (75% for Victorian employers).
The key messages from the NCVER survey tend to suggest that employers have a preference for either unaccredited or informal training. In the NCVER survey, employers were asked when choosing unaccredited training whether they knew if there was any comparable nationally recognised training available.
Ten percent of those using unaccredited training (9% for Victorian employers) said there was comparable nationally recognised training available and over a quarter (29% for Victorian employers) didn’t explore if there was.
The main reasons employers gave for choosing unaccredited training over nationally recognised training included the content of the course was suitable (27%) and unaccredited training was more cost effective (24%).
Ageing Workforce and Skilled Migration
Most (90%) businesses responding to the VECCI Survey employ staff aged 45 years and over. The term “ageing workforce” is known to nearly all employers. Two-thirds of businesses believe an ageing workforce is not having a direct effect on their business at present. of those that did not think it was an issue, only 11% think it may or will be an issue in the future. for those that did consider it an issue, 17% felt it would an issue in the future because they valued the characteristics of aged workers. Eleven percent felt it was having an impact due to skill shortages.
In the recent Allen Consulting World Class Skills Report, employers felt the ageing of the workforce was a more serious issue, with almost half (47%) expressing this view. This proportion rose to two-thirds of employers indicating the ageing workforce would be a serious issue in three years time.
only 21% of businesses responding to the VECCI Survey have conducted an age profile of their business and 41% are aware of the retirement intentions of their older workers: 85% of this latter group have analysed the effects of these intentions on their business.
Although nearly 99% of responding businesses reported having at least a limited awareness of the “ageing workforce”, two thirds reported that it was not having an impact on their business. only 40.9% are aware of the retirement intentions of their older workers.
90% of businesses have a worker aged 45 or over, and therefore nearly all businesses will be affected to some degree by the ageing of the workforce. (Based on current average age of retirement of 58. source, ABS)
Considering that recent research has shown that Victoria will face a shortfall of 50,000 workers by 2010, and 90% of responding businesses have employees 45 or over, it is critical that more businesses are aware of and analyse the affects of the retirement plans of their older workers.
In light of those estimates, business must be prepared for the impact of the retirement of their older workers by providing strategies to minimise the loss of valued skills and knowledge.
The strategies nominated by employers are very similar to those being proposed in other reports to deal with skill shortages. Employers responding to the Allen Consulting World Class Skills Report indicated the action they were likely to take to overcome problems of an ageing workforce were to retrain existing staff (82%), recruit more young people (71%) and redesign jobs (71%). only 34% planned to recruit from overseas.
According to the VECCI survey twenty percent of the responding businesses that have recruitment difficulties would consider sponsoring an overseas worker. Nearly half would not, with the remaining 32% unsure. If the employer had not had difficulty recruiting, the percentage considering sponsoring grew to 24%.
The evidence from these results do not indicate an influxof skilled migrants sponsored by responding employers but rather an approach that is part of an over strategy that includes retaining existing workers, employing local apprentices and trainees, and recruiting mature aged workers.
While 24% of responding employers would consider sponsoring an overseas worker to fill a difficult vacancy, when considered against a range of options, seeking a skilled migrant came in fifth, following advertising for a qualified tradesperson, a mature aged worker, an apprentice or trainee, or a school based apprentice.
What assistance is there from VECCI and Government to employers to help fill skilled vacancies?
The Victorian and federal Governments have put in place a number of initiatives to help both employers and employees in dealing with the skill shortages issue. Three relevant Victorian programs are discussed below.
VECCI has recently been licenced by the Deparment of Employment and Workplace Relations to become a Job Placement organisation. The VECCI Staff Solutions service will accept vacancies from employers and source and screen appropriate candidates from the Job Network system as well as other commerical agencies and service providers. The service is free to employers and job seekers will also be linked to vocational training initiatives to develop skilled labour.
0 10 20 30 40 50 60
Non-accredited training (workplace)
Accredited training (workplace)
Non-accredited off the job training
Accredited off-the-job training
Employer sponsored/supported undergraduate learning
Employer sponsored/supported postgraduate learning
other
Please indicate the type of training undertaken in your business in the past 6 months.Industry %
Unsure
No
Yes
I have been unable to fill a vacancy in my business, and I would consider sponsoring an overseas worker.
unsure 31.6%
No 52.1%
yes 16.3%

VECCI VICTORIAN SKILLS SURVEY
��
Another initiative, Workforce Participation Partnerships (WPP), was launched on 23 November 2005. Its objective is to provide sustainable jobs for Victorians who face difficulties entering the workforce and to assist employers to meet their skill and labour needs. Specifically, the program aims to:
assist Victorians facing significant barriers to employment
place jobseekers into ongoing, sustainable employment
assist employers to meet their labour and skill needs
forge stronger links between service agencies and employers to identify sustainable job opportunities
provide case management services to targeted jobseekers
optimise the use of existing resources, programs and infrastructure
There has also been a recent media campaign by the federal Government to encourage employers to think about employing disadvantaged job seekers. The campaign is designed to make employers think about older workers, people with a disability or those from a non-English speaking background when looking to fill vacancies within their organisation.
of the employers responding to the VECCI survey, 11% employ Indigenous Australians, 20% employ persons with a physical or intellectual disability and 52% employ culturally and linguistically diverse persons. Approximately 90% of employers have employees aged 45 years and over.
–
–
–
–
–
–
Two other initiatives are focused on recruiting skilled migrants to Australia to overcome skill shortages. The first is the Victorian Government’s State/ Territory Nominated Independent (STNI) Eligibility list, which identifies skills in demand throughout the state. If employers have an occupation on the specified list, the employer may be eligible for sponsorship by the Victorian Government under the STNI visa. The STNI Scheme and Skill Matching (SM) Schemes encourages skilled migrants to settle in regions of Australia where their skills are in demand. These visas provide permanent residency. The visas are offered by the Australian Government through the Department of Immigration and Multicultural Affairs (DIMA). They are only available to skilled migrants if state/territory governments participate in the schemes; which the Victorian Government administers through the Skilled Migration Program (SMP).
The other initiative is the Victorian Government’s Skilled Independent Regional Visa (SIR) Eligibility List. It identifies skills in demand within regional Victoria. If employers have an occupation on this list, they may be eligible for sponsorship by the Victorian Government under the SIR visa for living and working in regional Victoria. It initially provides skilled migrants with a three-year temporary visa to look for employment and explore lifestyle opportunities in regional Victoria. After living in regional Victoria for two years and working there for a minimum period of 12 months, skilled migrants are eligible for permanent residency.
The VECCI survey found that 20% of responding businesses were willing to consider sponsoring an overseas worker to fill vacancies and nearly a third were unsure about this as an option.
VECCI, through its International Trade division and in conjunction with DIMA, has been assisting Victorian employers to access skilled migration programs, with the provision of advice on meeting government requirements and regulatory obligations, as well as with sourcing appropriate candidates overseas.
Suggestions for further research
While the survey is able to make comparisons between metropolitan and regional areas with 58.2% of respondents located in metropolitan Melbourne and 41.1% across regional Victoria, the Report is restricted in making detailed analysis on responses for specific sub-regions due to limitations in sample sizes.
Additional regional data is available from the Regional Skills Shortage Survey’s conducted by the Department for Victorian Communities and the Department of Employment and Workplace Relations (DEWR). These Reports while useful, however again are limited in their geographical coverage and the ability to be compared to other surveys, and therefore further research would be beneficial.
While the data from the survey illustrates that a significant proportion of businesses experienced difficulty in recruiting, the data did not reveal whether the positions that were difficult to fill were short term or whether it was an ongoing, endemic situation.
Another question that could be asked as a result of the survey is, considering a significant majority of responding businesses reported skill shortages were having a negative impact on productivity, were there any particular circumstances shielding the 39.4% that reported no impact? Also worth further consideration is why 1.8% of businesses experiencing a positive impact on productivity from skill shortages. An area not able to be further explored by this Report is why some skilled occupations are affected by skill shortage and other are not, and whether this is because the employer and/ or industry has formulated better ways to operate in the environment.
54.5% of responding employers indicated that they did not recruit or attempt to recruit an apprentice or trainee in the previous six months. This would imply that 45.5% of responding employers had vacancies for apprentice/ trainee positions in the preceding six month period.
When asked if they had sought an apprentice or trainee to fill a vacancy in their business, 18.4% reported yes, and 16.3% reported they would seek an apprentice or trainee to fill a vacancy in their business in next six month period.
yes No unsure0
20
40
60
80
100Culturally and linguistically diverse
Physical or intellectual disability
45 and over
Indigenous
Do you currently employ staff from the following groups?
VECCI VICTORIAN SKILLS SURVEY
��
Considering this range of responses of employers reporting an attempt to recruit an apprentice or trainee, further research could be used to consolidate the number of employers actively recruiting apprentices and trainees, and also identify if there is a barrier that can be addressed to encourage more businesses to do so, considering the significant proportion that are reporting difficulty in recruiting skilled workers.
Newspaper (52.5%) and internet (37.8%) advertising were the most popular methods of sourcing candidates for vacancies, with recruitment agencies (34.4%) and Job Network (23.7%) not far behind. however the use of labour hire (13.3%) and Group Training organisations (12.1%) by responding employers was limited in comparison. future survey work would assist in determining if there are significant upward or downward trends in these proportions considering the complex dynamics at work in the labour market of continued economic expansion resulting in strong demand for labour in an environment of decreasing supply, and coupled with the recent Work Choices reforms implemented by the Australian Government.
The data from the survey indicates a quarter of responding employers would consider sponsoring a skilled migrant from overseas for a difficult to fill vacancy, and that 4.2% intended to seek a skilled migrant from overseas in the next six months. further, nearly a third of responding employers indicated they were “unsure” when asked if they would consider sponsoring an overseas skilled migrant. further research would be of value to ascertain whether better education and/or promotion of the migration program for employers is required.
In contrast to other recent research, the notion of an “ageing workforce” was not considered an issue by more than half of the respondents, with few having strategies in place for dealing with older workers. As this result is reflective of responding businesses and not necessarily representative of all Victorian businesses, further research may be required to ascertain how widespread this view is.
Considering the significant findings of the VECCI Victorian Skills Survey, and considerable public policy implications as well as the impact on business planning, here may be a case for an annual state wide survey to review trends and issues related to labour supply.
Key Policy Implications
Survey Key Findings and ActionsKey issues from the VECCI Survey:
Businesses are finding it difficult to find skilled workers.
A quarter of businesse have found it difficult to recruit an Australian Apprentice.
un-skilled and semi-skilled occupations have highest number of vacancies.
Skill shortages are having a significant negative impact on productivity.
The large majority of businesses do not believe or have considered how the ageing of the workforce will have an impact on them.
less than 5% of businesses plan to recruit a skilled migrant for a hard to fill position.
Regional areas are acutely more affected by skill and labour shortage than metropolitan areas.
Responses to Issues:Increase skill levels of workforce.
Improve take up of apprenticeships by making it more attractive for businesses and individuals.
Improve workforce participation.
Ensure businesses are aware of ageing workforce issues and how to plan for them.
Increase take up of skilled migrantion option to increase skilled workforce.
Ensure regional areas have access to training resources.
Ensure regional areas are able to attract increased population.
Public Policy Considerations
There are a number of shorter and longer term policy implications to be considered by Victorian and Australian Governments:
The take up of apprenticeships needs to be increased by addressing negative perceptions, encouraging adults into apprenticeships, offering financial support to apprentices to balance lower training wages, and reducing apprenticeship duration through the implementation of competency based assessments and completions, and greater use of Recognition of Prior learning arrangements.
1.
2.
3.
4.
5.
6.
7.
1.
2.
3.
4.
5.
6.
7.
–
The interaction of education, training and industry needs to be further integrated to ensure school leavers are provided with greater choice and better prepared for the transition to work. This interaction should focus on models that improve links between industry and schools, such as the Coburg Senior high School, where industry is a partner in the development of the curriculum and provides places for VET in Schools and Australian School Based Apprenticeships.
Mature aged workers must be able to access the training system that sufficiently recognise prior skills, and focus on retraining and re-skilling older workers in the workplace.
There is a need for a further increase in Victoria’s share of national migration in order to meet skills and labour gaps over the short to medium term. There also needs to be greater recognition of transition and settlement issues among migrants with appropriate support provided.
funding of the Victorian training system needs to respond to meet the growth in demand of skilled labour.
National reform of training system which impacts on licensing, mutual recognition of qualifications, outcomes based auditing of Registered Training organisations, intermediate qualifications, achievement of competency based completions of Australian Apprenticeships, and removal of barriers to School-based Apprenticeships need to be implemented in full.
Industry supports the Welfare to Work reforms and other initiatives to increase workforce participation, however risk issues for industry need to be addressed through the provision of work readiness programs for recipients in order to manage their effective transition to work.
The imbalance in supply of labour for regional centres needs to be addressed by inbound migration strategies.
The continuation of the economic prosperity of the last decade is dependent on ensuring that these challenges are met.
The results of the Survey will form the basis for discussion on skills and related issues leading up to the next Victoria Summit planned for November 2007.
–
–
–
–
–
–
–

VECCI VICTORIAN SKILLS SURVEY
��
Response RatesSurvey Response Rates
The 1,281 surveys available for analysis provided a response rate of 17.2% of the potential target group of 7,469 businesses on the VECCI database.
TABlE 1: Survey type and VECCI Membership
Are you a VECCI member?
Survey type
yes No Not Stated
Total
hard 545 194 51 790
online 235 121 135 491
Total 780 315 186 1281
Note that the survey results presented in this report are based on unweighted data and no assessment has been made as to how representative the survey respondents are of all businesses invited to complete the survey.
Non-response by question
All businesses did not answer every survey question, with all survey questions having some level of non-response. Individual question response rates are presented in Appendix II. Across questions, rates of non-response (referred to as “Not Stated” throughout this report) vary between 0.2% and 24.8%. The Not Stated category, showing the number and percentage of total businesses that did not respond to survey questions, has been included in all analyses in this report.
Business ProfileRegional Profile
All Victorian Statistical Divisions were represented in the survey results. fifty-eight percent of businesses have a primary business site located in the ABS Statistical Division of Melbourne, with the next highly represented Statistical Division being Barwon with 7.7% of businesses. All other Statistical Divisions were each represented by between 2.7 and 5 percent of businesses (Table 2).
Table 2: Number of businesses by Statistical Division
Statistical Division Count %
Barwon 98 7.7
Central highlands 63 5.0
East Gippsland 35 2.8
Gippsland 52 4.0
Goulburn 51 4.0
loddon 61 4.7
Mallee 41 3.2
Melbourne 745 58.2
ovens-Murray 53 4.1
Western District 35 2.7
Wimmera 37 2.9
unassigned* 9 0.7
Total 1279 100.0
Not Stated 2 0.2
* Postcode could not be assigned to Statistical Division.
Primary Business ActivityAll industry areas were represented by respondents with Manufacturing (15.0%) and Wholesale and Retail Trade (12.9%) being the two most highly represented.
The primary business activity “other” was reported by 14.4% of businesses. Ninety-five businesses reported their primary business activity as “other” but did not go on to specify an activity. “other” primary business activities, which were specified by businesses but not able to be allocated to one of the 17 listed industry areas, are listed in Appendix III. These included 14 (1.2%) businesses that specified their primary business activity as “Government”, “local Government”, or “local Government, admin”.
Table 3: Your Primary Business Activity:
Primary Business Activity
Count %
Manufacturing 180 15.0
Wholesale & Retail Trade 155 12.9
health and Community Services
125 10.4
Accommodation, Cafes and Restaurants
108 9.0
Construction 89 7.4
Transport and Storage 72 6.0
Property and Business Services
68 5.6
Metals and Engineering 49 4.1
Education 29 2.4
Agriculture, forestry and fishery
28 2.3
Recreational Services 28 2.3
Personal and other Services
27 2.2
Electricity, Gas and Water Supply
25 2.1
finance and Insurance 25 2.1
Communication Services 12 1.0
Mining 6 0.5
Cultural Services 5 0.4
Other, specified 78 6.5
Other, not specified 95 7.9
Total 1204 100.0
Not Stated 77 6.0
Results

VECCI VICTORIAN SKILLS SURVEY
��
Number of Staff
over half (56.5%) of the surveyed businesses responding employ between 1 and 20 staff (Table 4).
Table 4: How many staff do you currently employ?
Number of Staff Count %
1 - 20 staff 709 56.5
21 - 40 staff 219 17.5
41 - 99 staff 157 12.5
100 + staff 170 13.5
Total 1255 100.0
Not Stated 26 2.0
Staff Employed from Specified Groups
Eleven percent of businesses responding currently employ an Indigenous Australian, 89.5% a person over the age of 45, 20.3% persons with a physical or intellectual disability, and 52.1% of businesses currently employ culturally and linguistically diverse persons (Table 5).
Table 5: Do you currently employ staff from the following groups?
Response Indigenous Australians
Person aged 45 and over
Persons with a physical or intellectual disability
Culturally and linguistically diverse persons
Count % Count % Count % Count %
yes 128 11.3 1128 89.5 233 20.3 613 52.1
No 910 80.1 129 10.2 833 72.7 507 43.1
unsure 98 8.6 3 0.2 80 7.0 56 4.8
Total 1136 100.0 1260 100.0 1146 100.0 1176 100.0
Not Stated 145 11.3 21 1.6 135 10.5 105 8.2
Vacancies and Recruitment
Difficulties in Recruitment
Table 6 shows business responses to survey questions 5, 6, and 7 regarding recruitment difficulties.
Over half (52.6%) of the surveyed businesses found it difficult to recruit skilled people to vacancies over the past 6 months. Also, half of the surveyed businesses found it difficult to recruit experienced people to vacancies over the past 6 months.
While over half (54.5%) of the surveyed businesses indicated that they do not employ apprentices or trainees, of the 573 who do, 28.3% (162) found it difficult to recruit people to undertake an apprenticeship or traineeship with their business over the past 6 months.
Table 6: Over the past 6 months, have you found it difficult to recruit . . .
Response skilled people to vacancies?
experienced people to vacancies?
people to undertake an apprenticeship or traineeship with your business?
Count % Count % Count %
yes 664 52.6 640 50.7 162 12.9
No 351 27.8 403 31.9 411 32.6
NA 247 19.6 220 17.4 687 54.5
Total 1262 100.0 1263 100.0 1260 100.0
Not Stated 19 1.5 18 1.4 21 1.6

VECCI VICTORIAN SKILLS SURVEY
��
Action to RecruitAction taken to recruit in the past 6 months
Actions that responding businesses have taken to fill vacancies in the past 6 months are presented in Table 7.
The most popular actions taken by businesses in the past 6 months to fill vacancies were retraining current staff (42.0%) and advertising for a qualified tradesperson (34.9%). Just over 18% of businesses sought a mature aged worker (45+) to fill vacancies and 18.4% advertised for an apprentice or trainee.
over the past 6 months, 4.5% of businesses sought a skilled migrant (from overseas), and 4.1% employed a person with a disability with appropriate skills, to fill vacancies in their business.
Other actions that were not listed on the survey but were specified by businesses included filling vacancies by “word of mouth” or the “grapevine” (8 businesses).
Table 7: What actions have you taken to fill vacancies in your business?
Action taken in the past 6 months: Count %
Advertise for a qualified tradesperson 447 34.9
Advertise for an apprentice or trainee 236 18.4
Seek a skilled migrant (from overseas) 58 4.5
Seek a mature aged worker (45+) 237 18.5
Employ a person with a disability with appropriate skills
52 4.1
Recruit a School Based New Apprentice 103 8.0
Retrain current staff 538 42.0
other 130 10.1
Action intending on taking in the next 6 months
Actions that responding businesses are planning on taking to fill vacancies in the next 6 months are presented in Table 8.
The most popular actions that businesses intend to take in the next 6 months to fill vacancies are retraining current staff (43.1%) and advertising for a qualified tradesperson (27.3%). Just over 16% of businesses are intending to seek a mature aged worker (45+) to fill vacancies and 16.3% are intending to advertise for an apprentice or trainee.
In the next 6 months, 4.8% of businesses intend to employ a person with a disability with appropriate skills to fill vacancies in their business, and 4.2% intend to seek a skilled migrant (from overseas) to fill vacancies in their business.
Other actions that were not listed on the survey but were specified by businesses included filling vacancies by “word of mouth” (3 businesses).
Table 8: What actions do you intend to take to fill vacancies in your business?
Action intend to take in the next 6 months: Count %
Advertise for a qualified tradesperson 350 27.3
Advertise for an apprentice or trainee 209 16.3
Seek a skilled migrant (from overseas) 54 4.2
Seek a mature aged worker (45+) 211 16.5
Employ a person with a disability with appropriate skills
62 4.8
Recruit a School Based New Apprentice 95 7.4
Retrain current staff 552 43.1
other 100 7.8
Recruitment SourcesRecruitment sources used in the past 6 months
Recruitment sources used by responding businesses to fill vacancies in the past 6 months are presented in Table 9.
The most popular recruitment source used by more than half (52.5%) of the surveyed businesses to fill vacancies in the past 6 months was newspaper advertisements. other popular recruitment sources included Internet advertisements (37.8%), recruitment agencies (34.4%), and Job Network providers (23.7%). labour hire agencies were used by 13.3 % of businesses and 12.1% of businesses used a Group Training Company.
Other recruitment sources, not listed on the survey but specified by businesses, included filling vacancies by “word of mouth” (25 businesses) or “advertising internally” (4 businesses).

VECCI VICTORIAN SKILLS SURVEY
��
Table 9: What recruitment sources have you used to fill vacancies in your business?
Recruitment Source Count %
Job Network Provider 303 23.7
Recruitment Agency 441 34.4
labour hire Agency 171 13.3
Group Training Company
155 12.1
Newspaper Advertisement
672 52.5
Internet Advertisement 484 37.8
other 135 10.5
Recruitment sources intended to use in the next 6 months
Recruitment sources intended to be used by responding businesses to fill vacancies in the next 6 months are presented in Table 10.
The most popular recruitment sources intended to be used by businesses to fill vacancies in the next 6 months were newspaper advertisements (42.3%). other popular recruitment sources included Internet advertisements (34.3%), recruitment agencies (25.5%), and Job Network providers (17.6%). Just over 10% of businesses intend to use a labour hire agency and 8.7% a Group Training Company.
other intended recruitment sources, not listed on the survey but specified by businesses, included filling vacancies by “word of mouth” (17 businesses) or “advertising internally” (4 businesses).
Table 10: What recruitment sources do you intend to use to fill vacancies in your business?
Recruitment source Count %
Job Network Provider 226 17.6
Recruitment Agency 327 25.5
labour hire Agency 137 10.7
Group Training Company 112 8.7
Newspaper Advertisement 542 42.3
Internet Advertisement 439 34.3
other 117 9.1
Vacanciesquestion 10 of the survey asked businesses how many vacancies they currently have for skilled and apprentice/trainee positions.
Businesses were given a selection of occupations that were predominately taken from the Migration occupation in Demand list compiled by the Department of Employment and Workplace Relations (DEWR). These occupations have a high shortage of workers or unfilled vacancies.
for the purposes of the survey, a skilled vacancy was defined as a position available for a qualified and/or experienced tradesperson or professional. An apprentice/trainee vacancy was defined as a position available for an un-skilled/un-qualified person to undertake training to acquire skills and/or qualifications.
A summary of all business responses to question 10 are provided in Table 11 in appendix IV.
Businesses were also asked to identify any additional occupations (not specified in the table at question 10) that may be relevant to their business. Where the sum of vacancies for any of these additional occupations totalled 5 or more, the individual occupations have been included in their relative industry grouping in Table 11. for example: “Takeaway” and “Wait Staff/Waiter” have been added to the industry grouping A. Accommodation, Café, Restaurant.
Where the sum of vacancies for any of these additional occupations were less than 5, they are totalled in Table 11 at “S. oThER SPECIfIED (<5 vacancies)” and listed individually in Appendix IV.
Skilled Vacancies
Responding businesses reported 1,845 skilled vacancies. A summary of reported skilled vacancies by industry is presented in Table 12. Industries with more than 5% of total reported skilled vacancies were:
Transport and Storage, 16.4% (302 vacancies);
health and Community Services, 11.3% (209);
Metal and Engineering, 10.5% (194);
Wholesale and Retail Trade, 8.3% (154);
Manufacturing, 7.2% (132);
Electricity, Gas & Water Supply, 6.3% (117); and
Accommodation, Cafés and Restaurants, 5.5% (102).
–
–
–
–
–
–
–
Table 12:
Skilled Vacancies by Industry
Industry Number of Skilled Vacancies
% of Total Skilled
A. Accommodation, Cafe, Restaurant
102 5.5
B. Agriculture, forestry & fishery
20 1.1
C. Communication Services
32 1.7
D. Construction 59 3.2
E. Cultural Services 6 0.3
f. Education 30 1.6
G. Electricity, Gas & Water Supply
117 6.3
h. finance & Insurance
41 2.2
I. health and Community Services
209 11.3
J. Manufacturing 132 7.2
K. Metal and Engineering
194 10.5
l. Mining 2 0.1
M. Personal and other Services
11 0.6
N. Property and Business Services
79 4.3
o. Recreational Services
20 1.1
P. Transport and Storage
302 16.4
q. Wholesale and Retail Trade
154 8.3
R. other occupations 110 6.0
S. Other Specified 225 12.2
Total 1845
100.0
VECCI VICTORIAN SKILLS SURVEY
��
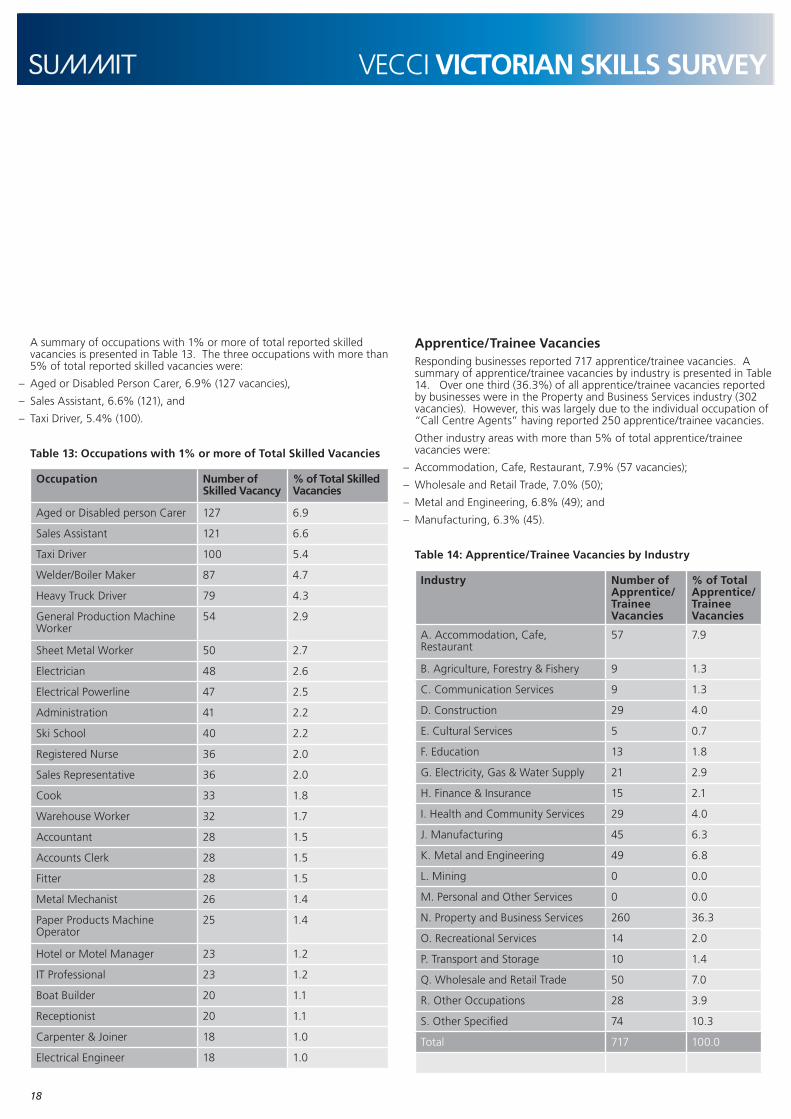
A summary of occupations with 1% or more of total reported skilled vacancies is presented in Table 13. The three occupations with more than 5% of total reported skilled vacancies were:
Aged or Disabled Person Carer, 6.9% (127 vacancies),
Sales Assistant, 6.6% (121), and
Taxi Driver, 5.4% (100).
Table 13: Occupations with 1% or more of Total Skilled Vacancies
Occupation Number of Skilled Vacancy
% of Total Skilled Vacancies
Aged or Disabled person Carer 127 6.9
Sales Assistant 121 6.6
Taxi Driver 100 5.4
Welder/Boiler Maker 87 4.7
heavy Truck Driver 79 4.3
General Production Machine Worker
54 2.9
Sheet Metal Worker 50 2.7
Electrician 48 2.6
Electrical Powerline 47 2.5
Administration 41 2.2
Ski School 40 2.2
Registered Nurse 36 2.0
Sales Representative 36 2.0
Cook 33 1.8
Warehouse Worker 32 1.7
Accountant 28 1.5
Accounts Clerk 28 1.5
fitter 28 1.5
Metal Mechanist 26 1.4
Paper Products Machine operator
25 1.4
hotel or Motel Manager 23 1.2
IT Professional 23 1.2
Boat Builder 20 1.1
Receptionist 20 1.1
Carpenter & Joiner 18 1.0
Electrical Engineer 18 1.0
–
–
–
Apprentice/Trainee VacanciesResponding businesses reported 717 apprentice/trainee vacancies. A summary of apprentice/trainee vacancies by industry is presented in Table 14. over one third (36.3%) of all apprentice/trainee vacancies reported by businesses were in the Property and Business Services industry (302 vacancies). however, this was largely due to the individual occupation of “Call Centre Agents” having reported 250 apprentice/trainee vacancies.
other industry areas with more than 5% of total apprentice/trainee vacancies were:
Accommodation, Cafe, Restaurant, 7.9% (57 vacancies);
Wholesale and Retail Trade, 7.0% (50);
Metal and Engineering, 6.8% (49); and
Manufacturing, 6.3% (45).
Table 14: Apprentice/Trainee Vacancies by Industry
Industry Number of Apprentice/Trainee Vacancies
% of Total Apprentice/Trainee Vacancies
A. Accommodation, Cafe, Restaurant
57 7.9
B. Agriculture, forestry & fishery 9 1.3
C. Communication Services 9 1.3
D. Construction 29 4.0
E. Cultural Services 5 0.7
f. Education 13 1.8
G. Electricity, Gas & Water Supply 21 2.9
h. finance & Insurance 15 2.1
I. health and Community Services 29 4.0
J. Manufacturing 45 6.3
K. Metal and Engineering 49 6.8
l. Mining 0 0.0
M. Personal and other Services 0 0.0
N. Property and Business Services 260 36.3
o. Recreational Services 14 2.0
P. Transport and Storage 10 1.4
q. Wholesale and Retail Trade 50 7.0
R. other occupations 28 3.9
S. Other Specified 74 10.3
Total 717 100.0
–
–
–
–

VECCI VICTORIAN SKILLS SURVEY
��
A summary of occupations with 1% or more of total reported apprentice/trainee vacancies is presented in Table 15. over one third (34.9%) of total apprentice/trainee vacancies were for the occupation of Call Centre Agent (250 vacancies). other occupations with more than 2% of total apprentice/trainee vacancies include:
Aged or Disabled Person Carer, 3.1% (22 vacancies); and
Welder/Boiler Maker, 3.1% (22).
Table 15: Occupations with 1% or more of Total Apprentice/Trainee Vacancies
Occupation Apprentice/Trainee Vacancy
% of Total Apprentice/Trainee
Call Centre agents 250 34.9
Aged or Disabled person Carer 22 3.1
Welder/Boiler Maker 22 3.1
General Production Machine Worker
14 2.0
Sales Assistant 14 2.0
Cook 13 1.8
Paper Products Machine operator 13 1.8
Administration 12 1.7
Sheet Metal Worker 12 1.7
Electrician 10 1.4
Marine Diesel Mechanic 10 1.4
Principal 10 1.4
Accountant 9 1.3
Carpenter & Joiner 9 1.3
fibrous Plasterer 9 1.3
Electrical Powerline Tradesperson 8 1.1
Receptionist 8 1.1
Aquaculture Farmer 7 1.0
fitter 7 1.0
Sport Coach 7 1.0
–
–
Business Impact / Skill Related IssuesImpact of Skill Shortages on Productivity
over half of the responding businesses (58.4%) indicated that current skill shortages were having a negative impact on the productivity of their business, with 10.7% reporting a very negative impact (Table 16).
Nearly 4 in 10 (39.4%) businesses reported that current skill shortages were having no impact on their productivity. Two percent of businesses indicated that current skill shortages were having a positive impact on their productivity.
Table 16:
What impact, if any, are skill shortages having on the productivity of your business?
Impact Count %
Very negative 126 10.7
Slightly negative 560 47.7
No impact 462 39.4
Slightly positive 21 1.8
Very positive 5 0.4
Total 1174 100.0
Not Stated 107 8.4
Skilled Migration Sixteen percent of respondents indicated that they would consider sponsoring an overseas worker. over half (52.1%) of the surveyed businesses responding said that while they have been unable to fill a vacancy in their business, they would not consider sponsoring an overseas worker; while 16.3% said they would (Table 17). Nearly a third (31.6%) of businesses said that they were unsure.
Table 17: I have been unable to fill a vacancy in my business, and I would consider sponsoring an overseas worker.
Response Count %
yes 163 16.3
No 520 52.1
unsure 315 31.6
Total 998 100.0
Not Stated 283 22.1

VECCI VICTORIAN SKILLS SURVEY
�0
Nearly a quarter (24.3%) of businesses responding said that while they do not have any difficulty recruiting for vacancies in their business they would still consider sponsoring an overseas worker (Table 18). forty-four percent of businesses said they would not, and nearly one third (31.7%) said that they were unsure.
Table 18:
I don’t have any difficulty recruiting for vacancies in my business but would consider sponsoring an overseas worker if I did.
Response Count %
yes 234 24.3
No 424 44.0
unsure 305 31.7
Total 963 100.0
Not Stated 318 24.8
Type of TrainingTraining undertaken in the past 6 months
The types of training undertaken by responding businesses in the past 6 months are presented in Table 19.
Non-accredited training (provided in the workplace) was a popular choice for businesses, with 56.5% of businesses undertaking this type of training in the past 6 months. Nearly a quarter (22.8%) of businesses undertook non-accredited off the job training (at a provider location) in the past 6 months.
over a third (39.4%) of businesses undertook accredited training (provided in the workplace) in the past 6 months with 33.9% undertaking accredited off the job training (at a provider location).
In the past 6 months, employer sponsored/supported undergraduate learning was undertaken by 13.3% of businesses and 11.7% of businesses undertook employer sponsored/supported postgraduate learning.
Just over two percent (2.4%) of businesses indicated that they undertook other unspecified training in the past 6 months.
Table 19: Please indicate the type of training undertaken in your business in the past 6 months.
Type of training Count %
Non-accredited training (provided in the workplace) 724 56.5
Accredited training (provided in the workplace) 505 39.4
Non-accredited off the job training (at provider location) 292 22.8
Accredited off-the-job training (at provider location) 434 33.9
Employer sponsored/supported undergraduate learning (degree level) 171 13.3
Employer sponsored/supported postgraduate learning 150 11.7
other 31 2.4

VECCI VICTORIAN SKILLS SURVEY
��
Training planned to be undertaken in the next 6 months
The types of training responding businesses plan to undertake in the next 6 months are presented in Table 20.
Just over half (50.9%) of the surveyed businesses plan to undertake non-accredited training (provided in the workplace) in the next 6 months and 22.4% plan to undertake non-accredited off the job training (at a provider location).
Accredited training (provided in the workplace) is planned to be provided by 37.2% of businesses in the next 6 months, with a third of businesses planning to undertake accredited off the job training (at a provider location).
In the next 6 months, 11.6% of businesses plan to undertake employer sponsored/supported undergraduate learning with a similar number (11.5%) of businesses planning to undertake employer sponsored/supported postgraduate learning.
Table 20: Please indicate the type of training that you plan to undertake in the next 6 months.
Type of training Count %
Non-accredited training (provided in the workplace) 652 50.9
Accredited training (provided in the workplace) 477 37.2
Non-accredited off the job training (at provider location) 287 22.4
Accredited off-the-job training (at provider location) 426 33.3
Employer sponsored/supported undergraduate learning (degree level) 149 11.6
Employer sponsored/supported postgraduate learning 147 11.5
other 23 1.8
over 50% of employers undertake non-accredited training in the workplace.
These skills should be formally recognised to assist the upskilling of existing workers through effective and efficient RPL processes and lead to nationally recognised qualifications.
42% of employers nominated staff retraining to fill a vacancy in their business. This emphasises the importance of providing Australian Apprenticeships, as well as accredited training at Certificate III and IV level to existing workers.
It also means that if employers are looking to meet their skill needs from within their existing workforce, it could increase the challenge for new entrants, particularly, W2W job seekers from entering the labour market.
Workforce DemographicsKnowledge of the Term “Ageing Workforce”
Table 21 shows business responses to question 14 regarding knowledge of the term “Ageing Workforce”.
Nearly all (98.8%) businesses consider themselves to have some knowledge of the term “Ageing Workforce” with over half (56.7%) rating their knowledge as “good”, 20.0% as “strong” and 22.1% as “limited”.
only 1.2% of responding businesses indicated that they had no knowledge of the term “Ageing Workforce”.
Table 21: How would you rate your knowledge of the term “Ageing Workforce”?
Response Count %
None 14 1.2
limited 254 22.1
Good 653 56.7
Strong 230 20.0
Total 1151 100.0
Not stated 130 10.1
Affect of Ageing Workforce on Business
Table 22 shows business responses to question 15 regarding the affect of an ageing workforce on their business.
Nearly two thirds (63.7%) of businesses believe that an ageing workforce is not having a direct affect on their business. In contrast, over one third (34.0%) of businesses consider that an ageing workforce was having a direct affect on their business. Just over 2% of businesses said both “yes” and “No” (i.e. agreeing and disagreeing for different reasons).
Table 22: Do you believe an ageing workforce is having a direct affect on your business?
Response Count %
yes 369 34.0
No 691 63.7
yes & No 24 2.2
Total 1084 100.0
Not Stated 197 15.4

VECCI VICTORIAN SKILLS SURVEY
��
Yes an issue
The 369 businesses that did believe an ageing workforce was having a direct affect on their business were then asked to clarify in what way they believed an ageing workforce is likely to be an issue in the future.
The most frequent theme of response, referred to by 16.8% (60) of businesses, was that they believed an ageing workforce is likely to be an issue in the future because they valued the characteristics of aged workers. These characteristics included being: experienced, honest, knowledgeable, loyal, mature, reliable, supportive, trustworthy, and having a strong work ethic.
other popular themes, each referred to by 5 or more businesses include:
skill shortages, 11.1% (41 businesses);
the business has a high aged workforce / an aging workforce, 6.0% (22);
many jobs require a degree of fitness and mobility, 5.7% (21);
the aged are not as accepting of change, 3.0% (11);
the young have a poor work ethic, 2.7% (10);
the aged are “retiring” already, 2.2% (8);
the aged take experience when they go, 1.6% (6);
increasing costs of aged workers, 1.4% (5); and
difficult to attract young staff to the business, 1.4% (5).
–
–
–
–
–
–
–
–
–
No, not an issue
The 691 businesses that did not believe that an ageing workforce was having a direct affect on their business were then asked if they think an ageing workforce is likely to be an issue in the future. Reponses from businesses are summarised in Table 23 in appendix VI.
of those employers that responded no, the most common reasons give include:
“We value the characteristics of older workers” 6.9% (48)
“We employ a balanced workforce” 4.6% (32) and
“age has no impact” 2.6% (18)
Some employers recognised that while it wasn’t having an impact right now, they commented that it could in the future. Comments include:
yes, in the future “as the impact of skill shortages increases” (5)
Possibly, in the future “but not yet” 2% (14)
Recruiting &/or Retaining older Workers
Nearly three quarters (74.7%) of businesses responding indicated that they were recruiting and/or retaining older workers (45years+) and 11.7% indicated that they were not (Table 24).
Table 24: Are you recruiting and/or retaining older workers (45+)?
Response Count %
yes 864 74.7
No 135 11.7
Not applicable/unsure 157 13.6
Total 1156 100.0
Not Stated 125 9.8
–
–
–
–
–
–
The 864 businesses that are recruiting and/or retaining older workers (45years+) were then asked if this is because they have had difficulties in recruiting younger people (under 45). Business responses are presented in Table 25.
Nearly three quarters (73.5%) of businesses responded “No”, that it was not because they had difficulties in recruiting younger people. Nearly one quarter (23.5%) responded “Yes” it was.
Table 25: If yes, is this because you have had difficulties in recruiting younger people (under 45)?
Response Count %
yes 200 23.5
No 626 73.5
Not applicable / unsure 26 3.1
Total 852 100.0
Not Stated 12 1.4

VECCI VICTORIAN SKILLS SURVEY
��
Training Opportunities Regardless of Age
Most businesses responding offer training/retraining opportunities to all staff regardless of age (83.6%) while just over five percent (5.3%) of businesses do not (Table 26).
Table 26: Do you offer training/retraining opportunities to all staff regardless of age?
Response Count %
yes 965 83.6
No 61 5.3
Not applicable (Do not offer training)
128 11.1
Total 1154 100.0
Not Stated 127 9.9
Age Profile of Business
Nearly two thirds (62.9%) of businesses responding have not conducted an age profile of their business. Just over 1 in 5 (20.9%) businesses have conducted an age profile of their business (Table 27).
Table 27: Have you conducted an age profile of your business?
Response Count %
yes 241 20.9
No 727 62.9
Not applicable/unsure 187 16.2
Total 1155 100.0
Not Stated 126 9.8
Retirement Intentions of older Workers
The proportion of businesses aware of the retirement intentions of their older workers is approximately the same as the proportion of businesses that are not (40.9% aware, 41.6% not aware) (Table 28).
Table 28: Are you aware of the retirement intentions of your older workers?
Response Count %
yes 472 40.9
No 481 41.6
Not applicable /unsure 202 17.5
Total 1155 100.0
Not Stated 126 9.8
of the 472 businesses that are aware of the retirement intentions of their older workers, nearly 85% have analysed the effects of these intentions on their business/organisation and 13.6% have not (Table 29).
Table 29: If yes, have you analysed the effects of these intentions on your business/organisation?
Response Count %
yes 394 84.9
No 63 13.6
Not Applicable / unsure 7 1.5
Total 464 100.0
Not Stated 8 1.7
Although nearly 99% of responding businesses reported having at least a limited awareness of the “ageing workforce”, two thirds reported that it was not having an impact on their business with 40.9% are aware of the retirement intentions of their older workers.
90% of businesses have a worker aged 45 or over, and therefore nearly all businesses will be affected to some degree by the ageing of the workforce. (Based on current average age of retirement of 58 source, ABS)
While the ageing welfare may not pose a problem for some Victorian businesses however, it is an issue that will have with time wider impacts. Considering that recent research has shown that Victoria will face a shortfall of 50,000 workers by 2010, and 90% of responding businesses have employees 45 or over, it is important that more businesses are aware of and analyse the affects of the retirement plans of their older workers.
The next step will be to assist business in preparing for the impact of the retirement of their older workers by providing strategies to minimise the loss of valued skills and knowledge.
Comparison of findings to other Research
There have been a number of employer surveys conducted recently that have collected similar information to the Victorian Skills Survey conducted by VECCI. Due to different methodologies, question wording and response codes, there are no directly comparable data items between the surveys. however, in the discussion section of this report, relevant findings from these surveys have been compared with the key messages found in the VECCI Survey and comments made on similarities and differences in these themes.

VECCI VICTORIAN SKILLS SURVEY
��
Australian Bureau of Statistics (2001-02), Employer Training Expenditure and Practices, catalogue number 6362.0, available from http://www.abs.gov.au/AuSSTATS/[email protected]/DetailsPage/6362.02001-02?openDocument (accessed 9 August 2006)
Australian Bureau of Statistics (June 2004), Australian Bureau of Statistics Business Register – Counts of Businesses – Summary Tables, catalogue number 8161.0.55.001, available from http://abs.gov.au/AuSSTATS/[email protected]/DetailsPage/8161.0.55.001Jun%202004?openDocument (accessed June 2004)
Australian Industry Group (2006), World Class Skills for World Class Industries – Employers’ perspectives on skilling in Australia, available from http://www.aigroup.asn.au/scripts/cgiip.exe/WService=aigroup/ccms.r?pageID=963 (accessed 9 May 2006)
Department of Employment and Workplace Relations (DEWR), Skills in Demand Lists – States and Territories – 2006, available from www.workplace.gov.au/NR/rdonlyres/Bf83E4CC-1E8f-4630-95C7-D9f3A6108A9A/0/SkillsinDemandMarch2006.pdf (accessed June 2004)
NCVER (2005),
Australian vocational education and training statistics: Employers’ use and views of the VET system 2005 – Summary. Adelaide: NCVERVictorian Employers’ Chamber of Commerce and Industry (2003), Employer Spending on Education and Training, available from VECCI (accessed June 2004)
References

VECCI VICTORIAN SKILLS SURVEY
��
Survey questionnaire
Appendix I
VECCI Victorian Skills Register
The Victorian Employers’ Chamber of Commerce and Industry (VECCI) is seeking information on your business to assist in informing Government on the needs of your region and industry in meeting skilled labour requirements, now and into the future. The data collected from this survey will form the Victorian Skills Register, which will identify where skill shortages are impacting on business. This will allow VECCI to develop practical solutions that assist you to build a competitive workforce.
The information you provide will be kept strictly confidential and only aggregated data will be reported.
BUSINESS PROFIlE
1. What postcode is your primary business site located in?
2. Your primary business activity:
Accommodation, café, restaurant
Agriculture, forestry and fishery
Communication services
Construction
Cultural Services
Education
Electricity, gas and water supply
finance and insurance
health and community services
Manufacturing
Metals and engineering
Mining
Personal and other services
Property and business services
Recreational services
Transport and storage
Wholesale & Retail trade
other, please specify __________________
3. How many staff do you currently employ?
1 – 20 staff 21 – 40 staff 41 – 99 staff 100+ staff
4. Do you currently employ staff from the following groups?:
A. Indigenous Australians yes No unsure
B. Persons aged 45 and over yes No unsure
C. Persons with a physical or intellectual disability yes No unsure
D. Culturally and linguistically diverse persons yes No unsure

VECCI VICTORIAN SKILLS SURVEY
��
Survey questionnaire
VACANCIES AND RECRUITMENT
5. Over the past 6 months, have you found it difficult to recruit skilled (person with a qualification) people to fill vacancies?
yes No Not applicable
6. Over the past 6 months, have you found it difficult to recruit experienced (competent without a qualification) people to fill vacancies?
yes No Not applicable
7. Over the past 6 months, have you found it difficult to recruit people to undertake an apprenticeship or traineeship with your business?
yes No Not applicable
8. What actions have you taken, or do you intend to take, to fill vacancies in your business?: (please tick relevant boxes)
In the past 6 months In the next 6 months
Advertise for a qualified tradesperson Advertise for an apprentice or trainee Seek a skilled migrant (from overseas) Seek a mature aged worker (45+) Employ a person with a disability with appropriate skills Recruit a School Based New Apprentice Retrain current staff other (please specify) ___________________________
9. What recruitment sources have you used, or do you intend to use, to fill vacancies in your business?: (tick relevant boxes)
In the past 6 months In the next 6 months
Job Network Provider Recruitment Agency labour hire Agency Group Training Company Newspaper Advertisement Internet Advertisement other (please specify) ___________________________

VECCI VICTORIAN SKILLS SURVEY
��
Survey questionnaire10. How many vacancies does your business have for skilled and apprentice/trainee positions?
Please complete the table below by writing in the boxes the number of skilled or apprentice/trainee vacancies you have for each relevant occupation – a vacancy may not be in your industry category, so please complete for as many categories as is relevant.
Skilled vacancy = position available for a qualified and/or experienced tradesperson or professional.Apprentice/trainee vacancy = position available for an unskilled/unqualified person to undertake training to aquire skills and/or qualificationThis is not a comprehensive list. If the vacancy you have isn’t listed, write the details in the column titled “other”
Industry
Skill
ed V
acan
cy
App
rent
ice/
Tr
aine
e Va
canc
y Industry
Skill
ed V
acan
cy
App
rent
ice/
Tr
aine
e Va
canc
y Industry
Skill
ed V
acan
cy
App
rent
ice/
Tr
aine
e Va
canc
y Industry
Skill
ed V
acan
cy
App
rent
ice/
Tr
aine
e Va
canc
y
Accommodation, café, restaurant
Education Metal & Engineering Transport & storage
hotel or Motel Manager Principal fitter heavy Truck Driver
head Chef School Teacher Metal Machinist Train Driver
Cook university lecturer Sheet Metal Worker Bus Driver
Baker Vocational Education Teacher Welder/ Boiler Maker Ship Engineer and Masters
Pastry Cook Special Needs Teacher Tool Maker Warehouse Worker
Agriculture, forestry & fishery
Electricity, gas & water supply Mining Wholesale & Retail trade
forester Electrical Engineer Mining Engineer Butcher
Paper Mill operator Electrical Powerline Tradesperson
Extractive Metallurgist florist
Aquaculture Farmer Cable Joiner Chemist Retail Buyer
livestock farmer Power Generation Plant operator
Production Manager Visual Merchandiser
Crop farmer Electrician Blasting Worker Sales Assistant
Communication services
finance & insurance Personal & other services
Wholesale & Retail trade Cont
IT Systems Manager financial Investment Adviser hairdresser Motor Vehicle Parts Interpreter
IT Professional Accountant Beauty Therapist Vehicle painter
Electronics Engineer Insurance Clerk Retail Pharmacist Motor mechanic
Electronic Equipment Tradesperson
Interpreter Automotive Electrician
Communications linesperson
Construction health & community services Property & business services
other occupations
Plumber Director of Nursing Public Relations Officer Administration
Carpenter & Joiner occupational Therapist Marketing Specialist Receptionist
Bricklayer Registered Nurse Sales Representative Personal Assistant
fibrous Plasterer Child Care Coordinator Real Estate Salesperson Payroll Clerk
Roof Slater and Tiler Aged or Disabled person Carer Security Officer Accounts Clerk
Cultural Services Manufacturing Recreational services other
Journalist Textile & footwear Machine operator
fitness Instructor
Copywriter Paper Products Machine operator
outdoor Adventure leader
Museum or Gallery Attendant
Plastics Production Machine operator
Sport Coach
film and Video Editor Meat and fish Process Worker Sports Administrator
Event Management General Production Machine operator
Travel Agent

VECCI VICTORIAN SKILLS SURVEY
��
Survey questionnaire
BUSINESS IMPACT/ SKIll RElATED ISSUES
11. What impact, if any, are current skills shortages having on the productivity of your business:
Very negative Slightly negative No impact Slightly positive Very positive
12. The Commonwealth Government’s Skilled Migration program allows employers to recruit skilled workers from overseas where they have been unable to fill a vacancy through local recruitment or their own training programs.
As an employer, would you consider sponsoring a skilled non-Australian under the Skilled Migration Program in order to fill a vacancy in your business on a temporary or permanent basis?
I have been unable to fill a vacancy in my business and I would consider sponsoring and overseas worker. yes No unsure
I don’t have any difficulty recruiting for vacancies in my business but yes No unsure
would consider sponsoring an overseas worker if I did.
13. Please indicate the type of training undertaken in your business in the past 6 months, and those you plan to undertake in the next 6 months.
(Accredited training leads to the attainment of a recognised qualification ranging from Certificate I – IV or Diploma or Advanced Diploma)
Past 6 months Next 6 months
Non-accredited training (provided in the workplace) Accredited training (provided in the workplace) Non-accredited off the-job training (at provider location) Accredited off-the-job training (at provider location) Employer sponsored/supported undergraduate learning (degree level) Employer sponsored/supported postgraduate learning other (Please specify) __________________________________
WORKFORCE DEMOGRAPHICS
14. How would you rate your knowledge of the term “Ageing Workforce”?
None limited Good Strong
15. Do you believe an ageing workforce is having a direct affect on your business?
yes– in what way? (Please provide a brief explanation)
No – do you think it is likely to be an issue in the future? (Please provide a brief explanation)

VECCI VICTORIAN SKILLS SURVEY
��
Survey questionnaire
16. Are you recruiting and/or retaining older workers (45+)?
yes No Not applicable/ unsure
17. If yes, is this because you have had difficulties in recruiting younger people (under 45)?
yes No
18. Do you offer training/retraining opportunities to all staff regardless of age?
yes No Not applicable (Do not offer training)
19. Have you conducted an age profile of your business?
yes No Not applicable/ unsure
20. Are you aware of the retirement intentions of your older workers?
yes Not applicable
21. If yes, have you analysed the effects of these intentions on your business/organisation?
yes No

VECCI VICTORIAN SKILLS SURVEY
�0
Non-response to Individual Questions
All businesses did not answer all survey questions with all questions having some level of non-response. Individual question response rates are presented in Table 35.
Table 31: Not Stated Analysis
Survey Question Number
Count of Not Stated
% of Total
1 2 0.2
2 77 6.0
3 26 2.0
4, part a 145 11.3
4, part b 21 1.6
4, part c 135 10.5
4, part d 105 8.2
5 19 1.5
6 18 1.4
7 21 1.6
11 107 8.4
12, part a 283 22.1
12, part b 318 24.8
14 130 10.1
15 197 15.4
16 125 9.8
17 12 1.4
18 127 9.9
19 126 9.8
20 126 9.8
21 8 1.7
Appendix II

VECCI VICTORIAN SKILLS SURVEY
��
Primary Business Activity Count of Businesses
Balloon Decorating 1
biotech/ environmental ind inst supp 1
Business Association 1
Business Equipment 1
Business Tourism Assoc 1
call centre 1
coastal management 1
Commercial laundry & Dry-cleaning 1
community 1
consultant 1
Day Spa/ Natural Spring 1
Design/Manufacturing 1
Distribution of health Pr 1
Drafting Service 1
Earth/ Snow moving 1
electrical contracting 1
Electrical Contractors 1
electronic service 1
engineering 1
Erosion Control 1
ex service club 1
Export 1
fire services 1
flying charter & training 1
furniture upholster 1
Government 1
health & lifestyle service 1
higher Education Support 1
import 1
Importing 1
Industrial laundry 1
industrial sales & service 1
Industry organisation 1
Primary Business Activity Count of Businesses
Interactive Entertainment 1
IT 2
Jeweller 1
lab prod - precious metal 1
local government 12
local government, admin 1
Mechanical repairs 1
Mechanical Repairs 1
Monumental stonemasons 1
Natural Resource Management 1
Natural Resource Management 1
Office M/C Service & Sale 1
optical 1
postal services 1
power line industry 1
primary producer 1
print broking 1
reception & function centre 1
rental 1
Res Prop Develop 1
Residential home 1
Retail pool sales 1
Retirement village 1
Sales training 1
Security 2
Security & locksmithing 1
Service 1
service provider disability 1
Speciality retailer 1
steel distribution 1
Weddings/functions 1
Welfare 1
Total 78
Appendix III Other Primary Business Activities
Over eighty-five percent of businesses were able to identify their primary business activity as being within one of 17 listed areas at question 2 of the survey.
“Other” primary business activities, which were specified by businesses but not able to be allocated to one of the 17 listed industry areas, are listed in Table 36.
Table 32: Other Primary Business Activities

VECCI VICTORIAN SKILLS SURVEY
��
Industry Number of Skilled Vacancies
% of Total Skilled Vacancies
Number of Apprentice/ Trainee Vacancies
% of Total Apprentice/ Trainee Vacancies
A. ACCoMoDATIoN, CAfE, RESTAuRANT 6 0.3 25 3.5
hotel or Motel Manager 23 1.2 4 0.6
head Chef 13 0.7 5 0.7
Cook 33 1.8 13 1.8
Baker 7 0.4 6 0.8
Pastry Cook 4 0.2 2 0.3
Take away 8 0.4 0 0.0
Wait Staff / Waiter 8 0.4 2 0.3
Sub-Total A 102 5.5 57 7.9
B. AGRICulTuRE, foRESTRy & fIShERy 3 0.2 0 0.0
forester 0 0.0 1 0.1
Paper Mill operator 1 0.1 0 0.0
Aquaculture Farmer 10 0.5 7 1.0
livestock farmer 2 0.1 0 0.0
Crop farmer 4 0.2 1 0.1
Sub-Total B 20 1.1 9 1.3
C. CoMMuNICATIoN SERVICES 0 0.0 1 0.1
IT Systems Manager 5 0.3 2 0.3
IT Professional 23 1.2 0 0.0
Electronics Engineer 1 0.1 3 0.4
Electronic Equipment Tradesperson 3 0.2 3 0.4
Communications linesperson 0 0.0 0 0.0
Sub-Total C 32 1.7 9 1.3
D. CoNSTRuCTIoN 0 0.0 0 0.0
Plumber 17 0.9 6 0.8
Carpenter & Joiner 18 1.0 9 1.3
Bricklayer 7 0.4 2 0.3
fibrous Plasterer 13 0.7 9 1.3
Roof Slater and Tiler 4 0.2 3 0.4
Sub-Total D 59 3.2 29 4.0
E. CulTuRAl SERVICES 0 0.0 0 0.0
Journalist 2 0.1 1 0.1
Copywriter 0 0.0 0 0.0
Museum or Gallery Attendant 2 0.1 2 0.3
film and Video Editor 0 0.0 0 0.0
Event Management 2 0.1 2 0.3
Sub-Total E 6 0.3 5 0.7
Appendix IV Vacancies for skilled and apprentice/trainee positions by IndustryTable 11: How many vacancies does your business have for skilled and apprentice/trainee positions?

VECCI VICTORIAN SKILLS SURVEY
��
Industry Number of Skilled Vacancies
% of Total Skilled Vacancies
Number of Apprentice/ Trainee Vacancies
% of Total Apprentice/ Trainee Vacancies
f. EDuCATIoN 0 0.0 0 0.0
Principal 6 0.3 10 1.4
School Teacher 9 0.5 3 0.4
university lecturer 5 0.3 0 0.0
Vocational Education Teacher 9 0.5 0 0.0
Special Needs Teacher 1 0.1 0 0.0
Sub-Total f 30 1.6 13 1.8
G. ElECTRICTy, GAS & WATER SuPPly 0 0.0 0 0.0
Electrical Engineer 18 1.0 3 0.4
Electrical Powerline Tradesperson 47 2.5 8 1.1
Cable Joiner 4 0.2 0 0.0
Power Generation Plant operator 0 0.0 0 0.0
Electrician 48 2.6 10 1.4
Sub-Total G 117 6.3 21 2.9
h. fINANCE & INSuRANCE 1 0.1 0 0.0
financial Investment Adviser 12 0.7 2 0.3
Accountant 28 1.5 9 1.3
Insurance Clerk 0 0.0 4 0.6
Sub-Total h 41 2.2 15 2.1
I. hEAlTh AND CoMMuNITy SERVICES 0 0.0 0 0.0
Director of Nursing 5 0.3 0 0.0
occupational Therapist 1 0.1 1 0.1
Registered Nurse 36 2.0 0 0.0
Child Care Coordinator 11 0.6 1 0.1
Aged or Disabled person Carer 127 6.9 22 3.1
Radiographers 5 0.3 0 0.0
Social Workers/youth Workers/Case Managers 9 0.5 3 0.4
Sonographers 5 0.3 2 0.3
Volunteers 10 0.5 0 0.0
Sub-Total I 209 11.3 29 4.0
J. MANufACTuRING 3 0.2 2 0.3
Textile & footwear Machine operator 10 0.5 5 0.7
Paper Products Machine operator 25 1.4 13 1.8
Plastics Production Machine operator 4 0.2 1 0.1
Meat and fish Process Worker 1 0.1 0 0.0
General Production Machine Worker 54 2.9 14 2.0
Boat Builder 20 1.1 0 0.0
food Manufacturer 15 0.8 0 0.0
Marine Diesel Mechanic 0 0.0 10 1.4
Sub-Total J 132 7.2 45 6.3

VECCI VICTORIAN SKILLS SURVEY
��
Industry Number of Skilled Vacancies
% of Total Skilled Vacancies
Number of Apprentice/ Trainee Vacancies
% of Total Apprentice/ Trainee Vacancies
K. METAl AND ENGINEERING 2 0.1 3 0.4
fitter 28 1.5 7 1.0
Metal Mechanist 26 1.4 4 0.6
Sheet Metal Worker 50 2.7 12 1.7
Welder/Boiler Maker 87 4.7 22 3.1
Tool Maker 1 0.1 1 0.1
Sub-Total K 194 10.5 49 6.8
l. MINING 0 0.0 0 0.0
Mining Engineer 0 0.0 0 0.0
Extractive Metallurgist 0 0.0 0 0.0
Chemist 0 0.0 0 0.0
Production Manager 2 0.1 0 0.0
Blasting Worker 0 0.0 0 0.0
Sub-Total l 2 0.1 0 0.0
M. PERSoNAl AND oThER SERVICES 4 0.2 0 0.0
hairdresser 1 0.1 0 0.0
Beauty Therapist 5 0.3 0 0.0
Retail Pharmacist 0 0.0 0 0.0
Interpreter 1 0.1 0 0.0
Sub-Total M 11 0.6 0 0.0
N. PRoPERTy AND BuSINESS SERVICES 0 0.0 0 0.0
Public Relations Officer 4 0.2 1 0.1
Marketing Specialist 6 0.3 2 0.3
Sales Representative 36 2.0 5 0.7
Real Estate Salesperson 5 0.3 1 0.1
Security Officer 1 0.1 0 0.0
Call Centre agents 1 0.1 250 34.9
Civil Engineer 11 0.6 1 0.1
Cleaners 5 0.3 0 0.0
lab Staff 10 0.5 0 0.0
Sub-Total N 79 4.3 260 36.3
o. RECREATIoNAl SERVICES 0 0.0 0 0.0
fitness Instructor 1 0.1 0 0.0
outdoor Adventure leader 3 0.2 1 0.1
Sport Coach 9 0.5 7 1.0
Sports Administrator 2 0.1 3 0.4
Travel Agent 5 0.3 3 0.4
Sub-Total o 20 1.1 14 2.0
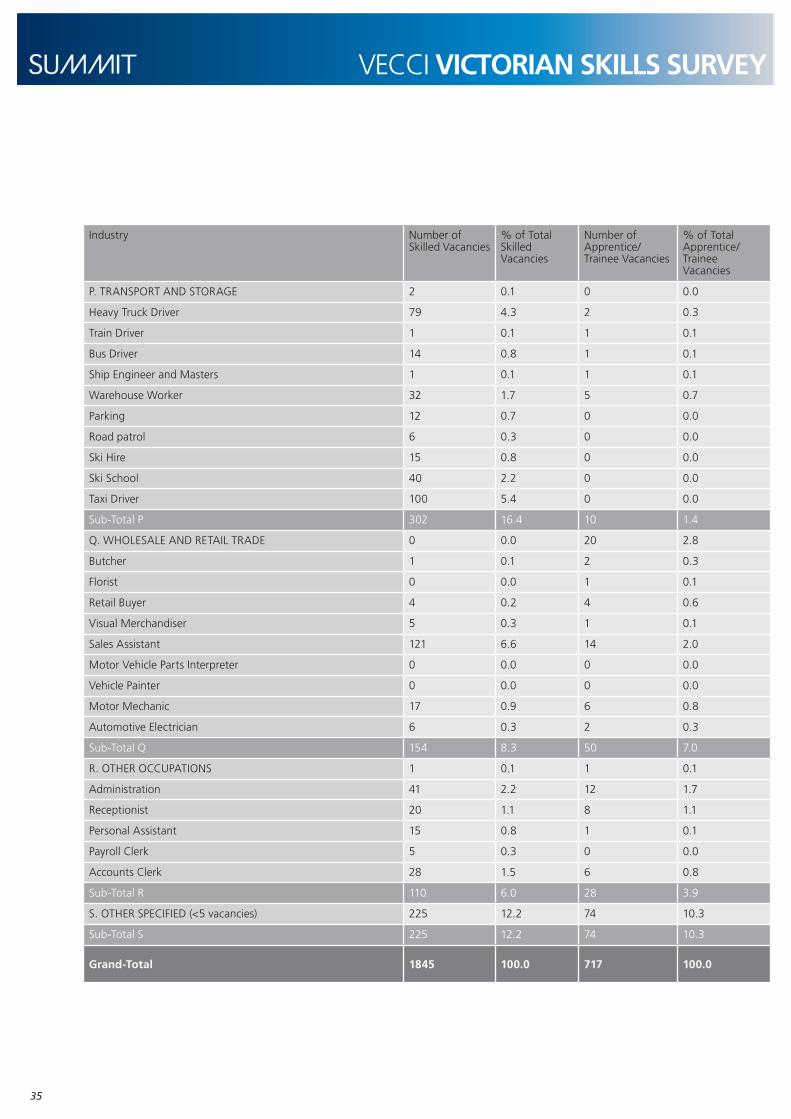
VECCI VICTORIAN SKILLS SURVEY
��
Industry Number of Skilled Vacancies
% of Total Skilled Vacancies
Number of Apprentice/ Trainee Vacancies
% of Total Apprentice/ Trainee Vacancies
P. TRANSPoRT AND SToRAGE 2 0.1 0 0.0
heavy Truck Driver 79 4.3 2 0.3
Train Driver 1 0.1 1 0.1
Bus Driver 14 0.8 1 0.1
Ship Engineer and Masters 1 0.1 1 0.1
Warehouse Worker 32 1.7 5 0.7
Parking 12 0.7 0 0.0
Road patrol 6 0.3 0 0.0
Ski hire 15 0.8 0 0.0
Ski School 40 2.2 0 0.0
Taxi Driver 100 5.4 0 0.0
Sub-Total P 302 16.4 10 1.4
q. WholESAlE AND RETAIl TRADE 0 0.0 20 2.8
Butcher 1 0.1 2 0.3
florist 0 0.0 1 0.1
Retail Buyer 4 0.2 4 0.6
Visual Merchandiser 5 0.3 1 0.1
Sales Assistant 121 6.6 14 2.0
Motor Vehicle Parts Interpreter 0 0.0 0 0.0
Vehicle Painter 0 0.0 0 0.0
Motor Mechanic 17 0.9 6 0.8
Automotive Electrician 6 0.3 2 0.3
Sub-Total q 154 8.3 50 7.0
R. oThER oCCuPATIoNS 1 0.1 1 0.1
Administration 41 2.2 12 1.7
Receptionist 20 1.1 8 1.1
Personal Assistant 15 0.8 1 0.1
Payroll Clerk 5 0.3 0 0.0
Accounts Clerk 28 1.5 6 0.8
Sub-Total R 110 6.0 28 3.9
S. OTHER SPECIFIED (<5 vacancies) 225 12.2 74 10.3
Sub-Total S 225 12.2 74 10.3
Grand-Total 1845 100.0 717 100.0

VECCI VICTORIAN SKILLS SURVEY
��
Other Skilled Vacancies and Apprentice/Trainee Vacancies
Businesses were asked to identify any additional occupations (not specified in the table at question 10) that may be relevant to their business. Where the sum of vacancies for any of these additional occupations totalled 5 or more, the individual occupations have been included in their relative industry grouping in Table 11.
however, where the sum of vacancies for any of these additional occupations were less than 5, they are totalled in Table 11 at “S. OTHER SPECIFIED (<5 vacancies)” and listed individually in Table 37.
Table 33: Other Specified (<5 vacancies) - Skilled Vacancies
Appendix V
Admin in Retail Merchandise Management
2
Admin Staff 1
Agronomist 1
Ambulance Officer 4
Archivist 1
Audiologist 1
Auto Electrician 1
Aviation Publishing 1
Bar Manager 1
Barman/Bartenders 4
Bottling 3
Building Surveyor 2
Business Manager 1
Cabinetmaker 1
Cade Engineer 1
Carpet & Vinyl Inst
2
Case Managers 1
Casual 2
Casual Waitress 1
Chemical Engineer 1
Chemical handler 1
Child Care Consultant 1
Clerical 2
Community Develop Worker 1
Commercial Cleaners 1
Community facilitator 1
Community Officer 1
Concreter 1
Counsellors 1
Crane operator 1
Crane Truck operator 2
Customer Service 2
Customs Broker 1
Dairy Process Workers 2
Deckhand/Med3
1
Dental Nurse 2
2
Dentist 1
Development Chemist 1
Diesel fitter 1
Dishwashers 2
Distribution 1
Draftsperson 4
Driver 1
Drycleaner 1
Educationalist 1
Employment Cons
4
Engineer 2
Event Manager 1
Excavator op
1
Exp. horse People 1
External Renderer 1
finance Staff 1
financial Planner 1
floor Covering Installer 1
food & Bev Attendant 1
foreman Person 1
Gaming Attendant 1
Gaming/Bistro 2
Gardner 2
GP
1
Graffiti Removal 1
Graphics/Mac Computer 1
health Surveyor 1
Occupation Number of Skilled Vacancies
Occupation Number of Skilled Vacancies

VECCI VICTORIAN SKILLS SURVEY
��
heavy Machine operator 3
horticulture Maintenance 1
Industrial Sales Rep
1
Installer 1
Jewellery/hand Engraving 1
Kitchen Sales
1
labourer 2
land Surveyor 1
landscapers 2
laundry 2
laundry & Drycleaner 1
lawyer 2
librarian 2
Local Laws Officer 1
Machine op 1
Maintenance - golf course
1
Manager 1
Manager (Training) 1
Marketing 4
Mechanical (heavy Diesel) 1
Mechanic 2
Mechanical Engineer 2
Medical/Audio Typist 1
Multi Skill labourer 1
Newspaper Del Driver 1
oh&S
1
optometrist 1
other 1
other Industry (heading) 8
Patient Trans Office 4
Pharmacist 1
Physiotherapist 1
Pipe layer 1
Plant Engineer 1
Plant operator 1
Product Manager 1
Professional Engineer 1
Project Engineer 2
Project Manager 2
Project Officer 2
Prospect Developer 1
Publishing Sales
1
quantity Surveyors 1
Radiologists 2
Refrigeration Engineer 1
Refrigeration Mechanic 2
Restaurant Wait staff 2
Restrictions Officer 1
Roof plumber 1
Sales Manager 1
Sales Person 3
School Crossing Supervisor 5
Service Technician 1
Services Engineer 1
Sign maker 2
Slitting line operator 4
Stat Planner 1
Stonemason 1
Store Person 1
Supervisor 2
Sustainability Officer 1
Swim Teachers 3
Systems & analysis 1
Technical Officer 1
Technician 2
Occupation Number of Skilled Vacancies
Occupation Number of Skilled Vacancies
Tourism Volunteer 1
Town Planner 1
Tractor Drivers 1
Training Supervisor 1
Truck driver 1
Truck Maintenance 1
Turf Management 1
Vet Surgeon 1
Veterinarian 3
Veterinary 2
Vineyard hand
1
Vinyl layers 2
Warehouse Assistant 1
Warehouse Manager Timber 1
Waste Auditor 1
Water Engineer 2
Winemaker 1
Wood Machinist 2
Work Turf Machinery 1
youth Worker 3
Total 225
Occupation Number of Skilled Vacancies

VECCI VICTORIAN SKILLS SURVEY
��
Table 34: Other Specified (<5 vacancies) – Apprentice/Trainee Vacancies
occupation Apprentice/
Trainee Vacancies
Administration 1
Apprentice Chef 1
Auto Elect 1
Automotive Mechanic 3
Barman 1
Builders Apprentice 1
Cabinet Maker 1
Carpet layer 1
coastal environmental officer 1
commercial cleaners 2
Compiler/Classifier 1
Concreter 1
Customer Service 1
Dental Nurse 1
Designer 1
Diesel Mechanic 1
Draftsperson 3
Drycleaner 1
Electrician 2
Employment cons 2
Engraving/Printing 1
Excavator op 1
fire Services Tech 2
floor Covering Installer 1
foreman Person 1
funeral 1
hospitality 1
housekeeper 2
Import/Export op 1
Industrial Protective Coating Applicator
1
occupation Apprentice/
Kitchen hand 3
landscape 1
laundry 1
laundry & Drycleaner 1
locksmith Apprentice 1
Maintenance - Golf Course 1
Maintenance 1
Mechanical (heavy Diesel) 1
Mechanic 2
Medical/Audio Typist 1
Merchandiser 2
Mineral Milling 1
Office Worker 1
other 1
Painter 1
Pipe layer 1
Printing 1
quantity Surveyors 1
Receptionist 2
Refrigeration Mechanical 1
Salesman 1
Survey Assistant 1
Technician 1
Tourism Volunteer 1
Trainee (Admin) 1
upholsterer 1
Vet Nurse 2
Veterinary 2
Total 74

VECCI VICTORIAN SKILLS SURVEY
��
Appendix VI
Table 23: Do you think it is likely to be an issue in the future?
Response & comment Number of Businesses %
No, we have a young workforce (10) or no problem with an ageing workforce (3)
we have a balanced workforce (32)
we employ young/graduates/apprentices (4)
we have no problem attracting young (5) or staff of all ages (1)
we have ongoing recruitment of graduates (1)
we have no problem recruiting (4)
we value the characteristics of older workers (48)
we employ or are seeking older workers (3)
we are retaining older staff (1)
we are planning for an ageing workforce (4) or preparing by training (1)
age has no impact (18)
we are happy to recruit older workers (3) / anyone (2)
retiring from business / business ceasing in future (4)
why would it? (1)
not further specified (64) 209 30.2
No, but It is getting difficult to find good employees (1)
There is a lack of trainees to replace older workers (1) 2 0.3
Not if we can recruit young workers (1)
the intentions of retirees are known (1)
we can maintain training (2) 4 0.6
No, there are other issues like lack of young entering trades (2)
Attracting workers to specific job (1)
Attracting and retaining staff for training (1)
Recruiting and retaining young (1)
Attracting and managing work preferences of existing staff (1)
Job satisfaction and motivating staff, as if this is high then people will work until 80. (1)
7 1.0
yes, in the future As the impact of skill shortages increases (5)
If superannuation legislation is not changed to accommodate change from fT to PT without penalty (1)
not further specified (27) 33 4.8
Possibly, in the future But not yet (14)
but now have problem of attracting young (1)
not further specified (29) 44 6.4
Not Sure 5 0.7
Not Applicable 3 0.4
other various unclear responses 1 02 14.8
No explanation provided 282 40.8
Total 691 100.0

VECCI VICTORIAN SKILLS SURVEY
�0

VECCI VICTORIAN SKILLS SURVEY

This publication has been produced as a joint research initiative of the Education and Training Adviser (ETA) Project and the Positive Ageing Workforce Project. The ETA Project is funded under the Australian Government’s Industry Training Strategies Programme, run by the Department of Education, Science and Training. The Positive Ageing Workforce Project is funded by the Department for Victorian Communities.
VECCI would also like to acknowledge the assistance provided by the National Centre for Vocational Education Research in analysing the results of this Survey.