vic campbell senior vice president milton johnson svp and controller mark kimbrough vp, investor...
TRANSCRIPT

Vic CampbellSenior Vice President
Milton JohnsonSVP and Controller
Mark KimbroughVP, Investor Relations
Banc of America – May 2004
2
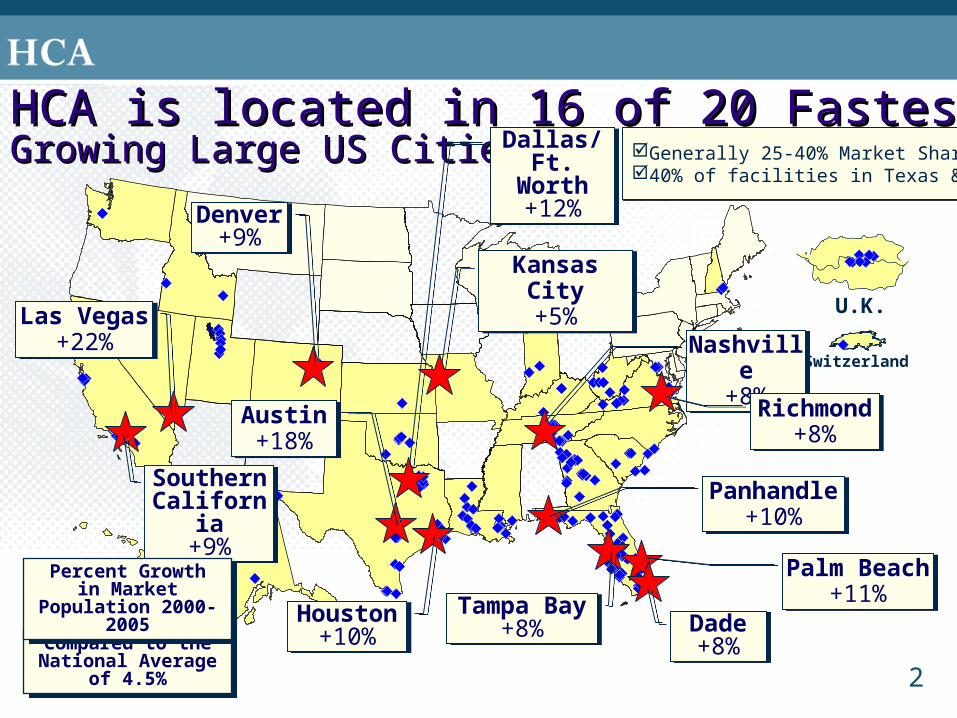
HCA is located in 16 of 20 Fastest HCA is located in 16 of 20 Fastest Growing Large US CitiesGrowing Large US Cities
Switzerland
U.K.
%%
%
%%%
Compared to the National Average of
4.5%
Compared to the National Average of
4.5%
Las Vegas+22%
Las Vegas+22%
Southern California
+9%
Southern California
+9%
Denver+9%
Denver+9%
Dade+8%
Dade+8%
Nashville+8%
Nashville+8%
Panhandle+10%
Panhandle+10%
Tampa Bay+8%
Tampa Bay+8%
Dallas/Ft. Worth+12%
Dallas/Ft. Worth+12%
Austin+18%
Austin+18%
Richmond+8%
Richmond+8%
Palm Beach+11%
Palm Beach+11%
Houston+10%
Houston+10%
Kansas City+5%
Kansas City+5%
Percent Growth in Market Population
2000-2005
Percent Growth in Market Population
2000-2005
Generally 25-40% Market Share40% of facilities in Texas & Florida
Generally 25-40% Market Share40% of facilities in Texas & Florida
3
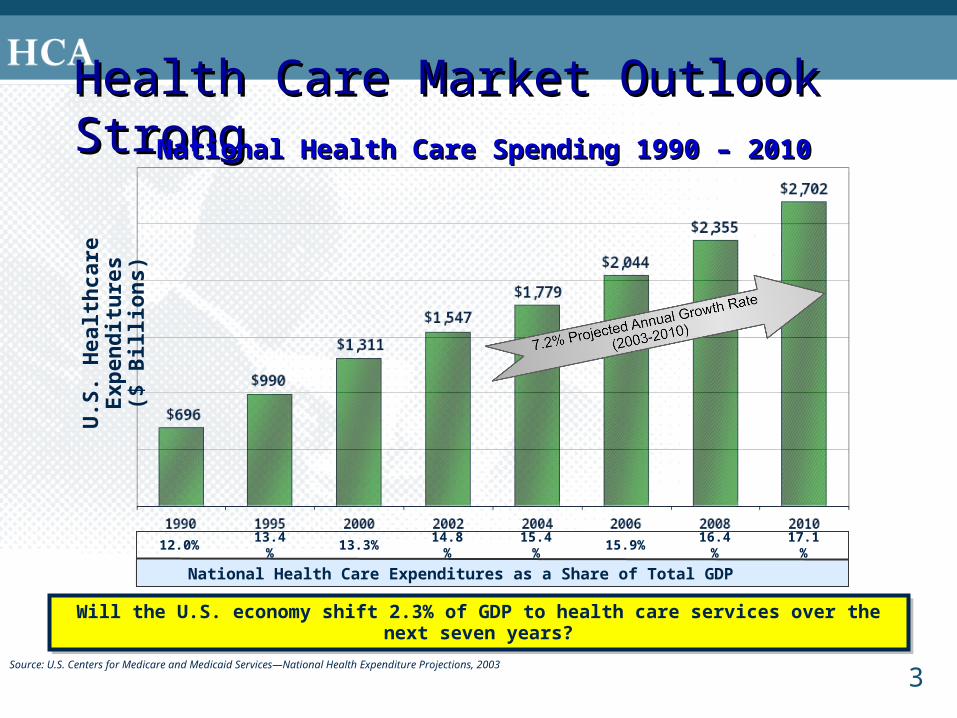
Health Care Market Outlook StrongHealth Care Market Outlook StrongU
.S. H
ealt
hca
re E
xpen
dit
ure
s($
Bill
ion
s)
National Health Care Spending 1990 – 2010National Health Care Spending 1990 – 2010
National Health Care Expenditures as a Share of Total GDP
12.0%13.4%
13.3% 14.8% 15.4% 15.9% 16.4% 17.1%
Source: U.S. Centers for Medicare and Medicaid Services—National Health Expenditure Projections, 2003
Will the U.S. economy shift 2.3% of GDP to health care services over the next seven years?Will the U.S. economy shift 2.3% of GDP to health care services over the next seven years?
4
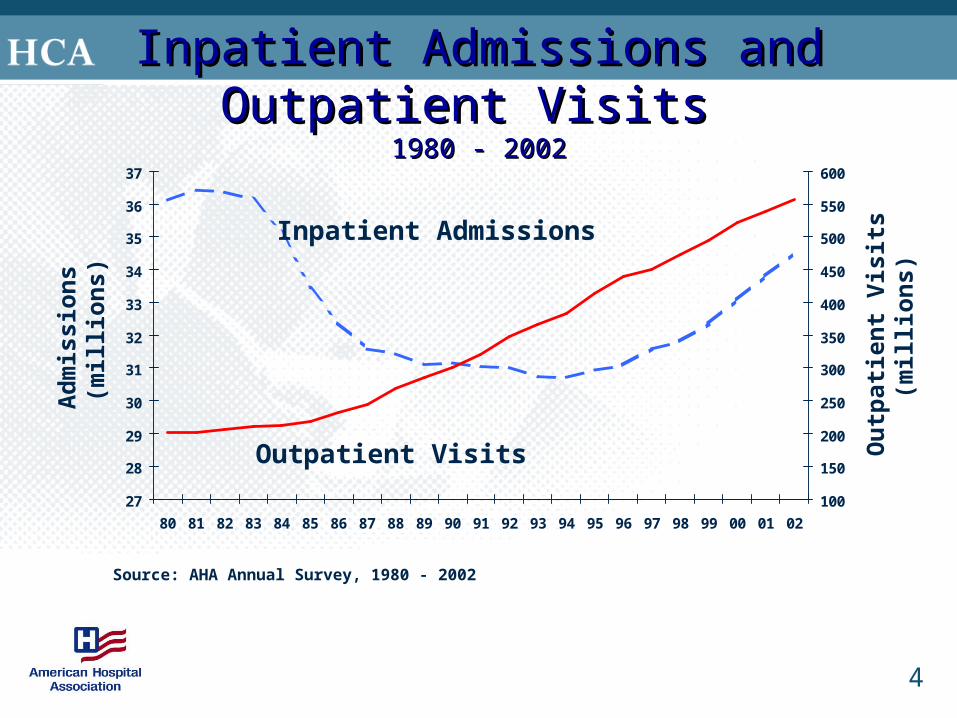
Source: AHA Annual Survey, 1980 - 2002
27
28
29
30
31
32
33
34
35
36
37
80 81 82 83 84 85 86 87 88 89 90 91 92 93 94 95 96 97 98 99 00 01 02
100
150
200
250
300
350
400
450
500
550
600
Outpatient Visits
Inpatient Admissions
Ad
mis
sio
ns
(mil
lio
ns)
Ou
tpat
ien
t V
isit
s (m
illi
on
s)
Inpatient Admissions and Outpatient Visits Inpatient Admissions and Outpatient Visits 1980 - 20021980 - 2002

5
-1.0%
1.0%
3.0%
5.0%
7.0%
1Q 00 2Q 00 3Q 00 4Q 00 1Q 01 2Q 01 3Q 01 4Q 01 1Q 02 2Q 02 3Q 02 4Q 02 1Q 03 2Q03 3Q03 4Q03 1Q04
Admissions Rolling 12 mo. Avg
HCA Admission Trends 2001 to 1Q 2004HCA Admission Trends 2001 to 1Q 2004Same FacilitySame Facility
6.7%
0.0%
2.0%
4.0%
6.0%
8.0%
10.0%
12.0%
14.0%
16.0%
HCAMarket
Competitors
15.4%
HCA Growing Medicare Market Share
Growth in Medicare Admissions 1998-2001
HCA Growing Medicare Market Share
Growth in Medicare Admissions 1998-2001
6
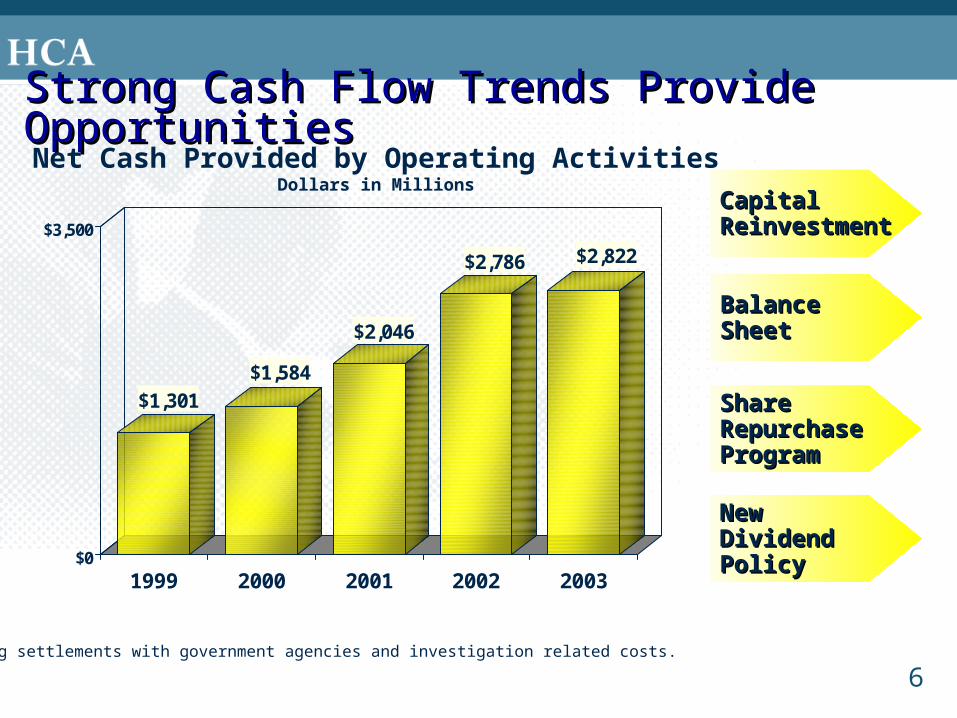
Strong Cash Flow Trends Provide OpportunitiesStrong Cash Flow Trends Provide Opportunities
$1,301
$1,584
$2,046
$2,786 $2,822
$0
$3,500
1999 2000 2001 2002 2003
Net Cash Provided by Operating ActivitiesDollars in Millions
Excluding settlements with government agencies and investigation related costs.
New New Dividend PolicyDividend Policy
Share Share Repurchase Repurchase ProgramProgram
Capital Capital ReinvestmentReinvestment
BalanceBalanceSheetSheet

7
HCA Capital ExpendituresHCA Capital Expenditures
$0.0
$0.5
$1.0
$1.5
$2.0
2000 2001 2002 2003 2004E
Billions 2000
$1.22001
$1.42002
$1.72003
$1.82004E
$1.8
Land & Improvements
14%/$565M
Surgery/Special Units
22%/$870M
Beds14%/$550M
New Facilities10%/$395M
New & Expanded Services
18%/$740M
Replacement Facilities3%/$98M
ER & Outpatient Services19%/$720
1,565 New Beds
54 Facilities with Surgery and/or ICU/CCU expansions
Four New Facilities 378 Beds
Open Heart, ImagingCardiology, Oncology, etc.
37 ERExpansions
37 ERExpansionsDistribution of
Capital Dollars
2002-2005 and Beyond
Distribution of Capital Dollars
2002-2005 and Beyond
New Denver FacilityNew Denver Facility
NewHospitals
Expansions
Routine
PatientSafety
Infra-
structure

8
$7.3 Billion$7.3 Billion
244 Million Shares244 Million Shares
38% of outstanding 38% of outstanding sharesshares
Average Price: Average Price: $30.03$30.03
Opportunities Of Having Strong Cash FlowOpportunities Of Having Strong Cash FlowShare Share repurchase repurchase programprogram
$1.3B: 37.9M Shares1997
1998
1999
2000
2001
20032002
YTD 20041
1: 2004 purchases through 5-6-04 2: Includes other activities affecting share balance (stock option exercises, restricted grants, and ESPP activity).
$33.59/share$22.68/share
$930M: 41M Shares
$1.4B: 55.6M Shares $24.61/share$1.3B: 43.5M Shares $28.65/share$706M: 19.2M Shares$706M: 19.2M Shares $36.88/share$1.1B: 31.1M Shares $35.76/share
$422M: 10.0M Shares$42.19/share
650M Shares 12/31/96
465M Shares2 4/30/04
$282M: 6.2M Shares$45.53/share

9
The Genesis of the Bad Debt/Charity Care The Genesis of the Bad Debt/Charity Care IssueIssue
22.222.2%%
23.523.5%%
21.221.2%%
22.222.2%%
17.017.0%%
19.219.2%%
29.729.7%%
23.523.5%%
15.115.1%% 15.415.4%%
19.719.7%%
16.716.7%%20.320.3%%15.415.4%%
19.319.3%%15.915.9%%
16.416.4%%
NationalAverage:15.2% 1
NationalAverage:15.2% 1
18.118.1%%
>20% Uninsured
15-20% Uninsured
<15% Uninsured
25.625.6%%
14.6%
22.822.8%%
HCA is in 14 of the 20 highest uninsured states, with 72% of its hospitals in those states
HCA is in 14 of the 20 highest uninsured states, with 72% of its hospitals in those states
HCAHCAWeightedAverage:22.6% 2
HCAHCAWeightedAverage:22.6% 2
1: U.S. Census Bureau “Health Insurance Coverage in the United States: 2002”.2: Kaiser Commission: Health Ins. Coverage of Nonelderly Adults 2001-2002.
13.1%13.1%
10
A prudent financial strategy that provides for a strong A prudent financial strategy that provides for a strong balance sheet and return of cash to shareholders through balance sheet and return of cash to shareholders through
share repurchase and/or dividendsshare repurchase and/or dividends
Excellent Investment OpportunitiesExcellent Investment Opportunities
Strong Cash FlowsStrong Cash Flows
Excellent Long-Term Earnings Growth OutlookExcellent Long-Term Earnings Growth Outlook
Great AssetsGreat Assets
In Summary We Have….In Summary We Have….