vibrational spectroscopy of c - arizona state universitycosmen/c60_vibrations/newc60revcorr.pdf ·...
TRANSCRIPT

Vibrational Spectroscopy of C60
Jose Menendez and John B. Page
Department of Physics and AstronomyArizona State UniversityTempe, AZ 85287–1504 USA
The fullerene era was started in 1985 with the discovery of the stable C60
cluster and its interpretation as a cage structure with the familiar shape ofa soccer ball [1]. An explosive growth in fullerene research was triggered in1990 by the development of a method to produce fullerenes in bulk quanti-ties [2]. Subsequently, the structural, electronic, and vibrational properties ofmany fullerenes have been studied in detail. The importance and potentialof this new class of materials is exemplified by the discovery of intermediate-temperature superconductivity in doped C60 [3]. Carbon nanotubes, a novelform of carbon which combines the properties of graphite and fullerenes,were discovered in 1991 [4]. Because of their intriguing properties and po-tential for applications, nanotubes are currently the subject of very intenseresearch. Polymerization of C60 molecules, particularly by photoexcitation [5]but by several other techniques as well, also results in a variety of interestingnew structures, which contain both 4-coordinated and 3-coordinated carbonatoms [6]. The burgeoning field of fullerene research has been reviewed byseveral authors [7–12], most notably by Dresselhaus et al. [11] in an extensivemonograph that appeared in 1996.
In spite of the rapidly increasing interest in new forms of fullerenes, icosa-hedral C60, the “most beautiful molecule” [13], remains the focus of vigorousresearch as the prototype fullerene system. The present chapter concerns thevibrational structure of C60 and the efforts to unravel its details using spectro-scopic techniques. This remains a work in progress, but we hope to show thata look at the existing body of experimental and theoretical research from thebroader perspective of an extended article provides a deeper understandingof the vibrational properties of C60.
1 Vibrations in C60
Several reviews have appeared on the vibrational structure of C60, with em-phasis on Raman and infrared spectroscopy [11,14,15]. We have tried to limitthe overlap with these works by emphasizing recent developments and pro-viding sufficient theoretical detail to facilitate the critical evaluation of com-parisons between measured and calculated spectra. No attempt is made to

2 Jose Menendez and John B. Page
provide complete bibliographic references on the topics discussed, as theseare readily assembled, e.g. via the reviews cited above and by following upreferences in the work we discuss. Accordingly, we have tried to select thosereferences which most usefully illustrate the points under consideration.
We begin in Sect. 1.1 with a brief introduction to relevant aspects ofmolecular vibrations, followed by a discussion in Sect. 1.2 of symmetry prop-erties and spectroscopic selection rules for isolated icosahedral C60 molecules.Section 1.3 concerns symmetry-lowering perturbations arising from the inter-molecular interactions in condensed phases and from the presence of carbonisotopes. Theoretical approaches used to calculate the vibrational frequenciesand eigenvectors of C60 are discussed in Sect. 1.4. Also given there is our pre-ferred frequency assignment for all of the vibrational modes in icosahedralC60. The frequencies are based on data from a wide variety of vibrationalspectroscopies and are compared with representative theoretical results. Theexperimental data are detailed in Sect. 2, with special emphasis on the spec-troscopy of “silent” modes, i.e. those which are neither infrared nor Ramanactive in first order. Finally, Sects. 3 and 4 discuss infrared and Raman inten-sities. The development of accurate models to reproduce these intensities is animportant prerequisite for the understanding of the much more complicatedspectra of higher fullerenes, nanotubes and polymers.
1.1 Theoretical Basis
At a fundamental level, the vibrational properties of solids or molecules suchas C60 derive from the many-electron states, as do the quantities which deter-mine the spectroscopic coupling strengths, e.g. Raman polarizability deriva-tives and IR effective charges. The last decade has seen rapid advances inthe development of numerous “first-principles” techniques for the practicalcalculation of electronic, vibrational, and structural properties from a unifiedmany-electron point of view; some of these techniques will figure into oursubsequent discussion.
For nonmetallic systems whose vibrational and electronic transition ener-gies are well-separated, the eigenstates may be described within the adiabatic(i.e. Born-Oppenheimer) approximation as products of coupled electronic andvibrational states
Ψnν(x,u) = φn(x,u)ψnν(u), (1)
where n and ν are the electronic and vibrational quantum numbers, re-spectively. The many-electron states φn(x,u) depend parametrically on theatoms’ displacements, represented collectively by u, and on the electronic co-ordinates x. They are eigenfunctions of the many-electron problem for fixedatomic configuration u:
[TE + VEE(x) + VEN(x,u) + VNN(u)]φn(x,u) = En(u)φn(x,u), (2)

Vibrational Spectroscopy of C60 3
where TE is the electronic kinetic energy operator and the nuclear-nuclearpotential energy VNN(u) has been included. The vibrations are then deter-mined by taking the effective potential energy function for the atoms to bethe many-electron ground state energy eigenvalue: V (u) ≡ E0(u). This as-sumes that the system remains in its many-electron ground state as the atomsmove.
The minimum of V defines the atomic equilibrium configuration. Theatoms’ displacements from equilibrium are given by the 3N ×1 configurationspace vector u ≡ u(`α), where ` = 1, . . . , N labels sites and α denotes x,y, or z. Within the harmonic approximation, V is quadratic in the displace-ments:
V =12
∑`α,`′α′
Φ(`α, `′α′)u(`α)u(`′α′) =12uΦu, (3)
where Φ ≡ Φ(`α, `′α′) = [∂2V/∂u(`α)∂u(`′α′)]0 is the 3N × 3N harmonicforce constant matrix, with the derivatives evaluated at the equilibrium con-figuration u = 0. The tilde denotes the transpose, and the zero of potentialenergy is taken at the equilibrium configuration. The vibrational Hamiltonianis then
H =12(p M−1p + uΦu), (4)
where the diagonal matrix M ≡ m(`)δ``′δαα′ contains the atoms’ massesand p ≡ p(`α) contains their momenta.
The normal mode frequencies and displacement patterns are obtained bysolving the eigenvalue problem
(Φ− ω2fM)χ(f) = 0, (5)
where f = 1, . . . , 3N labels the modes. Since both the force constant and massmatrices are real and symmetric, the eigenvectors may be taken as completeand orthonormal with respect to M :
3N∑f=1
Mχ(f)χ(f) = I, (6)
and
χ(f)Mχ(f ′) = δff ′ . (7)
The 3N normal coordinates df and their conjugate momenta pf arelinearly related to the atomic displacements and momenta through
u =∑
f
χ(f)df (8)

4 Jose Menendez and John B. Page
and
p = M∑
f
χ(f)pf . (9)
When these equations are substituted into (4) and the eigenvalue equation(5) and orthonormality condition (7) are used, the Hamiltonian reduces tothat for a sum of independent harmonic oscillators
H =12
∑f
(p2f + ω2
fd2f ). (10)
The normal coordinate transformation is valid within either a classicalor quantum mechanical treatment of the vibrational problem. In the formercase the normal coordinates and their conjugate momenta satisfy Hamilton’sequations, leading to df + ω2
fdf = 0. In the quantum case, these quantitiesare operators satisfying commutation relations [df , pf ′ ] = ihδff ′ , and thevibrational Hamiltonian may be reexpressed in the familiar form
H =∑
f
hωf (a†faf + 1/2), (11)
where af ≡ (2hωf )−1/2(pf − iωfdf ) is the annihilation operator for mode f .The eigenenergies are then Enf =
∑f hωf (nf + 1
2 ), with nf = 0, 1, 2, . . .counting the number of quanta hωf in mode f .
In either the quantum or classical description, the key physical quantitiesare the mode frequencies ωf and corresponding displacement patterns χ(f) =χ(`α|f), obtained by solving the eigenvalue problem (5). For fullerenes, onetypically solves this problem directly, using force constants obtained fromphenomenological potential models or from first-principles techniques; bothtypes of calculations will play a role in this chapter.
1.2 Symmetry and Selection Rules
The high symmetry of an isolated, isotopically pure C60 molecule in its equi-librium configuration imposes very strong constraints on the form of thenormal mode displacement patterns. All 60 sites are symmetry-equivalent,and the point group is the full icosahedral group Ih, consisting of 120 opera-tions. These are the 60 proper symmetry operations of a regular icosahedron,together with each of these operations followed by the inversion. The modedisplacement patterns are basis functions for irreducible representations ofIh; that is, they transform under a symmetry operation r as
Rχ(n, i) =ln∑
j=1
Γnji(r)χ(n, j), (12)
Vibrational Spectroscopy of C60 5
where the mode label has been split (f) → (n, i), with n labeling the irre-ducible representation and i denoting the partner within the representation.The 3N × 3N matrix R is the configuration-space version of the symmetryoperator r, and Γ n(r) denotes the corresponding irreducible representationmatrix, of dimensionality ln. Owing to the inversion symmetry in C60, thedisplacement patterns are either invariant under inversion (even modes), orchange sign (odd modes). There are 10 irreducible representations of Ih. Byreducing the 180-dimensional representation generated by transforming thebasis formed from three orthogonal unit vectors on each atom, one can a pri-ori predict the mode symmetry types. It is found that the number of linearlyindependent times each irreducible representation appears is 2(Ag), 1(Au),4(T1g), 5(T1u), 4(T3g), 5(T3u), 6(Gg), 6(Gu), 8(Hg), and 7(Hu). The nota-tion is that of Weeks and Harter [16], who provide a detailed account of theicosahedral group and its application to the harmonic vibrations of C60. Theirreducible representations of types A, T, G, and H are of dimensionalities1, 3, 4, and 5, respectively, these giving the degeneracies, while the g and usubscripts specify the representations for even and odd modes. The six zero-frequency modes corresponding to rigid translations and rotations accountfor one appearance each of T1u and T1g, respectively, and when account istaken of the dimensionalities of the remaining irreducible representations, itis seen that there are just 46 distinct frequencies among the 174 vibrationalmodes.
The high symmetry of a C60 molecule also severely restricts the numberof spectroscopically active modes in IR absorption and Raman scattering,particularly in first-order processes, i.e. those involving a single vibrationalquantum. For absorption, the coupling is through the dipole moment vibra-tionally induced in the system. In particular, within the adiabatic and dipoleapproximations, the interaction between a molecule and an external electricfield is −~µ(u) · ~E exp(−iωt), where ~µ(u) is the expectation value of the totaldipole moment in the molecule for a fixed atomic configuration u:
~µ(u) =∑
`
q`~u(`) +∫d3x φ∗0(x,u)
∑e
qe~xe φ0(x,u). (13)
The arrows denote 3-D Cartesian vectors, q` is the nuclear charge on atom `,the sums are over all of the atoms and electrons, and the expectation valueis taken with respect to the electronic coordinates. Physically, the secondterm describes the electronic charge redistribution induced by atomic motion.Expanding ~µ(u) in powers of the atomic displacements and using (8) toexpress the result in terms of the normal coordinates gives
~µ(u) =∑
f
~µfdf +12
∑ff ′
~µff ′ dfdf ′ + · · · , (14)
6 Jose Menendez and John B. Page
where it is assumed that the system has no permanent dipole moment. Thefirst two coefficients are given by
~µf =∑`α
[∂~µ(u)∂u(`α)
]0
χ(`α|f) (15)
and
~µff ′ =∑
`α,`′α′
[∂2~µ(u)
∂u(`α)∂u(`′α′)
]0
χ(`α|f) χ(`′α′|f ′). (16)
Within standard linear response theory and the harmonic approximation, theterms in (14) lead to absorption involving one, two, . . . vibrational quanta, re-spectively. Specifically, for a sample containing C molecules per unit volume,the first-order contribution to the absorption is given by
A(ω) =2π2C
3cn
∑f
|~µf |2δ(ω − ωf ), (17)
where n is the medium’s refractive index, and an orientational average hasbeen performed. Local field effects have not been included. This harmonicapproximation result is independent of the temperature. In practice, thedelta function absorption lines are broadened phenomenologically, e.g. asLorentzians. The integrated absorption strength of a mode f is given bythe square of the dipole moment derivative ~µf , which according to (14) is themode’s effective charge.
Again within the harmonic approximation, the second-order dipole mo-ment coefficients ~µff ′ give rise to temperature-dependent sum and differ-ence absorption involving two modes. Sum and difference absorption canalso result from the linear term in (14), provided that cubic anharmonicityis present; in this case a virtually excited IR active mode decays anharmon-ically into the two final state vibrational quanta. Reference [17] designatesthese two mechanisms for two-quantum absorption as “electrical” and “me-chanical,” respectively.
The IR selection rules derive from the transformation properties of thedipole moment operator ~µ(u) under symmetry operations. We now summa-rize the standard group theoretic argument for first-order absorption. It isuseful to write the β-component of (15) compactly as
µβ,f = µβχ(f), (18)
where µβ ≡ µβ(`α) = [∂µβ/∂u(`α)]0 is the 3N × 1 vector of real-spaceeffective charges describing the β-component of the dipole moment. It isstraightforward to show that if r = rαα′ is the 3× 3 Cartesian matrix fora symmetry operation r, the vectors µβ transform according to
Rµβ =3∑
β′=1
rβ′βµβ′ ; (19)

Vibrational Spectroscopy of C60 7
that is, µx, µy, and µz are basis functions for the representation r. For an ar-bitrary system, this representation would generally be reducible, and in viewof (18) and the standard group theory basis function orthogonality theorem[18], ~µf will vanish whenever mode f belongs to an irreducible representationnot contained in r. For the full icosahedral group, r is just the irreduciblerepresentation T1u. Hence only T1u modes can be first-order IR active inpure C60.
For two-quantum absorption, the selection rules for either the second-order dipole moment mechanism (16) or the first-order dipole moment pluscubic anharmonicity mechanism are the same: two modes f and f ′ cannot besecond-order active unless their direct product representation Γ f × Γ f ′ in-cludes the representation r. For pure C60, the resulting possible combinationmode symmetry types are listed in Table 1.
Table 1. Symmetry-allowed second-order combinations for infrared absorption andoff-resonance Raman scattering, under the full icosahedral point group (Ih). TheIR- and Raman-allowed combinations are denoted by I and R, respectively. Adaptedfrom [70]
Even parity modes Odd parity modesAg T1g T3g Gg Hg Au T1u T3u Gu Hu
Ag R R IT1g R R R R I I IT3g R R R R I IGg R R R R I I IHg R R R R R I I I IAu I R RT1u I I I R R R RT3u I I R R R RGu I I I R R R RHu I I I I R R R R R
For Raman scattering, we focus on the off-resonance case, when the in-cident visible photon energy hωL is well below that of any electronic tran-sitions. The relevant quantity is then the system’s electronic polarizabilityPαβ(ωL,u) for fixed atomic configuration u, given by
Pαβ(ωL,u) = h−1∑
n
[D0n
α (u)Dn0β (u)
ωn0(u)− ωL+Don
β (u)Dn0α (u)
ωn0(u) + ωL
]. (20)
Here, the electronic transition dipole matrix elements are
~D0n(u) =∫d3x φ∗0(x,u)
∑e
qe~xe φn(x,u), (21)
8 Jose Menendez and John B. Page
and ωn0(u) denotes the frequency of electronic transitions 0 → n, for fixedu. Note that Pαβ(ωL,u) = P∗
βα(ωL,u), so that the real and imaginary partsof this quantity are, respectively, symmetric and antisymmetric in αβ. Forscattered light frequency ωS , the photon differential scattering cross-sectionis then [19](
d2σ
dΩdω
)η′η
=ωLω
3S
2πc4∑
αβγλ
η′αηβη′γηλ
∫ ∞
−∞dt exp(−itω)
× 〈P∗αβ(ωL,u; t)Pγλ(ωL,u)〉, (22)
where ω ≡ ωS − ωL, and η′ and η are the polarization directions of thescattered and incident light, respectively. The brackets denote a thermal av-erage, and P∗
αβ(ωL,u; t) ≡ exp(itH/h)P∗αβ(ωL,u) exp(−itH/h), where H is
the vibrational hamiltonian. Similar to the discussion below (14), expansionof Pαβ(ωL,u) in the atomic displacements and the use of (8) give
Pαβ(ωL,u) =∑
f
Pαβ,fdf +12
∑ff ′
Pαβ,ff ′ dfdf ′ + · · · . (23)
The first-order coefficients are
Pαβ,f =∑`γ
Pαβ(`γ)χ(`γ|f) = P αβχ(f), (24)
where the 3N×1 vector P αβ ≡ Pαβ(`γ) = [∂Pαβ(ωL,u)/∂u(`γ)]0 containsthe real-space electronic polarizability derivatives. Within the harmonic ap-proximation, the use of the linear term of (23) in (22) yields the cross-sectionfor first-order Stokes scattering at frequency shift ω as(
d2σ
dΩdω
)1,Stokes
η′η
=hωL
2c4
3N∑f=1
(ωL − ωf )3(〈n(ωf )〉+ 1)ωf
×
∣∣∣∣∣∣∑αβ
η′αηβPαβ,f
∣∣∣∣∣∣2
δ(ω + ωf ), (25)
where 〈n(ωf )〉 = [exp(hωf/kBT ) − 1]−1 is the thermal average occupationnumber of mode f at temperature T . This result is for a single moleculeand includes no media or local field corrections. Although the frequency shiftof the light is negative for Stokes scattering, we will follow the standardconvention and refer to |ω| as the Raman shift.
The transformation properties of the real-space electronic polarizabilityderivatives P αβ under symmetry operations yield the Raman selection rules.The presence of two Cartesian indices leads to a generalization of the earlierdipole moment derivative transformation property (19), namely
RP αβ =∑α′β′
(r × r)α′β′,αβP α′β′ . (26)
Vibrational Spectroscopy of C60 9
Here (r×r)α′β′,αβ ≡ rα′αrβ′β is an element of the 9-dimensional direct prod-uct representation r × r. For the full icosahedral group, this is the reduciblerepresentation T1u× T1u, and it decomposes into the irreducible represen-tations Ag, T1g, and Hg. Again invoking the standard group theory orthog-onality theorem for basis functions, we see that the right-hand side of (24)vanishes whenever f does not belong to one of these irreducible representa-tions.
One can go further by decomposing the direct product representation r×rinto its symmetric and antisymmetric components, the elements of which aregiven by (r × r)s,a
α′β′,αβ ≡ rα′αrβ′β ± rβ′αrα′β , with the plus sign referring tothe symmetric component. For (r × r)s, the indices are restricted accordingto α′ ≤ β′ and α ≤ β, and likewise for (r × r)a, except that the equalityis removed. Thus the symmetric and antisymmetric components of (r × r)are 6-dimensional and 3-dimensional, respectively. It is straightforward toshow that the combinations P αβ ±P βα are basis functions for (r × r)s,a.Since the real and imaginary parts of P αβ are symmetric and antisymmetricin αβ, respectively, the real part is a basis function for (r × r)s, whereasthe imaginary part is a basis function for (r × r)a. For the full icosahedralgroup, the symmetric component of T1u× T1u contains Ag and Hg, whereasthe antisymmetric component is T1g. For off-resonance Raman scattering, itis customary to use the static limit ωL = 0 in the electronic polarizability,in which case (20) shows that the antisymmetric part of the polarizabilityvanishes identically. Then only the Ag and Hg modes of C60 may be first-order Raman active. For ωL 6= 0, (20) again leads to this result providedthe electronic eigenfunctions are purely real. On the other hand, if complexeigenfunctions cannot be ruled out and ωL 6= 0, the three T1g modes are, inprinciple, first-order allowed in off-resonance Raman scattering.
Equation (25) applies to a molecule with a fixed orientation; the indicesαβ refer to axes fixed in the scatterer. It is straightforward to determine theforms of the polarizability derivatives Pαβ,f → Pαβ,(n,i) for the first-orderRaman active modes, where the mode index f has again been replaced by(n, i), with n labeling the irreducible representation and i the partner. This isconveniently done using projection operator techniques, by determining theforms of the `n matrices
∑r Γ
nki(r)rAr for i = 1, . . . , `n and k held fixed,
where A is an arbitrary 3× 3 trial matrix and the sum is over all symmetryoperations. The results for Ih are given in Table 2. For randomly orientedmolecules, i.e. C60 in solution, one should average over all orientations. Forthe common cases of 0, 90, and 180 scattering geometries, this leads tothe standard results in terms of Placzek invariants [20]. These quantities areG0 = 1
3 |Pxx + Pyy + Pzz|2, Gs = 13 [|Pxx − Pyy|2 + |Pxx − Pzz|2 + |Pyy −
Pzz|2] + 12 [|Pxy + Pyx|2 + |Pxz + Pzx|2 + |Pyz + Pzy|2], and Ga = 1
2 [|Pxy −Pyx|2 + |Pxz −Pzx|2 + |Pyz −Pzy|2]. If I⊥ and I‖ are the scattered intensitieswith polarization perpendicular and parallel to that of the incident light, thedepolarization ratio is ρ = I⊥/I‖ = (3Gs +5Ga)/(10G0 +4Gs), and the total

10 Jose Menendez and John B. Page
Table
2.
Form
sof
the
pola
riza
bility
der
ivati
ve
tenso
rsfo
rfirs
t-ord
erR
am
an
act
ive
modes
under
icosa
hed
ral
sym
met
ry.
The
T1g
contr
ibuti
ons
vanis
hin
eith
erth
est
ati
clim
itω
L=
0or
when
ever
the
elec
tronic
eigen
funct
ions
are
pure
lyre
al.
Thes
efo
rms
wer
eobta
ined
via
the
pro
ject
ion
oper
ato
rte
chniq
ue
des
crib
edon
page
9,usi
ng
the
irre
duci
ble
repre
senta
tion
matr
ices
giv
enby
Wee
ksand
Hart
er[1
6].
The
zaxis
isa
5-fold
axis
,and
the
yz
pla
ne
isa
reflec
tion
pla
ne
Ag
a0
00
a0
00
a
Hg
b0
00
b0
00−
2b
√
3b
00
0−√
3b
00
00
0
√3b
0√
3b
00
00
0
0
00
00√
3b
√3b
00
00−√
3b
00
0
−√
3b
00
Part
ner
12
34
5
T1g
0c
0−
c0
00
00
0
00
00
c−
c0
0
0
0−
c0
00
c0
0
Part
ner
12
3

Vibrational Spectroscopy of C60 11
scattering is Itotal = I‖ + I⊥ ∝ 10G0 + 7Gs + 5Ga. From the results of Table2, the depolarization ratios for first-order scattering by Ag and Hg modes are0 and 3/4, respectively, while if T1g scattering occurs, it is predicted to have100% perpendicular polarization. In the remainder of this chapter, we willuse selection rules appropriate to the static electronic polarizability, which isreal and symmetric, so that only the Ag and Hg modes are first-order Ramanactive, as noted earlier.
The selection rules for the second-order sum and difference scatteringarising from the second term in (23) within the harmonic approximation area straightforward generalization: two modes f and f ′ cannot be second-orderactive unless their direct product representation Γ f×Γ f ′ includes irreduciblerepresentations contained in (r × r)s. Thus for full icosahedral symmetry,Γ f ×Γ f ′ must contain Ag and Hg. The resulting allowed second-order modesymmetry types are listed in Table 1.
For first-order IR and Raman activity, the net result for pure C60 is thatthere are very few active modes: the IR-active T1u modes (four distinct fre-quencies), and the Raman-active Ag (two distinct frequencies) and Hg modes(eight distinct frequencies). To investigate the remaining 46−14 = 32 distinctfrequencies of the first-order “silent” IR and Raman modes, one can studythe much more complicated second-order spectra or introduce perturbationsthat break the first-order selection rules. The latter approach will, of course,generally change the dynamics. In the case of C60, however, isotopic substi-tutions and intermolecular interactions provide “gentle” perturbations whichcan nevertheless be probed by the sensitive first-order optical spectroscopiesto yield information on the unperturbed silent modes [21,22].
1.3 Symmetry-Lowering Perturbations
The theoretical basis of Sect. 1.1 applies to both molecules and solids, pro-vided that the Born-Oppenheimer approximation holds, whereas the symme-try considerations of Sect. 1.2 are for isolated molecules. This means thatthe calculated frequencies, eigenvectors, and spectroscopic intensities shouldbe compared with experiments on isotopically pure molecules in the gasphase. However, all of the existing data on the vibrational properties of C60
stem from measurements carried out on thin films, crystals, and solutions.Fortunately, the forces between C60 molecules in the condensed phases aremuch weaker than the strong interatomic covalent forces within individualmolecules. For instance, at room temperature solid C60 is a Van der Waalsbound fcc lattice of approximately freely rotating molecules. The weakness ofthe intermolecular binding is further exemplified by the fact that the highestmeasured intermolecular phonon frequency at room temperature [23] is only∼ 50 cm−1, well below that of the lowest intramolecular frequency, namely

12 Jose Menendez and John B. Page
272 cm−1 for the Hg(1) “squashing” mode.1 When the temperature is loweredbelow 260 K, the approximately free rotations are lost, but the intermolecularinteractions and their effects on the dynamics remain relatively weak.
Another perturbation that is usually present in experiments on C60 arisesfrom the naturally occurring distribution of carbon isotopes in the samples.Since the fractional mass change arising from the substitution of a single 12Catom by a 13C in a C60 molecule is 1/720, the dynamical effects induced byisotopic perturbations are also weak.
In the limit where the perturbations of the icosahedral symmetry aresmall and the associated changes of the dynamics can be neglected, the spec-troscopic observation of silent modes provides direct information on the vi-brational frequencies in icosahedral C60, even if the precise form of the per-turbation is not known. The intensity of the silent modes will of course beweak in this limit, but the high sensitivity of first-order techniques such as in-frared absorption and Raman spectroscopy makes it possible to detect signalswhich are two or three orders of magnitude weaker than those arising from thestrongest optically active modes. Additional information on the vibrationalstructure of the icosahedral molecule can be obtained when the perturbationis known in detail, allowing one to predict frequency shifts, selection rules,and spectroscopic intensities. Accordingly, we devote the remainder of thissection to a discussion of isotopic and intermolecular interaction perturba-tions, which are not only well-characterized, but in practice are the mostsignificant deviations from icosahedral symmetry. Not covered are extrinsiceffects such as the presence of residual amounts of impurities, solvents, orother fullerenes, although the experimentalist must always keep these pos-sibilities in mind. For example, it is known that even minute amounts ofsolvents can change the crystalline structure [24], and this is likely to affectthe vibrational properties.
Isotopes
The simplest perturbation of the ideal icosahedral molecule arises from thepresence of different carbon isotopes. The natural abundance of 13C is 1.1%,with the result that 49% of the molecules obtained from natural graphite con-tain one or more 13C isotopes. Studies of the isotopic distribution within themolecule show that it is truly random [25]. Excluding the unlikely possibilityof significant zero-point effects, the mass perturbation does not affect the elec-tronic structure of the molecule, so that force constants are unchanged. Hencecalculations of the normal modes of icosahedral C60 can easily be extended toinclude the case of isotopic disorder, with no loss of accuracy. Details of suchcalculations are given in [21,22,26], and are summarized here in Sect. 2.5.These studies show that the analysis of the frequency shifts of modes which
1 We are labeling the modes according to their frequencies. Thus the 8 distinct Hg
mode frequencies will be listed as Hg(1)–Hg(8), each of which is 5-fold degenerate.

Vibrational Spectroscopy of C60 13
are spectroscopically active for the unperturbed molecule provides informa-tion on silent modes. Furthermore, the invariance of the electronic structureunder isotopic substitutions means that the IR and Raman intensities in iso-topically disordered C60 can be computed using the same effective chargesand electronic polarizability derivatives that are used for icosahedral C60. Forrandom isotopic disorder, all modes should become Raman and IR active, andtheir intensity can be predicted with accuracy.
Solid State Effects
The second form of commonly occurring symmetry lowering arises from theinteractions between C60 molecules. This occurs not only in solid phases butalso in solution, where C60 molecules have been shown to form aggregates[27]. The intermolecular interactions in crystalline C60 have been studiedin much more detail, although a detailed analysis of the latest X-ray dif-fuse scattering experiments suggests that none of the models proposed sofar is entirely satisfactory [28]. In order to understand the new spectroscopicfeatures associated with the formation of C60 crystals, we must recast ourdiscussion of the C60 vibrations using the standard theoretical framework fora periodic system. As mentioned above, the C60 molecules occupy fcc sites inthe solid phase [29], and at room temperature, the rapid rotational diffusionof each molecule leads to an effective fcc crystal structure. At T ≈ 260 K thecrystal undergoes a phase transition, below which the four molecules in theconventional fcc cubic cell remain in the fcc sites but become orientationallyinequivalent [23,24,30]. The orientational alignment occurs over a large tem-perature range, and the resulting low-temperature structure is simple cubicwith four molecules per unit cell. The space group is P21/a (short Pa3) [31].
In a lattice, the equilibrium site index ` of Sect. 1.1 is split: ` → (`, b),where ` now labels the primitive unit cell of the Bravais lattice and the siteswithin each cell are labeled by the basis index b; thus for crystalline C60, branges from 1 to 60s, where s is the number of inequivalent molecules in eachunit cell. The elements of the harmonic force constant matrix of (3) becomeΦ(`bα, `′b′α′), and lattice periodicity renders them invariant to the additionof any cell index `′′ to both ` and `′. Bloch’s theorem then results in thenormal modes being plane waves
χ(`bα|~kj) =e(bα|~kj)√Ncmb
exp[i~k · ~R(`b)], (27)
where ~R(`b) is the equilibrium position of site (`b), and periodic boundaryconditions have been applied over a supercell containing Nc unit cells. Themode label f of Sect. 1.1 is now split into a wave vector ~k and polarizationindex j, with j = 1, . . . , 180s. The 180s-dimensional phonon polarizationvectors e(~kj) ≡ e(bα|~kj) are eigenvectors of the dynamical matrix, which
14 Jose Menendez and John B. Page
is given by the lattice Fourier transform of the force constant matrix:
D(bα, b′α′|~k) =∑`′
Φ(`bα; `′b′α′)√mbmb′
exp−i~k · [~R(`b)− ~R(`′b′)]. (28)
Finally, without loss of generality the periodic boundary condition supercellcan be taken with an equal number L of primitive unit cells along each ofthe 3 Bravais lattice basis vectors, in which case Nc = L3 and the allowed~k’s are given by ~k =
∑3i=1 hi
~bi/Li, where the three ~bi are the basis vectors ofthe reciprocal lattice and the hi’s are positive or negative integers. The ~k’sare restricted to the first Brillouin zone and total Nc in number.
In Sect. 1.2 we discussed the spectroscopic selection rules for molecularmodes with index f . In the crystalline phase, periodicity imposes selectionrules involving the wave vector ~k. For either IR or Raman spectroscopy, wavevector conservation plus the fact that the photon wavelengths are essentiallyinfinite on the scale of the intermolecular spacing, require that the sum ofthe wave vectors of the excited and/or destroyed modes must be zero. Thusfor first-order absorption or scattering, only ~k = 0 modes are active, whilein second order one must have ~k1 + ~k2 = 0. Additional selection rules areobtained by considering the symmetry properties of the group of the wavevector associated with the phonons. For first-order spectroscopies, the groupof ~k = 0 is needed, and for solid C60 this is Th, the point group of the lattice’sspace group. Second-order processes involve pairs of phonons with individualwave vectors away from ~k = 0. Then the corresponding wave vector groupshave lower symmetry, usually resulting in many more allowed combinations.
As noted, C60 forms a molecular solid for which the intermolecular in-teractions are much weaker than the intramolecular covalent forces. In suchsolids it is simple to track the evolution of the vibrational modes from iso-lated molecules to crystals. For C60, the phonon dispersion relations ω(~k, j)decouple into a series of optic branches corresponding to the intramolecularvibrations above ∼ 270 cm−1 and a second set of lower frequency brancheswhich involve the molecules vibrating essentially as whole entities, i.e. as rigidballs, both translationally and rotationally (librations). The dispersion rela-tions for the high frequency intramolecular optic branches reflect the weakball-ball interactions and are therefore quite flat.
Well above T = 260 K, the orientational restoring forces between the ballscan be neglected and there are no librational branches. Thus one can describethe low-frequency intermolecular modes to an excellent approximation asthose of a simple monatomic fcc lattice of spherical “atoms,” each with mass12 × 60 amu, giving rise to three acoustic phonon branches.
In the low temperature simple cubic phase, the entire vibrational structurecan be understood qualitatively by noting that the orientational forces whichcause the phase transition are even weaker than the binding forces responsiblefor the average fcc structure. As a result, one can obtain a zero-order approx-imation to the vibrations in the low temperature phase by simply “folding”
Vibrational Spectroscopy of C60 15
the fcc Brillouin zone onto the smaller Brillouin zone of the simple cubiclattice with four molecules per unit cell. The weak reorientational potentialinduces small mode shifts and generally splits the degeneracies arising fromthe folding process. The folding of the three acoustic branches of the fcc lat-tice yields 12 low-frequency intermolecular phonon branches, of which 3 areacoustic and 9 are optical. In addition, the three rotational degrees of freedomof each molecule lead to 12 branches corresponding to librational motions.The highest observed librational frequency is of order 30 cm−1 [23]. This islower than the highest translational frequency of 50 cm−1 and confirms therelative weakness of the reorientational potential. Finally, the folding of the174 high-frequency fcc intramolecular optic branches derived from the modesof the isolated molecules yields 4× 174 intramolecular optic branches, whichare again relatively flat.
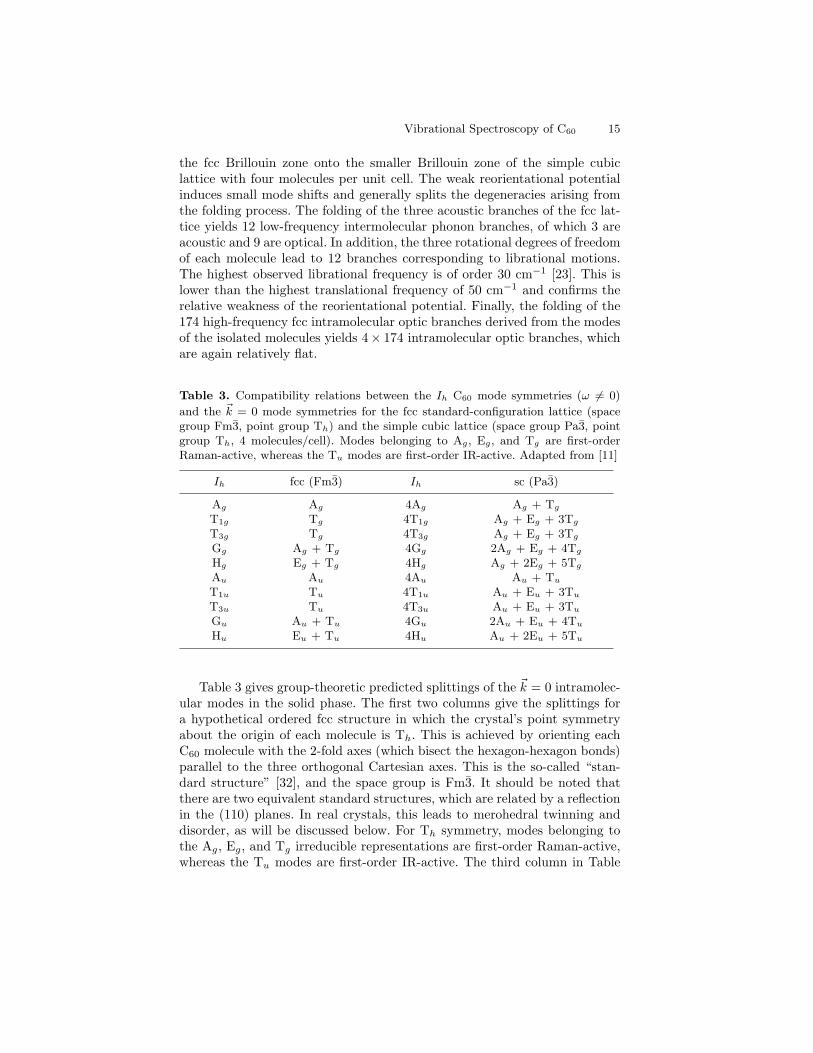
Table 3. Compatibility relations between the Ih C60 mode symmetries (ω 6= 0)
and the ~k = 0 mode symmetries for the fcc standard-configuration lattice (spacegroup Fm3, point group Th) and the simple cubic lattice (space group Pa3, pointgroup Th, 4 molecules/cell). Modes belonging to Ag, Eg, and Tg are first-orderRaman-active, whereas the Tu modes are first-order IR-active. Adapted from [11]
Ih fcc (Fm3) Ih sc (Pa3)
Ag Ag 4Ag Ag + Tg
T1g Tg 4T1g Ag + Eg + 3Tg
T3g Tg 4T3g Ag + Eg + 3Tg
Gg Ag + Tg 4Gg 2Ag + Eg + 4Tg
Hg Eg + Tg 4Hg Ag + 2Eg + 5Tg
Au Au 4Au Au + Tu
T1u Tu 4T1u Au + Eu + 3Tu
T3u Tu 4T3u Au + Eu + 3Tu
Gu Au + Tu 4Gu 2Au + Eu + 4Tu
Hu Eu + Tu 4Hu Au + 2Eu + 5Tu
Table 3 gives group-theoretic predicted splittings of the ~k = 0 intramolec-ular modes in the solid phase. The first two columns give the splittings fora hypothetical ordered fcc structure in which the crystal’s point symmetryabout the origin of each molecule is Th. This is achieved by orienting eachC60 molecule with the 2-fold axes (which bisect the hexagon-hexagon bonds)parallel to the three orthogonal Cartesian axes. This is the so-called “stan-dard structure” [32], and the space group is Fm3. It should be noted thatthere are two equivalent standard structures, which are related by a reflectionin the (110) planes. In real crystals, this leads to merohedral twinning anddisorder, as will be discussed below. For Th symmetry, modes belonging tothe Ag, Eg, and Tg irreducible representations are first-order Raman-active,whereas the Tu modes are first-order IR-active. The third column in Table

16 Jose Menendez and John B. Page
3 is for reference and represents the situation for a hypothetical sc structurewith four non-interacting Ih C60 molecules per unit cell. The last columngives the predicted splittings for the actual low temperature simple cubicphase, of space group Pa3. In this structure, the four molecules in the sim-ple cubic unit cell are again centered at fcc sites, but they are each rotatedfrom their standard-structure orientation by the same angle, about different〈111〉 axes. Although the point symmetry at each C60 site is then S6, thepresence of non-symmorphic operations (screw axes and glide planes) in Pa3results in the relevant point group for ~k = 0 once again being Th.2 Hencethe symmetry properties of this group still provide the spectroscopic selec-tion rules for the first-order Raman- and IR-active phonons. Note from thesecond column of Table 3 that the formation of the hypothetical standard-structure fcc solid would split only the 4-fold and 5-fold degenerate modesof Ih C60, whereas the last column shows that all of the levels are split bythe reorientational potential in the low-temperature sc phase. Accordingly,one would generally expect the icosahedral A and T mode splittings, whicharise only from the reorientational potential, to be smaller than the G andH mode splittings, which arise from both the formation of the solid and thereorientational potential.
A significant feature of the fully ordered crystal is that the Th point grouppreserves the inversion symmetry, so that the first-order Raman and IR ac-tivities of the modes remain mutually exclusive, as for the ideal icosahedralmolecule. This could be used to decide which symmetry-breaking mechanismis more important: if the isotopic perturbation dominates, it should be possi-ble to observe the same silent modes in Raman and IR experiments. On theother hand, if the crystal field perturbation is stronger, one should see even-parity silent modes in Raman experiments and odd-parity silent modes in IR.Unfortunately, this comparison cannot be made easily because the weaknessof the orientational forces prevents an ideal fully-ordered crystalline structurefrom being realized experimentally.
The most obvious deviation from an ordered crystalline structure occursin the room temperature solid phase, where the molecules are rapidly chang-ing their orientation. It was assumed originally that the C60 molecules wereessentially free rotors about their lattice sites. This assumption was supportedby a considerable amount of experimental data, including the excellent fit of
2 For a mode at ~k = 0, the displacement patterns are the same in each unit celland are therefore invariant under any translation of the Bravais lattice. Hencethe crystal symmetry operations relevant for ~k = 0 modes are those involving noBravais translations, namely pure point symmetry operations and nonsymmor-phic operations consisting of point operations (rotation or reflection) followed bya fractional primitive cell translation (see [33]). These operations form a groupwhich is isomorphic to one of the 32 crystallographic point groups, and for thespace group Pa3 this is Th. Thus the group of the wave vector for the low tem-perature simple cubic phase of C60 is Th, despite the fact that the highest sitesymmetry in this space group is S6, occurring at each of the four C60 sites.
Vibrational Spectroscopy of C60 17
the X-ray diffraction pattern by assuming the molecule to be a spherical shell[24,30]. The effect of rotations on the spectroscopic activity of the moleculedepends on whether the vibrations “see” an averaged external perturbationor a frozen configuration. In the first case, the observed spectra should besimilar to those expected from C60 molecules in the gas phase. In the lattercase, one should observe mode splittings and silent mode activation due toa virtually static random perturbation produced by the instantaneous ori-entation of the neighboring molecules. According to Martin et al. [34], thecorrect limit can be decided by comparing the lifetime (not the period) ofthe vibration relative to the rotational diffusion time. Applying this criterionto the T1u modes, Martin et al. estimate an upper limit of 60 ps for theirlifetime [34]. On the other hand, from the rotational diffusion constant mea-sured with neutron scattering they estimate that a 60 rotation takes about130 ps, so that it appears that crystalline C60 is closer to the frozen config-uration limit [34]. More recent neutron scattering and X-ray data present amore complicated picture of the room temperature phase [23,35,36]. The datashow non-negligible orientational correlations between neighboring molecules.The orientational distribution is found not to be isotropic. An excess atomicdensity of the order of 10% was found near the 〈110〉 directions, whereas a16% deficit was found along the 〈111〉 directions [35]. This reflects a strongtendency for 5-fold axes to point along 〈110〉 directions. This orientation isnearly nine times more likely than the less favored orientation of the 5-foldaxes along 〈111〉 directions [23]. The existence of these anisotropic orienta-tions breaks the cubic and inversion symmetry and can lead to the activationof silent modes which are forbidden according to Table 3, even if the lifetimecriterion discussed by Martin et al. [34] is not fulfilled.
We now discuss the low-temperature phase of solid C60 in more detail. Asnoted above, the effective high temperature fcc structure undergoes a phasetransition at about 260 K, to the simple cubic Pa3 phase, with four moleculesper unit cell. In the fully-ordered version of this phase, the molecules remaincentered at the fcc sites ~t0 = (0,0,0), ~t1 = (0,1/2,1/2), ~t2 = (1/2,0,1/2), and~t3 = (1/2,1/2,0), but they have different orientations. This can be visualizedby starting with the hypothetical fcc “standard structure” discussed aboveand rotating each molecule by the same angle Γ about a different 〈111〉axis. The value of Γ is not determined by symmetry, but corresponds to anorientation for which an electron-rich double bond in one molecule faces anelectron-poor pentagon face on its neighbor.
There are two sources of disorder in the Pa3 crystal structure of C60 thatlimit the applicability of the ~k = 0 mode splittings given in the last columnof Table 3. The first type of disorder arises from the fact that there are eightdistinct but equivalent Pa3 structures, arising from the different choices forthe four distinct 〈111〉 axes about which the molecules are rotated [31]. Theseeight structures can be conveniently described in terms of just one of the axissets, as follows. Starting with the system in one of the two standard structures

18 Jose Menendez and John B. Page
and rotating each molecule by the same angle about the axes 〈111〉, 〈111〉,〈111〉, 〈111〉, at positions (0,0,0), (1/2,0,1/2), (0,1/2,1/2), (1/2,1/2,0), respec-tively, yields a fully ordered Pa3 structure. Then applying the translations~t1, ~t2, and ~t3 yields three additional Pa3 structures [32]. The same proce-dure applied to the other standard configuration then gives four additionalPa3 structures. The eight total structures thus naturally divide into two sets,and each set gives a different contribution to the X-ray scattering intensity.The alternative structures coexist in real crystals in the form of macroscopicdomains [37], yielding the so-called “merohedral twinning” [29,30]. The ex-pression “merohedral disorder” has also been used in this context, but itis more properly applied to the case of alkali-metal fullerene intercalationcompounds, where the two standard orientations become energy minima dueto the alkali-metal–C60 interactions, and the molecules are randomly foundin one of these two orientations [24]. The presence of merohedral twinningin crystalline C60 may scramble the polarization selection rules for Ramanscattering, but is unlikely to activate silent modes other than those allowedby the fully ordered Pa3 structure. This is because twinning does not de-stroy the local symmetry, and the interaction between distant C60 moleculesacross domain boundaries should be negligible. However, a second source ofdisorder in low-temperature C60 crystals does alter the local symmetry andmay activate silent modes not allowed by the Pa3 symmetry. The origin ofthis disorder is the existence of a secondary energy minimum for a rotationabout a 〈111〉 axis, which brings a double bond in one molecule close to ahexagonal face in a neighboring molecule (instead of a pentagonal face, asin the ground state) [23,24,30,38]. Below the phase transition at 260 K, themolecules librate about their equilibrium positions and occasionally jump be-tween these two energy minima. At about 90 K the jumps are frozen on alaboratory time scale, and the crystal exhibits a residual disorder, whereby84% of the molecules occupy the double-bond/pentagon configuration andthe remaining 16% occupy the double-bond/hexagon configuration [38]. Theexistence of this disorder destroys the cubic and inversion symmetry and mayactivate all silent modes.
In summary, the symmetry of the ideal low-temperature crystalline C60
structure permits Raman scattering by all even parity molecular modes andinfrared absorption by all odd parity molecular modes. Perturbations whichdestroy the inversion symmetry, such as the presence of isotopes or the ex-istence of local orientational disorder due to the nearby energy minima canrender all modes Raman and infrared active. Which of these mechanismsdominates can only be answered experimentally. The corresponding evidenceis discussed in Sect. 2.
1.4 Survey of Theoretical Calculations
While spectroscopic work on C60 vibrations became possible only after theKratschmer-Huffman breakthrough in 1990, theoretical studies began to ap-

Vibrational Spectroscopy of C60 19
pear as early as 1987 [39]. The success of the theoretical predictions can nowbe evaluated by comparing the calculated frequencies with experimentally de-termined values, as is done in Table 4. However, owing to the relatively smallnumber (14) of frequencies which are directly accessible via the first-order op-tical spectroscopies, the comparison must be done with care. The frequencyassignments in Table 4 will be discussed extensively in Sect. 2, where it willbe shown that even with the addition of inelastic neutron scattering, second-order IR and Raman data, and fluorescence data, only 29 out of the total of 46distinct vibrational frequencies are known with high certainty. This precludesa definitive evaluation of the accuracy of the different theoretical approaches.Another complication arises because, as pointed out in Sect. 1.2, each icosa-hedral irreducible representation except Au appears more than once in thesymmetry decomposition of the 174 vibrational modes. Comparisons betweentheory and experiment and among theoretical models themselves are usuallymade by simply ordering the modes according to their frequencies. However,a different match could be obtained by comparing eigenvectors. For example,the Gu(2) and Gu(3) modes of Table 4 are quite close in frequency, and theeigenvector of the lower frequency mode – which the experimentalist wouldcall Gu(2) – might actually be closer to the eigenvector of the Gu mode withthe theoretically predicted higher frequency, which would be called Gu(3)by the theorist. Unfortunately, the sheer amount of data necessary to specifyeach of the 180-dimensional C60 mode eigenvectors, their nonuniqueness withrespect to mode degeneracies, and the difficulty of obtaining them experimen-tally have precluded eigenvector comparisons. As far as we know, the onlydirect experimental studies of C60 mode eigenvectors is the recent neutronscattering work of Heid and coworkers [40].
Table 4. Recommended values (in cm−1) for the 46 distinct normal mode frequen-cies of an isolated C60 molecule. The symmetry types of the ten first-order Ramanand four first-order infrared active modes are labeled with bold-face characters inthe first column. Bold type is also used in the second column for the frequenciesof modes which have been clearly identified on the basis of spectroscopic selec-tion rules or inelastic neutron scattering data. Whenever possible, low-temperatureexperimental values were used. The third and fourth columns give representativefirst-principles LDA-based theoretical results, together with their percent errors, asdiscussed in the text
Mode Frequency Theoretical CalculationsGiannozzi Adamsand Baroni [47] et al.[53]
Hg(1) 272 259 (-4.8%) 259 (-4.8%)T3u(1) 342 337 (-1.5%) 330 (-3.5%)Gu(1) 353 349 (-1.1%) 353 (0.0%)
continued on following page

20 Jose Menendez and John B. Page
continued from previous page
Hu(1) 403 399 (-1.0%) 399 (-1.0%)Hg(2) 433 425 (-1.8%) 427 (-1.4%)Gg(1) 485 480 (-1.0%) 484 (-0.2%)Ag(1) 496 495 (-0.2%) 494 (-0.4%)T1u(1) 526 527 (0.2%) 522 (-0.8%)Hu(2) 534 530 (-0.7%) 533 (-0.2%)T3g(1) 553 548 (-0.9%) 547 (-1.1%)Gg(2) 567 566 (-0.2%) 554 (-2.3%)T1g(1) 568 564 (-0.7%) 565 (-0.5%)T1u(2) 575 586 (1.9%) 570 (-0.9%)Hu(3) 668 662 (-0.9%) 654 (-2.1%)Hg(3) 709 711 (0.3%) 694 (-2.1%)Gg(3) 736 762 (3.5%) 745 (1.2%)Hu(4) 743 741 (-0.3%) 727 (-2.2%)T3u(2) 753 716 (-4.9%) 696 (-7.6%)T3g(2) 756 767 (1.5%) 717 (-5.2%)Gu(2) 764 748 (-2.1%) 708 (-7.3%)Hg(4) 772 783 (1.4%) 760 (-1.6%)Gu(3) 776 782 (0.8%) 753 (-3.0%)T3g(3) 796 794 (-0.3%) 757 (-4.9%)T1g(2) 831 823 (-1.0%) 813 (-2.2%)Gu(4) 961 975 (1.5%) 970 (0.9%)T3u(3) 973 993 (2.1%) 954 (-2.0%)
Au 984 943 (-4.2%) 929 (-5.6%)Gg(4) 1079 1118 (3.6%) 1123 (4.1%)Hg(5) 1099 1120 (1.9%) 1103 (0.4%)T1u(3) 1182 1218 (3.0%) 1227 (3.8%)T3u(4) 1205 1228 (1.9%) 1239 (2.8%)Hu(5) 1223 1231 (0.7%) 1243 (1.6%)Hg(6) 1252 1281 (2.3%) 1328 (6.1%)T1g(3) 1289 1296 (0.5%) 1309 (1.6%)Gu(5) 1309 1334 (1.9%) 1369 (4.6%)Gg(5) 1310 1322 (0.9%) 1332 (1.7%)Hu(6) 1344 1363 (1.4%) 1387 (3.2%)T3g(4) 1345 1363 (1.3%) 1385 (3.0%)Gu(6) 1422 1452 (2.1%) 1525 (7.2%)Hg(7) 1425 1450 (1.8%) 1535 (7.7%)T1u(4) 1429 1462 (2.3%) 1560 (9.2%)
continued on following page

Vibrational Spectroscopy of C60 21
continued from previous page
Ag(2) 1470 1504 (2.3%) 1607 (9.3%)Gg(6) 1482 1512 (2.0%) 1578 (6.5%)T3u(5) 1525 1535 (0.7%) 1598 (4.8%)Hu(7) 1567 1569 (0.1%) 1622 (3.5%)Hg(8) 1575 1578 (0.2%) 1628 (3.4%)
Conceptually, perhaps the simplest vibrational model applied to C60 re-sults from a continuum approximation in which the molecule is treated asa thin elastic spherical shell. While the predictive accuracy of such a modelmay not be sufficient for spectroscopic assignments, the vibrational analysisof a spherical shell can contribute to the qualitative understanding of themolecular modes, particularly those with lower frequencies. A case in pointis the near degeneracy of the T3u(1) and Gu(1) modes of C60. This quasi de-generacy is not accidental if one considers these modes to originate from the7-fold degenerate ` = 3 multiplet of the O(3) group. This multiplet is splitby the icosahedral perturbation, and the smallness of the observed splittingsuggests that a continuum model might be a useful approximation for thelowest-energy modes of C60. However, in spite of its conceptual simplicity,the problem of an elastic spherical shell is rather complicated analytically,and the two published papers following this idea disagree in their detailedpredictions [41,42].
Prior to 1990, normal mode calculations treating the C60 molecule as adiscrete system used force constants transferred from other molecules contain-ing carbon-carbon bonds, such as benzene [16], or relied on semi-empiricalquantum chemistry calculations (e.g. MNDO, AM1, or QCFF/PI [39,43–45]).Within these early calculations, the best agreement for the 29 highlighted fre-quencies in Table 4 holds for the QCFF/PI calculations of Negri et al. [45],with an average deviation from experiment of 5.7%.
First principles calculations based on density functional theory within thelocal density approximation (LDA) began to appear after 1990. Such calcu-lations give the best agreement with the known C60 vibrational frequencies,with an average deviation ranging from 1.8% to 3.9%. One of the main dif-ferences between the various implementations of the LDA approach stemsfrom the type of basis functions used for the electronic states. Expansions inorthogonal plane waves are advantageous in that the convergence of a calcu-lation can be improved by simply adding more plane waves. Moreover, thisbasis lends itself to the derivation of convenient perturbative expressions forthe dynamical matrix of (28). This Density Functional Perturbation The-ory approach [46] was used by Giannozzi and Baroni [47] to compute thevibrational frequencies of C60, with an average deviation from experimentof only 1.8%. These frequencies are given in the second column of Table 4.Another well-known plane-wave implementation of LDA techniques is thatof Car and Parrinello [48], which uses atomic forces computed directly from

22 Jose Menendez and John B. Page
the electronic states to perform molecular dynamics calculations. An earlyapplication of this method to the dynamics of C60 is given in [49]. A planewave basis necessitates the use of periodic boundary conditions, and for iso-lated molecules the associated supercell is simply taken to be much largerthan the molecule.
Since plane waves are not particularly well-suited for describing compactatomic orbitals such as those in fullerenes, plane wave expansions can becomecomputationally very intensive (24000 plane waves were used for the molec-ular C60 calculations of [47]). The use of a small number of localized basisfunctions is a natural choice for such systems. Several methods of this typehave been applied to the molecular properties of C60 [50–52]. The agreementwith experiment is excellent. Quong et al. [51] and Wang et al. [52] used dif-ferent all-electron localized basis sets within the LDA and obtained averagedeviations from the experimental frequencies of 1.9% and 2.2%, respectively,very close to the results of Giannozzi and Baroni [47]. In 1991, Adams et al.[50] used a local pseudoatomic orbital minimal sp3 basis for each atom andobtained an average deviation from experiment of ≈ 10%. Subsequent refine-ments [53] have improved this to 3.9%. The general method they employedwas developed by Sankey et al. [54] and utilizes approximations which renderit computationally very efficient, giving it the significant advantage of beingsuitable for much larger fullerenes, including tubes and capsules [55] as wellas polymerized fullerenes [53]. Because this method underlies some of oursubsequent discussion, we have included its predicted frequencies in Table 4and will now briefly highlight a few of its key points.
First, the local orbitals are computed from a self-consistent LDA pseu-dopotential calculation for the free atom, but subject to the boundary con-dition that the wave functions vanish at a finite cutoff radius rc, which forfullerenes is taken at 4.1 Bohr radii3 This has the effect of slightly excit-ing the orbitals from their ground states, crudely representing the effectsof electronic confinement in the molecule. More important from a computa-tional standpoint is the fact that this vastly decreases the number of elec-tronic overlap integrations that must be performed. Second, the Kohn-Shamself-consistent energy functional is replaced by the much simpler non self-consistent Harris energy functional [56], which takes the input charge den-sity to be a sum of the neutral atom densities. The elimination of the need tocompute the electronic charge density self-consistently, together with the fi-nite orbital confinement, results in a computationally very efficient method to
3 Note that this value rc = 4.1 Bohr radii differs from the original value (3.3 Bohrradii) used in [50]. As is detailed in the first and third publications cited in [53],the use of 4.1, together with a minor alteration in the calculation of the so-calledelectron double-counting correction, substantially improves the results of [50].The measured bond lengths of C60 are reproduced, and the average deviation ofthe calculated frequencies of the 14 first-order infrared and Raman active modesis 3.7%, compared with ≈ 10% in [50].
Vibrational Spectroscopy of C60 23
obtain the atomic potential energy function V (u) = E0(u) of Sect. 1.1 for anarbitrary atomic configuration. Moreover, methods based on the Hellmann-Feynman theorem can be used for accurate calculations of the correspondingatomic forces F (`α) = −∂V (u)/∂u(`α) directly from the electronic states[57], avoiding the necessity of numerically differentiating V . One can theneither obtain the harmonic force constant matrix as discussed below or per-form molecular dynamics simulations of real-time atomic motions, as in theCar-Parrinello method. The net result is a computationally fast and entirelyreal-space scheme to calculate the electronic structure, dynamics, and equi-librium geometry. No a priori symmetrization of the electronic states is made.For C60, the calculations reproduce the experimental bond lengths, and yieldall of the mode frequencies with an average deviation of 3.9%, as noted above.
In computing the dynamics of C60 from first-principles, the high sym-metry of the molecule greatly simplifies the work. A given row (or column)of the harmonic force constant matrix can be obtained simply by displacingone of the atoms and computing the resulting force per unit displacement oneach atom. Specifically, if the atom at `′ is given a displacement u(`′α′) inthe direction α′ and the remaining atoms are fixed at their equilibrium po-sitions, (3) gives Φ(`α, `′α′) = −F (`α)/u(`′α′). Since all of the equilibriumsites of C60 are symmetrically equivalent only one atom must be displaced,and the remaining elements of the force constant matrix can be obtained byapplying point symmetry operations. This method was employed in the localorbitals first-principles calculations of [51–53]. For example, the frequenciesgiven in the fourth column of Table 4 were obtained by first displacing a sin-gle atom by 0.0125 A along ±x,±y,±z. For each of the six configurations,the force (per unit displacement) was computed at each site, and the re-sults for plus and minus dispacements were averaged to eliminate cubic andhigher odd-order anharmonicity, after which the remaining force constantswere generated by applying icosahedral symmetry operations. The resulting180×180 force constant matrix was then diagonalized, and the mode symme-try types were determined by applying group theoretic projection operatorsto the eigenvectors. Analogous simplifications, based on the high symme-try of C60, have been used in the Density Functional Perturbation Theoryplane-wave calculations of [47]. A different approach is to employ projectionoperators from the outset, to obtain vibrational symmetry coordinates [50];however, this method involves computing the first-principles forces for manymore configurations. Within some of the first-principles methods, it is alsopossible to completely bypass the computation of the force constant matrixby using the first-principles forces in molecular dynamics and performinga Fourier transform of the resulting time-dependent displacements. This ap-proach was followed by Adams et al. [50], and also by Feuston et al. [58] usingCar-Parrinello molecular dynamics. Although much more demanding compu-tationally, since the full LDA electronic structure calculation must be carried

24 Jose Menendez and John B. Page
out at each time step, this method has the advantage that it is not restrictedto small displacements, so that anharmonic dynamics can be explored.
While the overall accuracy of first-principles calculations is impressive, itremains between one and two orders of magnitude less than the experimentalaccuracy. The residual theoretical uncertainty of 1–3% renders it difficult topredict effects which are sensitive to the occurrence of modes with frequencyseparations of this magnitude. An example is the isotope-induced change ofthe Ag(2) pentagonal pinch mode Raman peak in molecular C60, which issensitive to the location of nearby unperturbed frequencies, as detailed in[22] and summarized in Sect. 2.4.
Once experimental vibrational frequencies became available, several em-pirical models were introduced. The force constants in these models are ob-tained from fits to the Raman-active and infrared-active modes. The result-ing frequencies, however, are in no better agreement with experiment thanthose obtained from first-principles methods. Jishi et al. [59] used an eight-parameter model fit to the ten Raman frequencies of C60. Feldman et al.[60] used a seven-parameter model fit to the frequencies of the 14 first-orderinfrared and Raman active modes of C60. The adiabatic bond charge model,which is successful in reproducing the vibrational properties of tetrahedralsemiconductors [61], has also been applied to fullerenes [62,63]. The averagediscrepancy with experiment obtained from these calculations is about 5%.If one considers the fact that the comparison with experiment includes themodes that are being fit, its is apparent that empirical methods are signif-icantly worse than first-principles approaches. The reasons for this becomeclear when one examines the spatial range of the interatomic forces in C60.Jishi et al. were the first to note that a model which includes only nearest-neighbor interactions cannot account for the frequencies of the two Ag modes.Hence their model includes up to third-neighbor force constants. However,a careful analysis by Quong et al. [51] of their first-principles results showsthat interatomic force constants extend much further than this – interac-tions up to seven neighbors must be included to guarantee convergence ofthe eigenvalues to within 5 cm−1. Similar conclusions regarding the range ofthe interatomic interactions in C60 can be drawn from the work of Bohnenet al. [64].
Several theoretical studies have appeared on the intermolecular potentialthat determines the “external,” e.g. phonon modes in crystalline C60. Whilesome of these studies concentrate on the prediction of the stable crystallinestructures and phase transitions, a few give phonon calculations [65,66]. Theintermolecular potential is usually modeled as a combination of Morse, vander Waals and Coulomb potentials. First-principles calculations of the inter-molecular potential have appeared only recently [67], and they have not yetbeen applied to the phonon modes.

Vibrational Spectroscopy of C60 25
2 Vibrational Spectroscopy of C60 Molecules
A basic goal of vibrational studies of C60 is the identification of its 46 distinctmode frequencies. The discussion of Sect. 1.2 showed that for perfectly icosa-hedral C60 only 14 of these frequencies can be determined using first-orderIR absorption and Raman scattering. In Sect. 1.3 we suggested that infor-mation about the 32 silent modes can be obtained by exploiting deviationsfrom icosahedral symmetry, or by performing second-order Raman scatteringand infrared absorption experiments. In addition, a number of other tech-niques, including inelastic neutron scattering, fluorescence spectroscopy andhigh-resolution electron energy-loss spectroscopy, provide information aboutsilent modes. Unfortunately, none of these methods – considered individually– yields an unambiguous mode identification. In this section we discuss ourbest attempt at assigning vibrational frequencies on the basis of all the exper-imental evidence available. We first summarize our conclusions in Sect. 2.1,and then focus on the contributions from different techniques in Sects. 2.2–2.8. For completeness, Sect. 2.9 briefly discusses some alternative assignmentsthat are found in the literature.
2.1 The Assignment of Active and Silent Modes
Table 4 on page 19 gives our recommended values for the 46 different vibra-tional frequencies in C60, together with two sets of first principles predictions[47,53]. Also shown in parentheses are the discrepancies between the calcu-lated and recommended values. The frequencies of the modes that in ouropinion have been clearly identified appear in bold type. For the remainingmodes the uncertainty in the assignments varies, and future work may lead tosomewhat different assignments. Note that the set of well-identified frequen-cies includes not only the first-order active IR and Raman modes, but also asignificant number of silent modes. Whenever possible, the experimental fre-quencies were selected from low-temperature data. However, since the dataoriginate from different sources, relative errors of the order of 2 cm−1 areunavoidable. In particular, the widespread use of array detectors for Ramanspectroscopy leads to discrepancies of the order of 2 cm−1 between differentsets of data in the literature, probably as a result of small differences in thedetector calibrations.
Several alternative assignments of vibrational frequencies in C60 can befound in the literature [68–76]. Martin et al. [70] combined their own high-resolution first- and second-order IR data with published Raman measure-ments [68] and neutron scattering results [77] to arrive at a complete set offrequencies. Some of the frequencies proposed in [70] agree with those in Table4. Others, however, differ from the theoretical predictions given there by asmuch as 70%. These large discrepancies seem unlikely in view of the remark-able accuracy (better than 5%) of state-of-the-art first-principles methods.In fact, the requirement of consistency with theory can be a powerful tool
26 Jose Menendez and John B. Page
for the assignment of mode frequencies. This was recognized by Dong et al.[68] and Wang et al. [69], who used an empirical model to calculate the modefrequencies. Their frequencies were then adjusted so that the fine structureobserved in the Raman and IR spectra of C60 could be explained in termsof second-order overtones and combinations. The resulting frequency assign-ments [69] are closer to ours (Table 4), but some silent mode frequenciesdiffer by as much as 20%. This discrepancy is understandable if one recallsthat empirical vibrational models do not treat active and silent modes on anequal footing. Instead, the known frequencies of the active modes are used asinput parameters to generate the interatomic potentials. This makes it diffi-cult to assess the accuracy of the silent mode frequencies predicted by thesemodels. In contrast, for first-principles methods there is no a priori reasonwhy the silent mode frequencies should be less accurate than those of theactive modes. Since the agreement between theoretical predictions and ac-tive mode frequencies turns out to be better than 5%, silent mode frequencyassignments which differ from the first-principles predictions by much morethan 5% are questionable.
Assignments of silent mode frequencies which are consistent with the Den-sity Functional Perturbation Theory calculations of Giannozzi and Baroni[47] were published by Schettino et al. [72] and by Menendez and Guha [71].The latter authors observed that the error in the predicted active mode fre-quencies has a relatively smooth frequency dependence. The calculations un-derestimate the low frequencies, while overestimating the high frequencies,as can be seen in Table 4. By making the ad hoc assumption that the “er-ror curve” for the active modes also applies to the silent modes, Menendezand Guha [71] generated a set of “adjusted first-principles” frequencies whichthey used as the starting point for their assignments. The agreement betweenthe assigned frequencies and the adjusted first-principles values is quite re-markable, with a standard deviation of only 2 cm−1. Subsequent neutronscattering experiments [40,78], have confirmed all of the assignments of [71]for frequencies below 700 cm−1. The recommended frequencies for several ofthe modes above 700 cm−1 in Table 4 are somewhat different from those of[71]. The revised frequencies given here are in better agreement with the lat-est inelastic neutron scattering experiments [40,78,79], as well as with recentoptical emission experiments [80].
2.2 First-Order Infrared Absorption and Raman ScatteringExperiments
Shortly after the discovery of a method to produce C60 in macroscopic quan-tities [2], the observation of four strong infrared absorption peaks providedstrong evidence for the proposed icosahedral structure of the molecule [81].With regard to Raman scattering, the unequivocal observation of the tenfirst-order peaks allowed by group theory required additional advances inthe extraction of C60 from the fullerene soot. This was because some of the

Vibrational Spectroscopy of C60 27
first-order Raman peaks of C60 are very weak and could be confused withweak lines arising from C70 or other contaminants. Only after chromato-graphically separated fullerenes became available was it possible to obtainunambiguous evidence for the consistency of the Raman spectrum with theicosahedral symmetry of C60 [82,83]. Figures 1 and 2 show infrared absorp-tion and Raman scattering spectra from C60 films [84]. The measured valuesof the first-order IR and Raman frequencies are given in Table 4.
Fig. 1. Fourier transform IR spectra of a 1.4 mm thick film of C60. After Chase etal. [84]
2.3 Second-Order Infrared Absorption and Raman ScatteringExperiments
Infrared absorption and Raman scattering involving two vibrational quantaplay a key role for the mode frequency assignments. This is because, as dis-cussed in Sect. 1.2, the corresponding selection rules are significantly lessrestrictive than for first-order absorption or scattering. Table 1 listed these

28 Jose Menendez and John B. Page
2 0 0 4 0 0 6 0 0 8 0 0 1000 1200 1400 1600
Inte
nsity
(ar
bitr
ary
units
)
Frequency (cm- 1)
L = 1064 nmλλλλ
Fig. 2. Room temperature Fourier transform Raman spectrum of a C60 film. Thelaser excitation wavelength is 1064 nm. After Chase et al. [84]
selection rules for molecular C60, and it is seen that all of the vibrational sym-metries can participate in second order processes. For summation processes,this leads to the possibility of a total of 511 different second-order Ramanpeak frequencies and 380 different second-order IR frequencies. Notice fromTable 1 that the inversion symmetry of the molecule imposes the restrictionthat in Raman summation processes, the two modes must be both even orboth odd, whereas in IR they must have opposite parity.
Second-order Raman scattering in C60 was reported as early as 1991 [85].A systematic study of all peaks between 250 cm−1 and 3400 cm−1 was givenby Dong et al. [68]. In addition to the 10 first-order Raman peaks of C60, theseauthors identified 90 additional weaker peaks between 343 cm−1 and 3385cm−1. Several other groups also studied the fine structure in the C60 Ramanspectrum [73,86–89]. For the second-order IR spectrum of C60, systematicstudies were carried out by Martin et al. [70], Wang et al. [52], and Bowmaret al. [73]. The data of Martin et al. were taken at 77 K, whereas the othertwo sets correspond to room temperature. The agreement between the threesets is good, and that between Martin et al. and Wang et al. is excellent.
Despite the fact that fine structure in IR and Raman spectra providesa powerful tool for the assignment of silent mode frequencies, a failure toexplain a few peaks as second-order processes cannot be used to rule out aparticular frequency assignment. This is because an observed peak could beeither a third-order (or higher) combination or a silent mode which becomesweakly active due to an external perturbation. Both possibilities are known

Vibrational Spectroscopy of C60 29
to occur. Table 4 indicates that the highest energy vibration in C60 is theHg(8) mode at 1575 cm−1, implying that the highest possible frequency fora second-order peak is 3150 cm−1. However, Raman and IR peaks well abovethis frequency are observed experimentally [52,68,70], so that they must bedue to higher-order processes. Since there is no reason for such processesto be limited to frequencies above the second-order cutoff at 3150 cm−1, thepossibility of their occurrence has to be kept in mind when analyzing all of thefine structure in the Raman and IR spectra. Similarly, the lowest vibrationalfrequency in the C60 molecule is the Hg(1) mode at 272 cm−1, setting a lowerlimit of 544 cm−1 for peaks which can be assigned to second-order spectra(provided that difference processes can be neglected, as is the case at lowtemperatures). Nevertheless, extra Raman and IR peaks have been observedbelow 544 cm−1 in experiments performed at the lowest temperatures [68,70],and they must be ascribed to weakly allowed first-order processes. Possiblemechanisms are discussed in Sects. 1.2 and 2.4. Again, there is no a priorireason why the observation of “forbidden” fundamentals should be limitedto modes below 544 cm−1. Therefore the possibility of such processes abovethis frequency should also be kept in mind.
As a result of the different alternative explanations and the observation offewer peaks than allowed by group theory, the interpretation of second-orderspectra is hardly unique. From the 90 additional Raman peaks identified byDong et al. [68], 86 have frequencies equal to or less than 3150 cm−1. A totalof 83 such peaks can be explained as allowed second-order combinations oras forbidden first-order processes (i.e. first-order Raman scattering by silentmodes), using the assignments of Table 4. The standard deviation betweenthe frequencies so computed and the experimental frequencies is only 0.3cm−1. Three peaks observed by Dong et al. [68], at 2463 cm−1, 2782 cm−1,and 3118 cm−1, cannot be assigned to second-order processes on the basisof the mode frequencies in Table 4. These observed peaks are at least oneorder of magnitude weaker than the strongest second-order lines – whichtypically involve combinations of Hg modes – and they have not been reportedby other groups. All three of these peaks can be interpreted as third-ordercombinations involving Hg modes, so that their observation cannot be usedto rule out the assignments of Table 4.
We have also verified that a total of 97 extra infrared absorption peaksobserved by Martin et al. [70] and Wang et al. [52] can be explained eitheras second-order combinations or as forbidden fundamentals, using the modefrequency assignments in Table 4. The standard deviation of 0.3 cm−1 is thesame as for the Raman fine structure.
2.4 Isotopic and Crystalline Perturbations: SpectroscopicEvidence
The spectroscopic activation of silent modes by isotopic and crystal fieldperturbations provides an important tool for the study of the vibrational

30 Jose Menendez and John B. Page
properties of C60. The discussion in Sect. 1.3 shows that the two perturba-tions behave quite differently: isotopes remove the inversion symmetry, thusallowing modes to be both Raman and infrared active in first order. On theother hand, the inversion operator is an element of Th, so that as long as theTh symmetry of ~k = 0 is preserved, only even modes will be observable withfirst-order Raman spectroscopy and only odd modes will be first-order IR ac-tive. High resolution IR and Raman experiments show peaks at most of thesilent mode fundamental frequencies in Table 4. On the basis of this table,however, allowed second-order combinations can be predicted to occur nearmany of these frequencies. Therefore, only those extra peaks observed at thelow end of the spectrum, where no second-order combinations are possible,can be ascribed with certainty to silent modes. In experiments on solid C60
films at low temperatures, Dong et al. [68] reported Raman peaks at all of themode frequencies below 500 cm−1 in Table 4. Peaks at the same frequencies(with the exception of the frequencies of the Hg(1) and Ag(1) modes) werealso observed in IR experiments on similar films by Martin et al. [70]. Thisindicates that Raman and IR experiments do not discriminate strongly be-tween even-parity and odd-parity silent modes, suggesting that the isotopicperturbation might be the most important symmetry breaking mechanism.However, systematic investigations of the isotope effect have failed to showany strong correlation between isotopic impurity concentrations and the Ra-man or IR intensities of silent modes [34,89].
The lack of correlation between the intensity of Raman and IR peaksassigned to silent modes and the concentration of 13C isotopes is consis-tent with our calculations of these intensities using the methods described inSects. 3 and 4 [90]. These calculations show that isotopes play a very minorrole in activating silent modes, so that their observation must primarily bedue to crystal field effects. Disorder that reduces the ~k = 0 symmetry fromTh, as discussed in Sect. 1.3, must play an important role, since it providesthe only possible explanation for the removal of the inversion symmetry re-vealed by the experiments. Nevertheless, one might expect those silent modeswhich become allowed under Th to give stronger signals than those whichare allowed only due to disorder in the crystalline phases. While a system-atic investigation is lacking, some experimental evidence supports this idea.For example, Raman peaks which according to Table 4 correspond to Gg
modes systematically appear in Raman spectra reported by several differentauthors [68,84,86,87,89]. As shown in Table 3 for the fcc (Fm3) structure,Gg modes are unique in that they belong to the only icosahedral irreduciblerepresentation (other than Ag) which contains the identity representation inthe decomposition products under Th symmetry.
Our discussion so far has concentrated on the activation of silent modesby perturbations which lower the icosahedral symmetry. Information aboutthese perturbations can also be obtained by studying their effect on spec-troscopically active modes. In fact, it became clear from the earliest Raman
Vibrational Spectroscopy of C60 31
studies of C60 that the depolarization ratio for Hg modes falls systematicallybelow the value 0.75 predicted on the basis of icosahedral symmetry. Theobserved depolarization ratio for the two Ag modes is much closer to thepredicted value of zero. No detailed explanation has been provided. Snokeand Cardona [91] argued that whereas a general perturbation ε can changethe depolarization ratio for Hg modes by an amount proportional to ε, thechange for Ag modes must necessarily be at least quadratic in ε, since theunperturbed predicted value of zero is the lowest possible for a depolarizationratio.
The discontinuous temperature dependence of the Raman and IR modefrequencies near the ordering phase transition, together with the splittingof these modes at low temperatures, are strong manifestations of crystalfield effects on the intramolecular vibrations of C60 [92–96]. In most cases,however, these splittings are not well understood. Part of the difficulties stemfrom the comparable size of the splittings induced by isotopic and crystal-fieldperturbations, which dictate the need for isotopically pure samples in orderto investigate crystal field effects. Perhaps more serious is the possibility ofaccidental degeneracies between active and silent modes. For closely spacedmodes, any small perturbation may induce substantial mixing, so that theanalysis of crystal field splittings of active modes requires knowledge of thefrequency of all nearby modes. A good example of these complications isprovided by the crystal field splittings of the T1u modes. High resolutioninfrared reflectance experiment by Homes et al. [94] revealed a complicatedsplitting pattern for all T1u modes except T1u(2). This pattern was found tobe strikingly different in isotopically pure samples [95]. The analysis of thesplittings was based on the assumption that no silent modes have a frequencyclose to any of the T1u modes. Our assignments in Table 4, however, indicatethe presence of silent modes very close in frequency to T1u(1), T1u(2) andT1u(4), a fact that may require a new interpretation of some of the observedsplittings.
A more direct way of studying crystal field effects is to perform spectro-scopic studies of those external lattice modes which are due exclusively to theweak intermolecular potential. The external modes of the C60 crystal havefrequencies below 60 cm−1, which makes them difficult to observe. However,an accurate mapping of the phonon dispersion relations has been obtainedwith inelastic neutron scattering [23,97]. The zone-center modes are expectedto be optically active and have the convenient feature that those which cor-respond to translational vibrations are IR active and those which correspondto librational motions are Raman active [11]. Both types of modes have beenobserved [98–100], and their frequencies are consistent with the neutron scat-tering experiments.

32 Jose Menendez and John B. Page
2.5 Quantitative Assessment of Isotope Effects
In previous work [21,22,26], we showed that detailed experimental/theoreticalstudies of isotopic perturbations on the Raman active modes of C60 providea sensitive probe of the nearby silent modes. Here we summarize aspects ofthat work, incorporating our present mode assignment of Table 4.
Fig. 3. Unpolarized Raman spectrum in the frequency region of the pentagonalpinch mode, for a frozen sample of non-isotopically enriched C60 in CS2 at 30 K.The points represent the experimental data, while the solid curve is a 3-Lorentzianfit. The highest-frequency peak is assigned to the totally-symmetric pentagonal-pinch Ag(2) mode in isotopically pure 12C60. The other two peaks are assigned tothe perturbed pentagonal-pinch mode in molecules having one and two 13C isotopes,respectively. After Guha et al. [22]
Specifically, we analyzed the effects of 13C isotopes on high-resolution Ra-man spectra in the vicinity of the intense first-order Ag(2) peak that occurs

Vibrational Spectroscopy of C60 33
at 1471 cm−1 in the isotopically pure icosahedral molecule.4 This is the fa-miliar “pentagonal pinch” mode, in which the atoms vibrate almost purelytangentially, towards or away from the centers of the 12 pentagons. With iso-topes present, the molecule’s adiabatic electronic states are unchanged (weare neglecting small zero-point effects), leaving the force-constant matrix,the IR effective charges, and the Raman polarizabilities unaffected. However,the lowered symmetry introduced by mass perturbations relaxes the spectro-scopic selection rules and allows the unperturbed modes to couple. Since theperturbation introduced by each 13C isotope in C60 is only of order 1/720,the effects on the dynamics are indeed weak, although readily observable inRaman or IR.
The 1.1% natural abundance of 13C means that a C60 molecule has a49% probability of containing one or more of these isotopes. Figure 3 showsour high-resolution spectrum for a sample having the natural isotopic abun-dance. The C60 was dissolved in CS2, and the spectrum was measured atT =30 K. The solid curve is a 3-Lorentzian fit to the experimental points.As detailed in [21,22,26], we attribute the three clearly-resolved peaks toscattering from molecules containing 0, 1, or 2 13C atoms, respectively. Themeasured separation between the first and second peaks is 0.98± 0.01 cm−1,while for the second and third peaks, it is 1.02±0.02 cm−1. As shown below,these splittings are predicted essentially exactly by first-order nondegenerateperturbation theory.
The bottom panel of Fig. 4 shows the analogous spectrum, but for anisotopically enriched sample. The top panel gives the measured isotopic massdistribution for this sample. It is apparent that the two lineshapes show aremarkable correlation. Again, a very simple perturbation-theoretic argumentwill be seen to explain this result, while deeper analysis will correlate thissuccess with information on the nearby unperturbed frequency positions.
Given the smallness of the isotopic mass perturbations, it is natural to tryperturbation theory, the simplest form of which is nondegenerate perturba-tion theory. With isotopes present, the mass matrix in the mode eigenvalueproblem (5) becomes M0 +∆M , where M0 corresponds to the unperturbedmolecule. As noted above, the force constant matrix remains unperturbed.The derivation of the perturbation series is straightforward, although theproblem is slightly different from the usual case based on (H0 + V )ψ = Eψ,because here the perturbation ∆M is a multiplier of the eigenvalue and alsoappears in the eigenvector normalization (7). A derivation of the perturbationseries for the frequencies which avoids the normalization condition is givenin [26]. Here we list the relevant results.
4 Low-resolution Raman experiments which do not resolve any isotopic structureyield a frequency of 1470 cm−1 for the Ag(2) peak, as listed in Table III. Thevalue 1471 cm−1 used here corresponds to the Ag(2) mode in 12C60, which isseen as the high-energy peak in Fig. 3.

34 Jose Menendez and John B. Page
Fig. 4. (a) Mass spectrum of a 13C-enriched C60 sample. (b) Unpolarized Ramanspectrum of the same enriched sample in CS2 at 30 K. After Guha et al. [21]
The perturbed frequency for a nondegenerate mode f is given by theseries
∆ω2f
ω20f
=∑
n=1,2,...
(∆ω2
f
ω20f
)n
, (29)
where ∆ω2f ≡ ω2
f −ω20f is the shift of the squared frequency of the mode. The
first three terms in the right-hand side of this equation are(∆ω2
f
ω20f
)1
= −χ0(f)∆Mχ0(f), (30)

Vibrational Spectroscopy of C60 35(∆ω2
f
ω20f
)2
= (∆Mff )2 +∑f ′ 6=f
(∆Mff ′)2
1− (ω0f′
ω0f)2, (31)
and(∆ω2
f
ω20f
)3
= −(∆Mff )3 − 3∆Mff
∑f ′ 6=f
(∆Mff ′)2
1− (ω0f′
ω0f)2
+∆Mff
∑f ′ 6=f
(∆Mff ′)2[1− (ω0f′
ω0f)2]2
−∑
f ′,f ′′ 6=f
∆Mff ′∆Mf ′f ′′∆Mf ′′f[1− (ω0f′
ω0f)2] [
1− (ω0f′′
ω0f)2] , (32)
where ∆Mff ′ ≡ χ0(f)∆Mχ0(f ′) is the isotope perturbation matrix ∆M ,expressed in the basis of unperturbed mode eigenvectors. While just the firsttwo terms are needed in the following, the third-order result is included forreference.
For Ag modes in C60 molecules, the first-order shift (30) reduces to a verysimple result. Because every site in the unperturbed icosahedral molecule issymmetry equivalent, the magnitudes of the atomic displacements for theunperturbed totally symmetric Ag modes are site-independent, and for thecase of n isotopic substitutions 12C → 13C, (30) gives(
∆ω2Ag
ω20Ag
)1
= − n
720. (33)
This nondegenerate perturbation theory result is independent of the loca-tion of the isotopes and is valid provided the unperturbed Ag mode is suffi-ciently far from the nearby unperturbed modes to which it couples via theperturbation. For the n = 1 case of a single isotope, the result is ∆ωAg
=ω0Ag
(√
719/720−1), and for the unperturbed Ag(2) mode at 1471 cm−1, thepredicted shift is -1.02 cm−1, in excellent agreement with the measured shiftof -0.98 cm−1.
The above first-order perturbation theory result is also consistent with thestrong correlation between the Raman and mass spectrum lineshapes seen inFig. 4. From (24), the strength of the Raman scattering from mode f is deter-mined by the mode polarizability derivatives Pαβ,f =
∑`γ Pαβ(`γ)χ(`γ|f).
The real-space electronic polarizability derivatives Pαβ(`γ) are not changedunder isotopic substitution, as noted above, and when first-order perturba-tion theory is valid, the mode eigenvectors χ(`γ|f) remain unperturbed aswell. The Raman intensity for the perturbed Ag mode will then be the sameas for the unperturbed molecule. Hence as long as the first-order perturbationtheory result (33) remains valid, the Raman spectrum for a mixture of C60

36 Jose Menendez and John B. Page
molecules having varying amounts of 13C should simply be proportional tothe mass spectrum of the sample, exactly as is seen in Fig. 4.
As the number of isotopes is increased, (33) should eventually fail, butthe good agreement just noted implies that the unperturbed Ag(2) modefrequency is relatively isolated from the frequencies of nearby unperturbedmodes which can couple appreciably through the mass perturbation. To fur-ther explore this question, we also performed nonperturbative calculations ofthe perturbed normal modes and the associated Raman spectrum. The real-space Raman polarizability derivatives needed for the Raman strengths wereobtained from a phenomenological bond-polarizability model which gives anexcellent account of the unperturbed C60 off-resonance Raman intensities[22], as we detail in Sect. 4.1. For the mode eigenvectors, one can use (5)directly, provided the force constant matrix Φ is available, either from first-principles or phenomenological models. The resulting mode frequencies andeigenvectors can then be computed for any spatial arrangement of isotopes,and the corresponding Raman spectra predicted. Our results for such cal-culations, based on the first-principles LDA-based local-orbitals techniquediscussed in Sect. 1.4, together with the isotopic mixture shown in the toppanel of Fig. 4, are given in panel (a) of Fig. 5. The distribution encompasses 0to 10 13C isotopes per molecule, and as detailed in [22], the predicted spectrain Fig. 5 include exactly all possible isotopic arrangements for the cases of 0,1, and 2 13C isotopes, whereas the cases of 3–10 isotopes are included withinan accurate approximation. The agreement between the predicted and ob-served spectrum is seen to be quite good, although not as good as that foundwith the simple first-order perturbation theory argument given above, whichbypasses detailed model calculations altogether.
Further insight into this problem is obtained by using the correspond-ing unperturbed mode frequencies and eigenvectors in (31) to evaluate thesecond-order nondegenerate perturbation theory shifts. The result for then = 1 case of a single isotope is listed in the third column of Table 5, to-gether with the exact nonperturbative shift predicted by our first-principlesmodel, given in the fourth column. As anticipated from the simple first-ordernondegenerate perturbation theory results, the second-order shift is signifi-cantly smaller than the first-order shift. Nevertheless, it is interesting thatthe first-order nondegenerate perturbation theory result was in fact essen-tially perfect, in which case the perturbation theory contributions beyondfirst order should vanish.
In view of the high accuracy of Giannozzi and Baroni’s first-principlesDensity Functional Perturbation Theory predictions for the frequencies oficosahedral C60 [47], displayed here in Table 4, we have repeated our iso-topically perturbed Raman spectrum calculations, using their model. Theresulting predicted spectrum for the enriched sample of Fig. 4 is shown inpanel (b) of Fig. 5, and it is seen to be in very good agreement with the ex-perimental spectrum. The second-order nondegenerate perturbation theory

Vibrational Spectroscopy of C60 37
Fig. 5. Solid lines: calculated Raman spectra in the frequency region of Ag(2) forthe 13C-enriched C60 of Fig. 4. Up to 10 isotopes were included, and the spectrawere weighted according to their relative abundances in the mass spectrum. Thesespectra were calculated nonperturbatively, using the first-principles eigenmodes of[53] for panel (a), the first-principles eigenmodes of [47] for panel (b), and ourpresent frequency assignment of column 2 in Table 4 for panel (c), by implementing(34) in the manner described in the text. The dashed line is the experimental Ramanspectrum of Fig. 4b
shift computed using Giannozzi and Baroni’s model is given in the secondrow of Table 5, along with the predicted exact shift. Like our results in thefirst row, these results are qualitatively consistent with the earlier success ofsimple first-order nondegenerate perturbation theory, but are quantitativelyworse than that simple model-independent prediction.
At this point it is useful to recast the fundamental mode eigenvalue prob-lem (5) into an equivalent form which more transparently brings out theimportance of the lineup of unperturbed frequencies. This form is simply ob-tained by re-expressing (5) in the complete basis of unperturbed orthonormalmode eigenvectors χ0(f). The result is∑
f ′
[ω20fδff ′ − ω2
f (δff ′ +∆Mff ′)]cff ′ = 0, (34)
where the matrix elements ∆Mff ′ are defined just below (32), and the coef-ficients cff ′ are the expansion coefficients of the mode eigenvectors in thebasis of unperturbed eigenvectors:
χ(f) =3N∑
f ′=1
cff ′χ0(f′). (35)
The differences in the predicted isotopically perturbed Raman spectra ofpanels (a) and (b) of Fig. 5 derive from differences in the mode frequenciesand eigenvectors for the two first-principles methods used. We therefore com-pared the frequencies and eigenvectors for these two models mode by mode

38 Jose Menendez and John B. Page
Table 5. Calculated isotopic frequency shifts, in cm−1, for the Ag(2) mode inmolecular C60 having one 13C atom. The second column gives the shifts predictedby first-order nondegenerate perturbation theory (33), for n = 1. They are model-independent. The third column gives the second-order nondegenerate perturbationtheory shifts obtained from (31), whereas the fourth column gives nonperturbativeshifts. For the first two rows, the indicated models were used, but for the thirdrow ∆Mff ′ was computed from the unperturbed mode eigenvectors of the LDA-based first-principles calculations of [47], the unperturbed frequencies ω0f weretaken from our frequency assignment in Table 4, and (34) was used to computethe nonperturbative shifts, as explained in the text. The perturbation theory shiftsof the second and third columns were obtained using the experimental Ramanfrequency ω0 = 1471 cm−1 in the left-hand sides of (30) and (31)
Frequency set 1st-order shift 2nd-order Nonperturbative(model independent) shift shift
Adams et al.a -1.02 0.21 -0.86
Giannozzi and Baronib -1.02 -0.33 -1.38Present assignmentc -1.02 0.015 -0.97
Experimental shift: -0.98
aTable 4, column 4 (from [53])bTable 4, column 3 (From [47])cTable 4, column 2
and found that while the frequencies differ by as much as 7%, their eigen-vectors are practically identical. This distinction between the behavior of thefrequencies and eigenvectors in the two models is even more striking when onerecalls that the mode eigenvalues are actually the squares of the frequencies.Apparently, the very high symmetry of C60 imposes rather severe constraintson the forms of the mode displacement patterns. For the isotope problem, thismeans that the matrix elements ∆Mff ′ appearing in (34) are highly similarin the two models used for panels (a) and (b) of Fig. 5. Hence the dominantcontribution to the differences in the two predicted isotopically perturbedspectra derives from the models’ different frequency lineups in pure C60.
Moreover, we can use (34) to study easily the effect of our frequencyassignment in Table 4 on the isotopically perturbed Raman scattering, eventhough we have no force constant model underlying these frequencies. This isaccomplished by using column 2 of Table 4 for the ω0f ’s and simply evaluatingthe matrix elements∆Mff ′ using the eigenvectors obtained from either of theabove two models. The resulting isotopically perturbed Raman spectrum isgiven in panel (c) of Fig. 5, and it is in excellent agreement with experiment.In addition, we can use the same ∆Mff ′ ’s to compute the second-ordernondegenerate perturbation theory shift from (31), yielding the result in thethird row of Table 5. Now the second-order shift is indeed negligible, asanticipated.

Vibrational Spectroscopy of C60 39
In [22], we performed these approximate, but nonperturbative, calcula-tions of the isotopically perturbed Ag(2) Raman spectrum, for several otherpublished models of the normal modes of pure C60, for which the frequencies,but not the eigenvectors, were available. As shown there, models with unper-turbed silent modes having frequencies very close to Ag(2) yield predictedisotopically perturbed spectra which poorly represent the experimental spec-trum of Fig. 4(b). Moreover, the predicted shifts are significantly off, and thesecond-order nondegenerate perturbation contributions turn out to be largerthan the first-order corrections. Reference [22] should be consulted for de-tails. Our results demonstrate that this sort of isotopically perturbed Ramanscattering study can provide a sensitive probe for quantitative assessmentsand refinements of theoretical models.

40 Jose Menendez and John B. Page
2.6 Inelastic Neutron Scattering
Inelastic neutron scattering (INS) is the most comprehensive technique forthe study of vibrations in condensed matter: the ~k conservation and otherselection rules are much less restrictive than for optical spectroscopies. Inthe case of C60, all modes, including those silent for first-order Raman andinfrared spectroscopy, can be detected with this technique. The scatteringintensity is proportional to the mode degeneracy, a fact that provides a helpfultool for the identification of the vibrations. The primary disadvantage of INSis its poor spectral resolution. This makes it difficult to individually resolveall of the modes, especially when several frequencies are clustered within anarrow range, as is the case for many C60 vibrations.
Fig. 6. Measured inelastic neutron scattering spectrum of C60. The solid line showsa fit to a series of Gaussians plus a sloping background. A calculation using frequen-cies that are virtually identical with those of Table 4 is shown as a solid line. Notethat the calculated spectrum ends at 90 meV (730 cm−1). The excellent agreementbetween the calculation and the Gaussian fit can be extended to 130 meV (1050cm−1), using the frequencies in Table 4. From [78]
The initial inelastic neutron scattering studies of intramolecular C60 modesprovided an overall picture of the density of vibrational states and were rea-sonably consistent with the existent Raman and infrared data, but the reso-lution was not good enough to identify other modes, particularly in the highenergy range [101]. Subsequent work with improved resolution provided thefirst experimental evidence for several of the assignments in Table 4 [77,102].

Vibrational Spectroscopy of C60 41
6 0 0 6 5 0 7 0 0 7 5 0 8 0 0 8 5 0 9 0 0
Inte
nsity
(ar
bitr
ary
units
)
Frequency shift (cm- 1)Fig. 7. Experimental inelastic neutron scattering spectrum of C60, showingmedium-energy modes (circles) [79]. The solid line is a calculated spectrum consist-ing of a sum of Gaussians centered at the mode frequencies of Table 4 and weightedaccording to the modes’ degeneracies. The width of each Gaussian is taken to beproportional to the mode’s energy and adjusted to the experimental data. Thebest agreement is obtained using ∆E/E = 0.014. A constant background has beenadded, and the energies were rescaled as discussed in the text
Prassides et al. [102], for example, identified the T3u(1), Gu(1) and Hu(1)modes. Later work has given a detailed account of all modes below 700 cm−1
[40,78]. Figure 6 shows results by Copley et al. [78]. The solid line repre-sents a fit to the data with a set of Gaussian functions, whereas the dashedline corresponds to a calculation using mode frequencies that are essentiallythe same as those in column 2 of Table 4 and in the earlier assignment byMenendez and Guha [71]. The agreement between the fit and the calcula-tion is excellent, except for the intensity at the lowest energies, where thediscrepancy has been attributed to coherency effects [78].
The agreement between the frequencies of Table 4 and the results of INSextends beyond 700 cm−1. Figures 7 and 8 compare a theoretical predictionbased on Table 4 with recent INS data obtained by Coulombeau et al. [79].For this experiment, the authors used the MARI spectrometer at the ISISpulsed neutron source of the Rutherford Appleton Laboratory, UK. Thisspectrometer features an array of detectors distributed over a wide angularrange, and consequently the momentum transfer h ~Q is not well defined. Sincethis makes it difficult to include Debye-Waller and coherency effects in thetheoretical simulations, we computed each of the theoretical spectra in Figs. 7

42 Jose Menendez and John B. Page
1000 1100 1200 1300 1400 1500 1600 1700
Inte
nsity
(ar
bitr
ary
units
)
Frequency shift (cm- 1)Fig. 8. Experimental inelastic neutron scattering spectrum of C60, showing high-energy modes (circles) [79]. The solid line is a calculated spectrum consisting ofa sum of Gaussians centered at the mode frequencies of Table 4 and weightedaccording to the modes’ degeneracies. The width of each Gaussian is taken to beproportional to the mode’s energy and adjusted to the experimental data. The bestagreement is obtained using ∆E/E = 0.022. A linear background has been added,and the energies were rescaled as discussed in the text
and 8 as a simple sum of Gaussians with weights proportional to the modedegeneracies and a single width parameter ∆E/E adjusted to best fit theexperimental data. The agreement is excellent, and it is made nearly perfectby rescaling the experimental frequencies by a factor of 0.99. This is shownin Figs. 7 and 8. The necessity for the rescaling factor is suggested by thefact that some of the INS peaks which originate from spectroscopically activevibrations appear at an energy 1% higher than the value known from IR orRaman spectroscopy. It is quite apparent that the INS data provide strongsupport for the mode assignments in Table 4.
2.7 Optical Spectroscopy
Optical absorption spectroscopy, fluorescence and phosphorescence spectracan also be powerful tools for the identification of vibrational modes inmolecules. Of particular relevance for our analysis is the work of Sassara etal., who investigated – with exquisite detail – the vibrational fine structurein the fluorescence [80] and phosphorescence [103] spectra of C60 moleculesisolated in neon and argon matrices. This work leads to the unambiguousidentification of several vibrational modes of T3u, Hu, and Gu symmetry.
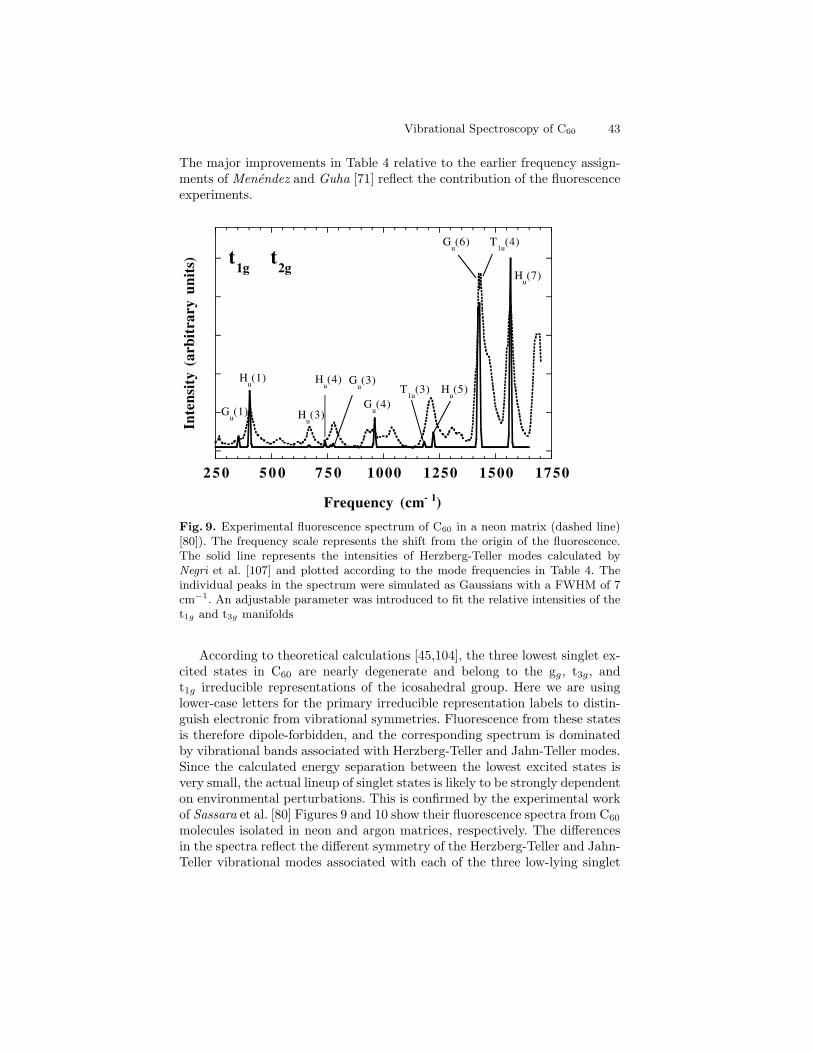
Vibrational Spectroscopy of C60 43
The major improvements in Table 4 relative to the earlier frequency assign-ments of Menendez and Guha [71] reflect the contribution of the fluorescenceexperiments.
2 5 0 5 0 0 7 5 0 1000 1250 1500 1750
Inte
nsity
(ar
bitr
ary
units
)
Frequency (cm- 1)
Hu(1)
Hu(7)
Gu(6) T
1u(4)
Hu(5)T
1u(3)
Gu(4)
Gu(3)H
u(4)
Hu(3)G
u(1)
t2g
t1g
Fig. 9. Experimental fluorescence spectrum of C60 in a neon matrix (dashed line)[80]). The frequency scale represents the shift from the origin of the fluorescence.The solid line represents the intensities of Herzberg-Teller modes calculated byNegri et al. [107] and plotted according to the mode frequencies in Table 4. Theindividual peaks in the spectrum were simulated as Gaussians with a FWHM of 7cm−1. An adjustable parameter was introduced to fit the relative intensities of thet1g and t3g manifolds
According to theoretical calculations [45,104], the three lowest singlet ex-cited states in C60 are nearly degenerate and belong to the gg, t3g, andt1g irreducible representations of the icosahedral group. Here we are usinglower-case letters for the primary irreducible representation labels to distin-guish electronic from vibrational symmetries. Fluorescence from these statesis therefore dipole-forbidden, and the corresponding spectrum is dominatedby vibrational bands associated with Herzberg-Teller and Jahn-Teller modes.Since the calculated energy separation between the lowest excited states isvery small, the actual lineup of singlet states is likely to be strongly dependenton environmental perturbations. This is confirmed by the experimental workof Sassara et al. [80] Figures 9 and 10 show their fluorescence spectra from C60
molecules isolated in neon and argon matrices, respectively. The differencesin the spectra reflect the different symmetry of the Herzberg-Teller and Jahn-Teller vibrational modes associated with each of the three low-lying singlet
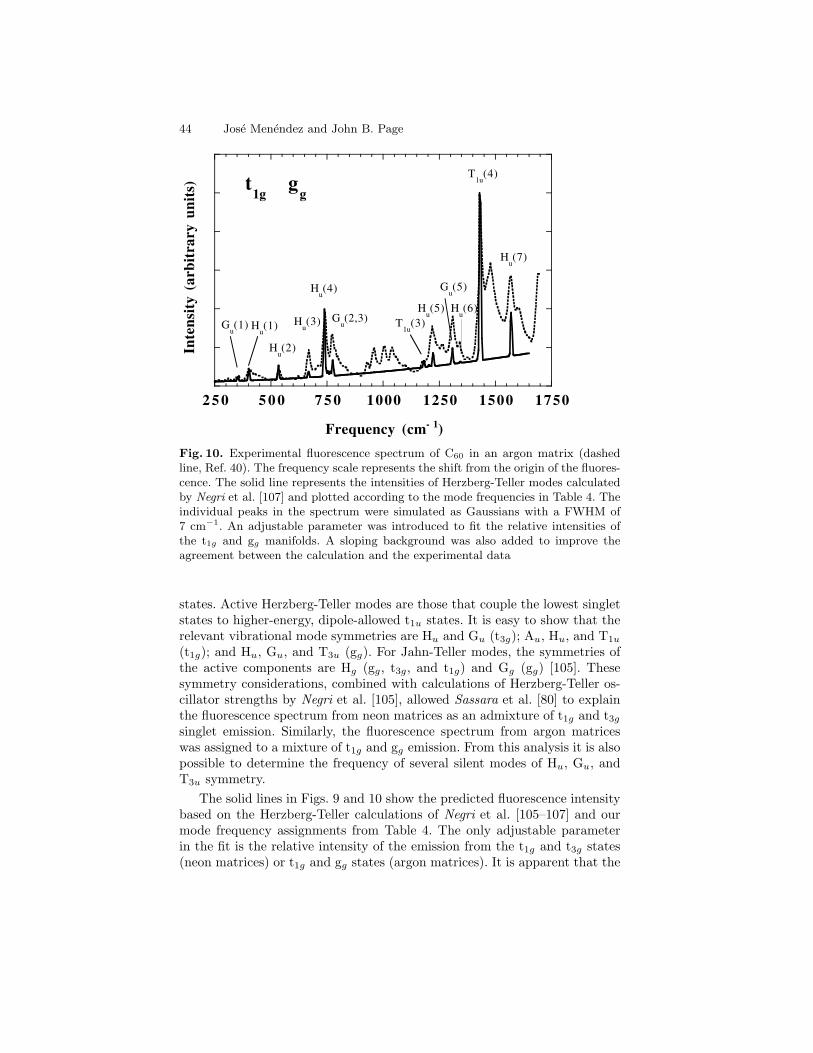
44 Jose Menendez and John B. Page
2 5 0 5 0 0 7 5 0 1000 1250 1500 1750
Inte
nsity
(ar
bitr
ary
units
)
Frequency (cm- 1)
Gu(1) H
u(1)
Hu(2)
Hu(3)
Hu(4)
Gu(2,3) T
1u(3)
Hu(5)
Gu(5)
Hu(6)
T1u
(4)
Hu(7)
t1g
gg
Fig. 10. Experimental fluorescence spectrum of C60 in an argon matrix (dashedline, Ref. 40). The frequency scale represents the shift from the origin of the fluores-cence. The solid line represents the intensities of Herzberg-Teller modes calculatedby Negri et al. [107] and plotted according to the mode frequencies in Table 4. Theindividual peaks in the spectrum were simulated as Gaussians with a FWHM of7 cm−1. An adjustable parameter was introduced to fit the relative intensities ofthe t1g and gg manifolds. A sloping background was also added to improve theagreement between the calculation and the experimental data
states. Active Herzberg-Teller modes are those that couple the lowest singletstates to higher-energy, dipole-allowed t1u states. It is easy to show that therelevant vibrational mode symmetries are Hu and Gu (t3g); Au, Hu, and T1u
(t1g); and Hu, Gu, and T3u (gg). For Jahn-Teller modes, the symmetries ofthe active components are Hg (gg, t3g, and t1g) and Gg (gg) [105]. Thesesymmetry considerations, combined with calculations of Herzberg-Teller os-cillator strengths by Negri et al. [105], allowed Sassara et al. [80] to explainthe fluorescence spectrum from neon matrices as an admixture of t1g and t3g
singlet emission. Similarly, the fluorescence spectrum from argon matriceswas assigned to a mixture of t1g and gg emission. From this analysis it is alsopossible to determine the frequency of several silent modes of Hu, Gu, andT3u symmetry.
The solid lines in Figs. 9 and 10 show the predicted fluorescence intensitybased on the Herzberg-Teller calculations of Negri et al. [105–107] and ourmode frequency assignments from Table 4. The only adjustable parameterin the fit is the relative intensity of the emission from the t1g and t3g states(neon matrices) or t1g and gg states (argon matrices). It is apparent that the

Vibrational Spectroscopy of C60 45
fluorescence data provide very strong experimental support for many of theassignments in Table 4, most notably for modes Hu(1), Hu(4), Gu(6), andHu(7).
We indicated above that Table 4 incorporates the fluorescence resultsthrough modification of some of the earlier mode assignments made by Menendezand Guha [71]. On the other hand, the original frequency assignments in [71]and [72], together with the first-principles normal mode calculations of Gi-annozzi and Baroni [47], led to a revised interpretation of some of the detailsof the fluorescence spectra. This is because Sassara et al. based their ini-tial analysis [80] on earlier calculations by Negri et al. [105]. A comparisonwith experimental data that became available after these calculations werepublished, as well as with the vibrational frequencies of [47], led Negri et al.to propose a slightly different assignment of oscillator strengths [106]. Addi-tional discrepancies with the frequency assignments of Menendez and Guha[71] motivated yet another revision [107], which has been incorporated intoFigs. 9 and 10. It is gratifying to note that the latest calculations of Negri etal. [106,107] make it possible to give a unified explanation of the fluorescenceand inelastic neutron scattering spectra in terms of the mode frequencies ofTable 4.
From the point of view of silent mode spectroscopy, the Herzberg-Tellervibronic activity shown in Figs. 9 and 10 is the most interesting componentof the fluorescence. The Jahn-Teller contribution is dominated by Raman-active Hg modes and therefore offers little additional insight into the vibra-tional structure of C60. However, this contribution must be computed for adetailed quantitative comparison between experimental and theoretical fluo-rescence spectra, as recently done by Sassara et al. [108]. They also includedFranck-Condon terms and extended the calculations to take into account twoadditional many-electron excited states, of t3u and hg symmetry. The re-sulting agreement between theory and experiment is very remarkable, withthe calculation reproducing the rich fluorescence spectrum, even in its minordetails.
2.8 High-Resolution Electron Energy Loss
A beam of monoenergetic electrons is scattered by the electric dipole as-sociated with infrared-active vibrations. This leads to the observation ofinfrared-active modes in high-resolution electron-energy loss (HREELS) mea-surements. HREELS experiments require an ultra-high vacuum environmentand cannot match the resolution of optical measurements, so that there ap-pears to be no obvious advantage in using this technique for the determinationof the infrared mode frequencies. However, HREELS experiments are impor-tant for the assignment of vibrational frequencies in C60 because all modescan induce inelastic scattering of electrons via the short-range componentsof the electron-molecule interaction. This is the so-called impact scattering

46 Jose Menendez and John B. Page
mechanism [109]. Gensterblum et al. [109,110] have performed HREELS ex-periments on C60 films. Depending on the substrate used, the films are crys-talline or disordered. This has a significant effect on the relative intensityof the different spectral features. Figure 11 shows experimental data for anordered C60 film grown on a GaSe substrate. The spectrum is compared witha broadened density of vibrational states computed from Table 4. It is quiteapparent that the mode assignment in Table 4 is consistent with all of thepeaks observed with HREELS. The computed density of states also agreessurprisingly well with the peak intensities for the ordered film. The largestdiscrepancies correspond to the IR active vibrations, which are indicated byarrows in Fig. 11. These discrepancies, however, are not unexpected, sincethe infrared-active vibrations scatter the electrons via the additional dipolescattering mechanism, which is sensitive to the dipole matrix elements.
4 0 0 6 0 0 8 0 0 1000 1200 1400 1600 1800
Inte
nsity
(ar
bitr
ary
units
)
Frequency shift (cm- 1)
C60
/ GaSeE
p = 3.7 eV
ordered film× 5
Fig. 11. Experimental HREELS for a C60 film grown on GaSe(0001) (points). FromRef. 72. The solid line represents the vibrational density of states in C60, calculatedaccording to the mode frequencies in Table 4. The Gaussian broadening of thedensity of states was chosen as 70 cm−1 (FWHM), which gives an excellent fit ofthe prominent feature at 758 cm−1. The vertical arrows represent the position ofthe four T1u modes
According to Table 4, 41 modes (including degeneracies) appear in the660 cm−1–800 cm−1 range. This is consistent with the prominent HREELSpeak at 758 cm−1. An equivalent broad structure is apparent in the inelasticneutron scattering spectra. It is noteworthy that within this range there areno infrared-active modes, and the only Raman modes are Hg(3) and Hg(4).

Vibrational Spectroscopy of C60 47
This means that the bulk of the structure is due to silent modes. Similarly,other HREELS peaks can be entirely explained in terms of silent modes.For example, a HREELS peak at 347 cm−1 (not shown in Fig. 11) can beidentified with the T3u(1) and Gu(1) modes, and the Au, T3u(3), and Gu(4)modes in Table 4 correspond to the HREELS peak at 960 cm−1.
2.9 Alternative Silent Mode Assignments
Table 4 shows 17 silent modes for which the frequency we recommend cannotbe considered definitive. Several of these modes have been given alternativeassignments in the literature, which we compile here for completeness. Forreasons discussed in Sect. 2.1, we will not consider assignments that deviatefrom the most accurate first-principles calculations by much more than 5%.
T2u(2)
There are two alternative assignments for this mode: an IR peak observed at709–712 cm−1 or an IR peak seen in the range 753–757 cm−1 [52,70,73]. Thefirst assignment, favored by Schettino et al. [72], is in better agreement withfirst-principles calculations and is consistent with a weak peak observed at 714cm−1 in fluorescence experiments [80,108]. However, the close proximity ofthe Hg(3) mode at 709 cm−1 makes it difficult to reach definitive spectroscopicconclusions. On the other hand, the IR peak seen in the 753–757 cm−1 rangecannot be explained as a second-order combination, and it provides, togetherwith our other assignments, the only plausible way to explain the IR peakobserved at 2176 cm−1 [52,70,73], namely as the combination Hg(7) + T2u(2).Turning to the inelastic neutron scattering data, we note that Copley et al.[78] report a peak at 708 cm−1, which is resolution limited, so that if T2u(2)is part of this structure it would have to be almost degenerate with the Hg(3)mode. The intensity of this INS peak is comparable to that of a nearby INSpeak at 668 cm−1 [78], which corresponds to the 5-fold degenerate Hu(3)mode. Hence, the similar intensity of the 708 cm−1 INS peak argues againstthe existence of both a 5-fold degenerate and a 3-fold degenerate mode at thisfrequency. Very similar conclusions can be reached from Coulombeau’s MARIdata [79]. In addition, the higher resolution of this experiment allows theauthors to resolve three peaks in the broad structure around 750 cm−1. Thetheoretical calculation of the INS spectrum agrees better with this three-peakstructure if the T2u peak is placed at 753 cm−1, as shown in Fig. 7.
T1g(2)
Our assignment of this mode is based on INS data [77,79,102], showing apeak near 840 cm−1. A peak at 813 cm−1 has also been reported [70]. Bothstructures have been assigned to T1g(2) [71,72]. The 840 cm−1 assignment

48 Jose Menendez and John B. Page
is further supported by a Raman peak observed by Rosenberg et al. [89] at835 cm−1 in 13C enriched samples, although this peak can also be assignedto a second-order combination [89]. As can be seen in Fig. 7, the agreementof the MARI INS data of Coulombeau et al. [79] with the frequencies inTable 4 is excellent. On the other hand, Copley et al. [78] fail to observe anyevidence for INS peaks in the 800–900 cm−1 range. Moreover, they claimthat the strong structure between 725 and 800 cm−1 should be assigned tofour 3-fold degenerate modes, three 4-fold modes, and two 5-fold modes. Thisagrees exactly with our assignments if we place the T1g(2) mode below 800cm−1. We noticed that a frequency of 790 cm−1 provides a good fit of theCopley et al. neutron scattering data. However, the latest MARI INS dataof Coulombeau et al. [79] probably should be preferred in this range, giventhe better resolution and improved signal-to-noise ratio. This is the reasonfor our recommended frequency for T1g(2).
T2u(3)
The two first-principles calculations in Table 4 predict three modes in therange 900–1000 cm−1. These are the Gu(4), T2u(3), and Au modes, and thisprediction is in good agreement with INS data. Copley et al. [78] find an INSpeak at 970 cm−1 which has a total integrated intensity consistent with thesethree modes. The frequency of the Gu(4) mode is 961 cm−1 according to thefluorescence experiments [80,108]. We obtain an excellent fit of the INS dataof [78] by further assuming that the frequencies of the T2u(3) and Au modesare 973 cm−1 and 984 cm−1, respectively. Unfortunately, the high-resolutionMARI INS data of Coulombeau et al. [79] do not include this frequency range.Our assignment is also consistent with an observed IR peak at 973 cm−1 [70],although this peak can also be explained as a second-order combination. Analternative assignment for T2u(3), proposed by Schettino et al. [72], is theIR peak observed at 1040 cm−1 [52,72,73], although this peak can also beexplained in terms of the second-order combination Hg(1)+Gu(2). No INSstructure is seen at this frequency.
Gg(4)
We assigned Gg(4) to a Raman peak observed by several authors at 1079cm−1 [68,86,87,89]. An alternative assignment is a Raman peak seen at 1138–1142 cm−1 [68,73,86]. Gallagher and coworkers have observed a strong res-onance of this peak and have analyzed its excitation profile on the basisof the Gg(4) assignment [111,112]. However, as pointed out by these au-thors and others, the 1140 cm−1 peak can also be explained in terms of thesecond-order combination Hg(2)+Hg(3) = 1142 cm−1. Our assignment of fre-quencies leads to several more possible combinations: Hu(1) + Hu(4) = 1142cm−1, T1g(1) +T2g(2) = 1136 cm−1, Gg(2)+Gg(2) = 1134 cm−1, T1g(1) +Gg(2) = 1135 cm−1. This would explain the significant width of the 1140

Vibrational Spectroscopy of C60 49
cm−1 Raman peak and the observation by Gallagher et al. [112] of a shoul-der at 1136 cm−1. There are many examples in the literature of second-orderRaman peaks which under resonance conditions become stronger than first-order peaks, so we conclude that our assignment of the 1140 cm−1 band to asecond-order combination is not inconsistent with the existing experimentalevidence. Moreover, the INS spectrum shows a pronounced dip at this fre-quency [79]. Additional work is probably needed to pin down the assignmentof Gg(4), but we prefer the assignment in Table 4.
T2u(4), T2u(5) and Gg(6)
Our analysis of the isotopic shift of the 1470 cm−1 Ag(2) Raman peak showsthat the presence of a mode about 12 cm−1 higher than this is critical forthe explanation of the Raman spectra [21,22]. We placed the Gg(6) modeat this position in view of the theoretical predictions for this mode and theobservation of a clear Raman peak at this frequency, which is in fact one ofthe strongest silent mode signals in the Raman spectrum of C60. As notedearlier, all other Gg modes are seen as weak lines in the Raman spectrum.It was suggested by Love et al. [87], however, that the peak at 1482 cm−1
corresponds to the T2u(5) mode, and our calculations suggest that this wouldalso be consistent with the observed isotope shifts. The T2u(5) peak has beenplaced at 1540 cm−1 by Schettino et al. [72]. We prefer the value 1525 cm−1
because it agrees with a weak IR peak [68,70,73], but this peak can alsobe explained as a second-order combination band. The MARI INS data ofCoulombeau et al. [79] shows two peaks in this region, which is consistentwith the presence of Gg(6) and T2u(5). However, the separation between thetwo INS peaks is 24 cm−1, whereas according to Table 4 this separation is 43cm−1. This is one of the only two significant discrepancies between the INSdata and Table 4, the other being the position of the highest-energy peak,after rescaling the energies as discussed above. The agreement with the INSdata could be improved by placing the T2u peak at 1506 cm−1, but it isuncertain whether the quality of the data guarantees this assignment.
3 Infrared Absorption Intensities of C60
From (17), the area of the first-order IR absorption peak due to mode f is pro-portional to the square of the dipole moment derivative ~µf = [∂~µ(u)/∂df ]0.This quantity is determined by the mode eigenvector χ(f) and the real-spaceeffective charges [∂~µ(u)/∂u(`α)]0 through (15) [or its equivalent (18)]. Phys-ically, ~µf is the dipole moment of the system (per unit displacement df ) afterdisplacing the real-space effective charges according to the mode pattern.
If the adiabatic many-electron ground state wave function φ0(x,u) isknown, the real-space effective charges can be computed directly from the dis-placement derivatives of (13), and the results combined with calculated mode

50 Jose Menendez and John B. Page
Table 6. Electronic-structure based calculations of the relative absorptionstrengths (peak areas) for the four first-order IR active modes of icosahedral C60.Results are given for three semi-empirical models (TBA and MNDO) and threefirst-principles models (LDA). The strengths are normalized to that of T1u(1). Thelast column gives measured values, for comparison
Mode TBAa TBAb MNDOc LDAd LDAe LDAf Experimentg
T1u(1) 1.0 1.0 1.0 1.0 1.0 1.0 1.0T1u(2) 0.47 0.08 0.33 0.65 0.65 0.63 0.34T1u(3) 0.17 0.18 1.9 1.4 0.59 0.36 0.28T1u(4) 2.7 1.7 4.4 0.31 0.41 0.57 0.34
aBertsch et al. [113]bEsfarjani et al. [114]cStanton and Newton [43]dAdams et al. [53]eBertsch et al. [113]fGiannozzi and Baroni [47]gChase et al. [84]
eigenvectors to yield predicted IR strengths. Table 6 gives such electronic-structure based predictions, for six representative models. The strengths arenormalized to that for T1u(1), and for comparison, the last column gives thestrength ratios measured by Chase et al. [84]. Columns two and three giveresults from empirical tight binding models [113,114], the fourth column givesratios from quantum chemistry semi-empirical MNDO calculations [43], andthe results in columns five through seven are from three implementations offirst-principles LDA techniques. These are the pseudoatomic orbital scheme[54], which we have previously used to compute the geometries and normalmodes of a variety of fullerenes [53] (column five), the Car-Parrinello method[48] as used by Bertsch et al. [113] (column six), and Density Functional Per-turbation Theory calculations of Giannozzi and Baroni [47] (column seven).Our choice to compare with the measured IR strength ratios of [84] is some-what arbitrary, and for comparison, Table 7 lists ratios measured by severalgroups [84,115–119]. All of these experiments were done on condensed phasesamples of C60, either thin film or crystalline, and it is not clear to what ex-tent the differences between the various experiments are due to intermoleculareffects, temperature variations, sample/substrate interactions, etc. Since theIR strengths provide a stringent test of theoretical models, it would be veryuseful to have low temperature IR data available for unperturbed icosahedralC60 in the gas phase.
The theoretical IR strength ratios in Table 6 exhibit a wide variation frommodel to model, much larger than the variations between the different mea-surements given in Table 7. The mode dipole moment derivatives ~µf describevibrationally-induced electronic charge redistribution and offer a more diffi-
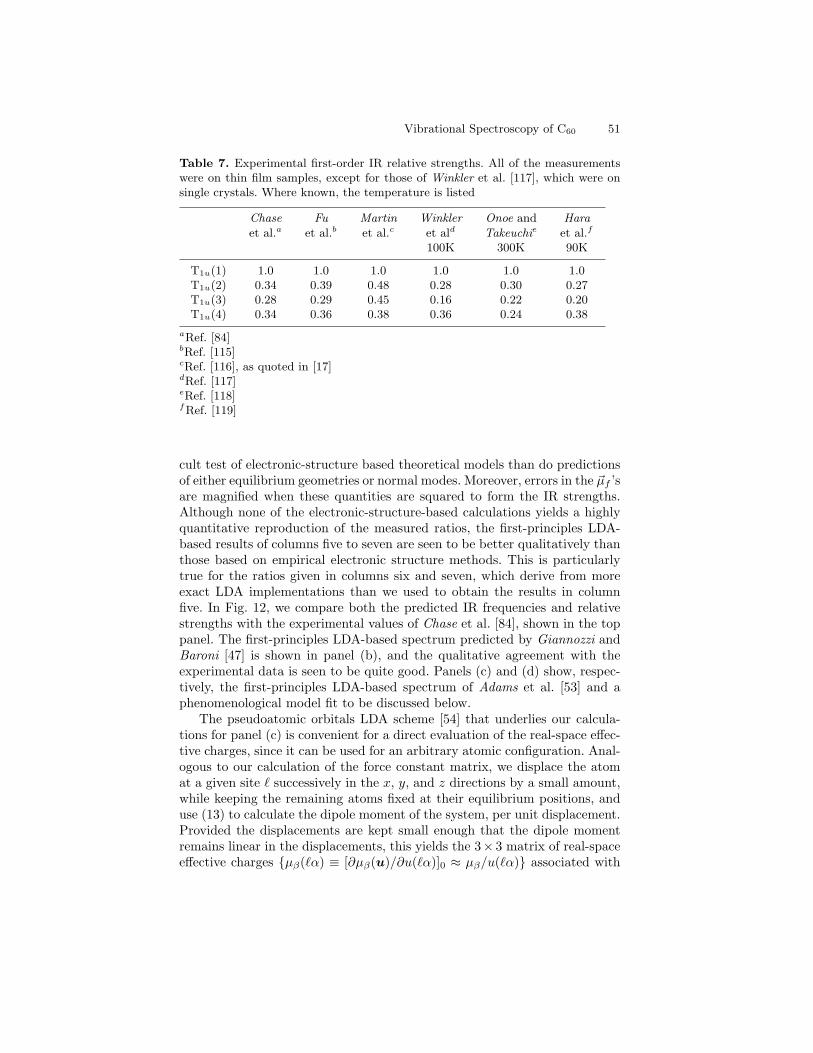
Vibrational Spectroscopy of C60 51
Table 7. Experimental first-order IR relative strengths. All of the measurementswere on thin film samples, except for those of Winkler et al. [117], which were onsingle crystals. Where known, the temperature is listed
Chase Fu Martin Winkler Onoe and Hara
et al.a et al.b et al.c et ald Takeuchie et al.f
100K 300K 90K
T1u(1) 1.0 1.0 1.0 1.0 1.0 1.0T1u(2) 0.34 0.39 0.48 0.28 0.30 0.27T1u(3) 0.28 0.29 0.45 0.16 0.22 0.20T1u(4) 0.34 0.36 0.38 0.36 0.24 0.38
aRef. [84]bRef. [115]cRef. [116], as quoted in [17]dRef. [117]eRef. [118]fRef. [119]
cult test of electronic-structure based theoretical models than do predictionsof either equilibrium geometries or normal modes. Moreover, errors in the ~µf ’sare magnified when these quantities are squared to form the IR strengths.Although none of the electronic-structure-based calculations yields a highlyquantitative reproduction of the measured ratios, the first-principles LDA-based results of columns five to seven are seen to be better qualitatively thanthose based on empirical electronic structure methods. This is particularlytrue for the ratios given in columns six and seven, which derive from moreexact LDA implementations than we used to obtain the results in columnfive. In Fig. 12, we compare both the predicted IR frequencies and relativestrengths with the experimental values of Chase et al. [84], shown in the toppanel. The first-principles LDA-based spectrum predicted by Giannozzi andBaroni [47] is shown in panel (b), and the qualitative agreement with theexperimental data is seen to be quite good. Panels (c) and (d) show, respec-tively, the first-principles LDA-based spectrum of Adams et al. [53] and aphenomenological model fit to be discussed below.
The pseudoatomic orbitals LDA scheme [54] that underlies our calcula-tions for panel (c) is convenient for a direct evaluation of the real-space effec-tive charges, since it can be used for an arbitrary atomic configuration. Anal-ogous to our calculation of the force constant matrix, we displace the atomat a given site ` successively in the x, y, and z directions by a small amount,while keeping the remaining atoms fixed at their equilibrium positions, anduse (13) to calculate the dipole moment of the system, per unit displacement.Provided the displacements are kept small enough that the dipole momentremains linear in the displacements, this yields the 3× 3 matrix of real-spaceeffective charges µβ(`α) ≡ [∂µβ(u)/∂u(`α)]0 ≈ µβ/u(`α) associated with
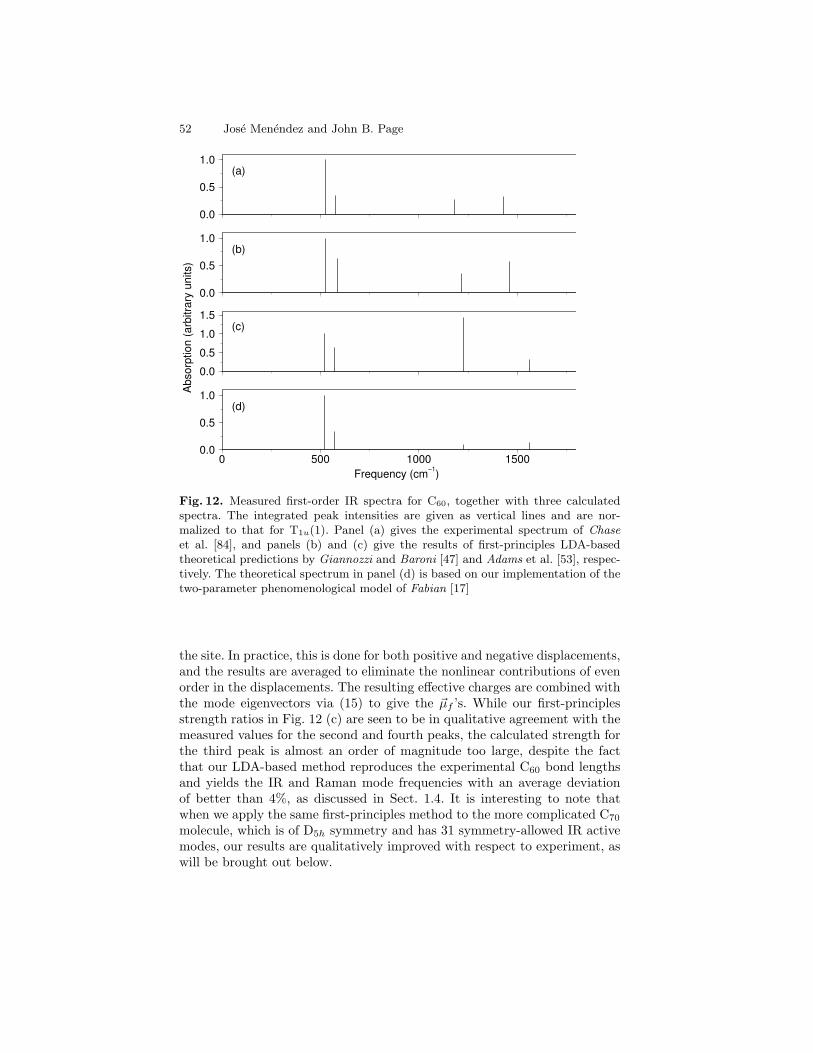
52 Jose Menendez and John B. Page
0 500 1000 1500Frequency (cm−1)
0.0
0.5
1.0Abs
orpt
ion
(arb
itrar
y un
its)
(d)
0.0
0.5
1.0
1.5(c)
0.0
0.5
1.0(b)
0.0
0.5
1.0(a)
Fig. 12. Measured first-order IR spectra for C60, together with three calculatedspectra. The integrated peak intensities are given as vertical lines and are nor-malized to that for T1u(1). Panel (a) gives the experimental spectrum of Chaseet al. [84], and panels (b) and (c) give the results of first-principles LDA-basedtheoretical predictions by Giannozzi and Baroni [47] and Adams et al. [53], respec-tively. The theoretical spectrum in panel (d) is based on our implementation of thetwo-parameter phenomenological model of Fabian [17]
the site. In practice, this is done for both positive and negative displacements,and the results are averaged to eliminate the nonlinear contributions of evenorder in the displacements. The resulting effective charges are combined withthe mode eigenvectors via (15) to give the ~µf ’s. While our first-principlesstrength ratios in Fig. 12 (c) are seen to be in qualitative agreement with themeasured values for the second and fourth peaks, the calculated strength forthe third peak is almost an order of magnitude too large, despite the factthat our LDA-based method reproduces the experimental C60 bond lengthsand yields the IR and Raman mode frequencies with an average deviationof better than 4%, as discussed in Sect. 1.4. It is interesting to note thatwhen we apply the same first-principles method to the more complicated C70
molecule, which is of D5h symmetry and has 31 symmetry-allowed IR activemodes, our results are qualitatively improved with respect to experiment, aswill be brought out below.

Vibrational Spectroscopy of C60 53
Given the difficulties of quantitatively predicting IR strengths directlyfrom the electronic states, one can undertake to derive phenomenologicalmodels having sufficiently few parameters that the data can be meaning-fully fit. If a quantitative model can be achieved, studies of isotope-inducedspectral changes can be used to reveal information on spectroscopically inac-tive modes, as discussed in Sect. 2.5. Moreover, the vast number of possiblefullerene structures and the similarity of their local bonding renders themattractive for attempts to develop phenomenological models which can beeasily transferred from simpler to more complicated systems.
An ambitious model of this sort is that of Sanguinetti et al. [63], whichcombines the bond charge model of Weber [61] with a bond polarizabilityapproach [120,121]. The result is a 6-parameter model which allows one tocompute the equilibrium geometry, normal modes, IR strengths, and Ramanstrengths. The number of independent parameters is reduced to four whenfirst-principles LDA-calculated equilibrium positions are input, and three ofthese are determined by fitting the frequencies of the 14 first-order IR andRaman modes. The fit reproduces these frequencies with an average devia-tion of 3.8%. The IR strengths can then be predicted (the Raman strengthsrequire an additional parameter), yielding the strength ratios 1.0, 0.03, 0.4,0.2. Unfortunately, while the calculated strength ratios for peaks three andfour are in qualitative agreement with experiment, the negligible predictedintensity for T1u(2) is strongly at variance with the fact that this is the sec-ond most intense measured peak. Moreover, the result of transferring thismodel to C70 in [63] is a predicted IR spectrum which is dominated by a verystrong peak near 550 cm−1, whereas the experimental spectrum is dominatedby a very intense peak at 1430 cm−1. We do not know how well the situationmight be improved by simply using the model to fit the C60 IR strengths,at the expense of the mode frequencies. The first-order Raman spectrumpredicted by the model for C60 is better than for the IR, but the eight Hg
peaks are consistently too strong. The predicted Raman spectrum for C70
is similarly better than for the IR, although the large number of symmetry-allowed modes (53, encompassing 3 irreducible representations) makes thepeak assignments and detailed comparisons difficult.
Since there are many models that give good results for the vibrations, it isreasonable to focus on just the effective charges when trying to develop quan-titative phenomenological models for the IR strengths, feeding in the modeeigenvectors from separate calculations. In contrast to bond charge models,which emphasize the effect of the electronic density between the atoms, a sim-plified classical model for the effective charges which focuses on the π-electronsystem has been developed by Fabian [17]. With the mode eigenvectors given,the result is a two-parameter model for the relative strengths of the first-orderIR peaks.
The dipole moment of a given mode in Fabian’s model is determined byhow the atomic motion affects the classical coordinates ~ri(t) of the 60 π

54 Jose Menendez and John B. Page
electrons, each of which belongs to a parent carbon atom, at position ~Ri(t).Each carbon is bonded via two “single” bonds and a “double” bond to threeneighbors, whose positions are denoted by ~Rij(t), for j = 1, 3. Due to theinteractions with the three adjacent bonds, the coordinate for π electron i isassumed to vary as ~ri(t) = [1 + c2∆i(c1, t)]ni(c1, t), where c1 and c2 are themodel’s fitting parameters, ni(c1, t) is the unit normal vector to the planedefined by the three neighboring atoms’ instantaneous positions (which arerescaled as described below), and ∆i(c1, t) is the difference between the in-stantaneous and equilibrium values of the distance of the parent atom i fromthis plane. The dipole moment is simply taken to be ~µ(t) = C
∑60i=1 ~ri(t),
where the constant prefactor C is unimportant for relative intensities. The pa-rameter c1 accounts in a simplified way for the different interactions betweenelectron i and its adjacent single or double bonds. This is done by rescaling theposition of the doubly-bonded neighbor by a factor c1: ~Rid(t) → c1 ~Rid(t); norescaling is done when j represents either of the two singly-bonded neighbors.Geometrically, this rescaling causes the direction of the electron coordinate~ri(t) to deviate from the instantaneous normal to the actual plane of neigh-bors, by instead tilting away (for positive c1) from the double bond. With justnormal mode f excited, the atomic positions are ~Ri(t) = ~Ri,0 + ~χ(i|f)df (t),and the unit vectors become ni(c1, t) = ni,0(c1) +∆ni(c1, t), where the zerosubscripts denote equilibrium configuration quantities. It is then straightfor-ward to evaluate the mode dipole moment derivatives ~µf = [∂~µ(u)/∂df ]0 asa function of the atomic equilibrium positions, the mode eigenvectors, andthe model parameters c1 and c2.
Using our first-principles eigenvectors [53], and varying the parametersc1 and c2, we obtain the calculated relative intensities shown in the fourthpanel of Fig. 12. Our parameter values are (c1, c2) = (1.34, 0.67). These maybe compared with the values (1.59, 0.67) obtained by Fabian [17], who used adifferent model for the eigenvectors and fit to the relative intensities measuredby Martin et al. [116], whereas we are comparing with the data of Chase etal. [84]. Although our fit value for the intensity ratio of the first to the secondpeak is perfect, the third and fourth peaks are roughly a factor of 1/3 too low.Moreover, forcing a better fit for either or both of these two peaks worsensthe overall fit. Given that the model has two free parameters for just threeobserved IR intensity ratios, the results again illustrate the very stringenttheoretical test provided by the IR intensities.
The IR intensity model of Fabian is classical and depends only on thegeometry of the vibrating molecule, with the central role played by the planedefined by the three neighbors of each carbon atom. To see if the modelmight have a useful transferability to more complicated trigonally-bondedfullerenes, we used it, with our above values of c1 and c2, to compute therelative intensities for D5h C70 molecules. These have eight distinct bondsrather than two, and we made the the rough approximation of simply dividingthe bonds into two sets, according to whether their lengths are larger or
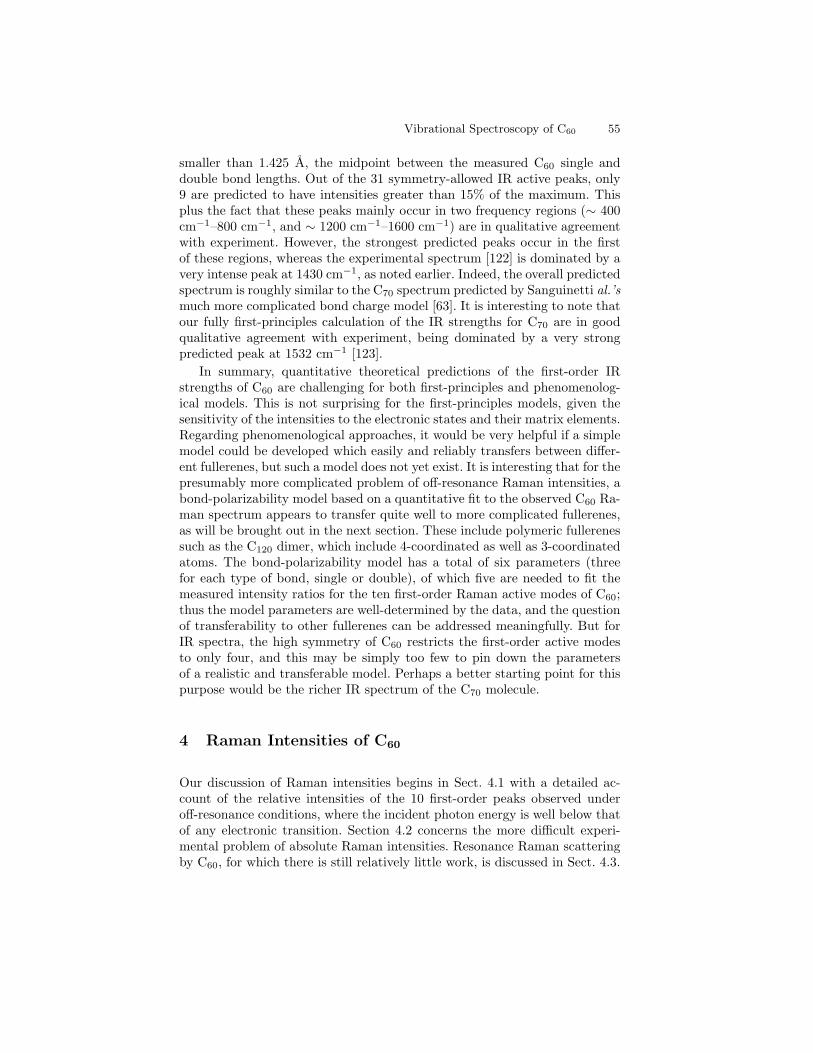
Vibrational Spectroscopy of C60 55
smaller than 1.425 A, the midpoint between the measured C60 single anddouble bond lengths. Out of the 31 symmetry-allowed IR active peaks, only9 are predicted to have intensities greater than 15% of the maximum. Thisplus the fact that these peaks mainly occur in two frequency regions (∼ 400cm−1–800 cm−1, and ∼ 1200 cm−1–1600 cm−1) are in qualitative agreementwith experiment. However, the strongest predicted peaks occur in the firstof these regions, whereas the experimental spectrum [122] is dominated by avery intense peak at 1430 cm−1, as noted earlier. Indeed, the overall predictedspectrum is roughly similar to the C70 spectrum predicted by Sanguinetti al.’smuch more complicated bond charge model [63]. It is interesting to note thatour fully first-principles calculation of the IR strengths for C70 are in goodqualitative agreement with experiment, being dominated by a very strongpredicted peak at 1532 cm−1 [123].
In summary, quantitative theoretical predictions of the first-order IRstrengths of C60 are challenging for both first-principles and phenomenolog-ical models. This is not surprising for the first-principles models, given thesensitivity of the intensities to the electronic states and their matrix elements.Regarding phenomenological approaches, it would be very helpful if a simplemodel could be developed which easily and reliably transfers between differ-ent fullerenes, but such a model does not yet exist. It is interesting that for thepresumably more complicated problem of off-resonance Raman intensities, abond-polarizability model based on a quantitative fit to the observed C60 Ra-man spectrum appears to transfer quite well to more complicated fullerenes,as will be brought out in the next section. These include polymeric fullerenessuch as the C120 dimer, which include 4-coordinated as well as 3-coordinatedatoms. The bond-polarizability model has a total of six parameters (threefor each type of bond, single or double), of which five are needed to fit themeasured intensity ratios for the ten first-order Raman active modes of C60;thus the model parameters are well-determined by the data, and the questionof transferability to other fullerenes can be addressed meaningfully. But forIR spectra, the high symmetry of C60 restricts the first-order active modesto only four, and this may be simply too few to pin down the parametersof a realistic and transferable model. Perhaps a better starting point for thispurpose would be the richer IR spectrum of the C70 molecule.
4 Raman Intensities of C60
Our discussion of Raman intensities begins in Sect. 4.1 with a detailed ac-count of the relative intensities of the 10 first-order peaks observed underoff-resonance conditions, where the incident photon energy is well below thatof any electronic transition. Section 4.2 concerns the more difficult experi-mental problem of absolute Raman intensities. Resonance Raman scatteringby C60, for which there is still relatively little work, is discussed in Sect. 4.3.

56 Jose Menendez and John B. Page
4.1 Relative Intensities for Off-Resonance Scattering
As discussed in Sect. 1.2, the key quantity determining off-resonance Ramanintensities is the system’s electronic polarizability Pαβ(ωL,u) for fixed atomicconfiguration u and incident light frequency ωL, where the latter is assumedto be well below any electronic transition frequency. The static limit ωL = 0leads to the usual off-resonance selection rules, e.g. for icosahedral C60, thefirst-order Raman activity is restricted to the Ag and Hg modes. From (24)and (25), the intensity of first-order scattering by mode f is proportional tothe square of the mode’s static electronic polarizability derivative
Pαβ,f =∑`γ
[∂Pαβ(u)∂u(`γ)
]0
χ(`γ|f). (36)
The dynamical properties enter this quantity through the normal mode eigen-vectors χ(f), while the real-space polarizability derivatives are determinedby the electron-vibrational coupling. Section 1.4 reviewed theoretical calcu-lations of C60 vibrations, and here we focus on computing the polarizabilityderivatives.
Just as for the IR effective charges and the dynamical properties, two gen-eral approaches can be undertaken to compute the polarizability derivativesPαβ(`γ), namely first-principles and phenomenological. For first-principlescalculations directly from the basic Born-Oppenheimer electronic states, onecould try to use the fundamental linear response theory result (20) for theelectronic polarizability. Unfortunately, this would require knowledge of allthe many-electron excited as well as ground states, and these are very difficultto calculate with current state-of-the-art first-principles techniques. To avoidthis, one could instead undertake to solve the many-electron ground stateproblem in the presence of an applied electrostatic field, with the couplingtreated within the dipole approximation, i.e. − ~Me · ~E, where ~Me is the elec-tronic dipole moment operator
∑e qe~xe. A calculation of the change in the
expectation value of ~Me, per unit applied field with the atoms fixed at theirequilibrium positions would then yield the static electronic polarizability. Toobtain the polarizability derivatives would involve the further step of solvingthe many-electron ground state problem in the presence of both a static Efield and a displaced atomic configuration. This is equivalent to computing thethird derivative of the many-electron ground state energy, twice with respectto an external static electric field and once with respect to an atomic displace-ment. LDA-based calculation of this sort have been made for small molecules[124,125]. Giannozzi and Baroni [47] have used Density Functional Perturba-tion Theory to carry out such calculations for the polarizability derivatives ofC60. The resulting Raman peak intensities were not compared with experi-ment in [47], but they agree quite well with measured first-order off-resonancerelative intensities – the theoretical/experimental comparison is shown in Fig.3 of [126].

Vibrational Spectroscopy of C60 57
Electronic polarizability derivative calculations push first-principles tech-niques to a more difficult level than do purely vibrational or structural calcu-lations and can become very intensive numerically. Accordingly, phenomeno-logical models are useful. In the previous section we discussed the model ofSanguinetti et al. [63], for computing the normal modes, and IR and Ramanspectra of C60 and C70. In 1993, Snoke and Cardona [91] combined a sim-ple bond-polarizability model with separate calculations of the vibrations tocompute the relative intensities of the first-order Raman lines of C60. Wehave found this approach to be convenient for studies of isotope effects, asdiscussed in Sect. 2.5, and for predicting the Raman spectra of more complexstructures, such as polymerized fullerenes [53].
The bond polarizability approach was developed for molecules [127], butit is also useful for solid-state applications, as is reviewed in [121]. The basicassumption is that the static electronic polarizability of a covalent system canbe written as a sum of contributions from the individual bonds. In its simplestform, the contribution Παβ(~R) from the bond associated with a pair of atomsseparated by ~R is taken to be a cylindrically symmetric function of the bondlength. Thus, for a bond parallel to the x-axis, the only nonzero elements ofthe bond polarizability areΠxx(R) ≡ α‖(R) andΠyy(R) = Πzz(R) ≡ α⊥(R).For a general orientation, this becomes
Παβ(~R) =RαRβ
R2α‖(R) + (δαβ −
RαRβ
R2)α⊥(R). (37)
The bond polarizability derivatives are then
∂Παβ(~R)∂Rγ
=[α‖(R)− α⊥(R)
R
](Rαδβγ + Rβδαγ − 2RαRβRγ)
+α′⊥(R)δαβ + [α′‖(R)− α′⊥(R)]RαRβRγ , (38)
where R is a unit vector along ~R.For (36), we need the derivatives of the system’s polarizability with re-
spect to the atomic displacements u(`γ), evaluated at the equilibrium con-figuration. Giving the atom at site ` a displacement ~u(`) while keeping theremaining atoms fixed, we have ~R(`B) = ~R0(`B)− ~u(`), where ~R(`B) is thebond vector from atom ` to any one of its bonded neighbors `B, and ~R0(`B)is the corresponding equilibrium configuration bond vector. Then
[∂Pαβ(u)∂u(`γ)
]0
= −′∑B
[∂Παβ [~R(`B)]∂Rγ(`B)
]0
, (39)
where the prime over the sum signifies that only the bonds attached to site` are summed. Combining (36), (38), and (39) we can write the mode polar-

58 Jose Menendez and John B. Page
izability derivatives in the convenient form [22]
Pαβ,f = −∑
`
∑′B
[α′‖[R0(`B)]+2α′⊥[R0(`B)]
3
R0(`B) · ~χ(`|f)δαβ
+
α′‖[R0(`B)]−α′⊥[R0(`B)]
3
[3R0α(`B)R0β(`B)− δαβ
]R0(`B) · ~χ(`|f)
+
α‖[R0(`B)]−α⊥[R0(`B)]
R0(`B)
[R0α(`B)χ(`β|f) + R0β(`B)χ(`α|f)
−2R0α(`B)R0β(`B)R0(`B) · ~χ(`|f)]]. (40)
The first two terms give the bond-stretching induced changes of the isotropicand anisotropic parts of the bond polarizabilities, respectively, while the thirdterm gives the bond-rotation induced changes of the anisotropic parts of thepolarizabilities. For C60, the first term contributes only to the scattering bythe two Ag modes, and the other two terms contribute only to the scatteringby the eight Hg modes. On a practical note, the above approach is convenientin that it uses the mode eigenvectors in just a single sum over sites, avoidingthe need to compute their differences, i.e. the “bond displacements.”
Table 8. Parameter ratios for our bond-polarizability model fit to the first-orderC60 Raman spectrum measured by Chase et al. [84] (see footnote 5 on page 59). Theincident light frequency used in the experiments was 9398.5 cm−1, below resonancewith electronic transitions. The ratios are taken with respect to the quantity N ≡[α‖(S) − α⊥(S)]/R0(S), where S denotes single bonds. Our calculated C60 bondlengths are R0(S) = 1.45A and R0(D) = 1.40A for single and double bonds,respectively, in agreement with the experimental values. The fit spectra are shownin Fig. 13
Ratio Fit value
[α′‖(S)− α′⊥(S)]/N 2.80
[α′‖(S) + 2α′⊥(S)]/N 2.73
[α′‖(D)− α′⊥(D)]/N 3.18
[α′‖(D) + 2α′⊥(D)]/N 8.98
[α‖(D)− α⊥(D)]/[NR0(S)] 0.256
For C60, the bond sum for each site extends over two “single” bonds andone “double” bond, so that there are six independent polarizability parame-ters, namely α′‖, α
′⊥, and α‖ − α⊥, for each of the two bond types. For the
relative intensities of the Raman peaks, only 5 parameters are needed, and

Vibrational Spectroscopy of C60 59
we have fit Chase et al.’s [84] off-resonance Raman spectra,5 normalizing theparameters with respect to (α‖ −α⊥)/R0 for single bonds. Our fit ratios arelisted in Table 8, and Fig. 13 gives our calculated spectra. The top panel ofthe figure shows the measured frequencies and intensities, and the other twopanels give the freqencies and intensities computed using the parameters ofTable 8 and two different sets of first-principles normal mode frequencies andeigenvectors. For panel (b), we used the eigenfrequencies and eigenvectors ofGiannozzi and Baroni [47], whereas for panel (c) we used those of Adams etal. [53]. The actual fitting of the bond polarizability parameters was doneusing the eigenmodes of [47], but the computed intensities in panels (b) and(c) are seen to be quite similar.
Similar to the IR case, our use of Chase et al.’s experimental off-resonancespectra is somewhat arbitrary, and in Table 9 we compare their intensitieswith those measured by three other groups. All four experiments were doneusing 1064 nm incident excitation. The table lists peak heights, since theareas were not reported in every case. All four groups observed a sidebandat 266 cm−1, just below the Hg(1) peak. In the data of Chase et al. [84], thiswas reported as a shoulder, but in the other three spectra a separate peakwas resolved, whose height is also listed in the table. The shoulder was notincluded in fitting the data of Chase et al. to obtain the calculated spectrumof Fig. 13(b).
The above bond polarizability approach was discussed in [126], where weexplored the extent to which polarizability parameters for small hydrocar-bon molecules, namely ethane for the C-C single bonds and ethylene for thedouble bonds, can be transferred to C60 and C70. As noted in Sect. 3, C70 isof D5h symmetry and has eight distinct bonds, and we thus made the roughapproximation of dividing the bonds into two sets, according to whether theirbond lengths are larger or smaller than 1.425 A, the midpoint between theobserved C60 single and double bond lengths. The single (double) bond po-larizability parameters were then used for bonds in the first (second) set. Theuse of static hydrocarbon polarizabilities was found to give very good agree-ment with the measured static polarizabilities for both C60 and C70. For themore complicated case of Raman scattering, which is sensitive to the deriva-tives of the polarizability, the use of hydrocarbon parameters led to only fairagreement with the observed relative intensities for C60, with significant dis-crepancies occurring for modes above 1000 cm−1. Simply fitting the observed
5 Note that there is a discrepancy between the peak heights quoted in Table III of[84] and the peak heights shown in Fig. 7 of the same paper. Hence, we obtainedthe experimental peak areas as follows. First we computed Lorentzian areas bycombining the peak heights shown in the experimental spectrum in Fig. 7 of[84] with the peak widths listed in that paper’s Table III. We then averaged theresulting areas with those obtained from a second Raman spectrum, kindly sent tous by B. Chase. The averaged peak strengths are shown here as the experimentalintensities in Fig. 13, and we obtained our bond polarizability model parametersof Table 8 by fitting these intensities.

60 Jose Menendez and John B. Page
0 500 1000 1500 2000Frequency (cm−1)
0.0
0.5
1.0
1.5Inte
nsity
(arb
itrar
y un
its)
(c)
0.0
0.5
1.0
1.5
(b)
0.0
0.5
1.0
1.5
(a)
Fig. 13. Measured off-resonance first-order Raman spectra for C60, together withtwo calculated spectra. The integrated intensities are given as vertical lines. Theexperimental spectrum of panel (a) is that of Chase et al. [84] (see footnote 5 onpage 59), measured at ωL = 9398.5 cm−1. The spectrum of panel (b) was computedusing (25) and (40) together with the first-principles normal mode eigenfrequen-cies and eigenvectors of Giannozzi and Baroni [47], with the bond polarizabilityparameters adjusted to fit the measured spectrum of panel (a). The resulting pa-rameter values are given in Table 8. For panel (c), we used these same parametervalues, together with the normal mode eigenfrequencies and eigenvectors from thefirst-principles calculations of Adams et al. [53] While absolute intensities were notcomputed, the vertical scales for panels (b) and (c) are the same, in order to showthe effect of the two different sets of mode frequencies and eigenvectors
C60 Raman intensities yielded the very good agreement shown here in Fig. 13.Interestingly, for the C70 Raman intensities, we found that the use of eitherthe hydrocarbon parameters or the C60 fit values yielded comparable quali-tatively good agreement with experiment, much better than the hydrocarbonset gave for the C60 intensities. It should be noted, though, that the situationfor C70 is made somewhat difficult by the lack of unambiguous identificationof the symmetry types of several of the observed peaks. Nevertheless, giventhe crudeness of our bond-partitioning scheme described above, the resultsare encouraging for the transfer of polarizability parameters to more com-plicated fullerenes. In the papers cited in [53], we have used the same bondpartitioning scheme (again with the partitioning bond length of 1.425 A),

Vibrational Spectroscopy of C60 61
Table 9. Experimental first-order Raman intensities, obtained using incident lightfrom a Nd-YAG laser at 1064 nm. Since the integrated strengths were not reportedin each case, but the spectral resolutions were similar, the table gives the mea-sured peak heights obtained directly from the published spectra. The peak heightsare normalized to that for the Ag(2) mode. For the Hg(1) peak, the numbers inparentheses give the height of a second peak, observed at 266 cm−1 in each of themeasured spectra. In the spectra of Chase et al. this peak appears as a shoulder,so no height is listed
Chase et al.a Dennis et al.b Birkett et al.c Lynch et al.d
Ag(1) 1.1 0.77 0.65 0.80Ag(2) 1.0 1.0 1.0 1.0Hg(1) 0.91 0.83 (0.21) 0.72 (0.19) 0.96 (0.24)Hg(2) 0.076 0.040 0.056 0.045Hg(3) 0.014 0.011 0.016 0.013Hg(4) 0.18 0.11 0.11 0.13Hg(5) 0.049 0.045 0.035 0.046Hg(6) 0.056 0.046 0.050 0.048Hg(7) 0.013 0.014 0.016 0.017Hg(8) 0.087 0.072 0.098 0.087
aRef. [84]; see footnote 5 on page 59bRef. [128]cRef. [129]dRef. [130]
together with the fit C60 bond polarizability parameters of Table 8, to com-pute the first-order Raman intensities for a variety of polymerized fullerenes.These systems typically contain hundreds of atoms, a few of which are tetrag-onally rather than trigonally bonded, and they have low symmetry, such thatthe Raman spectra are quite congested. The use of the fit C60 polarizabilityparameters to predict the Raman spectra of these systems seems a reason-able first approximation, since the spectral congestion is likely to wash outthe detailed contributions from individual bonds. We have recently appliedthis model to new Raman data for the odd-numbered dimeric fullerene C119
and have found that it discriminates convincingly between different isomericconfigurations [131].
Snoke et al. [132] have likewise studied the question of the transferabilityof hydrocarbon bond polarizability parameters for computing the first-orderoff-resonance Raman intensities of C60, using two different force constantmodels for the normal modes. They also did a pure fit to the observed relativeintensities, and some of their fit values of the polarizability parameters differfrom those we obtain (Table 8), particularly for [α‖(D) − α⊥(D)]/[α‖(S) −α⊥(S)], where the discrepancy is an order of magnitude. The origin of thisdifference is not known.
62 Jose Menendez and John B. Page
4.2 Absolute Raman Cross Sections
Lorentzen et al. [133] have measured the Raman cross-section for the Ag(2)mode (pentagonal pinch) of C60. For an excitation wavelength of 752 nm, theyfind dσ/dΩ = (2.09±0.29)×10−29 cm2/sr. The measurements were performedon a 4×10⁻⁴ M solution of C60 in CS2. In such a dilute solution it is reasonableto neglect the effects of C60–C60 interactions, so that the measured cross-section can be related to the molecular polarizability derivative occurring in(25). However, we recall that this equation contains no local field corrections,whereas for for C60 in CS2 these corrections should be included. Lorentzenet al. disposed of the local field corrrection by measuring the intensity of theAg(2) mode relative to that of the the 656 cm−1 CS2 mode and by making theassumption that the local field correction is the same for the two modes. Thecross-section for the CS2 mode was obtained from independent measurementsof CS2/C6H6 solutions, taking advantage of the well-known absolute cross-section of the 992 cm−1 Raman mode of benzene [134]. Again, the local fieldcorrections were assumed to drop out when taking ratios.
Since the primary motivation of Lorentzen et al.’s work [133] was to com-pare the experimental cross-section with predictions for the off-resonancecase, they used the 752 nm line of a Krypton laser instead of the morewidely used green-blue lines of an Argon laser. One could go even furtherbelow resonance by using the 1064 nm line of a Nd:YAG laser. However, asdetailed in [133], CCD detectors have marginal performance in this range.Moreover, there are no well-calibrated absolute Raman intensities availableat 1064 nm, whereas at 752 nm it is reasonable to extrapolate the resultsof Schomaker et al. [134] for the 992 cm−1 Raman peak of benzene, whosecross-section was determined for excitation wavelengths spanning the vis-ible frequency range down to 656 nm. In this way Lorentzen et al. couldavoid having to make a much more difficult direct measurement, as wouldbe required for 1064 nm excitation. Thus the choice of 752 nm excitationappears to provide a reasonable compromise between cross-section accuracyand the off-resonance requirement. Using (25) to re-express the measured Ra-man cross-section in terms of the mode polarizability derivative, one obtainsPαα,Ag(2) = [∂Pαα/∂dAg(2)]0 = (5.66 ± 0.40) × 10−4 cm2 g−1/2. Assumingthat the experimental conditions are well below important resonance effects,this value can be compared with predictions of the off-resonance theory, usingeither the bond polarizability model or ab initio calculations.
Bond polarizability models are particularly useful when the polarizabil-ity parameters are transferable among different systems, and absolute cross-section measurements provide an additional test of this property. If the trans-ferability hypothesis is approximately correct for fullerenes, as is suggestedby the comparison between the measured relative intensities of the first-orderRaman peaks and the relative intensities we predict using hydrocarbon po-larizability parameters (Fig. 1 in [126]), the error in the calculated absolutecross-section should be comparable to the error in the relative intensities.

Vibrational Spectroscopy of C60 63
This is what Lorentzen et al. find [133]. When hydrocarbon polarizabilityparameters are used, (40) yields Pαα,Ag(2) = 1.7× 10⁻⁴ cm2 g−1/2, which iswithin a factor of 3 of the experimental value.
First-principles methods are expected to make more accurate Ramanintensity predictions than simple bond-polarizability models based on thetransferability hypothesis. The off-resonance Raman intensities for diamond,silicon and germanium have been calculated by Windl [135], using a first-principles approach within the LDA. Excellent agreement with experimentwas found for these three materials. As noted earlier, LDA-based methodsfor the prediction of infrared and Raman activities in small molecules havebeen investigated in [124] and [125], and for C60, LDA-based calculations ofthe IR and Raman intensities have been published by Bertsch et al. [113] andby Giannozzi and Baroni [47]. The latter authors’ predicted relative inten-sities for the 10 first-order Raman modes in C60 are shown in Fig. 13 andare in very good agreement with experiment. However, the comparison be-tween theoretical and experimental absolute cross-sections is not completelystraightforward. The calculations of [47] are based on plane wave expansionsappropriate to an infinite fcc lattice with periodic boundary conditions, andto focus on the intramolecular properties, an artificially large lattice constantof 16 A is used. Accordingly, the calculated quantity within this scheme isnot the isolated molecular polarizability derivative but the derivative of the“crystalline” dielectric tensor relative to the vibrational normal coordinate.Assuming that the two quantities are related by a Clausius-Mossotti relation,one obtains Pαα,Ag(2) = 2.7× 10⁻⁴ cm2 g−1/2, in reasonable agreement withthe experimental results [133].
4.3 Resonance Raman Scattering
When the energy of the incident laser photons is well below the lowest absorp-tion edge, the first-order Raman intensities are proportional to the derivativesof the static electronic polarizability with respect to the normal mode dis-placements. As discussed in Sect. 4.1, these can be computed using eitherstate of the art first principles techniques [47,53] or phenomenological meth-ods [63,91]. However, when the laser excitation energy becomes comparablewith that of the electronic absorption bands, the static polarizability ap-proach breaks down. Under these conditions, the individual mode Ramanintensities as a function of the exciting laser frequency (Raman excitationprofiles) display strong resonance effects [19]. The study of these effects canprovide detailed information on the electron-vibration coupling involving spe-cific electronic states and the Raman active modes. Such information is im-portant, for instance, in understanding the superconductivity mechanisms indoped C60.
There are very few detailed experimental studies of Raman excitationprofiles in C60, and none of them cover the region between 3 eV and 5 eV,which includes the strongest electronic absorption bands. Sinha et al. [136]

64 Jose Menendez and John B. Page
carried out resonance Raman experiments in C60 films using laser lines inthe visible. At room temperature, they found a maximum at 2.4 eV in theRaman excitation profile for the Ag(2) mode. Similar results were obtainedby Matus et al. [137], but the profile maximum was found to occur at about2.7 eV. These two experiments were performed on films which containedsignificant amounts of C70. The existence of a Raman resonance in pureC60 films was confirmed by Guha et al. [138]. Figure 14 shows the results,which indicate a sharp maximum at 2.3 eV. Denisov et al. [139] also reportan enhancement of the intensity of the Ag(2) Raman peak, under 488 nm(2.54 eV) excitation from an Argon laser. Gallagher et al. [140] comparedRaman spectra obtained with the 407 nm and 413 nm lines of a Kryptonlaser and analyzed them in terms of the so-called “D-term” scattering effects,which arise from non-adiabatic corrections. A few papers have also discussedsurface-enhanced Raman scattering in C60 [141–143] and the effect of solventson the Raman intensities [111].
Fig. 14. Raman excitation profile for the Ag(2) mode of C60, from [138] The sampleis a polycrystalline film of chromatographically purified material
Two explanations have been offered for the resonance in the excitationprofile of the Ag(2) mode in C60. Sinha et al. [136] argued that the energyof the resonance was too low to be assigned to optically allowed transitions.Detailed studies of C60 in solution show that the first allowed transitionscorrespond to a broad structure with a maximum at 3.7 eV. The onset of this

Vibrational Spectroscopy of C60 65
structure displays a very weak peak at 3.0 eV [144]. According to theoreticalcalculations [145], the first allowed transitions involve excited states derivedfrom the hu (HOMO) and t1g (LUMO+1) molecular orbitals. Thus Sinhaet al. [136] assigned the observed Raman resonance at 2.4 eV to transitionsbetween crystalline electronic bands derived from the hu (HOMO) and t1u
(LUMO) molecular orbitals. These transitions are optically forbidden in theicosahedral molecule, but it was argued that they should become allowed inthe solid state. The mechanism proposed by Sinha et al. [136] was supportedby the fact that no resonance enhancement was observed in solutions of C60
in CS2. Theoretical calculations of the dielectric function of C60 crystalsconfirmed that “forbidden” HOMO → LUMO transitions make a significantcontribution to the optical absorption at low energies [146]. Several strongtransitions were identified in a range between 0.2 eV and 0.7 eV above theabsorption threshold, which was found at 1.46 eV. When the experimentalvalue of 1.72 eV [147,148] is used, these strongest “forbidden” transitions arepredicted to occur between 1.9 eV and 2.4 eV, overlapping the energy rangewithin which the Raman resonance was observed by Sinha et al. [136] andGuha et al. [138]
An alternative explanation for the visible Raman resonance was proposedby Matus et al. [137]. These investigators suggested an interpretation based onthe “A-term” in Albrecht’s molecular theory of resonance Raman scattering[149], with the resonant optical transition occurring between bands derivedfrom the hu and t1g molecular orbitals. The transition energy between thesetwo levels was placed at 2.7 eV. This is considerably lower than the value of 3.0eV found for the lowest allowed transition in C60 in solution [144], althoughit is consistent with most absorption and ellipsometric measurements on C60
films and single crystals [147,148]. The reason for the discrepancy is now wellunderstood in terms of the width of the electronic bands derived from themolecular orbitals. For example, Laouini et al. [150] estimate a separation of2.9 eV between the hu (HOMO) and t1g (LUMO+1) levels in the isolatedmolecule. When the solid is formed, the minimum separation between theenergy bands derived from these molecular orbitals is reduced to 2.2 eV.This is consistent with an absorption peak at 3.7 eV (molecule) and 2.7 eV(solid).
Which of these two explanations for the Ag(2) Raman excitation profile iscorrect remains undecided. Guha et al. [138] noted that the Raman resonancecould be “turned on” in C60 dissolved in CS2 simply by freezing the solution,suggesting that the Raman resonance is produced by symmetry breaking andnot by the particular energy shift of the allowed transitions which occur inthe solid state. One could argue, however, that the C60 molecule in the frozensolution suffers a perturbation which also lowers the energy of the HOMO→ LUMO+1 transition, so that Guha et al.’s observation [138] is not neces-sarily inconsistent with Matus’s interpretation [137]. One should also keep inmind the possibility that both mechanisms may play a role of comparable sig-
66 Jose Menendez and John B. Page
nificance. Unfortunately, the uncertainty as to the relevant electronic statesmakes it very difficult to analyze the excitation profiles in terms of differenttheoretical expressions. It is also apparent that deviations from the proper-ties of the isolated molecule, which in the case of the vibrational structureare known to be small, play a key role in determining the measured Ramanexcitation profiles. This is not surprising when one notes that the Ramanstudies to date fail to cover the energy range between 3 eV and 5 eV, wherethe strongest electronic transitions occur and where one might expect a closersimilarity between results for isolated molecules and for solid phases.
5 Conclusion
We have presented a survey of the vibrational properties of C60 and spectro-scopic techniques used to investigate these properties, with the primary em-phasis on IR absorption and Raman scattering. It is clear that great progresshas been achieved in understanding this unique molecule. The level of detailwith which the complex vibrational structure and the spectroscopic intensitiesare known in C60 is unmatched among fullerenes and nanotubes. However,significant gaps remain in this knowledge: some of the silent mode frequen-cies remain poorly known; the interplay between crystal field effects andisotopic perturbations produces complicated Raman and infrared spectra forwhich there are often no satisfactory explanations; little evidence exists on thephonon energy bands derived from the intramolecular modes; and while theinfrared and off-resonance Raman intensities are reasonably well understoodin terms of first-principles and phenomenological models, the information onresonant Raman excitation profiles remains preliminary. We hope that thisreview will stimulate interest in these topics and further enhance the role ofC60 as the benchmark system for fullerene studies.
Acknowledgements We would like to thank our collaborators Gary Adams,Stefano Baroni, Paolo Giannozzi, Suchismita Guha, Otto Sankey, and KislaySinha, each of whom played key roles in several developments discussed inthis chapter. We also benefited from interactions with many colleagues whoprovided illuminating explanations, unpublished data, and many rounds ofuseful e-mail discussions. Among these, we would like especially to men-tion Manuel Cardona, Christian Coulombeau, Bruce Chase, Rolf Heid, PaulHeiney, Herve Jobic, Fabrizia Negri, Dan Neumann, Jun Onoe, and DavidSnoke. Our work has been supported by the National Science Foundation,under grants DMR 9624102 and DMR 9510182.

Vibrational Spectroscopy of C60 67
References
1. H. W. Kroto, J. R. Heath, S. C. O’Brien, R. F. Curl, R. E. Smalley: Nature318, 162 (1985)
2. W. Kratschmer, L. D. Lamb, K. Fostiropoulos, D. Huffman: Nature 347, 354(1990)
3. R. C. Haddon, A. F. Hebard, M. J. Rosseinsky, D. W. Murphy, S. J. Duc-los, K. B. Lyons, B. Miller, J. M. Rosamilia, R. M. Fleming, A. R. Kortan,S. H. Glarun, A. V. Makhija, A. J. Muller, R. H. Eick, S. M. Zahurak, R. Ty-cko, G. Dabbagh, F. A. Thiel: Nature 350, 320 (1991)
4. S. Ijima: Nature 354, 56 (1991)5. A. M. Rao, P. Zhou, K.-A. Wang, G. T. Hager, J. M. Holden, Y. Wang,
W. T. Lee, X. X. Bi, P. C. Eklund, D. S. Cornet, M. A. Duncan, I. J. Amster:Science 259, 955 (1993)
6. Fullerene Polymers and Fullerene Polymer Composites, ed. by P. C. Eklund,A. M. Rao (Springer, Berlin, Heidelberg), in press
7. W. E. Billups, M. A. Ciufolini: Buckminster Fullerenes (John Wiley and Sons,New York, 1993), p. 339
8. D. Koruga, S. Hameroff, J. Withers, R. Loutfy: Fullerene C60: History,Physics, Nanobiology, Nanotechnology, (Elsevier Science Ltd., 1993)
9. Solid State Physics, ed. by H. Ehrenreich, F. Spaepen (Academic Press, SanDiego, 1994), Vol. 48
10. T. Braun, A. Schubert, H. MacZelka, L. Vasvari: Fullerene Research 1985–1993: A Computer-Generated Cross-Indexed Bibliography of the Journal Lit-erature, (World Scientific, 1995)
11. M. S. Dresselhaus, G. Dresselhaus, P. C. Eklund: Science of Fullerenes andCarbon Nanotubes, (Academic Press, San Diego, 1996)
12. W. Kroto, D. R. M. Walton: The Fullerenes: New Horizons for Chemistry,Physics, and Astrophysics of Carbon (Cambridge University Press, London,1997), p. 154
13. H. Aldersey-Williams: The Most Beautiful Molecule: The Discovery of theBuckyball, (John Wiley & Sons, New York, 1995)
14. M. S. Dresselhaus, G. Dresselhaus, P. C. Eklund: J. Raman Spectrosc. 27,351 (1996)
15. P. C. Eklund, P. Zhou, K.-A. Wang, G. Dresselhaus, M. S. Dresselhaus: J.Phys. Chem. Solids 53, 1391 (1992)
16. D. E. Weeks, W. G. Harter: J. Chem. Phys. 90, 4744 (1989)17. J. Fabian: Phys. Rev. B 53, 13864 (1996)18. M. Tinkham: Group Theory and Quantum Mechanics, (McGraw Hill, New
York, 1964)19. See, for instance, J. B. Page: in Light Scattering in Solids VI, ed. by M. Car-
dona, G. Guntherodt (Springer, Berlin, Heidelberg, 1991)20. G. Placzek: The Rayleigh and Raman Scattering, UCRL Translation No.
526(L), from Handbuch der Radiologie VI 2 (Akademische Verlagsgsellschaft,Leipzig, 1934), pp. 209–374
21. S. Guha, J. Menendez, J. B. Page, G. B. Adams, G. S. Spencer, J. P. Lehman,P. Giannozzi, S. Baroni: Phys. Rev. Lett. 72, 3359 (1994)
22. S. Guha, J. Menendez, J. B. Page, G. B. Adams: Phys. Rev. B 56, 15431(1997)

68 Jose Menendez and John B. Page
23. J. D. Axe, S. C. Moss, D. A. Neumann: in Solid State Physics ed. by H. Ehren-reich, F. Spaepen (Academic Press, New York, 1994), Vol. 48, p. 149
24. J. E. Fischer, P. A. Heiney: J. Phys. Chem. Solids 54, 1725 (1993)25. J. M. Hawkins, A. Mayer, S. Loren, R. Nunlist: J. Am. Chem. Soc. 113, 9394
(1991)26. J. Menendez, J. B. Page, S. Guha: Phil. Mag. B 70, 651 (1994)27. Q. Ying, J. Marecek, B. Chu: J. Chem. Phys. 104, 2665 (1994)28. P. Launois, S. Ravy, R. Moret: Phys. Rev. B 55, 2651 (1997)29. R. M. Fleming, T. Siegrist, P. M. Marsh, B. Hessen, A. R. Kortan, D. W. Mur-
phy, R. C. Haddon, R. Tycko, G. Dabbagh, A. M. Mujsce, M. L. Kaplan,S. M. Zahurak: in Materials Research Society Symposium, ed. by R. S. Aver-back, D. L. Nelson, and J. Bernholc (Materials Research Society, Boston,1990), Vol. 206
30. P. A. Heiney: J. Phys. Chem. Solids 53, 1333 (1992)31. A. B. Harris, R. Sachidanandam: Phys. Rev. B 46, 4944 (1992)32. K. Rapcewicz, J. Przystawa: Phys. Rev. B 49, 13193 (1994)33. G. Burns, A. M. Glazer: Space Groups for Solid State Scientists (Academic
Press, New York, 1978), p. 20034. M. C. Martin, J. Fabian, J. Godard, P. Bernier, J. M. Lambert, L. Mihaly:
Phys. Rev. B 51, 2844 (1995)35. P. C. Chow, X. Jiang, G. Reiter, P. Wochner, S. C. Moss, J. D. Axe, J. C. Han-
son, R. K. McMullan, R. L. Meng, C. W. Chu: Phys. Rev. Lett. 69, 2943(1992)
36. S. Ravy, P. Launois, R. Moret: Phys. Rev. B 53, 10532 (1996)37. N. Yao, C. F. Klein, S. K. Behal, M. M. Disko, R. D. Sherwood, K. M. Creegan,
D. M. Cox: Phys. Rev. B 45, 11366 (1992)38. W. I. F. David, R. M. Ibberson, T. J. S. Dennis, J. P. Hare, K. Prassides:
Europhysics Lett. 18, 219 (1992)39. Z. C. Wu, D. A. Jelski, T. F. George: Chem. Phys. Lett. 137, 291 (1987)40. R. Heid, L. Pintschovius, J. M. Godard: Phys. Rev. B 56, 5925 (1997)41. L. T. Chadderton: J. Phys. Chem. Solids 54, 1027 (1993)42. D. P. Clougherty, J. P. Gorman: Chem. Phys. Lett. 251, 353 (1996)43. R. E. Stanton, M. D. Newton: J. Phys. Chem. 92, 2141 (1988)44. Z. Slanina, J. M. Rudzinski, M. Togasi, E. Osawa: J. Mol. Struct. 202, 169
(1989)45. F. Negri, G. Orlandi, F. Zerbetto: Chem. Phys. Lett. 144, 31 (1988)46. S. Baroni, P. Giannozzi, A. Testa: Phys. Rev. Lett. 58, 1861 (1987)47. P. Giannozzi, S. Baroni: J. Chem. Phys. 100, 8537 (1994)48. R. Car, M. Parrinello: Phys. Rev. Lett. 55, 2471 (1985)49. Q. M. Zhang, Jae-Yei Yi, J. Bernholc: Phys. Rev. Lett. 66, 2633 (1991)50. G. B. Adams, J. B. Page, O. F. Sankey, K. Sinha, J. Menendez, D. R. Huffman:
Phys. Rev. B 44, 4052 (1991)51. A. A. Quong, M. R. Pederson, J. L. Feldman: Solid State Commun. 87, 535
(1993)52. X. Q. Wang, C. Z. Wang, K. M. Ho: Phys. Rev. B 48, 1884 (1993)53. G. B. Adams, J. B. Page, O. F. Sankey, M. O’Keeffe: Phys. Rev. B 50, 17471
(1994); G. B. Adams, J. B. Page, O. F. Sankey, M. O’Keeffe: Chem. Phys.Lett. 228, 485 (1994); G. B. Adams, J. B. Page: in [6]
54. O. F. Sankey, D. Niklewski: Phys. Rev. B 40, 3979 (1989); O. F. Sankey,D. J. Niklewski, D. A. Drabold, J. D. Dow: Phy. Rev. B 41, 12750 (1990)

Vibrational Spectroscopy of C60 69
55. G. B. Adams, O. F. Sankey, J. B. Page, D. Drabold: Science 256, 1792 (1992)56. J. Harris: Phys. Rev. B 31, 1770 (1985)57. O. F. Sankey, R. E. Allen: Phys. Rev. B 33, 7164 (1986)58. B. P. Feuston: Phys. Rev. B 44, 4056 (1991)59. R. A. Jishi, R. M. Mirie, M. S. Dresselhaus: Phys. Rev. B 45, 13685 (1992)60. J. L. Feldman, J. Q. Broughton, L. L. Boyer, D. E. Reich, M. D. Kluge: Phys.
Rev. B 46, 12731 (1992)61. W. Weber: Phys. Rev. B 15, 1789 (1977)62. G. Onida, G. Benedek: Europhysics Lett. 18, 403 (1992)63. S. Sanguinetti, G. Benedek, M. Righetti, G. Onida: Phys. Rev. B 50, 6743
(1994)64. K.-P. Bohnen, R. Heid, K. M. Ho, C. T. Chan: Phys. Rev. B 51,5805 (1995)65. W. Que, M. B. Walker: Phys. Rev. B 48, 13104 (1993)66. J. Yu, R. K. Kalia, P. Vashishta: Appl. Phys. Lett. 63, 3152 (1993)67. J. M. Pacheco, J. P. P. Ramalho: Phys. Rev. Lett. 79, 3873 (1997)68. Z.-H. Dong, P. Zhou, J. M. Holden, P. C. Eklund, M. S. Dresselhaus, G. Dres-
selhaus: Phys. Rev. B 48, 2862 (1993)69. K.-A. Wang, A. M. Rao, P. C. Eklund, M. S. Dresselhaus, G. Dresselhaus:
Phys. Rev. B 48, 11375 (1993)70. M. C. Martin, X. Du, J. Kwon, L. Mihaly: Phys. Rev. B 50, 173 (1994)71. J. Menendez, S. Guha: in 22nd International Conference on the Physics of
Semiconductors, ed. by D. Lockwood (World Scientific, Vancouver, Canada,1994), p. 2093
72. V. Schettino, P. R. Salvi, R. Bini, G. Cardini: J. Chem. Phys. 101, 11079(1994)
73. P. Bowmar, W. Hayes, M. Kurmoo, P. A. Pattenden, M. A. Green, P. Day,K. Kikuchi: J. Phys.: Condens. Matter 6, 3161 (1994)
74. L. Akselrod, H. J. Byrne, S. Donovan, S. Roth: Chem. Phys. 192, 307 (1995)75. W. Brockner, F. Menzel: J. Mol. Struct. 378, 147 (1996)76. A. Graja, A. Lapinski, S. Krol: J. Mol. Struct. 404, 147 (1997)77. C. Coulombeau, H. Jobic, P. Bernier, C. Fabre, D. Schutz, A. Rassat: J. Phys.
Chem. 96, 22 (1992)78. J. R. D. Copley, D. A. Neumann, W. A. Kamitakahara: Can. J. Phys. 73, 763
(1995)79. C. Coulombeau, H. Jobic, C. J. Carlile, S. M. Bennington, C. Fabre, A. Rassat:
Fullerene Science and Technology 2, 247 (1994)80. A. Sassara, G. Zerza, M. Chergui: J. Phys. B 29, 4997 (1996)81. W. Kraetschmer, K. Fostiropoulos, D. R. Huffman: Chem. Phys. Lett. 170,
167 (1990)82. D. S. Bethune, G. Meijer, W. C. Tang, H. J. Rosen, W. G. Golden, H. Seki,
C. A. Brown, M. S. de Vries: Chem. Phys. Lett. 179, 181 (1991)83. R. Liu, M. V. Klein: Phys. Rev. B 45, 11437 (1992)84. B. Chase, N. Herron, E. Holler: J. Phys. Chem. 96, 4262 (1992)85. K. Sinha, J. Menendez, G. B. Adams, J. B. Page, O. F. Sankey, L. D. Lamb,
D. R. Huffman: in Appl. Spectr. in Materials Science, ed. by D. D. Saperstein(SPIE, Los Angeles, 1991) Vol. 1437, p. 32
86. P. H. M. van Loosdrecht, P. J. M. van Bentum, M. A. Verheijen, G. Meijer:Chem. Phys. Lett. 198, 587 (1992)
87. S. P. Love, D. McBranch, M. Salkola, N. V. Coppa, J. M. Robinson, B. I. Swan-son, A. R. Bishop: Chem. Phys. Lett. 225, 170 (1994)

70 Jose Menendez and John B. Page
88. L. Yulong, J. Yijian, L. Jingqing, M. Yujun, X. Sishen, Z. Zebo, Q. Shengfa:Phys. Rev. B 49, 5058 (1994)
89. A. Rosenberg, C. Kendziora: Phys. Rev. B 51, 9321 (1995)90. J. Menendez, J. B. Page: Bull. Am. Phys. Soc. 43, 157 (1998)91. D. W. Snoke, M. Cardona: Solid State Commun. 87, 121 (1993)92. M. Matus, H. Kuzmany: Appl. Phys. A 56, 241 (1993)93. P. H. M. van Loosdrecht, P. J. M. van Bentum, J. Meijer: Phys. Rev. Lett.
68, 1176 (1992)94. C. C. Homes, P. J. Horoyski, M. L. W. Thewalt, B. P. Clayman: Phys. Rev.
B 49, 7052 (1994)95. C. C. Homes, P. J. Horoyski, M. L. W. Thewalt, B. P. Clayman, T. R. An-
thony: Phys. Rev. B 52, 16892 (1995)96. P. J. Horoyski: Phys. Rev. B 54, 920 (1996)97. L. Pintschovius, B. Renker, F. Gompf, R. Heid, S. L. Chaplot, M. Haluska,
H. Kuzmany: Phys. Rev. Lett. 69, 2662 (1992)98. S. A. Fitzgerald, A. J. Sievers: Phys. Rev. Lett. 70, 3175 (1993)99. P. J. Horoyski, M. L. W. Thewalt: Phys. Rev. B 48, 11446 (1993)
100. P. J. Horoyski, M. L. W. Thewalt, T. R. Anthony: Phys. Rev. B 52, R6951(1995)
101. R. L. Cappelletti, J. R. D. Copley, W. A. Kamitakahara, F. Li, J. S. Lannin,D. Ramage: Phys. Rev. Lett. 66, 3261 (1991)
102. K. Prassides, T. J. S. Dennis, J. P. Hare, J. Tomkinson, H. W. Kroto, R. Tay-lor, D. R. M. Walton: Chem. Phys. Lett. 187, 455 (1991)
103. A. Sassara, G. Zerza, M. Chergui: Chem. Phys. Lett. 261, 213 (1996)104. I. Laszlo, L. Udvardi: Chem. Phys. Lett. 136, 418 (1989)105. F. Negri, G. Orlandi, F. Zerbetto: J. Chem. Phys. 97 6496 (1992)106. F. Negri, G. Orlandi, F. Zerbetto: J. Phys. Chem. 100, 10849 (1996)107. F. Negri: Private communication108. A. Sassara, G. Zerza, M. Chergui, F. Negri, G. Orlandi: J. Chem. Phys. 107,
8731 (1997)109. G. Gensterblum, L.-M. Yu, J.-J. Pireaux, R. Caudano, J.-M. Themlin,
S. Bouzidi, F. Coletti: Appl. Phys. A 56, 175 (1993)110. G. Gensterblum, J. J. Pireaux, P. A. Thiry, R. Caudano, J. P. Vigneron,
P. Lambin, A. A. Lucas, W. Kratschmer: Phys. Rev. Lett. 67, 2171 (1991)111. S. H. Gallagher, R. S. Armstrong, P. A. Lay, C. A. Reed: Chem. Phys. Lett.
248, 353 (1996)112. S. H. Gallagher, R. S. Armstrong, W. A. Clucas, P. A. Lay, C. A. Reed: J.
Phys. Chem. A 101, 2960 (1997)113. G. F. Bertsch, A. Smith, K. Yabana: Phys. Rev. B 52, 7876 (1995)114. K. Esfarjani, Y. Hashi, J. Onoe, K. Takeuchi, Y. Kawazoe: Phys. Rev. B 57
223 (1998)115. K.-J. Fu, W. L. Karney, O. L. Chapman, S.-M. Huang, R. B. Kaner,
F. Diederich, K. Holczer, R. L. Whetten: Phys. Rev. B 46 1937 (1992)116. M. C. Martin, D. Koller, L. Mihaly: Phys. Rev. B 47 14607 (1993)117. R. Winkler, T. Pichler, H. Kuzmany: Zeit. Phys. B 96, 39 (1994)118. J. Onoe, K. Takeuchi: Phys. Rev. B 54, 6167 (1996), as reported in [114]119. T. Hara, J. Onoe, K. Takeuchi: J. Phys. Chem. B 101, 9532 (1997)120. S. Go, H. Bilz, M. Cardona: Phys. Rev. Lett. 34, 580 (1975)121. H. Bilz, D. Strauch, R. K. Wehner: Handbuch der Physik (Springer-Verlag,
Berlin, 1984), Vol. XXV, Pt. 2d, p. 253
Vibrational Spectroscopy of C60 71
122. A. von Czarnowski, K. H. Meiwes-Broer: Chem. Phys. Lett. 246, 321 (1995)123. G. B. Adams, J. B. Page: unpublished124. B. G. Johnson, J. Florian: Chem. Phys. Lett. 247, 120 (1995)125. D. Porezag, M. R. Pederson: Phys. Rev. B 54, 7830 (1996)126. S. Guha, J. Menendez, J. B. Page, G. B. Adams: Phys. Rev. B 53, 13106
(1996)127. M. Wolkenstein: Dokl. Akad. Nauk. SSSR 32, 185 (1941)128. T. J. Dennis, J. P. Hare, H. W. Kroto, R. Taylor, D. R. M. Walton: Spec-
trochim. Acta 47A, 1289 (1991)129. P. R. Birkett, H. W. Kroto, R. Taylor, D. R. M. Walton, R. I. Grose, P. J. Hen-
dra, P. W. Fowler: Chem. Phys. Lett. 205, 399 (1993)130. K. Lynch, C. Tanke, F. Menzel, W. Brockner, P. Scharf, E. Stumpp: J. Phys.
Chem. 99, 7985 (1995)131. S. Lebedkin, H. Rietschel, G. B. Adams, J. B. Page, W. E. Hull, F. H. Hen-
nrich, H.-J. Eisler, M. M. Kappas, W. Kratschmer: J. Chem. Phys. 110, 11768(1999)
132. D. W. Snoke, M. Cardona, S. Sanguinetti, G. Benedek: Phys. Rev. B 53,12641 (1996)
133. J. Lorentzen, S. Guha, J. Menendez, P. Giannozzi, S. Baroni: Chem. Phys.Lett. 270, 129 (1997)
134. K. T. Schomacker, J. K. Delaney, P. M. Champion: J. Appl. Phys. 85, 4241(1986)
135. W. Windl: Ab-initio-Berechnung von Raman-Spektren in Halbleitern, Doctoraldissertation, University of Regensburg, Germany, 1995.
136. K. Sinha, J. Menendez, R. C. Hanson, G. B. Adams, J. B. Page, O. F. Sankey,L. D. Lamb, D. R. Huffman: Chem. Phys. Lett. 186, 287 (1991)
137. M. Matus, S. Balgavy, H. Kuzmany, and W. Kratschmer: Resonance RamanSpectroscopy of Buckminsterfullerene, Physica C 185–189, 423 (1991)
138. S. Guha, J. Lorentzen, K. Sinha, J. Menendez, G. B. Adams, J. B. Page,O. F. Sankey: Mol. Cryst. Liq. Cryst. 256, 391 (1994)
139. V. N. Denisov, B. N. Mavrin, G. Ruani, R. Zamboni, C. Taliani: Sov. Phys.JETP 75, 158 (1992)
140. S. H. Gallagher, R. S. Armstrong, P. A. Lay, C. A. Reed: J. Am. Chem. Soc.116, 12091 (1994)
141. K. L. Akers, L. M. Cousins, M. Moskovits: Chem. Phys. Lett. 190, 614 (1992)142. A. Rosenberg: Phys. Rev. B 51, 1961 (1995)143. X. Andong, P. Haibin, Z. Xinyi, H. Yilin, F. Shaojun, S. Junyan, Z. Jian,
X. Cunyi: J. Lumin. 63, 301 (1995)144. S. Leach, M. Vervloet, A. Despres, E. Breheret, J. P. Hare, T. J. Dennis,
H. W. Kroto, R. Taylor, D. R. M. Walton: Chem. Phys. 160, 451 (1992)145. S. Larsson, A. Volosov, A. Rosen: Chem. Phys. Lett. 137, 501 (1987)146. W. Y. Ching, M.-Z. Huang, Y.-N. Xu, W. G. Harter, F. T. Chan: Phys. Rev.
Lett. 67, 2045 (1991)147. Y. Wang, J. M. Holden, A. M. Rao, W.-T. Lee, X. X. Bi, S. L. Ren,
G. W. Lehman, G. T. Hager, P. C. Eklund: Phys. Rev. B 45, 14396 (1992)148. P. Milani, M. Manfredini, G. Guizzetti, F. Marabelli, M. Patrini: Solid State
Commun. 90, 639 (1994)149. A. C. Albrecht: J. Chem. Phys. 34, 1476 (1961)150. N. Laouini, O. K. Andersen, O. Gunnarson: Phys. Rev. B 51, 17446 (1995)