vestas australian wind technology pty ltd document no
TRANSCRIPT
Vestas Australian Wind Technology Pty Ltd 3 May 2013
Document No. 60279731-SummaryRpt4_Jan13-R1
Macarthur Wind Farm Commissioning Noise Monitoring Monthly Summary Report - January 2013
AECOM Macarthur Wind Farm Commissioning Noise Monitoring - Monthly Summary Report - January 2013
P:\60279731\8. Issued Docs\8.1 Reports\Monthly Summary Reports\60279731-SummaryRpt4_Jan13-R1.docx Revision 1 - 3 May 2013
Macarthur Wind Farm Commissioning Noise Monitoring Monthly Summary Report - January 2013
Prepared for
Vestas Australian Wind Technology Pty Ltd
Prepared by AECOM Australia Pty Ltd Level 9, 8 Exhibition Street, Melbourne VIC 3000, Australia T +61 3 9653 1234 F +61 3 9654 7117 www.aecom.com ABN 20 093 846 925
3 May 2013
60279731
AECOM in Australia and New Zealand is certified to the latest version of ISO9001 and ISO14001.
© AECOM Australia Pty Ltd (AECOM). All rights reserved.
AECOM has prepared this document for the sole use of the Client and for a specific purpose, each as expressly stated in the document. No other party should rely on this document without the prior written consent of AECOM. AECOM undertakes no duty, nor accepts any responsibility, to any third party who may rely upon or use this document. This document has been prepared based on the Client’s description of its requirements and AECOM’s experience, having regard to assumptions that AECOM can reasonably be expected to make in accordance with sound professional principles. AECOM may also have relied upon information provided by the Client and other third parties to prepare this document, some of which may not have been verified. Subject to the above conditions, this document may be transmitted, reproduced or disseminated only in its entirety.
AECOM Macarthur Wind Farm Commissioning Noise Monitoring - Monthly Summary Report - January 2013
P:\60279731\8. Issued Docs\8.1 Reports\Monthly Summary Reports\60279731-SummaryRpt4_Jan13-R1.docx Revision 1 - 3 May 2013
Quality Information Document Macarthur Wind Farm Commissioning Noise Monitoring
Ref 60279731
Date 3 May 2013
Prepared by Andrew Mitchell
Reviewed by David Peoples
Revision History
Revision Revision Date Details
Authorised
Name/Position Signature
0 3-Apr-2013 Initial Issue Andrew Mitchell Principal Acoustics Engineer
1 3-May-2013 Vestas comments incorporated
Andrew Mitchell Principal Acoustics Engineer
AECOM Macarthur Wind Farm Commissioning Noise Monitoring - Monthly Summary Report - January 2013
P:\60279731\8. Issued Docs\8.1 Reports\Monthly Summary Reports\60279731-SummaryRpt4_Jan13-R1.docx Revision 1 - 3 May 2013
Table of Contents Executive Summary i 1.0 Introduction 1 2.0 Noise Criteria 1 3.0 Noise Measurement Methodology 2
3.1 Procedure 2 3.2 Measurement Locations 3 3.3 Instrumentation 3
4.0 Meteorological Data 4 5.0 Wind Farm Operations during Monitoring Period 4 6.0 Measurement Results 4
6.1 O17A 5 6.2 O23A 7 6.3 Q20A 9 6.4 R26B 11 6.5 S26A 13 6.6 W26A 15 6.7 Y16A 17 6.8 Y18A 19 6.9 Y21A 21
7.0 Conclusion 23 Appendix A
Acoustic Nomenclature A Appendix B
Site Map B Appendix C
Example Calibration Certificate C
AECOM Macarthur Wind Farm Commissioning Noise Monitoring - Monthly Summary Report - January 2013
P:\60279731\8. Issued Docs\8.1 Reports\Monthly Summary Reports\60279731-SummaryRpt4_Jan13-R1.docx Revision 1 - 3 May 2013
i
Executive Summary AECOM was engaged by Vestas Australian Wind Technology Pty Ltd to perform noise monitoring at residential locations in the vicinity of the Macarthur Wind Farm, to assess the noise emissions from the wind farm during the commissioning phase.
Noise monitoring was performed at nine residential locations in the vicinity of the wind farm during the month of January 2013.
The noise monitoring, and analysis of the noise monitoring data, was performed in accordance with NZS 6808:19981, which is the standard referenced by the Planning Permit conditions for the wind farm.
During the monitoring period, final commissioning activities were still being undertaken at the wind farm, but all 140 wind turbines were operational.
At all noise monitoring locations, the noise level at each wind speed, ranging from the wind turbine cut-in wind speed to up to the wind speed where the turbines generate maximum noise emissions, was not greater than the respective noise limit. The noise monitoring results therefore indicate that the wind farm was compliant with the noise criteria prescribed by the Planning Permit during this period of commissioning noise monitoring.
1 New Zealand Standard 6808:1998 – Acoustics – The Assessment and Measurement of Sound from Wind Turbine Generators

AECOM Macarthur Wind Farm Commissioning Noise Monitoring - Monthly Summary Report - January 2013
P:\60279731\8. Issued Docs\8.1 Reports\Monthly Summary Reports\60279731-SummaryRpt4_Jan13-R1.docx Revision 1 - 3 May 2013
1
1.0 Introduction AECOM was engaged by Vestas Australian Wind Technology Pty Ltd to perform noise monitoring at residential locations in the vicinity of the Macarthur Wind Farm, to assess the noise emissions from the wind farm.
This report summarises noise monitoring that was conducted in two nominally fortnight-long periods during the month of January 2013, as commissioning of the wind farm was being completed.
A summary of the applicable noise criteria, the measurement methodology, and the measurement results are presented in the following sections.
Definitions of the acoustic nomenclature used in this report are presented in Appendix A.
2.0 Noise Criteria The Planning Permit for Macarthur Wind Farm stipulates that noise from the operation of Macarthur Wind Farm must comply with noise limits determined in accordance with New Zealand Standard NZS6808:1998, titled ‘Acoustics – The Assessment and Measurement of Sound from Wind Turbine Generators’.
In accordance with the New Zealand Standard, a noise limit is determined for each wind speed at which the wind turbines operate. The Standard stipulates that for each wind speed the wind farm noise shall not exceed 40 dB(A) or the background noise plus 5 dB(A), whichever is greater. The quantity ‘dB(A)’, or ‘A-weighted decibels’, means decibel level of the sound, adjusted depending on the pitch of the sound to replicate the response of the human ear.
Under the Planning Permit, separate limits apply for ‘all-time’ and ‘night-time’ periods (defined as 10pm to 7am).
Background noise levels at a number of the properties where commissioning noise monitoring has been undertaken were measured prior to construction of the wind farm between August 2010 and January 2011.
Where background noise levels were not measured prior to construction of the wind farm, the noise criteria have been determined based on either:
1) Background noise levels measured at the end of the construction period, between 19 September and 1 October 2012, when no wind turbines were operating;
or
2) For locations where no background measurements were performed either prior to or following construction – a representative location in the same general area where background noise levels were measured.
It should be noted that the background noise monitoring that was conducted prior to construction of the wind farm was referenced to wind data from temporary meteorological masts, now decommissioned. Operational noise monitoring references the measured noise levels with wind data from the permanent meteorological masts at the wind farm.
To enable the background noise level versus wind speed curves, and thus the criteria, determined prior to construction to be directly compared to the operation noise level curves, both sets of data must be referenced to the same metrological masts. A conversion relating the wind speeds and directions from the temporary meteorological masts to the permanent ones has been provided by wind engineering consultant Garrad Hassan. The conversion is based on a correlation of the meteorological data gathered from the temporary and permanent met masts between July 2011 and August 2012 when both sets of masts were operating simultaneously. This conversion has been used to relate the pre-construction background noise measurements to the wind speeds at the permanent met masts.
The noise limits that have been determined to apply at each property are shown on the graphs presented in the measurement results section of this document (Section 6.0).

AECOM Macarthur Wind Farm Commissioning Noise Monitoring - Monthly Summary Report - January 2013
P:\60279731\8. Issued Docs\8.1 Reports\Monthly Summary Reports\60279731-SummaryRpt4_Jan13-R1.docx Revision 1 - 3 May 2013
2
3.0 Noise Measurement Methodology
3.1 Procedure A laboratory calibrated noise monitor was placed at each measurement location from 1 to 30 January 2013 to measure the noise emissions from the Wind Farm. The noise monitor was located on site in accordance with the requirements of New Zealand Standard NZS6808:1998.
A photograph of a typical noise monitoring installation at a measurement location is presented in Figure 1.
Figure 1 – Typical Noise Monitoring Setup
The noise monitor measured noise over 10-minute periods, in accordance with NZS6808:1998 and stored the measured noise level at the end of each 10-minute period. This process occurred continuously, 24 hours per day for the monitoring period.
The measured noise levels were correlated with wind speed data from meteorological masts at the wind farm to determine the “average” noise level at each wind speed, in accordance with the methodology prescribed by NZS 6808:1998.
The measured noise levels represent the combination of background noise and wind farm noise. As such, the measured noise levels would be higher than the noise levels due to the wind farm only.
It should be noted that NZS 6808:1998 allows for the measured noise levels to be adjusted to compensate for the influence of background noise when assessing the noise levels from the wind farm. Such an adjustment has not been applied to the measured levels presented in this report. The approach of comparing the combined background noise and wind farm noise to the assessment criteria (as used in this report), is therefore conservative.

AECOM Macarthur Wind Farm Commissioning Noise Monitoring - Monthly Summary Report - January 2013
P:\60279731\8. Issued Docs\8.1 Reports\Monthly Summary Reports\60279731-SummaryRpt4_Jan13-R1.docx Revision 1 - 3 May 2013
3
3.2 Measurement Locations Noise measurements were conducted at the following locations: Table 1 Commissioning Noise Monitoring Locations
Location ID Location Description
O17A West of wind farm – nearest wind turbines approximately 1.7 km to the east
O23A West of wind farm – nearest wind turbines approximately 2.7 km to the east
Q20A West of wind farm – nearest wind turbines approximately 1.7 km to the east
R26B South of wind farm – nearest wind turbines approximately 1.8 km to the north
S26A South of wind farm – nearest wind turbines approximately 1.8 km to the north
W26A South of wind farm – nearest wind turbines approximately 2.0 km to the north
Y16A East of wind farm – nearest wind turbines approximately 2.7 km to the southwest
Y18A East of wind farm – nearest wind turbines approximately 1.9 km to the west
Y21A East of wind farm – nearest wind turbines approximately 2.6 km to the northwest
3.3 Instrumentation The details of the instrumentation used to perform the noise measurements are presented in Table 2. All instrumentation held current certificates of laboratory calibration by a NATA accredited laboratory at the time of the monitoring. An example laboratory calibration certificate is presented in Appendix C.
The readings of the monitors were field-checked using a portable sound level calibrator at the beginning and end of the noise monitoring period, and at intermediate points when the noise monitors were stopped for downloading or battery change. Table 2 Instrumentation Details
Location ID Instrument Make / Model Serial No.
Date of Last Laboratory Calibration*
O17A Svan 957 Class 1 Environmental Noise Logger 23855 02/10/2011
O23A Svan 957 Class 1 Environmental Noise Logger 27537 11/04/2012
Q20A Svan 957 Class 1 Environmental Noise Logger 27554 11/04/2012
R26B Rion NL-21 Class 2 Environmental Noise Logger 409170 24/08/2011
S26A Rion NL-21 Class 2 Environmental Noise Logger 865769 11/07/2012
W26A Svan 957 Class 1 Environmental Noise Logger 27542 11/04/2012
Y16A Rion NL-21 Class 2 Environmental Noise Logger 465440 02/06/2012
Y18A Rion NL-21 Class 2 Environmental Noise Logger 465445 01/06/2012
Y21A Svan 957 Class 1 Environmental Noise Logger 27552 11/04/2012
All Rion NC-74 Class 1 Portable Sound Level Calibrator 35084189 22/05/2012 * In accordance with NATA guidelines, laboratory calibration of Sound Level Meters should be performed once every two years, and laboratory calibration of Sound Level Calibrators should be performed annually.
AECOM Macarthur Wind Farm Commissioning Noise Monitoring - Monthly Summary Report - January 2013
P:\60279731\8. Issued Docs\8.1 Reports\Monthly Summary Reports\60279731-SummaryRpt4_Jan13-R1.docx Revision 1 - 3 May 2013
4
4.0 Meteorological Data There are six permanent meteorological masts (met masts) located at the wind farm (see site map presented in Appendix B). All of the met masts are located at positions where they may be affected by the wake from the wind turbines at certain times, depending on the wind direction. In order to avoid using wind data that is potentially wake-affected, the wind speed data used for the noise analysis was derived from a combination of the six met masts, and corrected for positional wind speed variation back to a reference met mast location, as recommended by the wind analyst, Garrad Hassan.
Wind speed and direction data used for the analysis is in terms of 10-minute averages at the wind turbine hub height of 84m. The measurement time intervals of the noise monitoring equipment were synchronised with the measurement intervals of the met masts.
5.0 Wind Farm Operations during Monitoring Period During the monitoring period, final commissioning activities were still being undertaken at the wind farm, but all 140 wind turbines were operational. A map showing the locations of the wind turbines at the wind farm is presented in Appendix B.
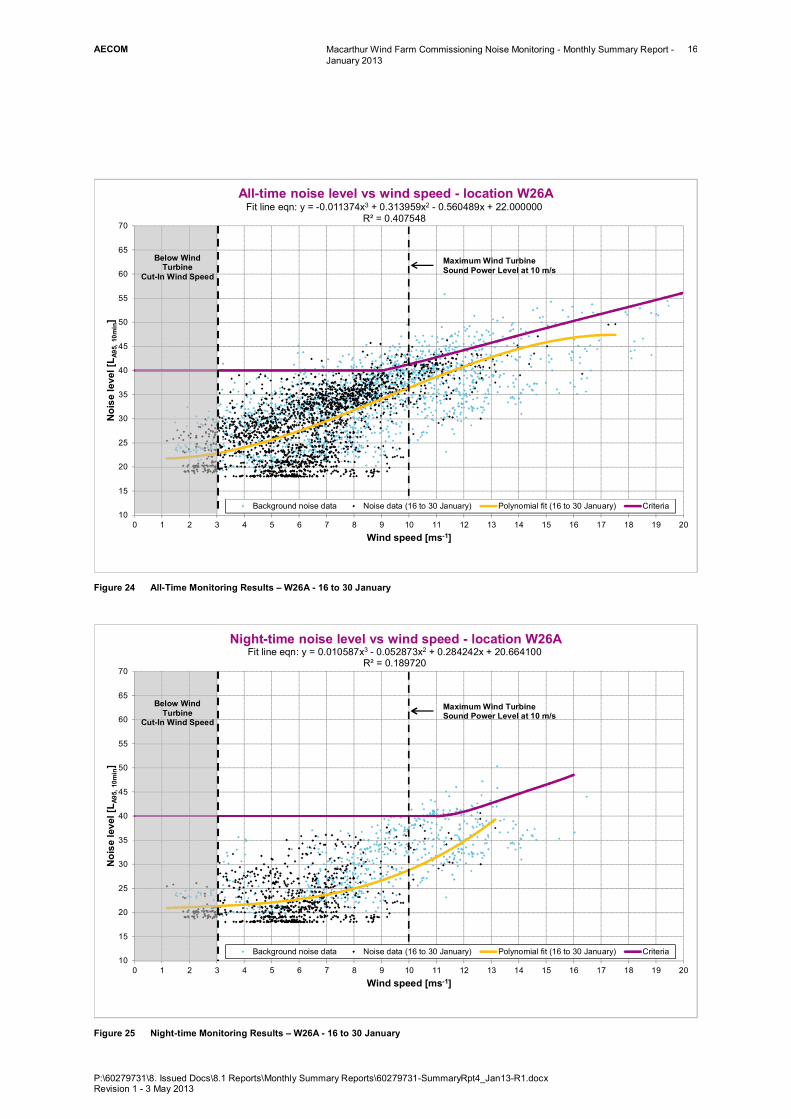
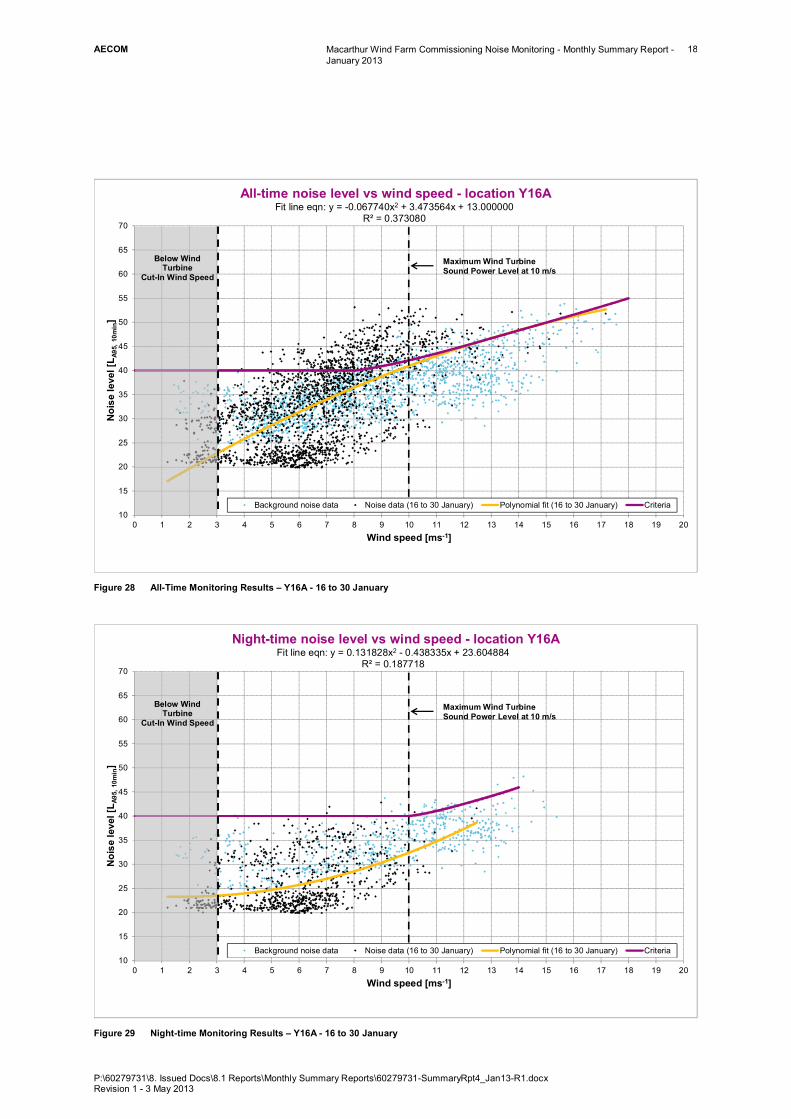
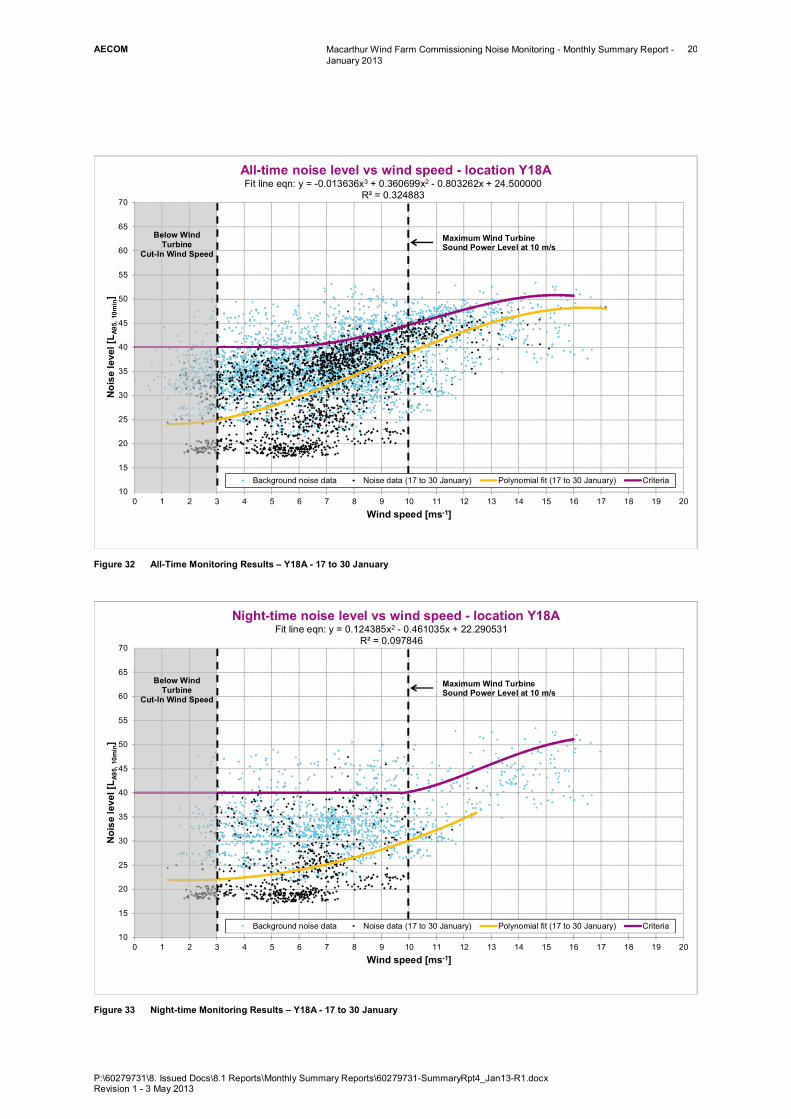
6.0 Measurement Results The graphs on the following pages compare the measured ‘all-time’ and ‘night-time’ noise levels with the noise criteria determined for each location. Each graph shows each 10-minute data point measured with the wind turbines operating during the monitoring period as black dots. The polynomial fit-line to this data (i.e. the “average” noise level determined in accordance with NZS 6808:1998) is shown on the graph as an orange line. The background noise levels measured without the wind turbines running are shown as light blue dots, for information.
The following additional point should be noted:
1) The wind turbines at Macarthur wind farm are set to operate in Noise Mode 0. Based on data from Vestas’ General Specification for the turbines, the maximum wind turbine sound power levels in this operating mode occur at a wind speed of 10 m/s. Any increases in the measured noise levels with wind speed above 10 m/s would therefore be a function of increasing background noise levels.
AECOM Macarthur Wind Farm Commissioning Noise Monitoring - Monthly Summary Report - January 2013
P:\60279731\8. Issued Docs\8.1 Reports\Monthly Summary Reports\60279731-SummaryRpt4_Jan13-R1.docx Revision 1 - 3 May 2013
5
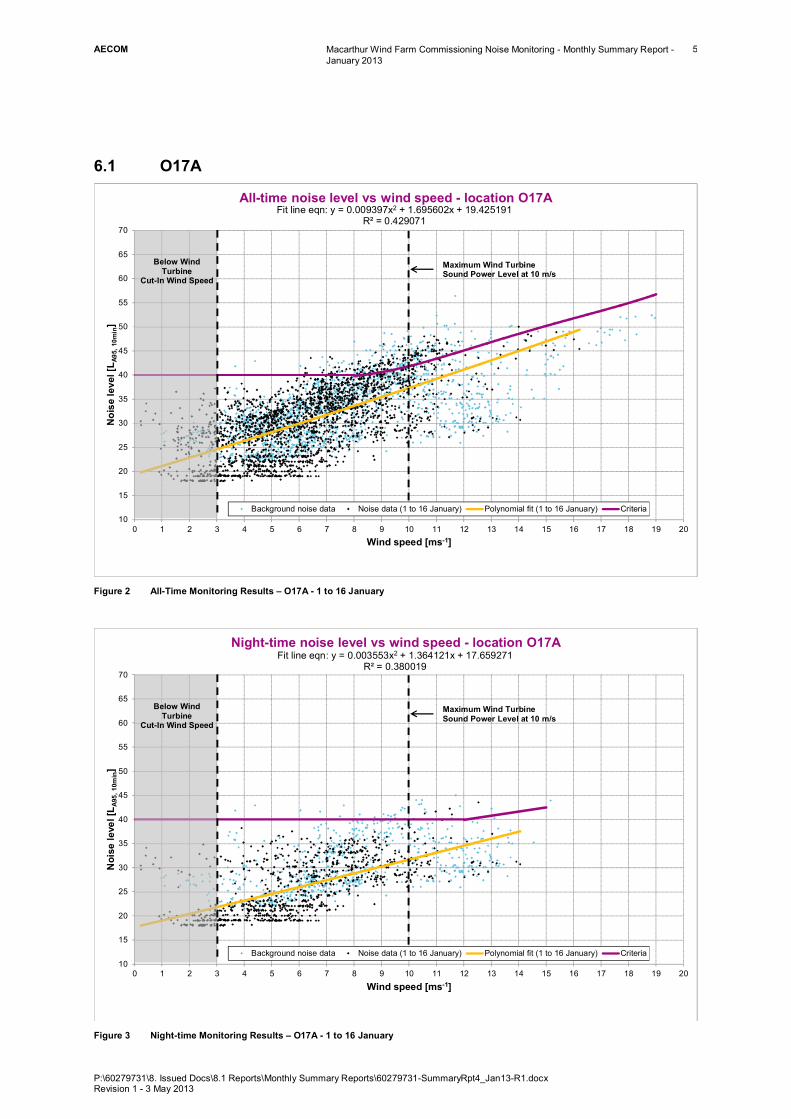
6.1 O17A
Figure 2 All-Time Monitoring Results – O17A - 1 to 16 January
Figure 3 Night-time Monitoring Results – O17A - 1 to 16 January
Fit line eqn: y = 0.009397x2 + 1.695602x + 19.425191R² = 0.429071
10
15
20
25
30
35
40
45
50
55
60
65
70
0 1 2 3 4 5 6 7 8 9 10 11 12 13 14 15 16 17 18 19 20
Noi
se le
vel [
L A95
, 10m
in]
Wind speed [ms-1]
All-time noise level vs wind speed - location O17A
Background noise data Noise data (1 to 16 January) Polynomial fit (1 to 16 January) Criteria
Below WindTurbine
Cut-In Wind Speed
Maximum Wind Turbine Sound Power Level at 10 m/s
Fit line eqn: y = 0.003553x2 + 1.364121x + 17.659271R² = 0.380019
10
15
20
25
30
35
40
45
50
55
60
65
70
0 1 2 3 4 5 6 7 8 9 10 11 12 13 14 15 16 17 18 19 20
Noi
se le
vel [
L A95
, 10m
in]
Wind speed [ms-1]
Night-time noise level vs wind speed - location O17A
Background noise data Noise data (1 to 16 January) Polynomial fit (1 to 16 January) Criteria
Below WindTurbine
Cut-In Wind Speed
Maximum Wind Turbine Sound Power Level at 10 m/s

AECOM Macarthur Wind Farm Commissioning Noise Monitoring - Monthly Summary Report - January 2013
P:\60279731\8. Issued Docs\8.1 Reports\Monthly Summary Reports\60279731-SummaryRpt4_Jan13-R1.docx Revision 1 - 3 May 2013
6
Figure 4 All-Time Monitoring Results – O17A - 16 to 30 January
Figure 5 Night-time Monitoring Results – O17A - 16 to 30 January
Fit line eqn: y = -0.022096x3 + 0.561393x2 - 2.265698x + 27.000000R² = 0.344937
10
15
20
25
30
35
40
45
50
55
60
65
70
0 1 2 3 4 5 6 7 8 9 10 11 12 13 14 15 16 17 18 19 20
Noi
se le
vel [
L A95
, 10m
in]
Wind speed [ms-1]
All-time noise level vs wind speed - location O17A
Background noise data Noise data (16 to 30 January) Polynomial fit (16 to 30 January) Criteria
Below WindTurbine
Cut-In Wind Speed
Maximum Wind Turbine Sound Power Level at 10 m/s
Fit line eqn: y = 0.094435x2 - 0.062658x + 21.358215R² = 0.114525
10
15
20
25
30
35
40
45
50
55
60
65
70
0 1 2 3 4 5 6 7 8 9 10 11 12 13 14 15 16 17 18 19 20
Noi
se le
vel [
L A95
, 10m
in]
Wind speed [ms-1]
Night-time noise level vs wind speed - location O17A
Background noise data Noise data (16 to 30 January) Polynomial fit (16 to 30 January) Criteria
Below WindTurbine
Cut-In Wind Speed
Maximum Wind Turbine Sound Power Level at 10 m/s

AECOM Macarthur Wind Farm Commissioning Noise Monitoring - Monthly Summary Report - January 2013
P:\60279731\8. Issued Docs\8.1 Reports\Monthly Summary Reports\60279731-SummaryRpt4_Jan13-R1.docx Revision 1 - 3 May 2013
7
6.2 O23A
Figure 6 All-Time Monitoring Results – O23A - 1 to 16 January
Figure 7 Night-time Monitoring Results – O23A - 1 to 16 January
Fit line eqn: y = -0.009415x3 + 0.200410x2 + 0.706069x + 21.000000R² = 0.396545
10
15
20
25
30
35
40
45
50
55
60
65
70
0 1 2 3 4 5 6 7 8 9 10 11 12 13 14 15 16 17 18 19 20
Noi
se le
vel [
L A95
, 10m
in]
Wind speed [ms-1]
All-time noise level vs wind speed - location O23A
Background noise data Noise data (1 to 16 January) Polynomial fit (1 to 16 January) Criteria
Below WindTurbine
Cut-In Wind Speed
Maximum Wind Turbine Sound Power Level at 10 m/s
Fit line eqn: y = -0.010620x3 + 0.278881x2 - 0.285154x + 20.000000R² = 0.395254
10
15
20
25
30
35
40
45
50
55
60
65
70
0 1 2 3 4 5 6 7 8 9 10 11 12 13 14 15 16 17 18 19 20
Noi
se le
vel [
L A95
, 10m
in]
Wind speed [ms-1]
Night-time noise level vs wind speed - location O23A
Background noise data Noise data (January) Polynomial fit (January) Criteria
Below WindTurbine
Cut-In Wind Speed
Maximum Wind Turbine Sound Power Level at 10 m/s

AECOM Macarthur Wind Farm Commissioning Noise Monitoring - Monthly Summary Report - January 2013
P:\60279731\8. Issued Docs\8.1 Reports\Monthly Summary Reports\60279731-SummaryRpt4_Jan13-R1.docx Revision 1 - 3 May 2013
8
Figure 8 All-Time Monitoring Results – O23A - 16 to 30 January
Figure 9 Night-time Monitoring Results – O23A - 16 to 30 January
Fit line eqn: y = -0.014915x3 + 0.401014x2 - 1.159091x + 25.000000R² = 0.269726
10
15
20
25
30
35
40
45
50
55
60
65
70
0 1 2 3 4 5 6 7 8 9 10 11 12 13 14 15 16 17 18 19 20
Noi
se le
vel [
L A95
, 10m
in]
Wind speed [ms-1]
All-time noise level vs wind speed - location O23A
Background noise data Noise data (16 to 30 January) Polynomial fit (16 to 30 January) Criteria
Below WindTurbine
Cut-In Wind Speed
Maximum Wind Turbine Sound Power Level at 10 m/s
Fit line eqn: y = 0.120468x2 - 0.233340x + 20.911379R² = 0.103933
10
15
20
25
30
35
40
45
50
55
60
65
70
0 1 2 3 4 5 6 7 8 9 10 11 12 13 14 15 16 17 18 19 20
Noi
se le
vel [
L A95
, 10m
in]
Wind speed [ms-1]
Night-time noise level vs wind speed - location O23A
Background noise data Noise data (16 to 30 January) Polynomial fit (16 to 30 January) Criteria
Below WindTurbine
Cut-In Wind Speed
Maximum Wind Turbine Sound Power Level at 10 m/s

AECOM Macarthur Wind Farm Commissioning Noise Monitoring - Monthly Summary Report - January 2013
P:\60279731\8. Issued Docs\8.1 Reports\Monthly Summary Reports\60279731-SummaryRpt4_Jan13-R1.docx Revision 1 - 3 May 2013
9
6.3 Q20A
Figure 10 All-Time Monitoring Results – Q20A - 1 to 16 January
Figure 11 Night-time Monitoring Results – Q20A - 1 to 16 January
Fit line eqn: y = -0.062664x2 + 2.861141x + 15.000000R² = 0.515021
10
15
20
25
30
35
40
45
50
55
60
65
70
0 1 2 3 4 5 6 7 8 9 10 11 12 13 14 15 16 17 18 19 20
Noi
se le
vel [
L A95
, 10m
in]
Wind speed [ms-1]
All-time noise level vs wind speed - location Q20A
Background noise data Noise data (1 to 16 January) Polynomial fit (1 to 16 January) Criteria
Below WindTurbine
Cut-In Wind Speed
Maximum Wind Turbine Sound Power Level at 10 m/s
Fit line eqn: y = 0.003375x3 - 0.142681x2 + 2.893009x + 14.000000R² = 0.378164
10
15
20
25
30
35
40
45
50
55
60
65
70
0 1 2 3 4 5 6 7 8 9 10 11 12 13 14 15 16 17 18 19 20
Noi
se le
vel [
L A95
, 10m
in]
Wind speed [ms-1]
Night-time noise level vs wind speed - location Q20A
Background noise data Noise data (1 to 16 January) Polynomial fit (1 to 16 January) Criteria
Below WindTurbine
Cut-In Wind Speed
Maximum Wind Turbine Sound Power Level at 10 m/s

AECOM Macarthur Wind Farm Commissioning Noise Monitoring - Monthly Summary Report - January 2013
P:\60279731\8. Issued Docs\8.1 Reports\Monthly Summary Reports\60279731-SummaryRpt4_Jan13-R1.docx Revision 1 - 3 May 2013
10
Figure 12 All-Time Monitoring Results – Q20A - 16 to 30 January
Figure 13 Night-time Monitoring Results – Q20A - 16 to 30 January
Fit line eqn: y = -0.017202x3 + 0.414195x2 - 0.692895x + 21.000000R² = 0.483758
10
15
20
25
30
35
40
45
50
55
60
65
70
0 1 2 3 4 5 6 7 8 9 10 11 12 13 14 15 16 17 18 19 20
Noi
se le
vel [
L A95
, 10m
in]
Wind speed [ms-1]
All-time noise level vs wind speed - location Q20A
Background noise data Noise data (16 to 30 January) Polynomial fit (16 to 30 January) Criteria
Below WindTurbine
Cut-In Wind Speed
Maximum Wind Turbine Sound Power Level at 10 m/s
Fit line eqn: y = 0.018567x2 + 1.006320x + 17.621615R² = 0.250531
10
15
20
25
30
35
40
45
50
55
60
65
70
0 1 2 3 4 5 6 7 8 9 10 11 12 13 14 15 16 17 18 19 20
Noi
se le
vel [
L A95
, 10m
in]
Wind speed [ms-1]
Night-time noise level vs wind speed - location Q20A
Background noise data Noise data (16 to 30 January) Polynomial fit (16 to 30 January) Criteria
Below WindTurbine
Cut-In Wind Speed
Maximum Wind Turbine Sound Power Level at 10 m/s

AECOM Macarthur Wind Farm Commissioning Noise Monitoring - Monthly Summary Report - January 2013
P:\60279731\8. Issued Docs\8.1 Reports\Monthly Summary Reports\60279731-SummaryRpt4_Jan13-R1.docx Revision 1 - 3 May 2013
11
6.4 R26B
Figure 14 All-Time Monitoring Results – R26B - 1 to 16 January
Figure 15 Night-time Monitoring Results – R26B - 1 to 16 January
Fit line eqn: y = 1.479082x + 21.609793R² = 0.328201
10
15
20
25
30
35
40
45
50
55
60
65
70
0 1 2 3 4 5 6 7 8 9 10 11 12 13 14 15 16 17 18 19 20
Noi
se le
vel [
L A95
, 10m
in]
Wind speed [ms-1]
All-time noise level vs wind speed - location R26B
Background noise data Noise data (1 to 16 January) Polynomial fit (1 to 16 January) Criteria
Below WindTurbine
Cut-In Wind Speed
Maximum Wind Turbine Sound Power Level at 10 m/s
Fit line eqn: y = 0.037635x2 + 0.459297x + 22.680063R² = 0.153178
10
15
20
25
30
35
40
45
50
55
60
65
70
0 1 2 3 4 5 6 7 8 9 10 11 12 13 14 15 16 17 18 19 20
Noi
se le
vel [
L A95
, 10m
in]
Wind speed [ms-1]
Night-time noise level vs wind speed - location R26B
Background noise data Noise data (1 to 16 January) Polynomial fit (1 to 16 January) Criteria
Below WindTurbine
Cut-In Wind Speed
Maximum Wind Turbine Sound Power Level at 10 m/s

AECOM Macarthur Wind Farm Commissioning Noise Monitoring - Monthly Summary Report - January 2013
P:\60279731\8. Issued Docs\8.1 Reports\Monthly Summary Reports\60279731-SummaryRpt4_Jan13-R1.docx Revision 1 - 3 May 2013
12
Figure 16 All-Time Monitoring Results – R26B - 16 to 30 January
Figure 17 Night-time Monitoring Results – R26B - 16 to 30 January
Fit line eqn: y = -0.005999x3 + 0.170627x2 + 0.257770x + 23.000000R² = 0.271487
10
15
20
25
30
35
40
45
50
55
60
65
70
0 1 2 3 4 5 6 7 8 9 10 11 12 13 14 15 16 17 18 19 20
Noi
se le
vel [
L A95
, 10m
in]
Wind speed [ms-1]
All-time noise level vs wind speed - location R26B
Background noise data Noise data (16 to 30 January) Polynomial fit (16 to 30 January) Criteria
Below WindTurbine
Cut-In Wind Speed
Maximum Wind Turbine Sound Power Level at 10 m/s
Fit line eqn: y = 0.083450x2 - 0.345703x + 23.978570R² = 0.041643
10
15
20
25
30
35
40
45
50
55
60
65
70
0 1 2 3 4 5 6 7 8 9 10 11 12 13 14 15 16 17 18 19 20
Noi
se le
vel [
L A95
, 10m
in]
Wind speed [ms-1]
Night-time noise level vs wind speed - location R26B
Background noise data Noise data (16 to 30 January) Polynomial fit (16 to 30 January) Criteria
Below WindTurbine
Cut-In Wind Speed
Maximum Wind Turbine Sound Power Level at 10 m/s

AECOM Macarthur Wind Farm Commissioning Noise Monitoring - Monthly Summary Report - January 2013
P:\60279731\8. Issued Docs\8.1 Reports\Monthly Summary Reports\60279731-SummaryRpt4_Jan13-R1.docx Revision 1 - 3 May 2013
13
6.5 S26A
Figure 18 All-Time Monitoring Results – S26A - 1 to 16 January
Figure 19 Night-time Monitoring Results – S26A - 1 to 16 January
Fit line eqn: y = -0.006844x3 + 0.249099x2 - 1.003347x + 30.000000R² = 0.425224
10
15
20
25
30
35
40
45
50
55
60
65
70
0 1 2 3 4 5 6 7 8 9 10 11 12 13 14 15 16 17 18 19 20
Noi
se le
vel [
L A95
, 10m
in]
Wind speed [ms-1]
All-time noise level vs wind speed - location S26A
Background noise data Noise data (1 to 16 January) Polynomial fit (1 to 16 January) Criteria
Below WindTurbine
Cut-In Wind Speed
Maximum Wind Turbine Sound Power Level at 10 m/s
Fit line eqn: y = -0.002383x3 + 0.116892x2 - 0.324998x + 27.000000R² = 0.289633
10
15
20
25
30
35
40
45
50
55
60
65
70
0 1 2 3 4 5 6 7 8 9 10 11 12 13 14 15 16 17 18 19 20
Noi
se le
vel [
L A95
, 10m
in]
Wind speed [ms-1]
Night-time noise level vs wind speed - location S26A
Background noise data Noise data (1 to 16 January) Polynomial fit (1 to 16 January) Criteria
Below WindTurbine
Cut-In Wind Speed
Maximum Wind Turbine Sound Power Level at 10 m/s

AECOM Macarthur Wind Farm Commissioning Noise Monitoring - Monthly Summary Report - January 2013
P:\60279731\8. Issued Docs\8.1 Reports\Monthly Summary Reports\60279731-SummaryRpt4_Jan13-R1.docx Revision 1 - 3 May 2013
14
Figure 20 All-Time Monitoring Results – S26A - 16 to 30 January
Figure 21 Night-time Monitoring Results – S26A - 16 to 30 January
Fit line eqn: y = -0.004554x3 + 0.163902x2 + 0.007477x + 25.000000R² = 0.470700
10
15
20
25
30
35
40
45
50
55
60
65
70
0 1 2 3 4 5 6 7 8 9 10 11 12 13 14 15 16 17 18 19 20
Noi
se le
vel [
L A95
, 10m
in]
Wind speed [ms-1]
All-time noise level vs wind speed - location S26A
Background noise data Noise data (16 to 30 January) Polynomial fit (16 to 30 January) Criteria
Below WindTurbine
Cut-In Wind Speed
Maximum Wind Turbine Sound Power Level at 10 m/s
Fit line eqn: y = 0.007337x3 - 0.080450x2 + 0.767977x + 24.464408R² = 0.164754
10
15
20
25
30
35
40
45
50
55
60
65
70
0 1 2 3 4 5 6 7 8 9 10 11 12 13 14 15 16 17 18 19 20
Noi
se le
vel [
L A95
, 10m
in]
Wind speed [ms-1]
Night-time noise level vs wind speed - location S26A
Background noise data Noise data (16 to 30 January) Polynomial fit (16 to 30 January) Criteria
Below WindTurbine
Cut-In Wind Speed
Maximum Wind Turbine Sound Power Level at 10 m/s
AECOM Macarthur Wind Farm Commissioning Noise Monitoring - Monthly Summary Report - January 2013
P:\60279731\8. Issued Docs\8.1 Reports\Monthly Summary Reports\60279731-SummaryRpt4_Jan13-R1.docx Revision 1 - 3 May 2013
15
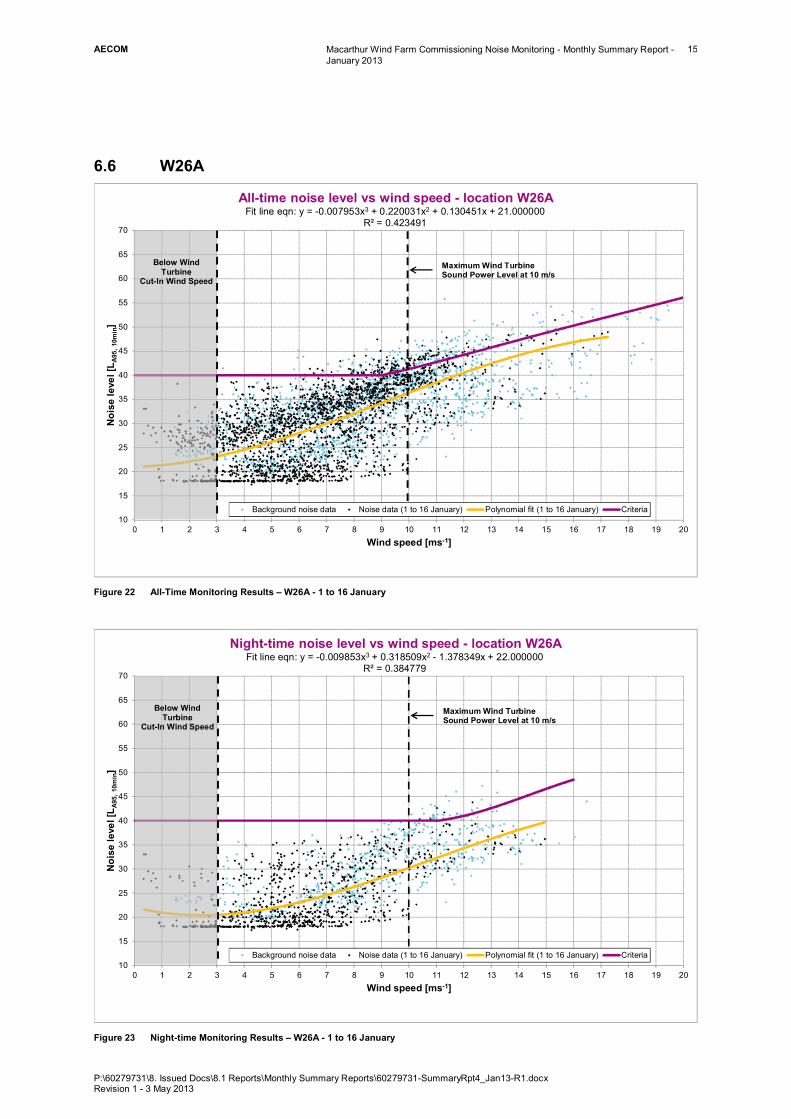
6.6 W26A
Figure 22 All-Time Monitoring Results – W26A - 1 to 16 January
Figure 23 Night-time Monitoring Results – W26A - 1 to 16 January
Fit line eqn: y = -0.007953x3 + 0.220031x2 + 0.130451x + 21.000000R² = 0.423491
10
15
20
25
30
35
40
45
50
55
60
65
70
0 1 2 3 4 5 6 7 8 9 10 11 12 13 14 15 16 17 18 19 20
Noi
se le
vel [
L A95
, 10m
in]
Wind speed [ms-1]
All-time noise level vs wind speed - location W26A
Background noise data Noise data (1 to 16 January) Polynomial fit (1 to 16 January) Criteria
Below WindTurbine
Cut-In Wind Speed
Maximum Wind Turbine Sound Power Level at 10 m/s
Fit line eqn: y = -0.009853x3 + 0.318509x2 - 1.378349x + 22.000000R² = 0.384779
10
15
20
25
30
35
40
45
50
55
60
65
70
0 1 2 3 4 5 6 7 8 9 10 11 12 13 14 15 16 17 18 19 20
Noi
se le
vel [
L A95
, 10m
in]
Wind speed [ms-1]
Night-time noise level vs wind speed - location W26A
Background noise data Noise data (1 to 16 January) Polynomial fit (1 to 16 January) Criteria
Below WindTurbine
Cut-In Wind Speed
Maximum Wind Turbine Sound Power Level at 10 m/s
AECOM Macarthur Wind Farm Commissioning Noise Monitoring - Monthly Summary Report - January 2013
P:\60279731\8. Issued Docs\8.1 Reports\Monthly Summary Reports\60279731-SummaryRpt4_Jan13-R1.docx Revision 1 - 3 May 2013
16
Figure 24 All-Time Monitoring Results – W26A - 16 to 30 January
Figure 25 Night-time Monitoring Results – W26A - 16 to 30 January
Fit line eqn: y = -0.011374x3 + 0.313959x2 - 0.560489x + 22.000000R² = 0.407548
10
15
20
25
30
35
40
45
50
55
60
65
70
0 1 2 3 4 5 6 7 8 9 10 11 12 13 14 15 16 17 18 19 20
Noi
se le
vel [
L A95
, 10m
in]
Wind speed [ms-1]
All-time noise level vs wind speed - location W26A
Background noise data Noise data (16 to 30 January) Polynomial fit (16 to 30 January) Criteria
Below WindTurbine
Cut-In Wind Speed
Maximum Wind Turbine Sound Power Level at 10 m/s
Fit line eqn: y = 0.010587x3 - 0.052873x2 + 0.284242x + 20.664100R² = 0.189720
10
15
20
25
30
35
40
45
50
55
60
65
70
0 1 2 3 4 5 6 7 8 9 10 11 12 13 14 15 16 17 18 19 20
Noi
se le
vel [
L A95
, 10m
in]
Wind speed [ms-1]
Night-time noise level vs wind speed - location W26A
Background noise data Noise data (16 to 30 January) Polynomial fit (16 to 30 January) Criteria
Below WindTurbine
Cut-In Wind Speed
Maximum Wind Turbine Sound Power Level at 10 m/s

AECOM Macarthur Wind Farm Commissioning Noise Monitoring - Monthly Summary Report - January 2013
P:\60279731\8. Issued Docs\8.1 Reports\Monthly Summary Reports\60279731-SummaryRpt4_Jan13-R1.docx Revision 1 - 3 May 2013
17
6.7 Y16A
Figure 26 All-Time Monitoring Results – Y16A - 1 to 16 January
Figure 27 Night-time Monitoring Results – Y16A - 1 to 16 January
Fit line eqn: y = -0.015506x3 + 0.356457x2 - 0.324710x + 24.500000R² = 0.432252
10
15
20
25
30
35
40
45
50
55
60
65
70
0 1 2 3 4 5 6 7 8 9 10 11 12 13 14 15 16 17 18 19 20
Noi
se le
vel [
L A95
, 10m
in]
Wind speed [ms-1]
All-time noise level vs wind speed - location Y16A
Background noise data Noise data (1 to 16 January) Polynomial fit (1 - 16 January) Criteria
Below WindTurbine
Cut-In Wind Speed
Maximum Wind Turbine Sound Power Level at 10 m/s
Fit line eqn: y = -0.004616x3 + 0.113055x2 + 0.721062x + 20.000000R² = 0.408345
10
15
20
25
30
35
40
45
50
55
60
65
70
0 1 2 3 4 5 6 7 8 9 10 11 12 13 14 15 16 17 18 19 20
Noi
se le
vel [
L A95
, 10m
in]
Wind speed [ms-1]
Night-time noise level vs wind speed - location Y16A
Background noise data Noise data (1 to 16 January) Polynomial fit (1 to 16 January) Criteria
Below WindTurbine
Cut-In Wind Speed
Maximum Wind Turbine Sound Power Level at 10 m/s
AECOM Macarthur Wind Farm Commissioning Noise Monitoring - Monthly Summary Report - January 2013
P:\60279731\8. Issued Docs\8.1 Reports\Monthly Summary Reports\60279731-SummaryRpt4_Jan13-R1.docx Revision 1 - 3 May 2013
18
Figure 28 All-Time Monitoring Results – Y16A - 16 to 30 January
Figure 29 Night-time Monitoring Results – Y16A - 16 to 30 January
Fit line eqn: y = -0.067740x2 + 3.473564x + 13.000000R² = 0.373080
10
15
20
25
30
35
40
45
50
55
60
65
70
0 1 2 3 4 5 6 7 8 9 10 11 12 13 14 15 16 17 18 19 20
Noi
se le
vel [
L A95
, 10m
in]
Wind speed [ms-1]
All-time noise level vs wind speed - location Y16A
Background noise data Noise data (16 to 30 January) Polynomial fit (16 to 30 January) Criteria
Below WindTurbine
Cut-In Wind Speed
Maximum Wind Turbine Sound Power Level at 10 m/s
Fit line eqn: y = 0.131828x2 - 0.438335x + 23.604884R² = 0.187718
10
15
20
25
30
35
40
45
50
55
60
65
70
0 1 2 3 4 5 6 7 8 9 10 11 12 13 14 15 16 17 18 19 20
Noi
se le
vel [
L A95
, 10m
in]
Wind speed [ms-1]
Night-time noise level vs wind speed - location Y16A
Background noise data Noise data (16 to 30 January) Polynomial fit (16 to 30 January) Criteria
Below WindTurbine
Cut-In Wind Speed
Maximum Wind Turbine Sound Power Level at 10 m/s

AECOM Macarthur Wind Farm Commissioning Noise Monitoring - Monthly Summary Report - January 2013
P:\60279731\8. Issued Docs\8.1 Reports\Monthly Summary Reports\60279731-SummaryRpt4_Jan13-R1.docx Revision 1 - 3 May 2013
19
6.8 Y18A
Figure 30 All-Time Monitoring Results – Y18A - 1 to 17 January
Figure 31 Night-time Monitoring Results – Y18A - 1 to 17 January
Fit line eqn: y = -0.000808x4 + 0.010319x3 + 0.160968x2 - 0.884641x + 29.449720R² = 0.254451
10
15
20
25
30
35
40
45
50
55
60
65
70
0 1 2 3 4 5 6 7 8 9 10 11 12 13 14 15 16 17 18 19 20
Noi
se le
vel [
L A95
, 10m
in]
Wind speed [ms-1]
All-time noise level vs wind speed - location Y18A
Background noise data Noise data (1 to 17 January) Polynomial fit (1 to 17 January) Criteria
Below WindTurbine
Cut-In Wind Speed
Maximum Wind Turbine Sound Power Level at 10 m/s
Fit line eqn: y = -0.010486x3 + 0.334070x2 - 1.487664x + 24.924950R² = 0.219836
10
15
20
25
30
35
40
45
50
55
60
65
70
0 1 2 3 4 5 6 7 8 9 10 11 12 13 14 15 16 17 18 19 20
Noi
se le
vel [
L A95
, 10m
in]
Wind speed [ms-1]
Night-time noise level vs wind speed - location Y18A
Background noise data Noise data (1 to 17 January) Polynomial fit (1 to 17 January) Criteria
Below WindTurbine
Cut-In Wind Speed
Maximum Wind Turbine Sound Power Level at 10 m/s
AECOM Macarthur Wind Farm Commissioning Noise Monitoring - Monthly Summary Report - January 2013
P:\60279731\8. Issued Docs\8.1 Reports\Monthly Summary Reports\60279731-SummaryRpt4_Jan13-R1.docx Revision 1 - 3 May 2013
20
Figure 32 All-Time Monitoring Results – Y18A - 17 to 30 January
Figure 33 Night-time Monitoring Results – Y18A - 17 to 30 January
Fit line eqn: y = -0.013636x3 + 0.360699x2 - 0.803262x + 24.500000R² = 0.324883
10
15
20
25
30
35
40
45
50
55
60
65
70
0 1 2 3 4 5 6 7 8 9 10 11 12 13 14 15 16 17 18 19 20
Noi
se le
vel [
L A95
, 10m
in]
Wind speed [ms-1]
All-time noise level vs wind speed - location Y18A
Background noise data Noise data (17 to 30 January) Polynomial fit (17 to 30 January) Criteria
Below WindTurbine
Cut-In Wind Speed
Maximum Wind Turbine Sound Power Level at 10 m/s
Fit line eqn: y = 0.124385x2 - 0.461035x + 22.290531R² = 0.097846
10
15
20
25
30
35
40
45
50
55
60
65
70
0 1 2 3 4 5 6 7 8 9 10 11 12 13 14 15 16 17 18 19 20
Noi
se le
vel [
L A95
, 10m
in]
Wind speed [ms-1]
Night-time noise level vs wind speed - location Y18A
Background noise data Noise data (17 to 30 January) Polynomial fit (17 to 30 January) Criteria
Below WindTurbine
Cut-In Wind Speed
Maximum Wind Turbine Sound Power Level at 10 m/s

AECOM Macarthur Wind Farm Commissioning Noise Monitoring - Monthly Summary Report - January 2013
P:\60279731\8. Issued Docs\8.1 Reports\Monthly Summary Reports\60279731-SummaryRpt4_Jan13-R1.docx Revision 1 - 3 May 2013
21
6.9 Y21A
Figure 34 All-Time Monitoring Results – Y21A - 1 to 16 January
Figure 35 Night-time Monitoring Results – Y21A - 1 to 16 January
Fit line eqn: y = -0.007067x3 + 0.139864x2 + 1.375154x + 16.000000R² = 0.453189
10
15
20
25
30
35
40
45
50
55
60
65
70
0 1 2 3 4 5 6 7 8 9 10 11 12 13 14 15 16 17 18 19 20
Noi
se le
vel [
L A95
, 10m
in]
Wind speed [ms-1]
All-time noise level vs wind speed - location Y21A
Background noise data Noise data (1 to 16 January) Polynomial fit (1 to 16 January) Criteria
Below WindTurbine
Cut-In Wind Speed
Maximum Wind Turbine Sound Power Level at 10 m/s
Fit line eqn: y = -0.006379x3 + 0.190034x2 - 0.410597x + 20.000000R² = 0.281914
10
15
20
25
30
35
40
45
50
55
60
65
70
0 1 2 3 4 5 6 7 8 9 10 11 12 13 14 15 16 17 18 19 20
Noi
se le
vel [
L A95
, 10m
in]
Wind speed [ms-1]
Night-time noise level vs wind speed - location Y21A
Background noise data Noise data (1 to 16 January) Polynomial fit (1 to 16 January) Criteria
Below WindTurbine
Cut-In Wind Speed
Maximum Wind Turbine Sound Power Level at 10 m/s

AECOM Macarthur Wind Farm Commissioning Noise Monitoring - Monthly Summary Report - January 2013
P:\60279731\8. Issued Docs\8.1 Reports\Monthly Summary Reports\60279731-SummaryRpt4_Jan13-R1.docx Revision 1 - 3 May 2013
22
Figure 36 All-Time Monitoring Results – Y21A - 16 to 30 January
Figure 37 Night-time Monitoring Results – Y21A - 16 to 30 January
Fit line eqn: y = -0.101356x2 + 4.186974x + 6.500000R² = 0.465071
10
15
20
25
30
35
40
45
50
55
60
65
70
0 1 2 3 4 5 6 7 8 9 10 11 12 13 14 15 16 17 18 19 20
Noi
se le
vel [
L A95
, 10m
in]
Wind speed [ms-1]
All-time noise level vs wind speed - location Y21A
Background noise data Noise data (16 to 30 January) Polynomial fit (16 to 30 January) Criteria
Below WindTurbine
Cut-In Wind Speed
Maximum Wind Turbine Sound Power Level at 10 m/s
Fit line eqn: y = 0.119945x2 - 0.146575x + 19.274339R² = 0.265479
10
15
20
25
30
35
40
45
50
55
60
65
70
0 1 2 3 4 5 6 7 8 9 10 11 12 13 14 15 16 17 18 19 20
Noi
se le
vel [
L A95
, 10m
in]
Wind speed [ms-1]
Night-time noise level vs wind speed - location Y21A
Background noise data Noise data (16 to 30 January) Polynomial fit (16 to 30 January) Criteria
Below WindTurbine
Cut-In Wind Speed
Maximum Wind Turbine Sound Power Level at 10 m/s
AECOM Macarthur Wind Farm Commissioning Noise Monitoring - Monthly Summary Report - January 2013
P:\60279731\8. Issued Docs\8.1 Reports\Monthly Summary Reports\60279731-SummaryRpt4_Jan13-R1.docx Revision 1 - 3 May 2013
23
7.0 Conclusion At all locations, the measured noise levels during this monitoring period were not greater than the noise limits, for each wind speed from wind turbine cut-in to the wind speed where maximum wind turbine noise emission occurs. Therefore, the noise monitoring results indicate that the wind farm was compliant with the noise criteria prescribed by the Planning Permit during this period of commissioning noise monitoring.

AECOM Macarthur Wind Farm Commissioning Noise Monitoring - Monthly Summary Report - January 2013
P:\60279731\8. Issued Docs\8.1 Reports\Monthly Summary Reports\60279731-SummaryRpt4_Jan13-R1.docx Revision 1 - 3 May 2013
Appendix A
Acoustic Nomenclature

AECOM Macarthur Wind Farm Commissioning Noise Monitoring - Monthly Summary Report - January 2013
P:\60279731\8. Issued Docs\8.1 Reports\Monthly Summary Reports\60279731-SummaryRpt4_Jan13-R1.docx Revision 1 - 3 May 2013
A-1
Appendix A Acoustic Nomenclature
A-weighting The A-weighting scale is used to adjust the sound pressure levels measured in decibels to more accurately reflect the subjective response of the human ear to sound. The human ear is less sensitive to low frequency (pitch) sounds than sounds of middle to high frequency. That is, low frequency sounds of the same decibel level are not heard as loud as high frequency sounds. A sound level meter replicates the human response of the ear by using an electronic filter which is called the A-weighting filter. A sound level measured with this filter switched on is denoted as dB(A).
dB(A) A-weighted decibels - the unit of A-weighted sound pressure level.
L95, 10min The A-weighted sound pressure level exceeded for 95% of a 10 minute measurement period. This descriptor is used to represent the background noise levels and the wind farm noise levels under NZS 6808:1998.
Sound Pressure Level
A measure of the magnitude of a sound wave. Mathematically, it is twenty times the logarithm to the base ten of the ratio of the root mean square sound pressure at a point in a sound field, to the reference sound pressure; where sound pressure is defined as the alternating component of the pressure (Pa) at the point, and the reference sound pressure is 2x10⁻⁵ Pa. [Unit: Decibels]

AECOM Macarthur Wind Farm Commissioning Noise Monitoring - Monthly Summary Report - January 2013
P:\60279731\8. Issued Docs\8.1 Reports\Monthly Summary Reports\60279731-SummaryRpt4_Jan13-R1.docx Revision 1 - 3 May 2013
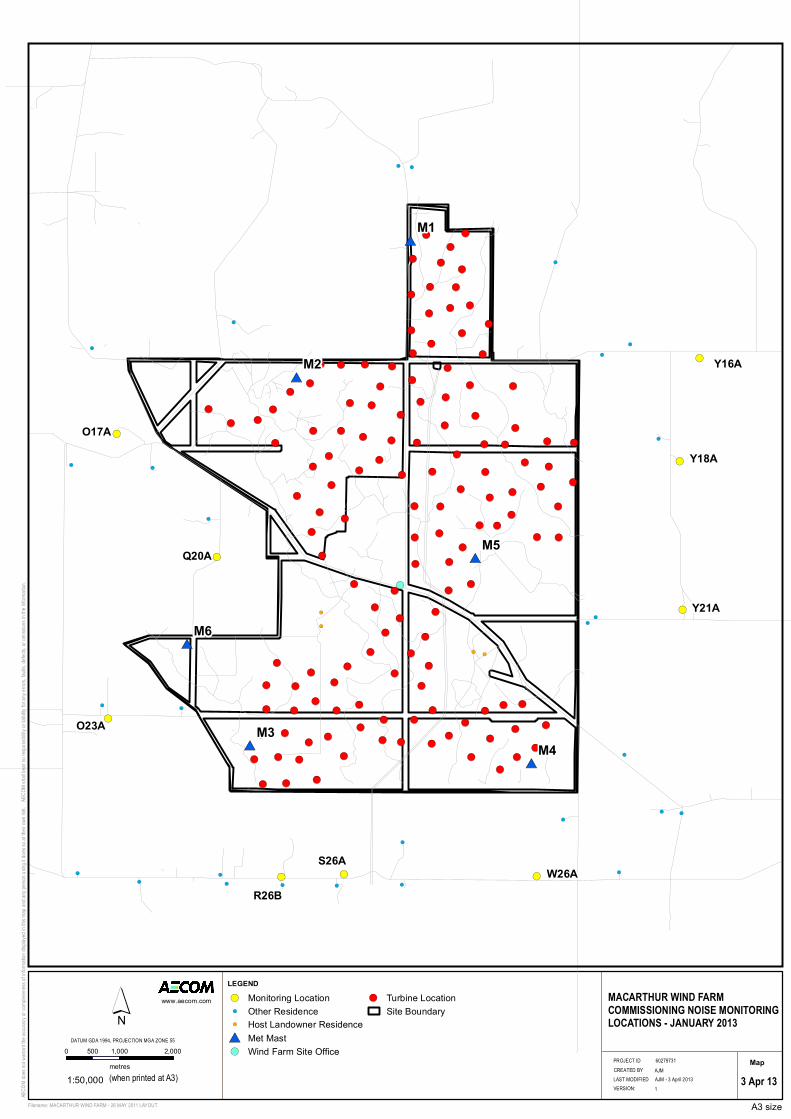
Appendix B
Site Map
!(
!(
!(
!( !(!(
!(!(!(
!(!(!(
!(!(
!(!(
!(!(
!(
!(
!(!(!(!(
!(!(
!(!(!(
!(
!(!(!(
!(
!(!(
!(
!(
!(!(!(!(!(
!(!(!(!(!(
!(
!(!(
!(
!(!(!(!(!(
!(!(
!(!(
!(!(!(
!(!(!(
!(!(
!(!(!(
!(
!(!(!(
!( !(!( !(!(!(
!(
!(
!(!(
!(
!(
!(!(
!(
!(!(
!(
!(
!(
!(
!(
!(
!(
!(
!(!(
!(
!(
!(
!(
!(
!(
!(
!(
!(
!(!(
!(
!(
!(
!(
!(!(
!(
!(
!(!(
!(
!(
!(
!(
!(
!(
!(!(
!(
!(
!(!(
!(
!(
!(
!(
!(
#*
#*
#*
#*
#*
#*
!(
!(
!( !(
!(
!(
!(
!(
!(
!(
!(
!(
!(
!(
!(
!(
!(
!(
!(
!(!(
!(
!( !(
!(
!(
!(
!(
!(
!(
!(
!(
!(
!(
!(
!(
!(
!(
!( !(
!(
!(
!(
!( !( !(
!(
!(
!(
M6
M5
M4M3
M2
M1
Filename: MACARTHUR WIND FARM - 26 MAY 2011 LAYOUT
0 1,000 2,000500
metres
´1:50,000 (when printed at A3)
MACARTHUR WIND FARMCOMMISSIONING NOISE MONITORINGLOCATIONS - JANUARY 2013
A3 size
AECO
M d
oes n
ot w
arra
nt th
e ac
cura
cy o
r com
plete
ness
of i
nfor
mat
ion d
isplay
ed in
this
map
and
any
per
son
using
it do
es so
at t
heir
own
risk.
A
ECOM
sha
ll bea
r no
resp
onsib
ility o
r lia
bility
for a
ny e
rrors
, fau
lts, d
efec
ts, o
r om
ission
s in
the
infor
mat
ion.
www.aecom.com
PROJECT ID
LAST MODIFIEDCREATED BY
60279731
AJMAJM - 3 April 2013
LEGEND
!( Monitoring Location!( Other Residence!( Host Landowner Residence#* Met Mast!( Wind Farm Site Office
!( Turbine LocationSite Boundary
DATUM GDA 1994, PROJECTION MGA ZONE 55
3 Apr 13
Map
VERSION: 1
Y18A
S26A
Q20A
R26B
O23A
W26A
Y21A
O17A
Y16A

AECOM Macarthur Wind Farm Commissioning Noise Monitoring - Monthly Summary Report - January 2013
P:\60279731\8. Issued Docs\8.1 Reports\Monthly Summary Reports\60279731-SummaryRpt4_Jan13-R1.docx Revision 1 - 3 May 2013
Appendix C
Example Calibration Certificate

AECOM Macarthur Wind Farm Commissioning Noise Monitoring - Monthly Summary Report - January 2013
P:\60279731\8. Issued Docs\8.1 Reports\Monthly Summary Reports\60279731-SummaryRpt4_Jan13-R1.docx Revision 1 - 3 May 2013
C-1
Appendix C Example Calibration Certificate