very forward particle production at colliders lhcfand rhicfvery forward particle production at...
TRANSCRIPT
Veryforwardparticleproductionatcolliders
LHCf andRHICf
TakashiSAKO(ISEE/KMI,NagoyaUniversity)
fortheLHCf andRHICf collaborations
12016/5/20 QCDatCosmicEnergiesVII,Chalkida,Greece
Outline
• ForwarddetectorsandLHCf/RHICf• LHCf results(mainlyfrom7TeVp-pcollisions)
• 𝜋0
• Neutron• (preliminary)photonresultat13TeV
• OriginofLHCfmeasuredparticlesinmodels,andprospectforLHCf-ATLASjointanalysis• √sscaling• Single-spinasymmetryatRHIC• FutureO-OcollisionatLHC
2
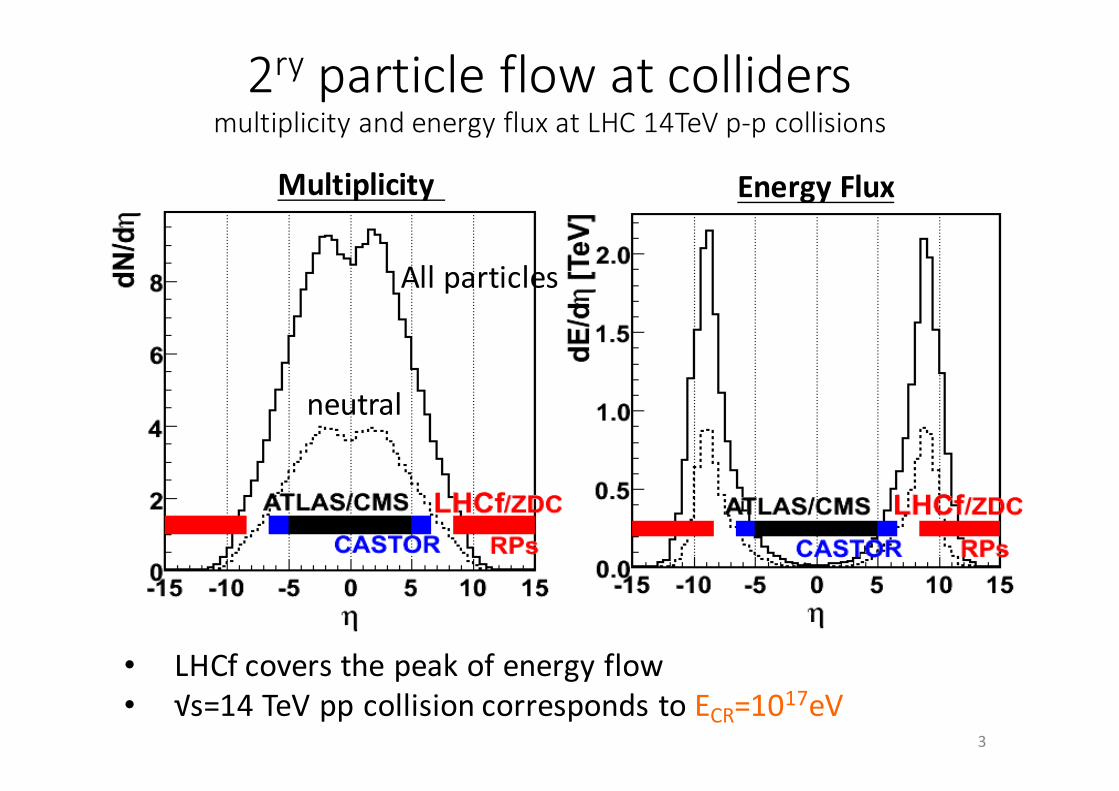
2ry particleflowatcollidersmultiplicityandenergy fluxatLHC14TeVp-pcollisions
EnergyFlux
Allparticles
neutral
• LHCf coversthepeakofenergyflow• √s=14TeV pp collisioncorrespondstoECR=1017eV
3
Multiplicity

Forwarddetectors@Colliders
ZDC/LHCf/RHICf
Neutralparticles
collision
RomanPot
Elasticscattering(blackdashed)
Dipole
Beampipe
ZDC/LHCf/RHICf
Beamparticle(blacksolid)
Centraldetector(ATLAS,CMS,ALICE,STAR,…)
Forwarddetector(CASTOR,TOTEMT1,T2)
RomanPot(TOTEMRP,pp2pp,UA7)
ZeroDegreeCalorimeter(ZDC@ATLAS/CMS/ALICE/STAR/
PHENIX,LHCf,RHICf)
• ZDCs(includingLHCf/RHICf) aresensitive toneutralparticlesincludingzerodegree 4
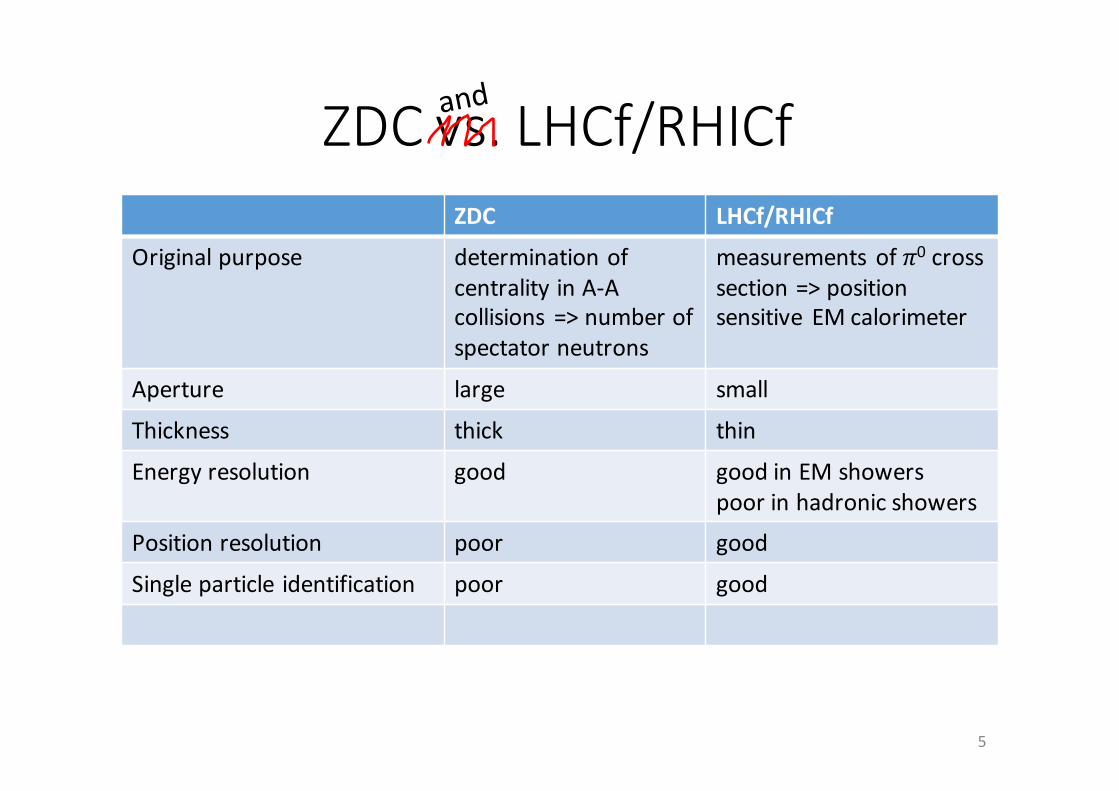
ZDCvs.LHCf/RHICfZDC LHCf/RHICf
Originalpurpose determination ofcentralityinA-Acollisions =>numberofspectatorneutrons
measurements of𝜋0 crosssection=>positionsensitive EMcalorimeter
Aperture large small
Thickness thick thin
Energyresolution good goodinEMshowerspoorinhadronicshowers
Positionresolution poor good
Singleparticle identification poor good
5
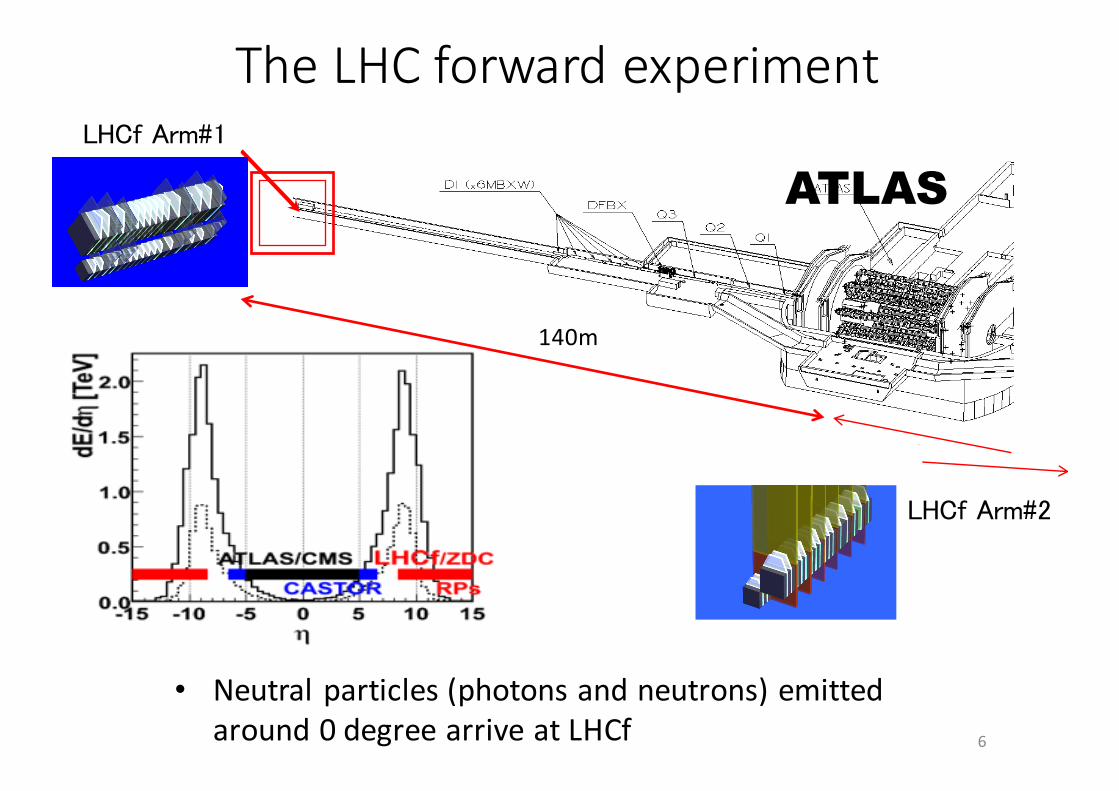
ATLAS
TheLHCforwardexperiment
6
LHCf Arm#1
LHCf Arm#2
140m
• Neutralparticles(photonsandneutrons)emittedaround0degreearriveatLHCf
longitudinal[cm]-2000 -1500 -1000 -500 0 500 1000 1500 2000
trans
verse
[cm]
-25-20-15-10-505
10152025
IPprotonnitrogen
DX magnetDX magnet
BBC
LHCf
18m(140matLHC)
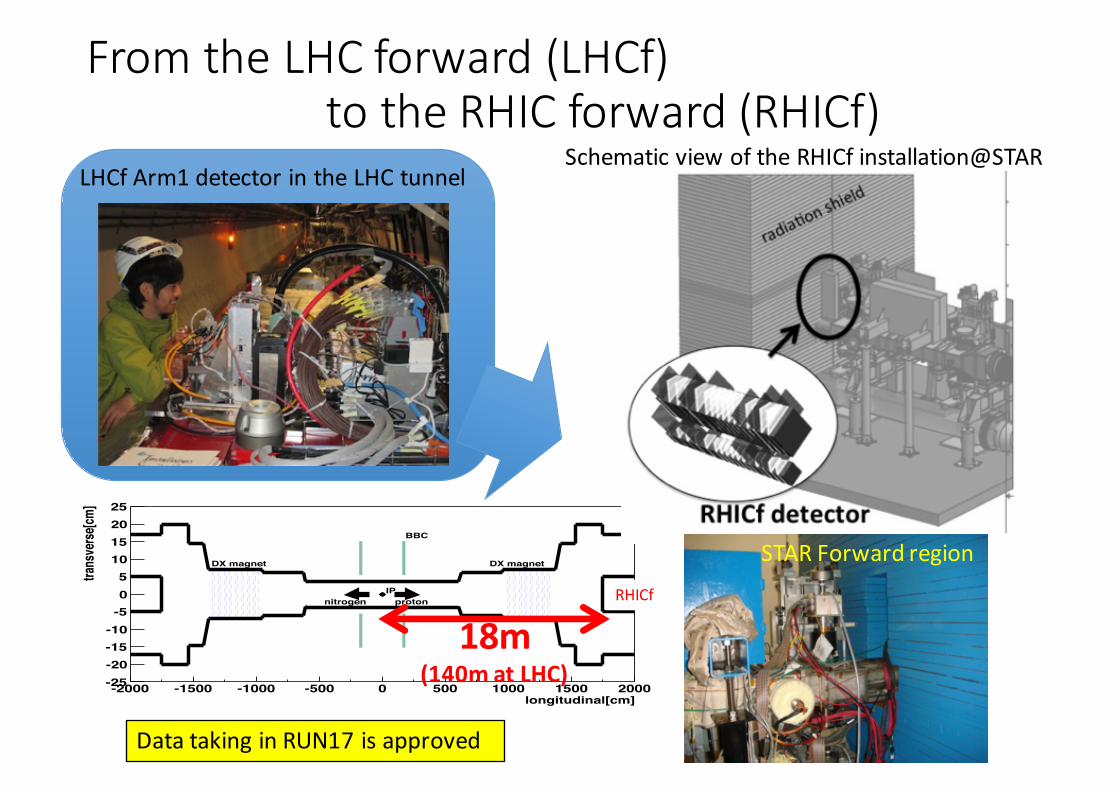
RHICf
FromtheLHCforward(LHCf)totheRHICforward(RHICf)
7
LHCf Arm1detectorintheLHCtunnel
photoatPHENIX
SchematicviewoftheRHICf installation@STAR
STARForwardregion
DatatakinginRUN17isapproved
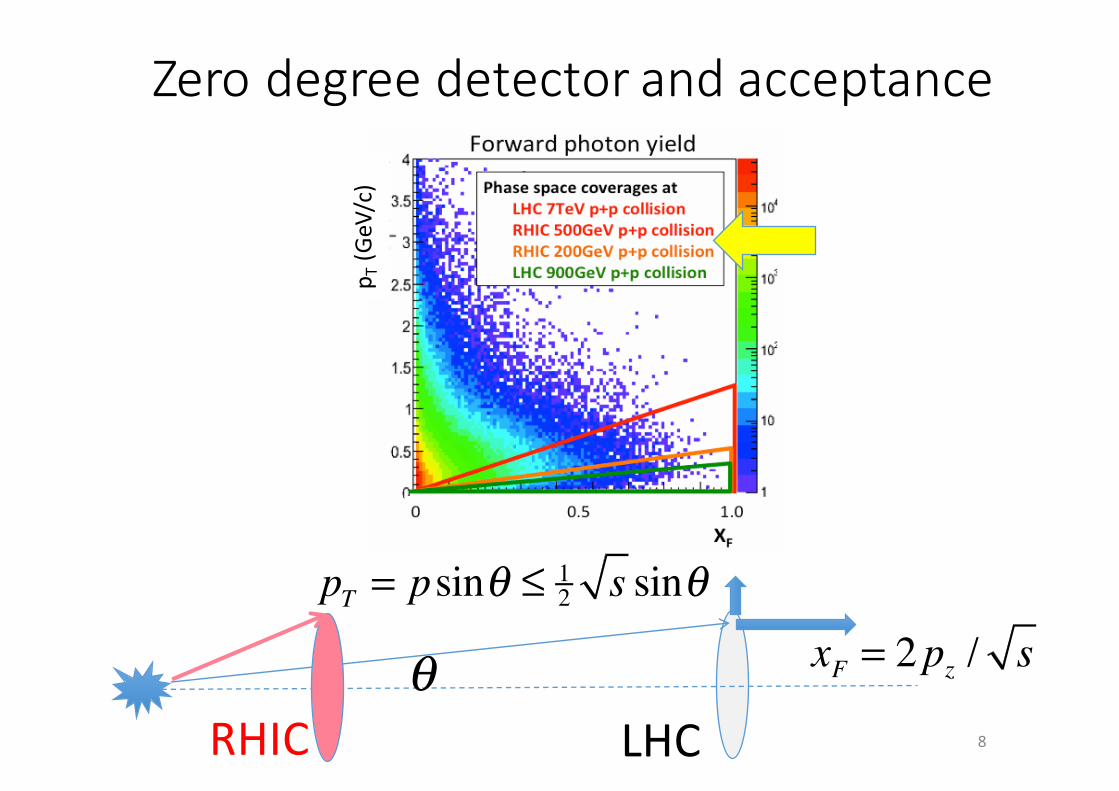
θ xF = 2pz / s
pT = psinθ ≤ 12 s sinθ
Zerodegreedetectorandacceptance
p T(GeV/c)
LHCRHIC 8
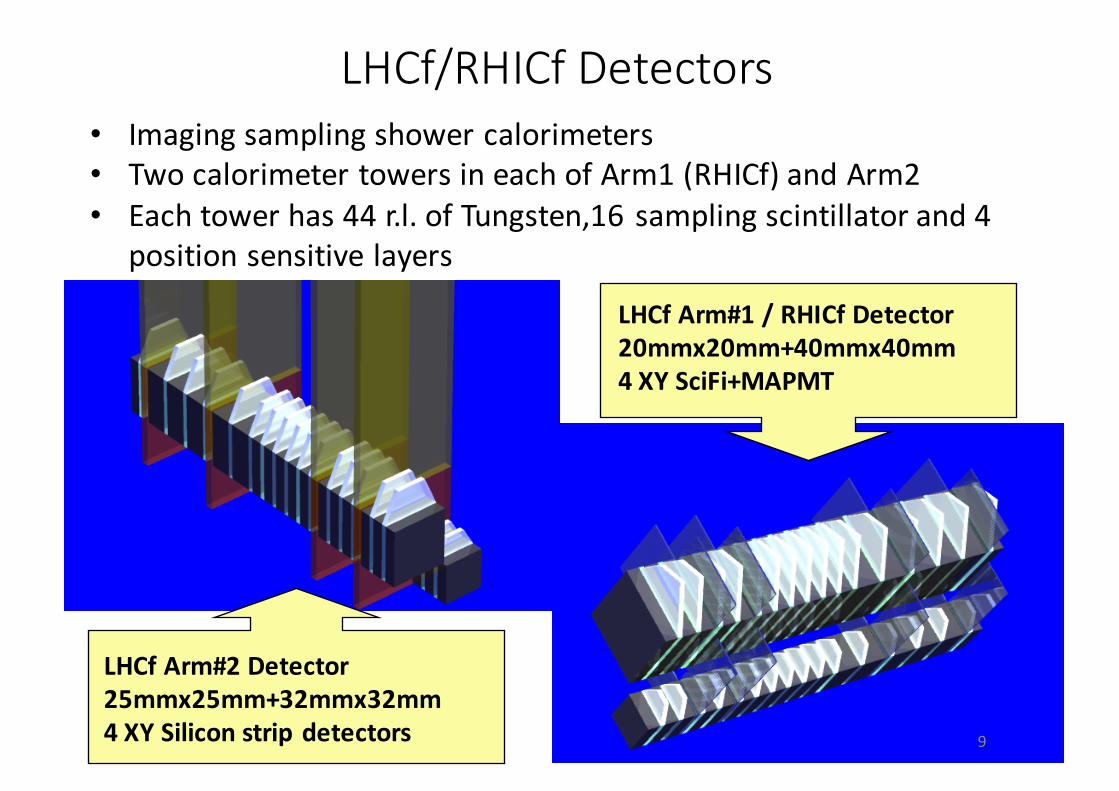
LHCf/RHICf Detectors
LHCf Arm#1/RHICf Detector20mmx20mm+40mmx40mm4XYSciFi+MAPMT
LHCf Arm#2Detector25mmx25mm+32mmx32mm4XYSiliconstripdetectors
• Imagingsamplingshowercalorimeters• TwocalorimetertowersineachofArm1(RHICf)andArm2• Eachtowerhas44r.l.ofTungsten,16samplingscintillatorand4
positionsensitivelayers
9
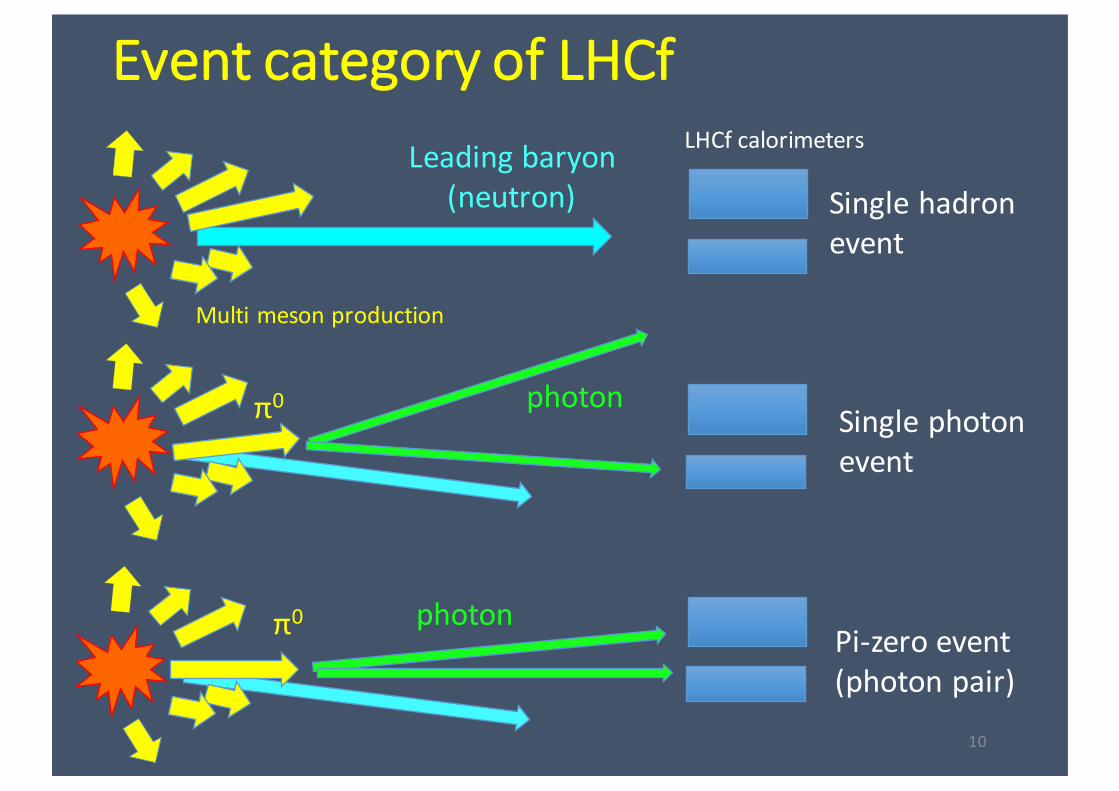
EventcategoryofLHCf
10
π0 photonPi-zeroevent(photonpair)
Singlephotonevent
Leadingbaryon(neutron)
Multimesonproduction
Singlehadronevent
LHCf calorimeters
π0 photon

Detectorperformance
11
Arm2
ΔE/E<5%
ΔE/E≈40%
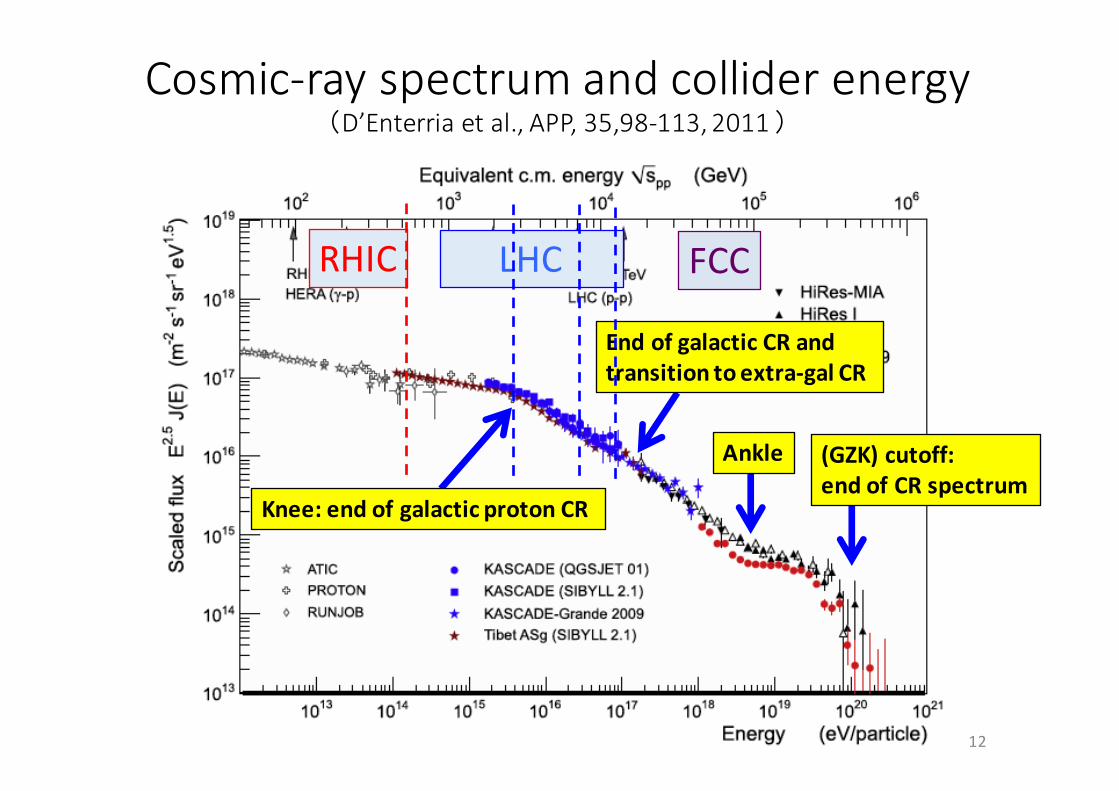
Cosmic-rayspectrumandcolliderenergy(D’Enterria etal.,APP,35,98-113,2011)
12
FCC
Knee:endofgalacticprotonCR
EndofgalacticCRandtransitiontoextra-galCR
Ankle (GZK)cutoff:endofCRspectrum
LHCRHIC

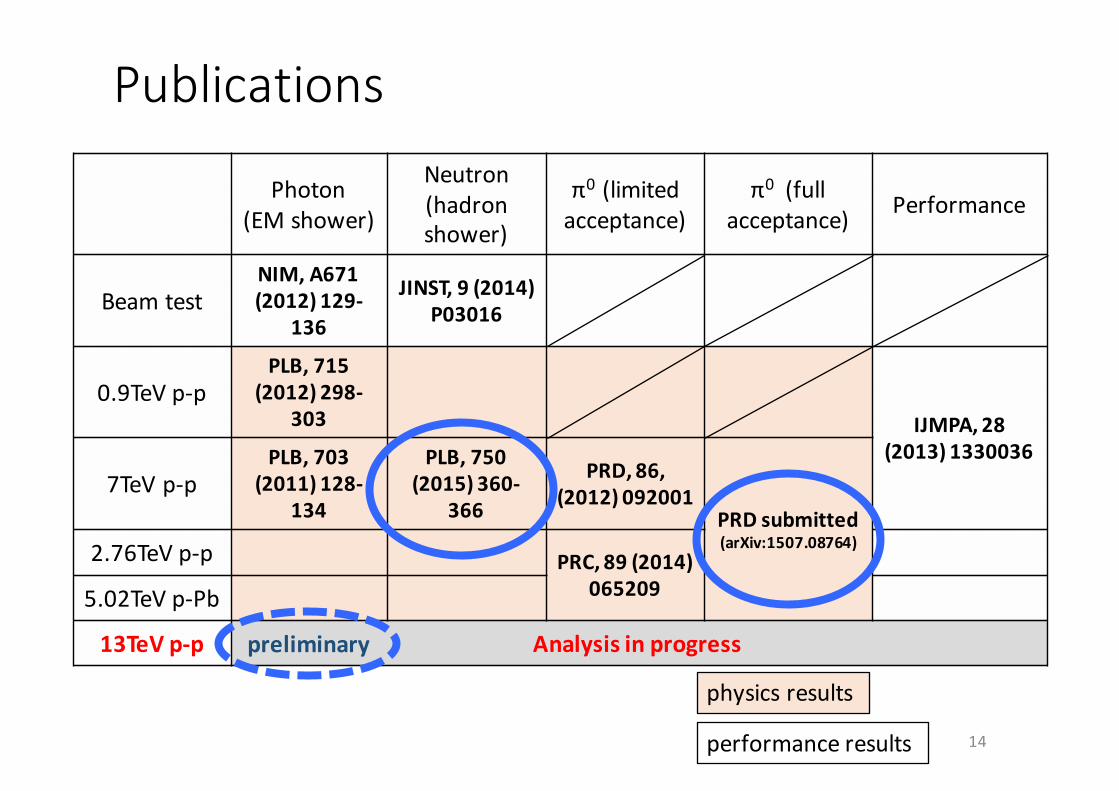
Publications
Photon(EMshower)
Neutron(hadronshower)
π0(limitedacceptance)
π0(fullacceptance) Performance
BeamtestNIM, A671(2012)129-
136
JINST,9(2014)P03016
0.9TeV p-pPLB,715
(2012)298-303 IJMPA,28
(2013)13300367TeVp-p
PLB,703(2011)128-
134
PLB,750(2015)360-
366
PRD,86,(2012)092001
PRD submitted(arXiv:1507.08764)2.76TeVp-p PRC, 89(2014)
0652095.02TeVp-Pb
13TeVp-p Analysisinprogress
13
physicsresults
performanceresults
Publications
Photon(EMshower)
Neutron(hadronshower)
π0(limitedacceptance)
π0(fullacceptance) Performance
BeamtestNIM, A671(2012)129-
136
JINST,9(2014)P03016
0.9TeV p-pPLB,715
(2012)298-303 IJMPA,28
(2013)13300367TeVp-p
PLB,703(2011)128-
134
PLB,750(2015)360-
366
PRD,86,(2012)092001
PRD submitted(arXiv:1507.08764)2.76TeVp-p PRC, 89(2014)
0652095.02TeVp-Pb
13TeVp-p Analysisinprogress
14
physicsresults
performanceresults
preliminary
11
[GeV]zp1000 2000 3000
]-2
[GeV
3/d
pσ3
Ed
inel
σ1/ 5−10
4−10
3−10
2−10
1−10
1 [GeV] < 0.8
T(d) 0.6 < p [GeV]zp
]-2
[GeV
3/d
pσ3
Ed
inel
σ1/ 5−10
4−10
3−10
2−10
1−10
1 [GeV] < 0.2
T(a) 0.0 < p
=7TeVsLHCf -1 Ldt=2.64+2.85nb∫
[GeV]zp1000 2000 3000
]-2
[GeV
3/d
pσ3
Ed
inel
σ1/
[GeV] < 1.0T
(e) 0.8 < p [GeV]zp]
-2 [G
eV3
/dp
σ3 E
din
elσ
1/
[GeV] < 0.4T
(b) 0.2 < p
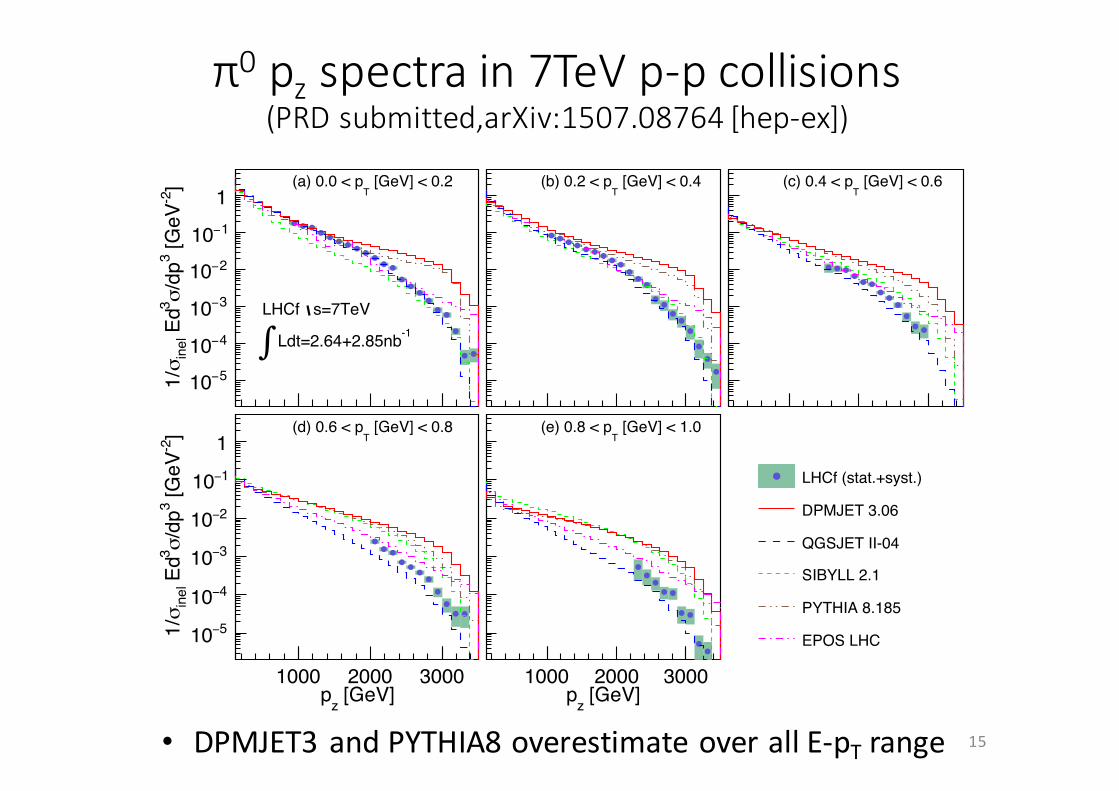
LHCf (stat.+syst.)
DPMJET 3.06
QGSJET II-04
SIBYLL 2.1
PYTHIA 8.185
EPOS LHC
[GeV]zp
]-2
[GeV
3/d
pσ3
Ed
inel
σ1/
[GeV] < 0.6T
(c) 0.4 < p
FIG. 5: (color online). Experimental combined pz spectra of the LHCf detector (filled circles) in p+p collisions atps = 7TeV.
Shaded rectangles indicate the total statistical and systematic uncertainties. The predictions of hadronic interaction modelsare shown for comparison (see text for details.)
[GeV]T
p0 0.1 0.2 0.3 0.4
]-2
[GeV
3/d
pσ3
Ed
inel
σ1/ 5−10
4−10
3−10
2−10
1−10
1 (e) 9.6 < y < 9.8 [GeV]T
p
]-2
[GeV
3/d
pσ3
Ed
inel
σ1/ 5−10
4−10
3−10
2−10
1−10
1 (a) 8.8 < y < 9.0
=2.76TeVsLHCf -1 Ldt=2.36nb∫
LHCf (stat.+syst.)
DPMJET 3.06
QGSJET II-04
SIBYLL 2.1
PYTHIA 8.185
EPOS LHC
[GeV]T
p
]-2
[GeV
3/d
pσ3
Ed
inel
σ1/
(b) 9.0 < y < 9.2
[GeV]T
p
]-2
[GeV
3/d
pσ3
Ed
inel
σ1/
(c) 9.2 < y < 9.4
[GeV]T
p
]-2
[GeV
3/d
pσ3
Ed
inel
σ1/
(d) 9.4 < y < 9.6
FIG. 6: (color online). Experimental pT spectra of the LHCf detector (filled circles) in p + p collisions atps = 2.76TeV.
Shaded rectangles indicate the total statistical and systematic uncertainties. The predictions from hadronic interaction modelsare shown for comparison (see text for details.)
π0 pz spectrain7TeVp-pcollisions(PRDsubmitted,arXiv:1507.08764[hep-ex])
15• DPMJET3andPYTHIA8overestimateoverallE-pT range
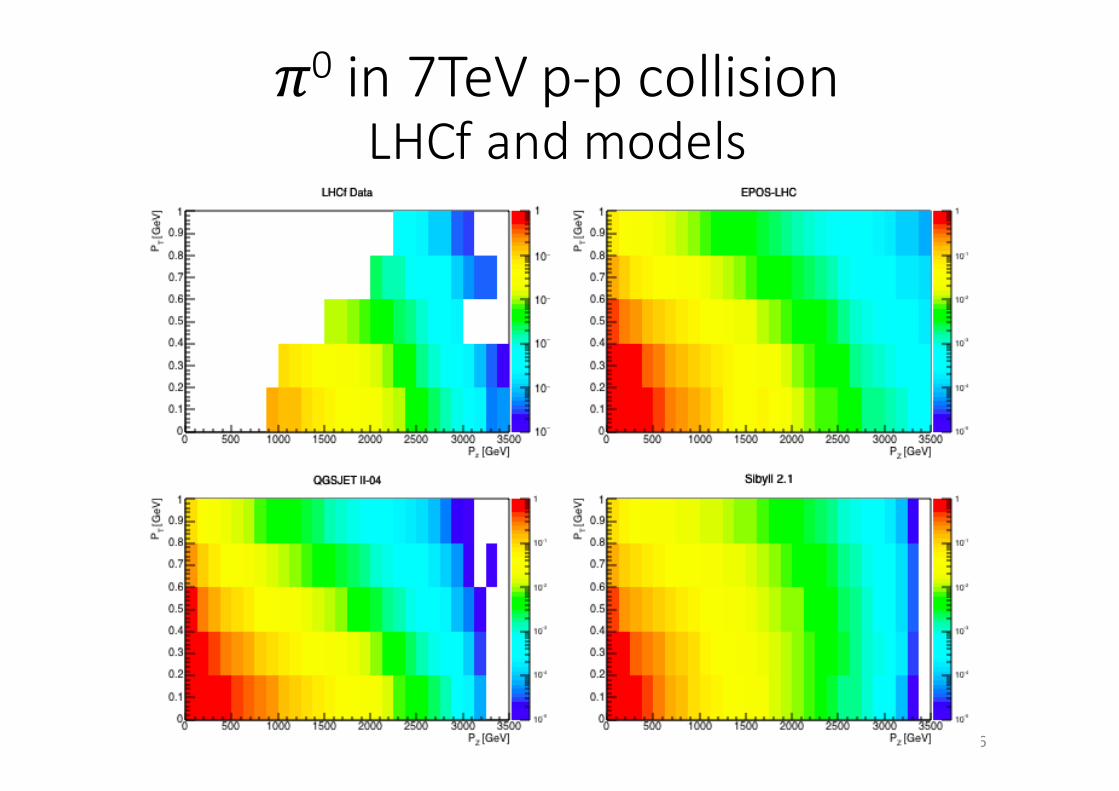
𝜋0 in7TeVp-pcollisionLHCf andmodels
16
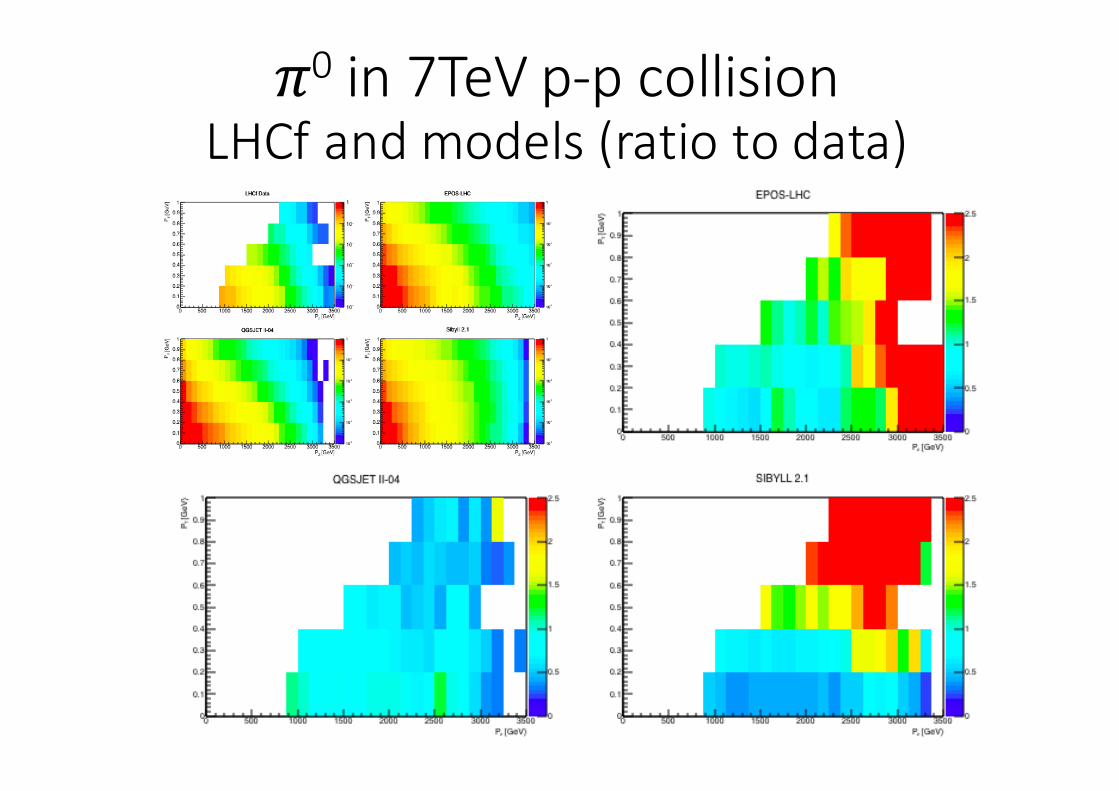
𝜋0 in7TeVp-pcollisionLHCf andmodels(ratiotodata)
17
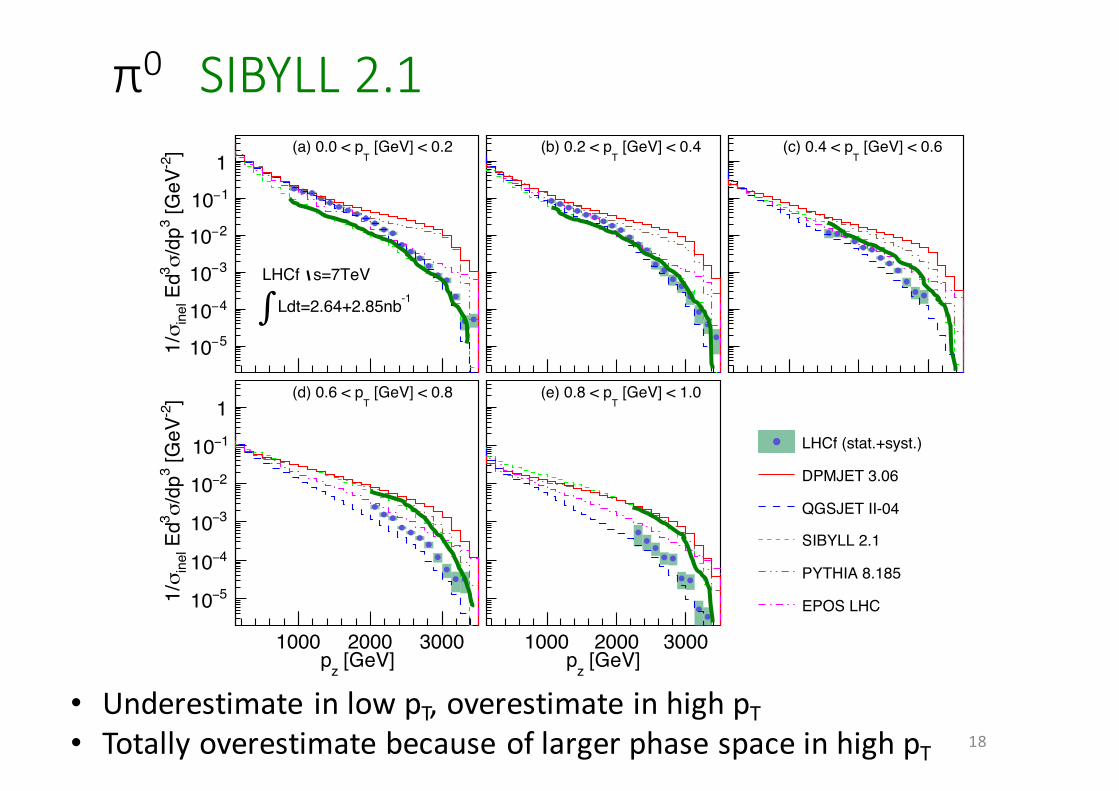
π0 SIBYLL2.1
18
11
[GeV]zp1000 2000 3000
]-2
[GeV
3/d
pσ3
Ed
inel
σ1/ 5−10
4−10
3−10
2−10
1−10
1 [GeV] < 0.8
T(d) 0.6 < p [GeV]zp
]-2
[GeV
3/d
pσ3
Ed
inel
σ1/ 5−10
4−10
3−10
2−10
1−10
1 [GeV] < 0.2
T(a) 0.0 < p
=7TeVsLHCf -1 Ldt=2.64+2.85nb∫
[GeV]zp1000 2000 3000
]-2
[GeV
3/d
pσ3
Ed
inel
σ1/
[GeV] < 1.0T
(e) 0.8 < p [GeV]zp
]-2
[GeV
3/d
pσ3
Ed
inel
σ1/
[GeV] < 0.4T
(b) 0.2 < p
LHCf (stat.+syst.)
DPMJET 3.06
QGSJET II-04
SIBYLL 2.1
PYTHIA 8.185
EPOS LHC
[GeV]zp
]-2
[GeV
3/d
pσ3
Ed
inel
σ1/
[GeV] < 0.6T
(c) 0.4 < p
FIG. 5: (color online). Experimental combined pz spectra of the LHCf detector (filled circles) in p+p collisions atps = 7TeV.
Shaded rectangles indicate the total statistical and systematic uncertainties. The predictions of hadronic interaction modelsare shown for comparison (see text for details.)
[GeV]T
p0 0.1 0.2 0.3 0.4
]-2
[GeV
3/d
pσ3
Ed
inel
σ1/ 5−10
4−10
3−10
2−10
1−10
1 (e) 9.6 < y < 9.8 [GeV]T
p
]-2
[GeV
3/d
pσ3
Ed
inel
σ1/ 5−10
4−10
3−10
2−10
1−10
1 (a) 8.8 < y < 9.0
=2.76TeVsLHCf -1 Ldt=2.36nb∫
LHCf (stat.+syst.)
DPMJET 3.06
QGSJET II-04
SIBYLL 2.1
PYTHIA 8.185
EPOS LHC
[GeV]T
p
]-2
[GeV
3/d
pσ3
Ed
inel
σ1/
(b) 9.0 < y < 9.2
[GeV]T
p
]-2
[GeV
3/d
pσ3
Ed
inel
σ1/
(c) 9.2 < y < 9.4
[GeV]T
p
]-2
[GeV
3/d
pσ3
Ed
inel
σ1/
(d) 9.4 < y < 9.6
FIG. 6: (color online). Experimental pT spectra of the LHCf detector (filled circles) in p + p collisions atps = 2.76TeV.
Shaded rectangles indicate the total statistical and systematic uncertainties. The predictions from hadronic interaction modelsare shown for comparison (see text for details.)
• Underestimate inlowpT,overestimateinhighpT• TotallyoverestimatebecauseoflargerphasespaceinhighpT
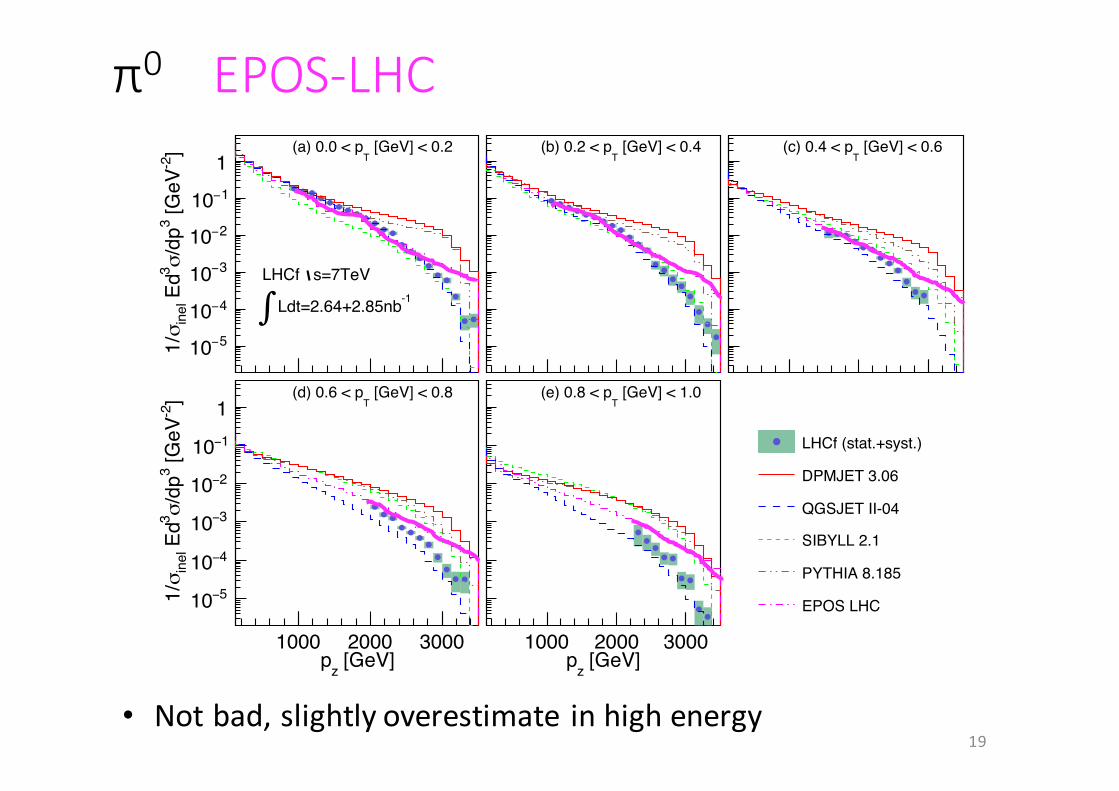
π0 EPOS-LHC
19
11
[GeV]zp1000 2000 3000
]-2
[GeV
3/d
pσ3
Ed
inel
σ1/ 5−10
4−10
3−10
2−10
1−10
1 [GeV] < 0.8
T(d) 0.6 < p [GeV]zp
]-2
[GeV
3/d
pσ3
Ed
inel
σ1/ 5−10
4−10
3−10
2−10
1−10
1 [GeV] < 0.2
T(a) 0.0 < p
=7TeVsLHCf -1 Ldt=2.64+2.85nb∫
[GeV]zp1000 2000 3000
]-2
[GeV
3/d
pσ3
Ed
inel
σ1/
[GeV] < 1.0T
(e) 0.8 < p [GeV]zp
]-2
[GeV
3/d
pσ3
Ed
inel
σ1/
[GeV] < 0.4T
(b) 0.2 < p
LHCf (stat.+syst.)
DPMJET 3.06
QGSJET II-04
SIBYLL 2.1
PYTHIA 8.185
EPOS LHC
[GeV]zp
]-2
[GeV
3/d
pσ3
Ed
inel
σ1/
[GeV] < 0.6T
(c) 0.4 < p
FIG. 5: (color online). Experimental combined pz spectra of the LHCf detector (filled circles) in p+p collisions atps = 7TeV.
Shaded rectangles indicate the total statistical and systematic uncertainties. The predictions of hadronic interaction modelsare shown for comparison (see text for details.)
[GeV]T
p0 0.1 0.2 0.3 0.4
]-2
[GeV
3/d
pσ3
Ed
inel
σ1/ 5−10
4−10
3−10
2−10
1−10
1 (e) 9.6 < y < 9.8 [GeV]T
p
]-2
[GeV
3/d
pσ3
Ed
inel
σ1/ 5−10
4−10
3−10
2−10
1−10
1 (a) 8.8 < y < 9.0
=2.76TeVsLHCf -1 Ldt=2.36nb∫
LHCf (stat.+syst.)
DPMJET 3.06
QGSJET II-04
SIBYLL 2.1
PYTHIA 8.185
EPOS LHC
[GeV]T
p
]-2
[GeV
3/d
pσ3
Ed
inel
σ1/
(b) 9.0 < y < 9.2
[GeV]T
p
]-2
[GeV
3/d
pσ3
Ed
inel
σ1/
(c) 9.2 < y < 9.4
[GeV]T
p
]-2
[GeV
3/d
pσ3
Ed
inel
σ1/
(d) 9.4 < y < 9.6
FIG. 6: (color online). Experimental pT spectra of the LHCf detector (filled circles) in p + p collisions atps = 2.76TeV.
Shaded rectangles indicate the total statistical and systematic uncertainties. The predictions from hadronic interaction modelsare shown for comparison (see text for details.)
• Notbad,slightlyoverestimate inhighenergy
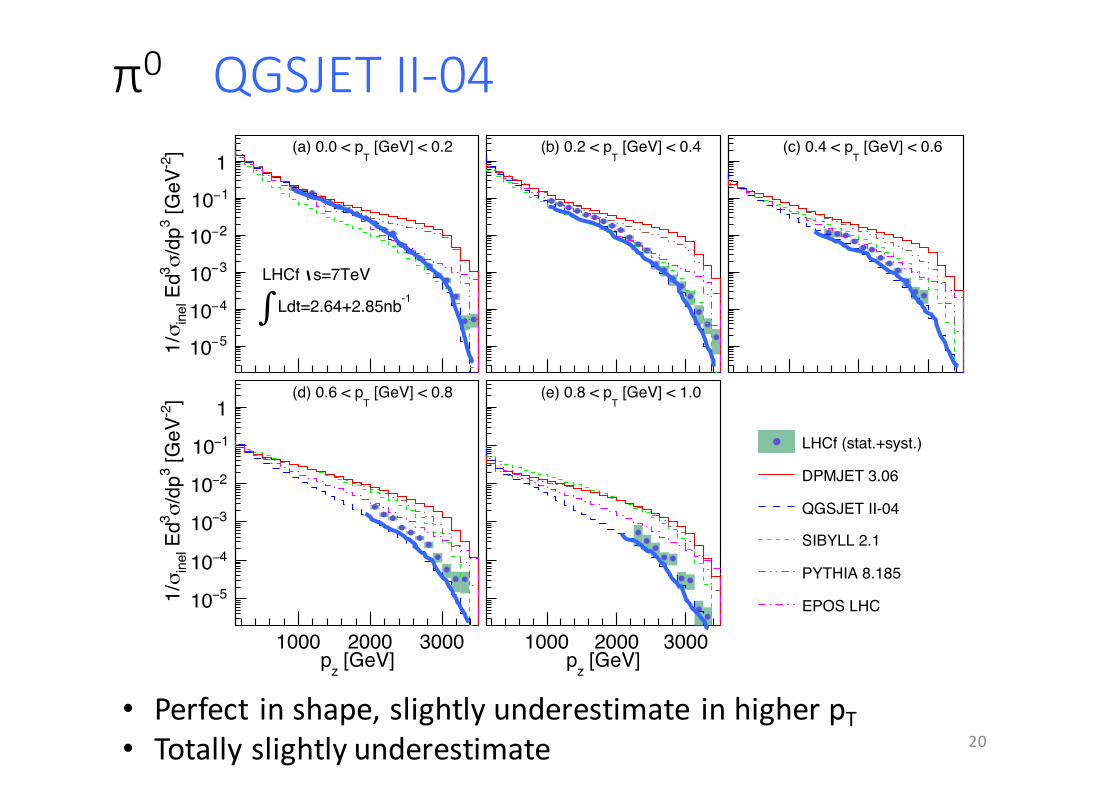
π0 QGSJETII-04
20• Perfect inshape,slightlyunderestimate inhigherpT• Totallyslightlyunderestimate
11
[GeV]zp1000 2000 3000
]-2
[GeV
3/d
pσ3
Ed
inel
σ1/ 5−10
4−10
3−10
2−10
1−10
1 [GeV] < 0.8
T(d) 0.6 < p [GeV]zp
]-2
[GeV
3/d
pσ3
Ed
inel
σ1/ 5−10
4−10
3−10
2−10
1−10
1 [GeV] < 0.2
T(a) 0.0 < p
=7TeVsLHCf -1 Ldt=2.64+2.85nb∫
[GeV]zp1000 2000 3000
]-2
[GeV
3/d
pσ3
Ed
inel
σ1/
[GeV] < 1.0T
(e) 0.8 < p [GeV]zp
]-2
[GeV
3/d
pσ3
Ed
inel
σ1/
[GeV] < 0.4T
(b) 0.2 < p
LHCf (stat.+syst.)
DPMJET 3.06
QGSJET II-04
SIBYLL 2.1
PYTHIA 8.185
EPOS LHC
[GeV]zp
]-2
[GeV
3/d
pσ3
Ed
inel
σ1/
[GeV] < 0.6T
(c) 0.4 < p
FIG. 5: (color online). Experimental combined pz spectra of the LHCf detector (filled circles) in p+p collisions atps = 7TeV.
Shaded rectangles indicate the total statistical and systematic uncertainties. The predictions of hadronic interaction modelsare shown for comparison (see text for details.)
[GeV]T
p0 0.1 0.2 0.3 0.4
]-2
[GeV
3/d
pσ3
Ed
inel
σ1/ 5−10
4−10
3−10
2−10
1−10
1 (e) 9.6 < y < 9.8 [GeV]T
p
]-2
[GeV
3/d
pσ3
Ed
inel
σ1/ 5−10
4−10
3−10
2−10
1−10
1 (a) 8.8 < y < 9.0
=2.76TeVsLHCf -1 Ldt=2.36nb∫
LHCf (stat.+syst.)
DPMJET 3.06
QGSJET II-04
SIBYLL 2.1
PYTHIA 8.185
EPOS LHC
[GeV]T
p
]-2
[GeV
3/d
pσ3
Ed
inel
σ1/
(b) 9.0 < y < 9.2
[GeV]T
p
]-2
[GeV
3/d
pσ3
Ed
inel
σ1/
(c) 9.2 < y < 9.4
[GeV]T
p
]-2
[GeV
3/d
pσ3
Ed
inel
σ1/
(d) 9.4 < y < 9.6
FIG. 6: (color online). Experimental pT spectra of the LHCf detector (filled circles) in p + p collisions atps = 2.76TeV.
Shaded rectangles indicate the total statistical and systematic uncertainties. The predictions from hadronic interaction modelsare shown for comparison (see text for details.)
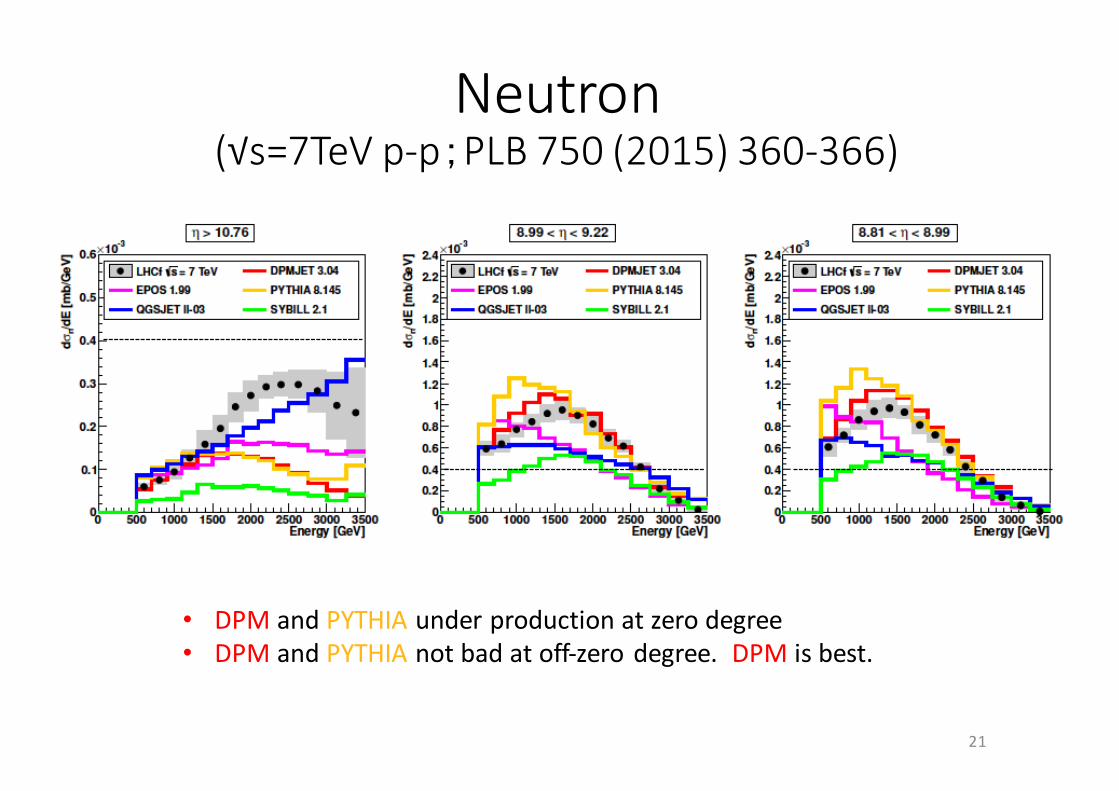
Neutron(√s=7TeVp-p;PLB750(2015)360-366)
21
• DPMand PYTHIA underproductionatzerodegree• DPM andPYTHIA notbadatoff-zerodegree.DPM isbest.
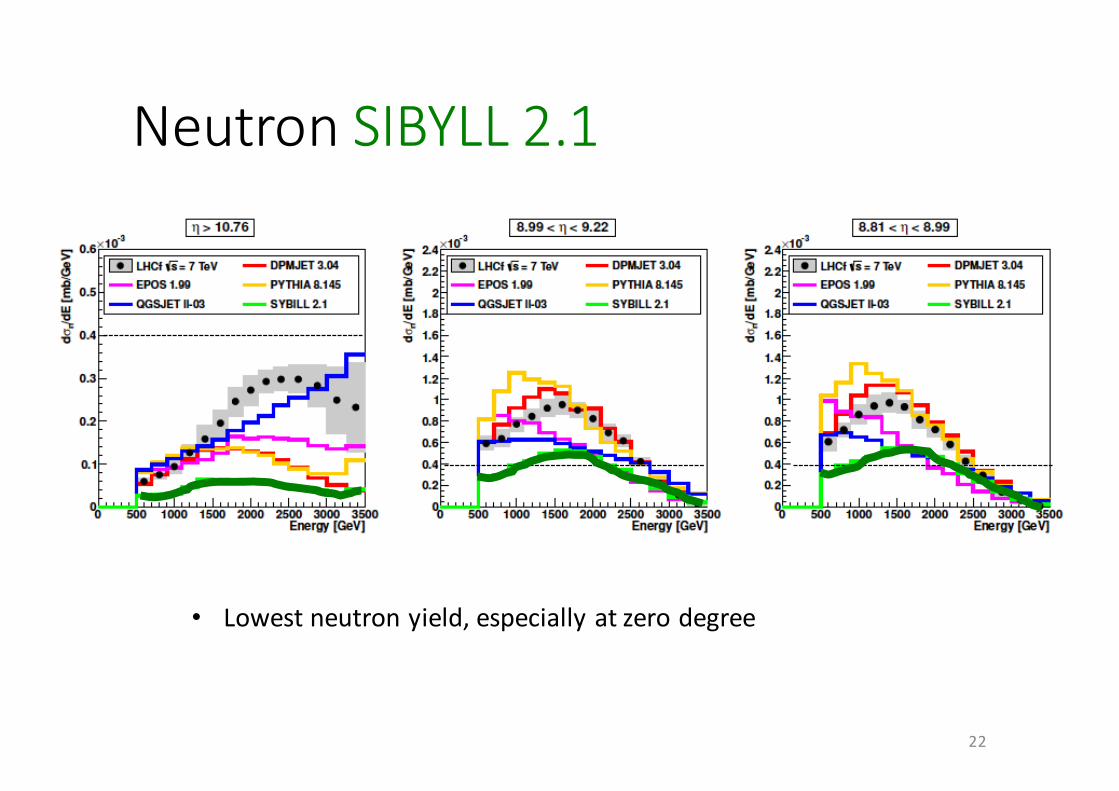
NeutronSIBYLL2.1
22
• Lowestneutronyield,especiallyatzerodegree
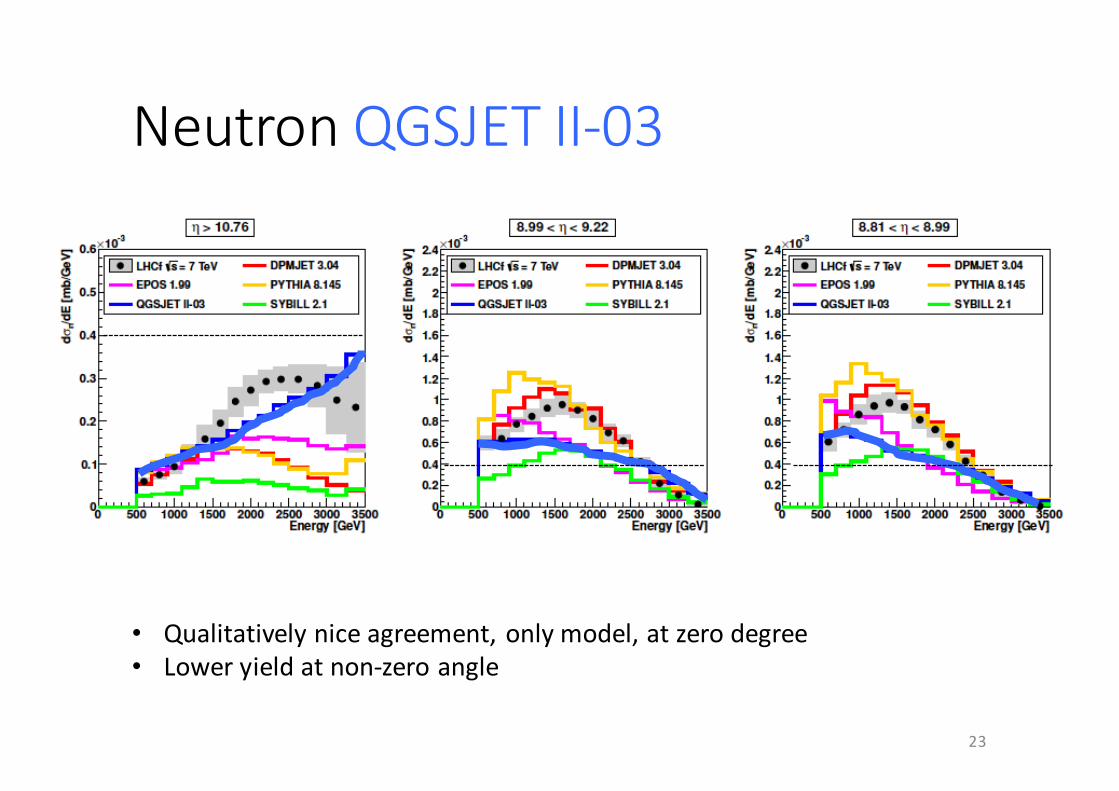
NeutronQGSJETII-03
23
• Qualitativelyniceagreement,onlymodel,atzerodegree• Loweryieldatnon-zeroangle
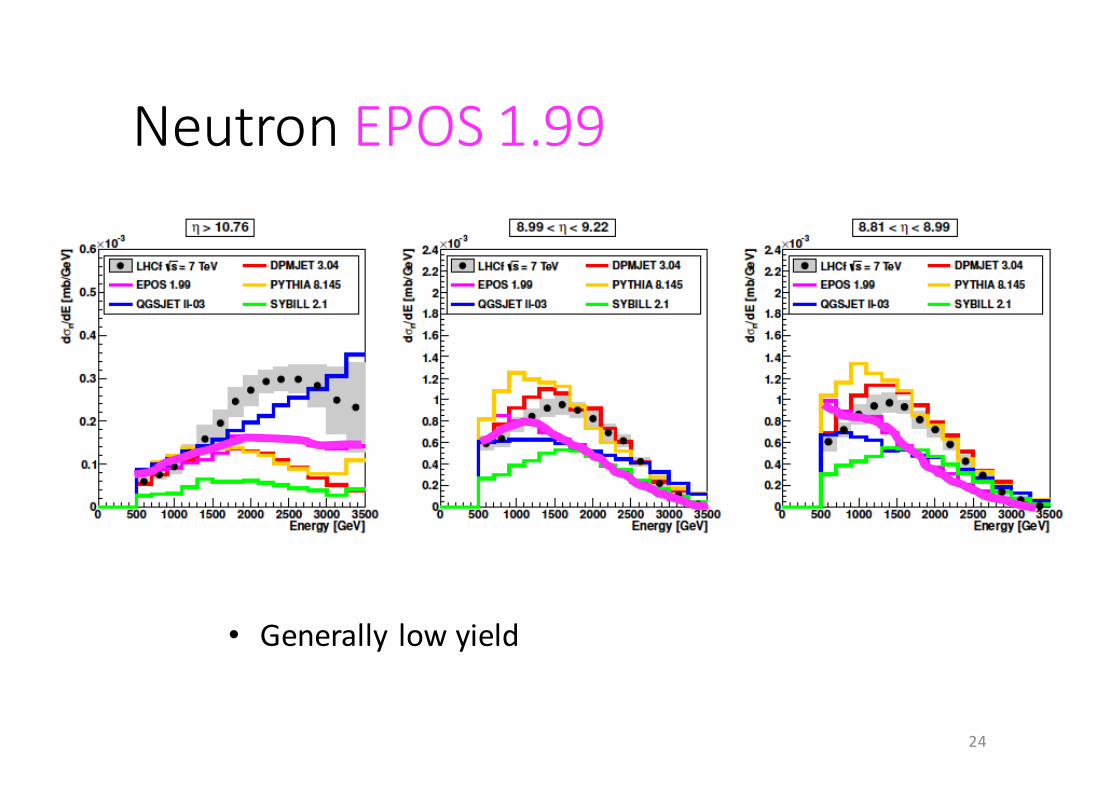
NeutronEPOS1.99
24
• Generally lowyield
tobecoveredin13TeV
LHCfDPM3QGSII-04EPOS-LHC
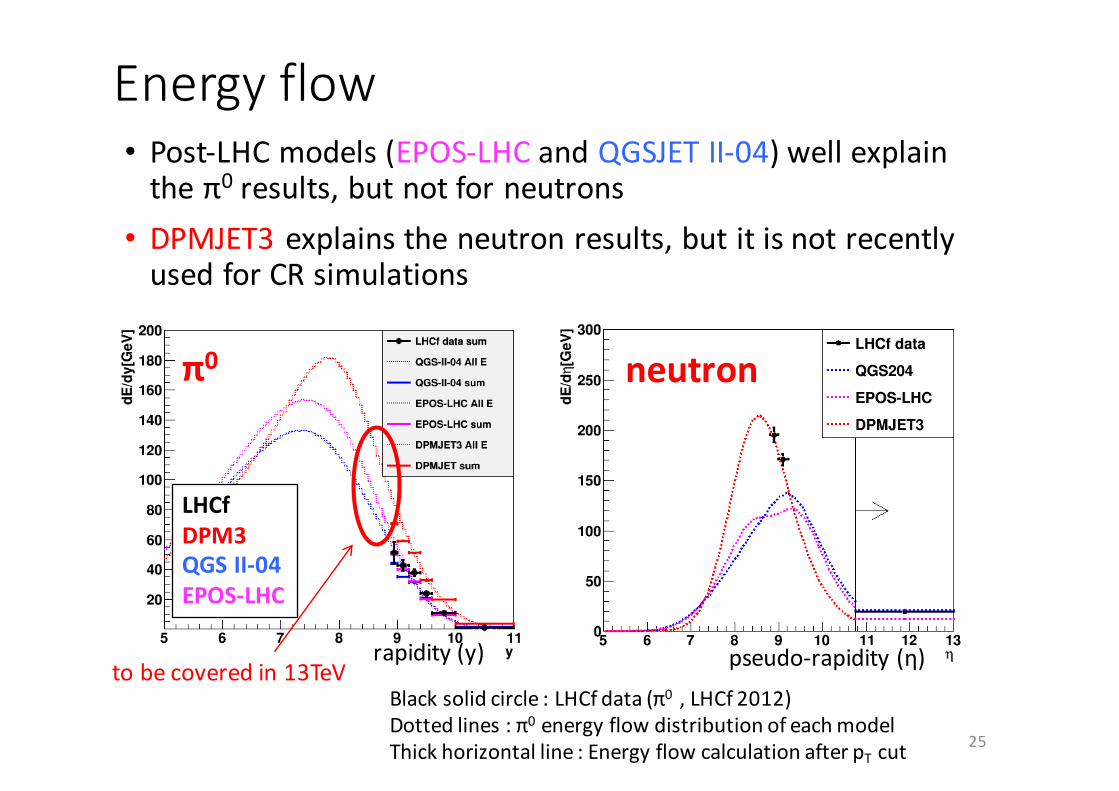
Energyflow
25
• Post-LHCmodels(EPOS-LHCandQGSJETII-04)wellexplaintheπ0 results,butnotforneutrons
• DPMJET3 explainstheneutronresults,butitisnotrecentlyusedforCRsimulations
Blacksolidcircle:LHCf data(π0 ,LHCf 2012)Dottedlines:π0 energyflowdistributionofeachmodelThickhorizontalline:EnergyflowcalculationafterpT cut
π0 neutron
rapidity(y) pseudo-rapidity(η)
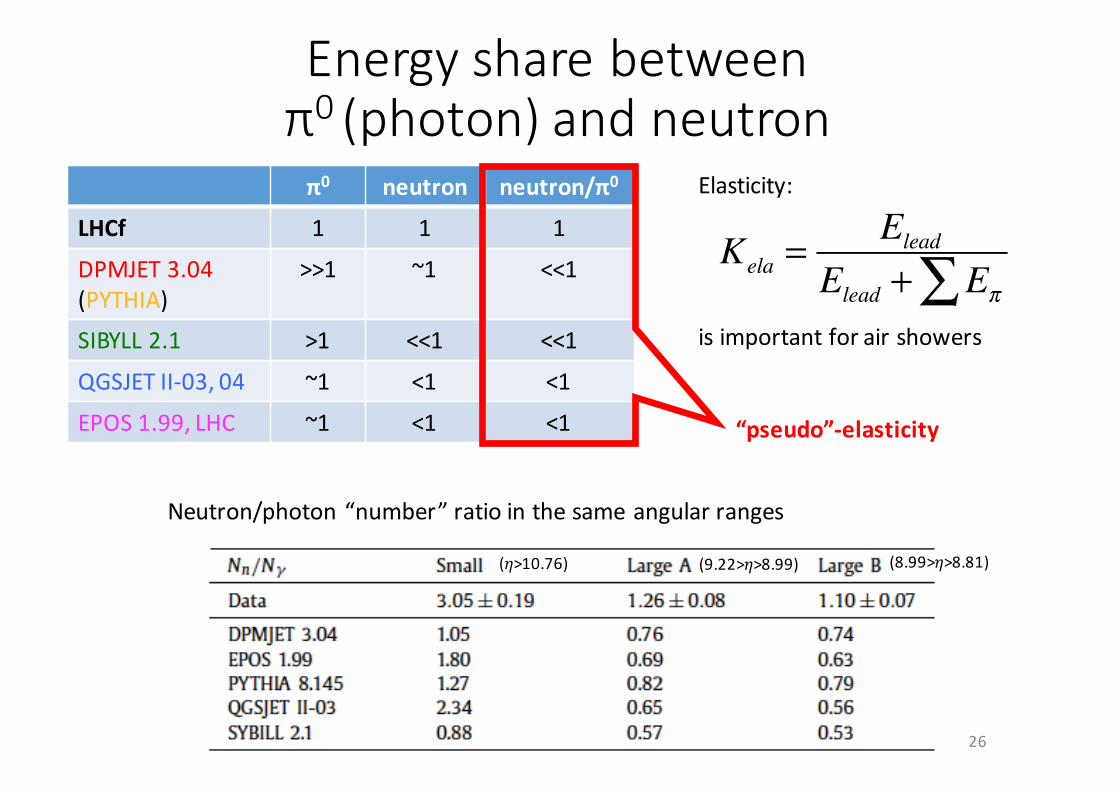
Energysharebetweenπ0(photon) andneutronπ0 neutron neutron/π0
LHCf 1 1 1
DPMJET3.04(PYTHIA)
>>1 ~1 <<1
SIBYLL2.1 >1 <<1 <<1
QGSJETII-03, 04 ~1 <1 <1
EPOS1.99,LHC ~1 <1 <1
26
Kela =Elead
Elead + Eπ∑
Elasticity:
isimportantforairshowers
“pseudo”-elasticity
Neutron/photon“number”ratiointhesameangularranges
(𝜂>10.76) (9.22>𝜂>8.99) (8.99>𝜂>8.81)
Energy [GeV]1000 2000 3000 4000 5000 6000
]-1
dN/
dE [G
eVin
e1/
N
10−10
9−10
8−10
7−10
6−10
5−10=13TeV photonsLHCf
°=180φ∆ > 10.94, η-1Ldt=0.191+0.191nb∫
DataQGSJET II-04EPOS-LHCDPMJET 3.06SIBYLL 2.1PYTHIA 8.212
Preliminary
Energy [GeV]1000 2000 3000 4000 5000 6000
MC/
Data
0
1
2
3
4Energy [GeV]
1000 2000 3000 4000 5000 6000]
-1 d
N/dE
[GeV
ine
1/N
10−10
9−10
8−10
7−10
6−10
5−10=13TeV photonsLHCf
°=20φ∆<8.99, η8.81<-1Ldt=0.191+0.191nb∫
Preliminary
Energy [GeV]1000 2000 3000 4000 5000 6000
MC/
Data
0
1
2
3
4
27
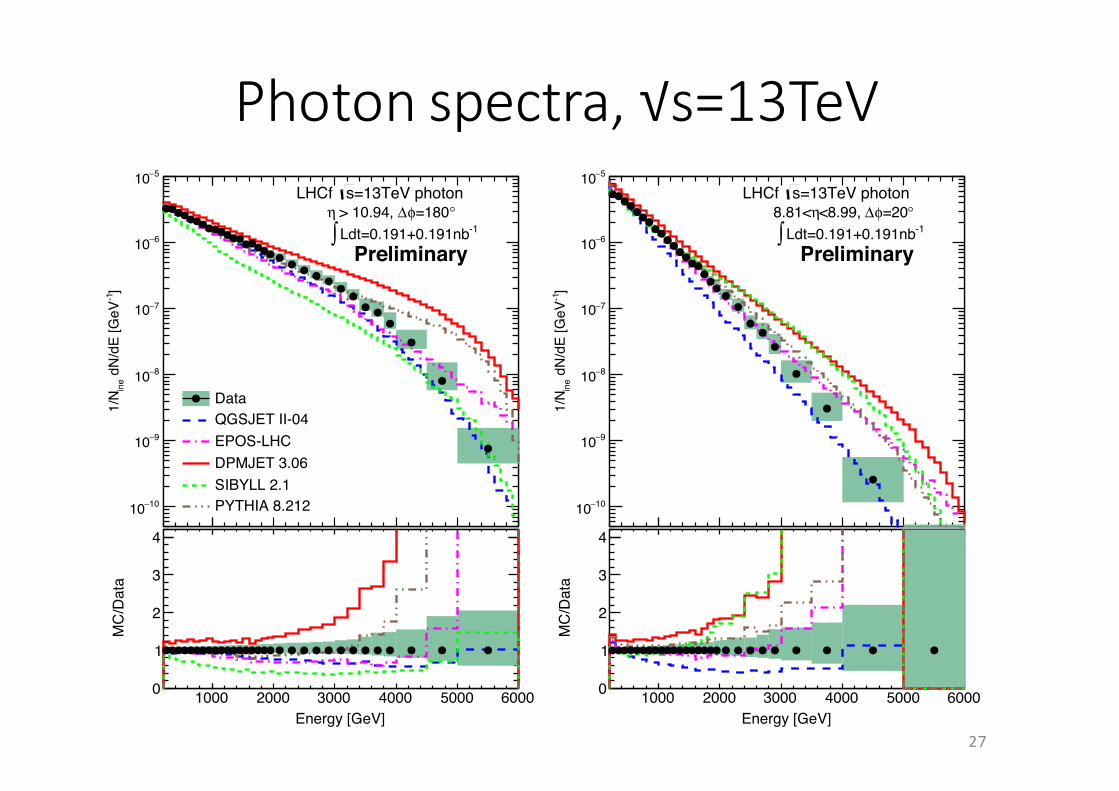
Photonspectra,√s=13TeV
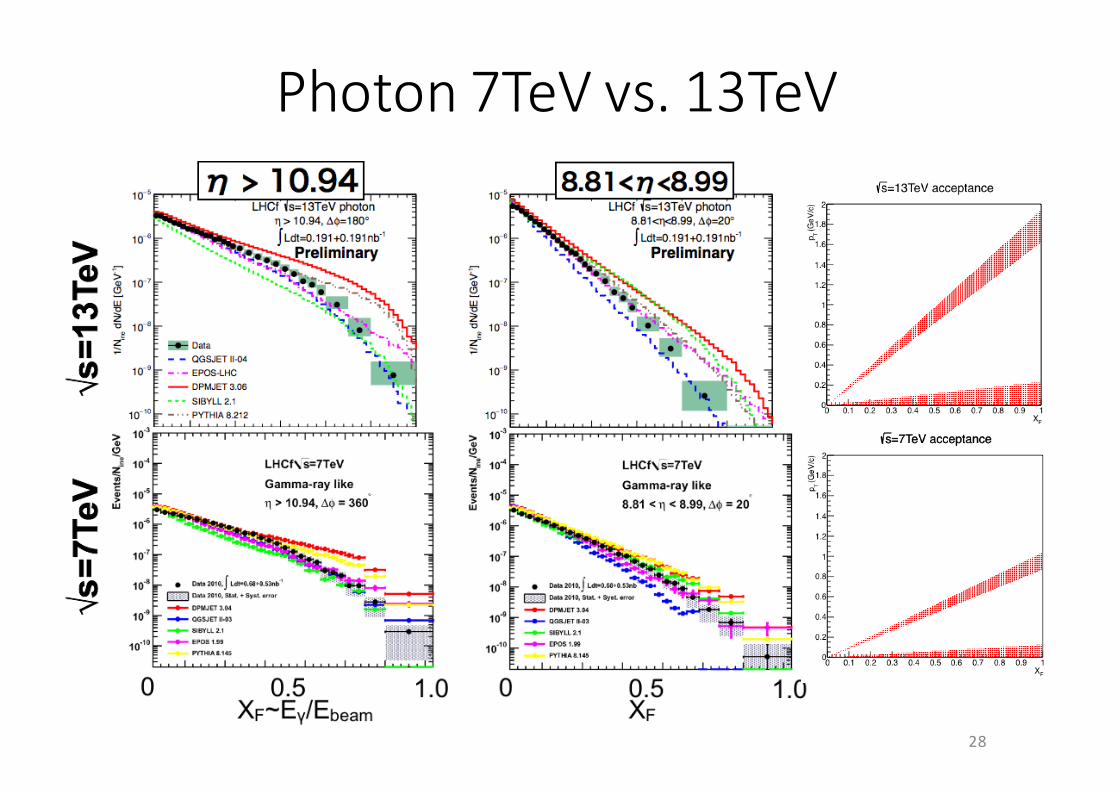
28
Photon7TeVvs.13TeV
Diffraction/nondiffractiontaggingbyATLAS(prospectfor13TeVanalysis)
29
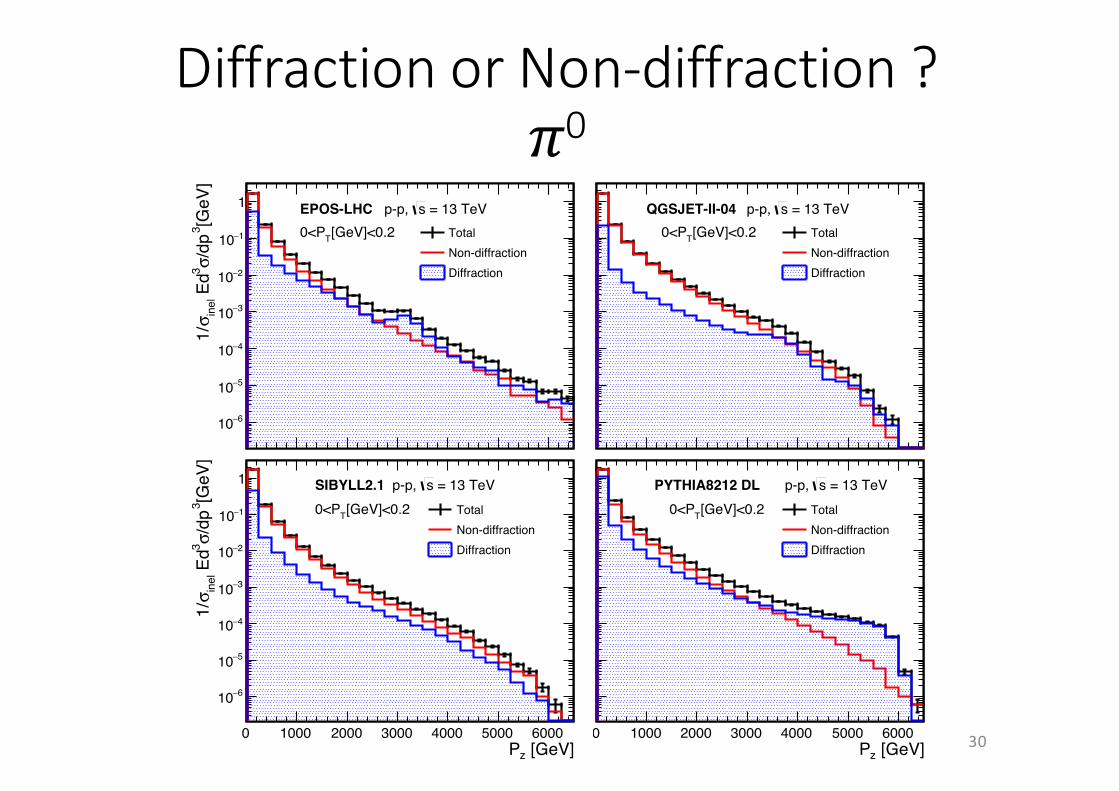
DiffractionorNon-diffraction?𝜋0
30
[GeV]zP0 1000 2000 3000 4000 5000 6000
[GeV
]3
/dp
σ3 E
din
elσ
1/
6−10
5−10
4−10
3−10
2−10
1−10
1 EPOS-LHC = 13 TeVsp-p, [GeV]<0.2T0<P Total
Non-diffractionDiffraction
[GeV]zP0 1000 2000 3000 4000 5000 6000
[GeV
]3
/dp
σ3 E
din
elσ
1/
6−10
5−10
4−10
3−10
2−10
1−10
1 QGSJET-II-04 = 13 TeVsp-p, [GeV]<0.2T0<P Total
Non-diffractionDiffraction
[GeV]zP0 1000 2000 3000 4000 5000 6000
[GeV
]3
/dp
σ3 E
din
elσ
1/
6−10
5−10
4−10
3−10
2−10
1−10
1 SIBYLL2.1 = 13 TeVsp-p, [GeV]<0.2T0<P Total
Non-diffractionDiffraction
[GeV]zP0 1000 2000 3000 4000 5000 6000
[GeV
]3
/dp
σ3 E
din
elσ
1/
6−10
5−10
4−10
3−10
2−10
1−10
1 PYTHIA8212 DL = 13 TeVsp-p, [GeV]<0.2T0<P Total
Non-diffractionDiffraction
[GeV]zP0 1000 2000 3000 4000 5000 6000
024
[GeV]zP0 1000 2000 3000 4000 5000 6000
EPO
S-LH
C
024
[GeV]zP0 1000 2000 3000 4000 5000 6000
Mod
els/
024
31
E [GeV]0 1000 2000 3000 4000 5000 6000
/dE
n d
Nin
el1/
N
8−10
7−10
6−10
EPOS-LHC = 13 TeVsp-p, >10.94η
TotalNon-diffractionDiffraction
E [GeV]0 1000 2000 3000 4000 5000 6000
/dE
n d
Nin
el1/
N
8−10
7−10
6−10
QGSJET-II-04 = 13 TeVsp-p, >10.94η
TotalNon-diffractionDiffraction
E [GeV]0 1000 2000 3000 4000 5000 6000
/dE
n d
Nin
el1/
N
8−10
7−10
6−10
SIBYLL2.3 = 13 TeVsp-p, >10.94η
TotalNon-diffractionDiffraction
E [GeV]0 1000 2000 3000 4000 5000 6000
/dE
n d
Nin
el1/
N
8−10
7−10
6−10
SIBYLL2.1 = 13 TeVsp-p, >10.94η
TotalNon-diffractionDiffraction
E [GeV]0 1000 2000 3000 4000 5000 6000
0
5
E [GeV]0 1000 2000 3000 4000 5000 6000
EPO
S-LH
C
0
5
E [GeV]0 1000 2000 3000 4000 5000 6000
Mod
els/
0
5
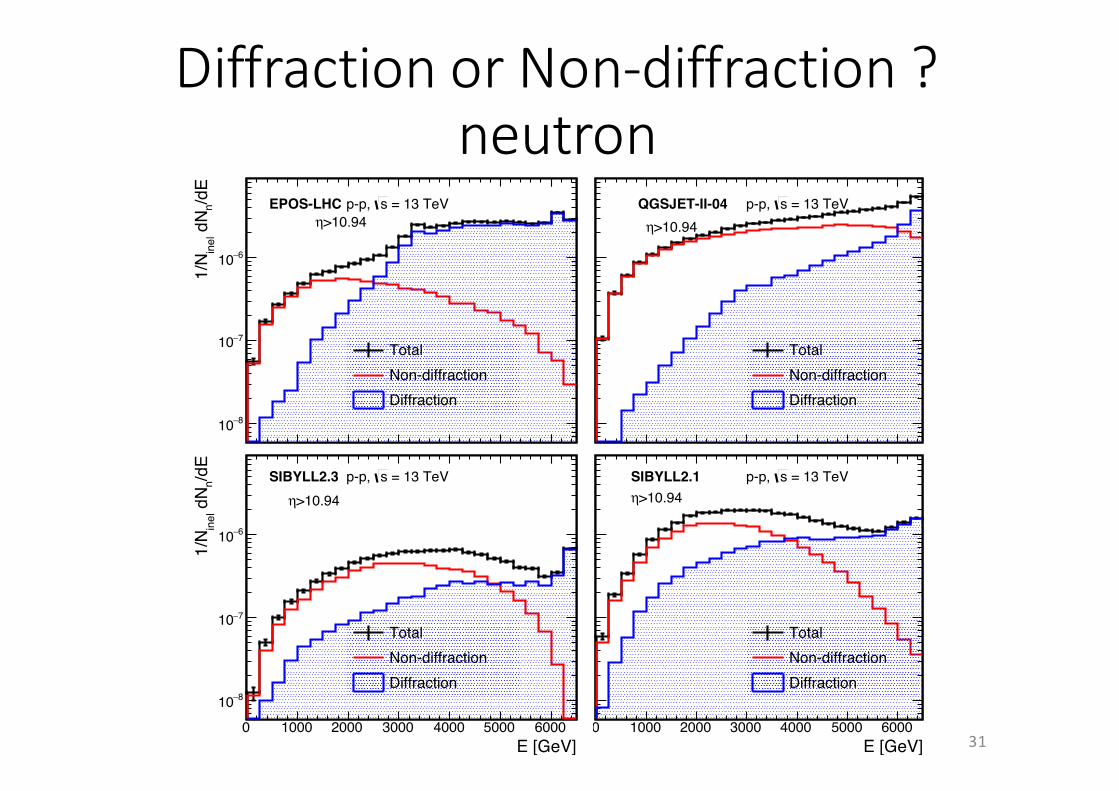
DiffractionorNon-diffraction?neutron

TaggingbyATLAS(notrack=diffraction-like)
32
E [GeV]0 1000 2000 3000 4000 5000 6000
/dE
n d
Nin
el1/
N
8−10
7−10
6−10
EPOS-LHC = 13 TeVsp-p, >10.94η
Diffraction
ATLAS vote
Non-diffraction@vote
Diffraction@vote
E [GeV]0 1000 2000 3000 4000 5000 6000
/dE
n d
Nin
el1/
N
8−10
7−10
6−10
QGSJET-II-04 = 13 TeVsp-p, >10.94η
E [GeV]0 1000 2000 3000 4000 5000 6000
/dE
n d
Nin
el1/
N
8−10
7−10
6−10
SIBYLL2.1 = 13 TeVsp-p, >10.94η
E[GeV]0 1000 2000 3000 4000 5000 6000
/dE
n d
Nn
1/N
8−10
7−10
6−10
PYTHIA8212 DL = 13 TeVsp-p, >10.94η
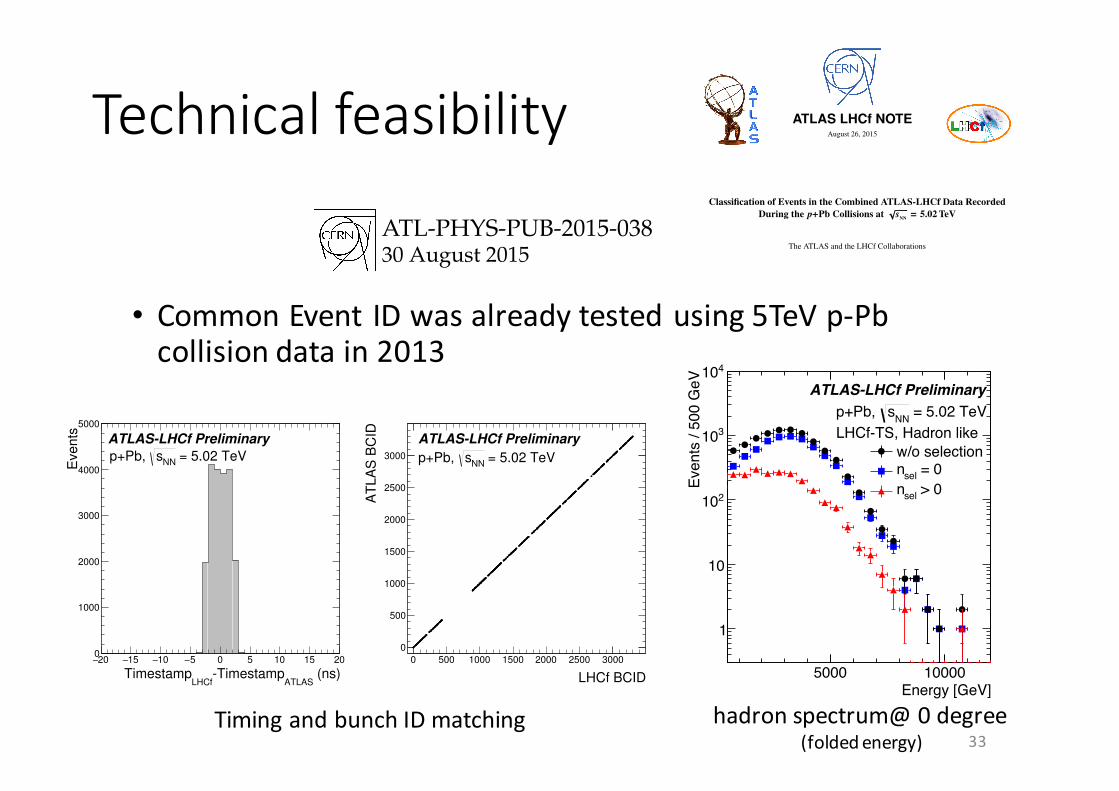
Technicalfeasibility
• CommonEvent IDwasalreadytestedusing5TeVp-Pbcollisiondatain2013
33
(ns)ATLAS
-TimestampLHCf
Timestamp20− 15− 10− 5− 0 5 10 15 20
Eve
nts
0
1000
2000
3000
4000
5000
ATLAS-LHCf Preliminary = 5.02 TeVNNsp+Pb,
LHCf BCID
0 500 1000 1500 2000 2500 3000
AT
LA
S B
CID
0
500
1000
1500
2000
2500
3000
ATLAS-LHCf Preliminary
= 5.02 TeVNNsp+Pb,
Figure 1: Left: The di↵erence between the event time stamps recorded by ATLAS and LHCf detectors.Right: Relation between the event BCIDs assigned by the two detectors, based on the information fromthe event time stamp.
number of randomly chosen events from the LHCf dataset was sought in the ATLAS event list, based onthe agreement of ATLAS and LHCf absolute time stamps and the relative time di↵erence between theevents recorded on either side. These reference events were used to match subsequent and previous eventpairs utilizing the relative time di↵erence.
Figure 1 (left) shows the di↵erence of the time stamps from ATLAS and LHCf. The observed agree-ment at the level of ±3 ns proves the time stamp can be safely used to match the events recorded byATLAS and LHCf, given the average data acquisition rate of O(10 Hz). In 2013 data taking the LHCfdata acquisition system recorded approximately 99.7% of all triggered events. The lost events corre-spond to the end of LHCf runs and the problem is fixed in 2015 data taking. All events simultaneouslyrecorded by the LHCf and the ATLAS experiments are matched.
The matching based on the time stamp is confirmed by comparing the bunch crossing identifiers(BCIDs) of the matched events. Figure 1 (right) shows an exact agreement of the BCIDs recorded byATLAS and that by LHCf in the matched events, demonstrating perfect synchronization of both dataacquisition systems. Two examples of matched events are illustrated in the event displays shown inFig. 2, with a reconstructed particle in TS and TL calorimeters of LHCf.
5 Analysis
The reconstruction of the LHCf data follows the standard LHCf analysis procedure to identify incidentparticles and to determine their point of impact and energy [6]. The particle identification classifies theshowers as photon-like and hadron-like based on the longitudinal profiles of showers measured by the16 sampling layers. The energy deposited in the 2nd up to and including the 13th sampling layer of thetowers is used to measure the total energy of the incident photon, and the energy deposited in the 3rd upto the 16th sampling layer is used for to measure the incident neutron energy. The measured energiesare corrected for leaked shower particles and the position dependence of light collection e�ciency. Theabsolute energy scale was calibrated by using the 100-200 GeV electron beams and the 350 GeV protonbeams from the Super Proton Synchrotron at CERN and was determined to a precision of 3.5% and 6.5%,respectively [7, 9]. The events with a particle entering within 2 mm from the edge of the calorimeters
3
Energy [GeV]1000 2000 3000
Even
ts /
200
GeV
1
10
210
310
410ATLAS-LHCf Preliminary
= 5.02 TeVNNsp+Pb, LHCf-TS, Photon like
w/o selection = 0seln > 0seln
Energy [GeV]1000 2000 3000
Even
ts /
200
GeV
1
10
210
310
410ATLAS-LHCf Preliminary
= 5.02 TeVNNsp+Pb, LHCf-TL, Photon like
w/o selection = 0seln > 0seln
Energy [GeV]5000 10000
Even
ts /
500
GeV
1
10
210
310
410ATLAS-LHCf Preliminary
= 5.02 TeVNNsp+Pb, LHCf-TS, Hadron like
w/o selection = 0seln > 0seln
Energy [GeV]5000 10000
Even
ts /
500
GeV
1
10
210
310
410ATLAS-LHCf Preliminary
= 5.02 TeVNNsp+Pb, LHCf-TL, Hadron like
w/o selection = 0seln > 0seln
Figure 3: The energy spectra of the photon-like (top) and hardon-like (bottom) events measured by LHCfin TS (left) and TL (right) are shown as black circles. The e↵ects of the finite energy resolution and non-uniformity of acceptance in pseudorapidity are not corrected for in these results. A classification basedon the number of charged particle tracks in the central region reconstructed by ATLAS is done. Theevents with (without) reconstructed charged particles are shown as red triangles (blue squares).
6
ATL
-PH
YS-
PUB-
2015
-038
30A
ugus
t201
5
ATLAS LHCf NOTEAugust 26, 2015
Classification of Events in the Combined ATLAS-LHCf Data RecordedDuring the p+Pb Collisions at psNN = 5.02 TeV
The ATLAS and the LHCf Collaborations
Abstract
This document reports on a first analysis of a common dataset recorded by the ATLASand the LHCf detectors during the proton-lead collisions at psNN = 5.02 TeV in 2013. TheLHCf trigger signal was incorporated in the ATLAS Level-1 trigger system and it is shownthat the common events recorded by ATLAS and LHCf can be matched o↵-line. Preliminaryanalysis of the combined dataset is carried out, forming an important precedent for the futureATLAS-LHCf collaboration that will allow to further improve our understanding of cosmic-ray air showers and modelling of inelastic processes at the LHC. The discrimination powerof using information from ATLAS to classify the events with reconstructed particles in LHCfis demonstrated.
c� Copyright 2015 CERN for the benefit of the ATLAS and LHCf Collaborations.Reproduction of this article or parts of it is allowed as specified in the CC-BY-3.0 license.
ATL-PHYS-PUB-2015-03830 August 2015
ATLAS
LHC
fNO
TEA
ugust26,2015
Classification
ofEventsinthe
Com
binedATLA
S-LHC
fData
Recorded
During
thep+Pb
Collisionsat p
sN
N=
5.02TeV
TheATLA
Sand
theLH
CfC
ollaborations
Abstract
Thisdocum
entreportson
afirstanalysis
ofacom
mon
datasetrecordedby
theATLA
Sand
theLH
Cfdetectors
duringthe
proton-leadcollisions
at ps
NN=
5.02TeV
in2013.The
LHC
ftriggersignalwas
incorporatedin
theATLA
SLevel-1
triggersystemand
itisshow
nthatthe
comm
oneventsrecorded
byATLA
Sand
LHC
fcanbe
matched
o↵-line.Prelim
inaryanalysisofthe
combined
datasetiscarriedout,form
ingan
importantprecedentforthe
futureATLA
S-LHC
fcollaborationthatw
illallowto
furtherimprove
ourunderstandingofcosm
ic-ray
airshowers
andm
odellingofinelastic
processesatthe
LHC
.Thediscrim
inationpow
erofusing
information
fromATLA
Sto
classifythe
eventswith
reconstructedparticlesin
LHC
fisdem
onstrated.
c�C
opyright2015C
ERN
forthebenefitofthe
ATLAS
andLH
CfC
ollaborations.R
eproductionofthisarticle
orpartsofitisallowed
asspecifiedin
theC
C-B
Y-3.0license.
TimingandbunchIDmatching hadronspectrum@0degree(foldedenergy)

√sscaling
34
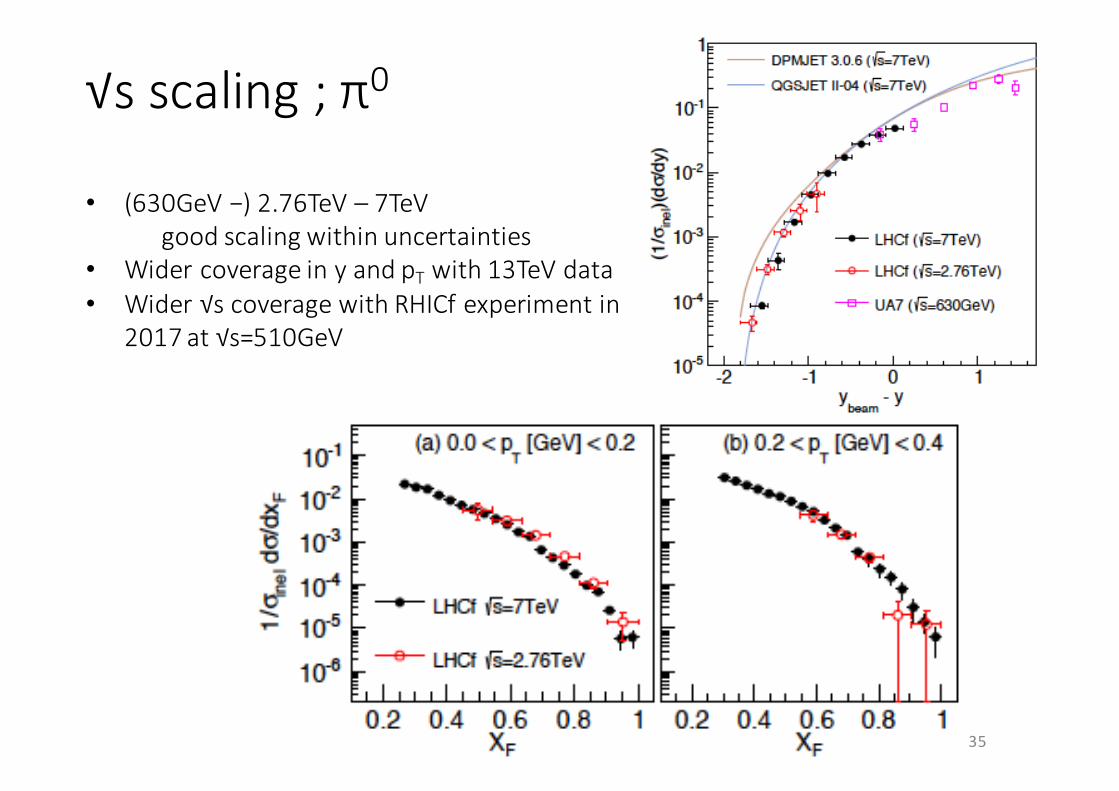
√sscaling; π0
35
• (630GeV−)2.76TeV– 7TeVgoodscalingwithinuncertainties
• Wider coverageinyandpT with13TeVdata• Wider√scoveragewithRHICf experimentin
2017at√s=510GeV
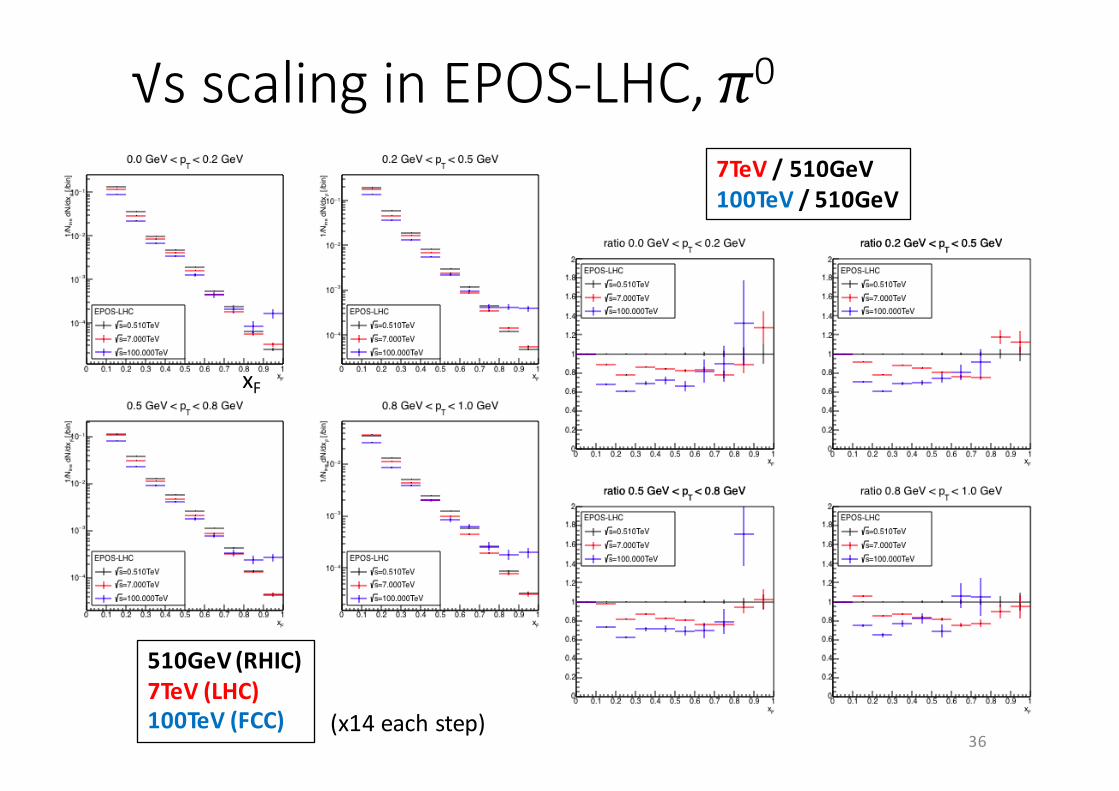
√sscalinginEPOS-LHC,𝜋0
36
510GeV(RHIC)7TeV(LHC)100TeV(FCC)
xF
7TeV/510GeV100TeV/510GeV
(x14eachstep)
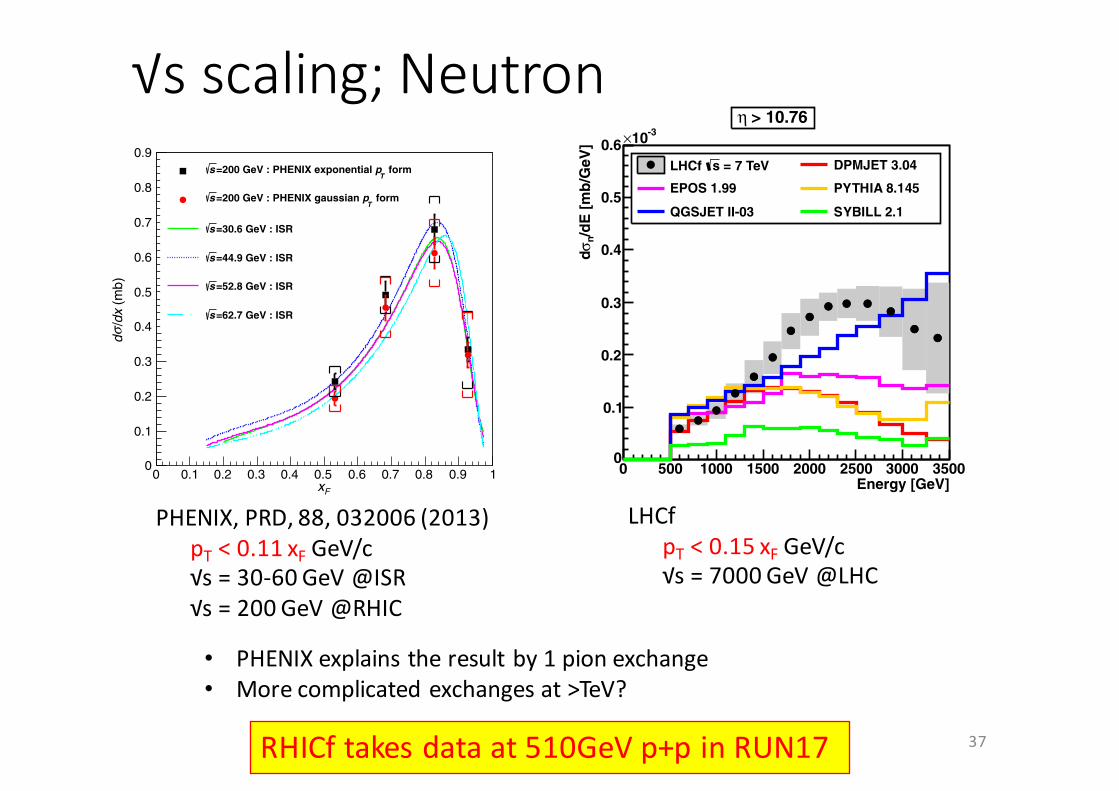
√sscaling;Neutron
37
are the efficiency for the experimental cuts and are listed inTable I. The errors were derived considering theuncertainty in the parameter aðxFÞ in the Gaussian formevaluated by HERA. There is no significant difference inthe result in case of using the ISR (exponential) pT
distribution.The mean values of the simulated pT distributions in
each energy region are also listed in Table I. The crosssection was obtained after the correction of the energyunfolding and the cut efficiency.
Table II summarizes all systematic uncertainties eval-uated as the ratio of the variation to the final cross sectionvalues. The absolute normalization error is not included inthese errors. It was estimated by BBC counts to be 9.7%(22:9# 2:2 mb for the BBC trigger cross section).
The background contamination in the measured neutronenergy with the ZDC energy from 20 to 140 GeV for theacceptance cut of r < 2 cm was estimated by the simula-tion with the PYTHIA event generator. The background fromprotons was estimated to be 2.4% in the simulation. Thesystematic uncertainty in the experimental data was deter-mined to be 1.5 times larger than this as discussed inSec. II B 3. Multiple particle detection in each collisionwas estimated to be 7% with the r < 2 cm cut.
In the cross section analysis, we evaluated the beamcenter shift described in Appendix A as a systematicuncertainty. For the evaluation, cross sections were calcu-lated in the different acceptances according to the result ofthe beam center shift while requiring r < 2 cm, and thevariations were applied as a systematic uncertainty.
B. Result
The differential cross section, d!=dxF, for forwardneutron production in pþ p collisions at
ffiffiffis
p ¼ 200 GeVwas determined using two pT distributions: a Gaussianform, as used in HERA analysis, and an exponentialform, used for ISR data analysis. The results are listed inTable III and plotted in Fig. 13. We show the results for xFabove 0.45 since the data below 0.45 are significantlyaffected by the energy cutoff before the unfolding. ThepT range in each xF bin is 0< pT < 0:11xF GeV=c fromEq. (2) with the acceptance cut of r < 2 cm. The absolutenormalization uncertainty for the PHENIX measurement,9.7%, is not included.
TABLE I. The expected pT for r < 2 cm, mean pT value withthe experimental cut, and the efficiency for the experimental cutestimated by the simulation (Fig. 12). The errors were derivedconsidering the uncertainty in the parameter aðxFÞ in theGaussian form evaluated by HERA.
Neutron xF Mean pT (GeV=c) Efficiency
0.45–0.60 0.072 0:779# 0:014ð1:8%Þ0.60–0.75 0.085 0:750# 0:009ð1:2%Þ0.75–0.90 0.096 0:723# 0:006ð0:8%Þ0.90–1.00 0.104 0:680# 0:016ð2:3%Þ
TABLE III. The result of the differential cross sectiond!=dxFðmbÞ for neutron production in pþ p collisions at
ffiffiffis
p ¼200 GeV. The first uncertainty is statistical, after the unfolding,and the second is the systematic uncertainty. The absolutenormalization error, 9.7%, is not included.
hxFi Exponential pT form Gaussian pT form
0.53 0:243# 0:024# 0:043 0:194# 0:021# 0:0370.68 0:491# 0:039# 0:052 0:455# 0:036# 0:0850.83 0:680# 0:044# 0:094 0:612# 0:044# 0:0960.93 0:334# 0:035# 0:111 0:319# 0:037# 0:123
TABLE II. Systematic uncertainties for the cross section mea-surement. The absolute normalization error is not included inthese errors. The absolute normalization uncertainty was esti-mated by BBC counts to be 9.7% (22:9# 2:2 mb for the BBCtrigger cross section).
Exponential pT
formGaussian pT
form
pT distribution 3%–10% 7%–22%Beam center shift 3%–31%Proton background 3.6%Multiple hit 7%Total 11%–33% 16%–39%
Fx0 0.1 0.2 0.3 0.4 0.5 0.6 0.7 0.8 0.9 1
/dx
(mb)
σ d
0
0.1
0.2
0.3
0.4
0.5
0.6
0.7
0.8
0.9 form
T=200 GeV : PHENIX exponential ps
formT
=200 GeV : PHENIX gaussian ps
=30.6 GeV : ISRs
=44.9 GeV : ISRs
=52.8 GeV : ISRs
=62.7 GeV : ISRs
FIG. 13 (color online). The cross section results for forwardneutron production in pþ p collisions at
ffiffiffis
p ¼ 200 GeV areshown. Two different forms, exponential (squares) and Gaussian(circles), were used for the pT distribution. Statistical uncertain-ties are shown as error bars for each point, and systematicuncertainties are shown as brackets. The integrated pT regionfor each bin is 0< pT < 0:11xF GeV=c. Shapes of ISR resultsare also shown. Absolute normalization errors for the PHENIXand ISR are 9.7% and 20%, respectively.
A. ADARE et al. PHYSICAL REVIEW D 88, 032006 (2013)
032006-10
PHENIX,PRD,88,032006(2013)pT <0.11xF GeV/c√s=30-60GeV@ISR√s=200GeV@RHIC
O. Adriani et al. / Physics Letters B 750 (2015) 360–366 365
Fig. 6. Unfolded energy spectra of the small towers (η > 10.76) and the large towers (8.99 < η < 9.22 and 8.81 < η < 8.99). The yellow shaded areas show the Arm1 systematic errors, and the bars represent the Arm2 systematic errors except the luminosity uncertainty. (For interpretation of the references to color in this figure legend, the reader is referred to the web version of this article.)
Fig. 7. Comparison of the LHCf results with model predictions at the small tower (η > 10.76) and large towers (8.99 < η < 9.22 and 8.81 < η < 8.99). The black markers and gray shaded areas show the combined results of the LHCf Arm1 and Arm2 detectors and the systematic errors, respectively. (For interpretation of the colors in this figure, the reader is referred to the web version of this article.)
where dN("η, "E) is the number of neutrons observed in the each rapidity range, "η, and each energy bin, "E . L is the inte-grated luminosity corresponding to the data set. The cross sections are summarized in Table 5. Fig. 7 shows the combined Arm1 and Arm2 spectra together with the model predictions. The experimen-tal results indicate the highest neutron production rate compared with the MC models at the most forward rapidity. The QGSJET II-03 model predicts a neutron production rate similar to the ex-perimental results in the largest rapidity range. However, the DP-MJET 3.04 model predicts neutron production rates better in the smaller rapidity ranges. These tendencies were already found in the spectra before unfolding, and they are not artifacts of unfold-ing.
The neutron-to-photon ratios (Nn/Nγ ) in three different rapid-ity regions were extracted after unfolding and are summarized in Table 4. Here, Nn and Nγ are the number of neutrons and num-ber of photons, respectively, with energies greater than 100 GeV. The numbers of photons were obtained from the previous anal-ysis [9] and the same analysis for the pseudo-rapidity range of 8.99–9.22 defined in this study. The experimental data indicate a more abundant neutron production rate relative to the photon pro-duction than any model predictions studied here.
Table 4Hadron-to-photon ratio for experiment and MC models. The number of neutrons with energies above 100 GeV was divided by the number of photons with ener-gies above 100 GeV. The rapidity intervals corresponding to the small tower, Large tower A, and Large tower B are η > 10.76, 9.22 > η > 8.99, and 8.99 > η > 8.81, respectively.
Nn/Nγ Small Large A Large B
Data 3.05 ± 0.19 1.26 ± 0.08 1.10 ± 0.07
DPMJET 3.04 1.05 0.76 0.74EPOS 1.99 1.80 0.69 0.63PYTHIA 8.145 1.27 0.82 0.79QGSJET II-03 2.34 0.65 0.56SYBILL 2.1 0.88 0.57 0.53
5. Summary and discussion
An initial analysis of neutron spectra at the very forward region of the LHC is presented in this paper. The data were acquired in May 2010 at the LHC from
√s = 7 TeV proton–proton collisions
with integrated luminosities of 0.68 nb−1 and 0.53 nb−1 for the LHCf Arm1 and Arm2 detectors, respectively.
The neutron energy spectra were analyzed in three different rapidity regions. The results obtained from the two independent
LHCfpT <0.15xF GeV/c√s=7000GeV@LHC
• PHENIXexplainstheresultby1pionexchange• Morecomplicatedexchangesat>TeV?
RHICf takesdataat510GeVp+p inRUN17
Single-SpinAsymmetryatRHIC
38
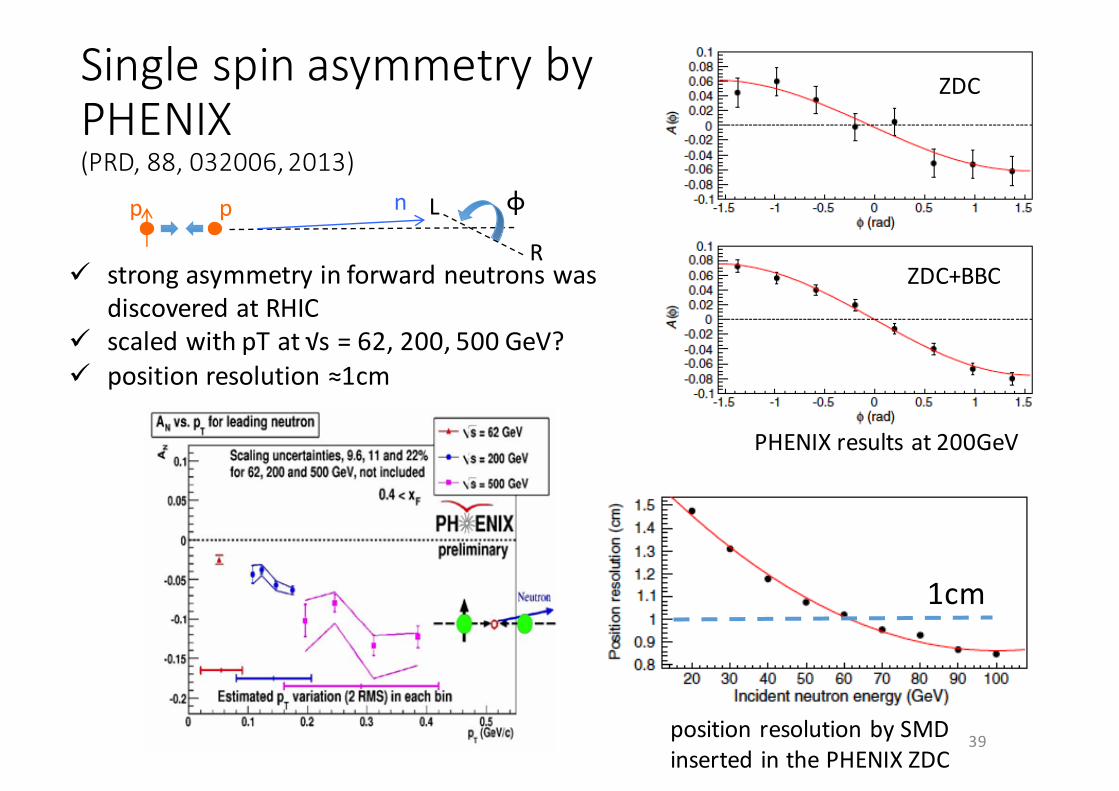
SinglespinasymmetrybyPHENIX(PRD,88,032006,2013)
39positionresolutionbySMDinserted inthePHENIXZDC
ZDC
ZDC+BBCü strongasymmetryinforwardneutronswasdiscoveredatRHIC
ü scaledwithpT at√s=62,200,500GeV?ü positionresolution≈1cm
PHENIXresultsat200GeV
1cm
ϕ
R
Lp p n

SinglespinasymmetrybyRHICf
• ExcellentpositionresolutionallowstocoverwidepT inasingle√scondition• With horizontalpolarization,coveringpT<1GeV/c
40
1GeV/cormoreLHCf Arm1positionresolutionforneutrons
(JINST,9,P03016,2014)
RHICenergy

VeryFuture
41
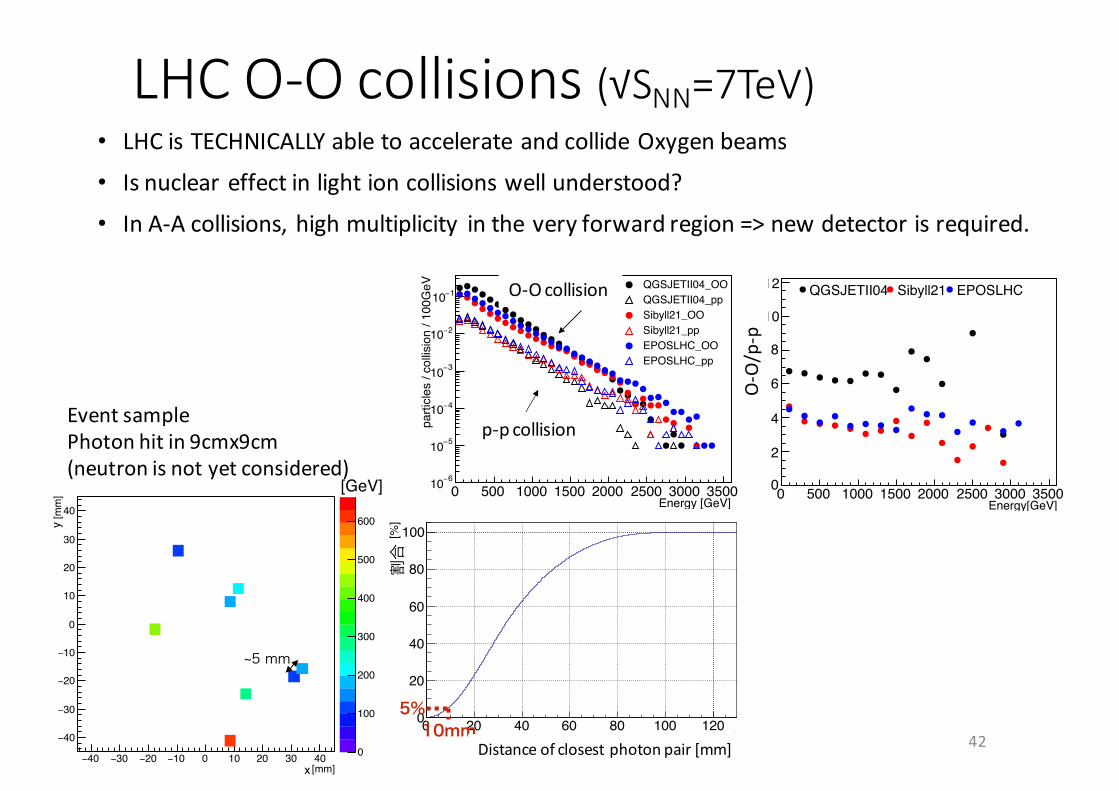
LHCO-Ocollisions(√SNN=7TeV)• LHCisTECHNICALLYabletoaccelerateandcollideOxygenbeams
• Isnucleareffectinlightioncollisionswellunderstood?
• InA-Acollisions,highmultiplicity intheveryforwardregion=>newdetectorisrequired.
42
MCによる検出器の要求決定衝突点から見て 90 mm × 90 mmの検出器を仮定
10
5‒10 mmまで接近したガンマ線が識別できれば、 検出器に入射するガンマ線のおよそ95%を識別可能
r [mm]∆0 20 40 60 80 100 120
Rat
io [%
]
0
20
40
60
80
100
全入射粒子数に対する距離別の粒子数の割合1回の衝突で検出器に入射する
ガンマ線の入射位置・エネルギーの例[mm]
40− 30− 20− 10− 0 10 20 30 40
[mm]
40−
30−
20−
10−
0
10
20
30
40
0
100
200
300
400
500
600
[mm]40− 30− 20− 10− 0 10 20 30 40
[mm]
40−
30−
20−
10−
0
10
20
30
40
0
500
1000
1500
2000
2500
3000
[mm]40− 30− 20− 10− 0 10 20 30 40
[mm]
40−
30−
20−
10−
0
10
20
30
40
0
100
200
300
400
500
600
[mm]40− 30− 20− 10− 0 10 20 30 40
[mm]
40−
30−
20−
10−
0
10
20
30
40
0
500
1000
1500
2000
2500
3000
3500[GeV]
~5 mm
5%10mm
105回の核子あたりの衝突エネルギー√sNN=7TeVの酸素衝突の解析
y
x
粒子間距離[mm]
割合
原子核衝突でのモデル間の違いモデルごとの酸素-酸素衝突と陽子-陽子衝突でのガンマ線スペクトル (左)
とエネルギーごとの粒子生成率の差 (右) 計算に使用したモデルはQGSJETII-04、EPOS-LHC、SIBYLL2.1
9
Energy [GeV]0 500 1000 1500 2000 2500 3000 3500
parti
cles
/ col
lisio
n / 1
00G
eV
6−10
5−10
4−10
3−10
2−10
1−10 QGSJETII04_OOQGSJETII04_ppSibyll21_OOSibyll21_ppEPOSLHC_OOEPOSLHC_pp
0π
Energy[GeV]0 500 1000 1500 2000 2500 3000 3500
pp /
NO
ON
0
1
2
3
4
5
6
7
8 QGSJETII04 Sibyll21 EPOSLHC
Energy [GeV]0 500 1000 1500 2000 2500 3000 3500
parti
cles
/ col
lisio
n / 1
00G
eV
6−10
5−10
4−10
3−10
2−10
1−10
1
neutron
Energy[GeV]0 500 1000 1500 2000 2500 3000 3500
pp /
NO
ON
2
4
6
8
10
12
14
16
Energy [GeV]0 500 1000 1500 2000 2500 3000 3500
parti
cles
/ col
lisio
n / 1
00G
eV
6−10
5−10
4−10
3−10
2−10
1−10
gamma
Energy[GeV]0 500 1000 1500 2000 2500 3000 3500
pp /
NO
ON
0
2
4
6
8
10
12
Energy [GeV]0 500 1000 1500 2000 2500 3000 3500
parti
cles
/ col
lisio
n / 1
00G
eV
6−10
5−10
4−10
3−10
2−10
1−10 QGSJETII04_OOQGSJETII04_ppSibyll21_OOSibyll21_ppEPOSLHC_OOEPOSLHC_pp
0π
Energy[GeV]0 500 1000 1500 2000 2500 3000 3500
pp /
NO
ON
0
1
2
3
4
5
6
7
8 QGSJETII04 Sibyll21 EPOSLHC
Energy [GeV]0 500 1000 1500 2000 2500 3000 3500
parti
cles
/ col
lisio
n / 1
00G
eV
6−10
5−10
4−10
3−10
2−10
1−10
1
neutron
Energy[GeV]0 500 1000 1500 2000 2500 3000 3500
pp /
NO
ON
2
4
6
8
10
12
14
16
Energy [GeV]0 500 1000 1500 2000 2500 3000 3500
parti
cles
/ col
lisio
n / 1
00G
eV
6−10
5−10
4−10
3−10
2−10
1−10
gamma
Energy[GeV]0 500 1000 1500 2000 2500 3000 3500
pp /
NO
ON
0
2
4
6
8
10
12
LHCで測定された陽子衝突に比べ酸素衝突はモデル間の差が大 QGSJETII-04では陽子衝突のおよそ6‒7倍の粒子生成率 EPOS-LHC、SIBYLL 2.1ではおよそ4倍前後の粒子生成率
陽子衝突
酸素衝突
酸素衝突と陽子衝突の比O-Ocollision
p-pcollision
O-O/p-p
EventsamplePhotonhitin9cmx9cm(neutronisnotyetconsidered)
Distanceofclosestphotonpair[mm]
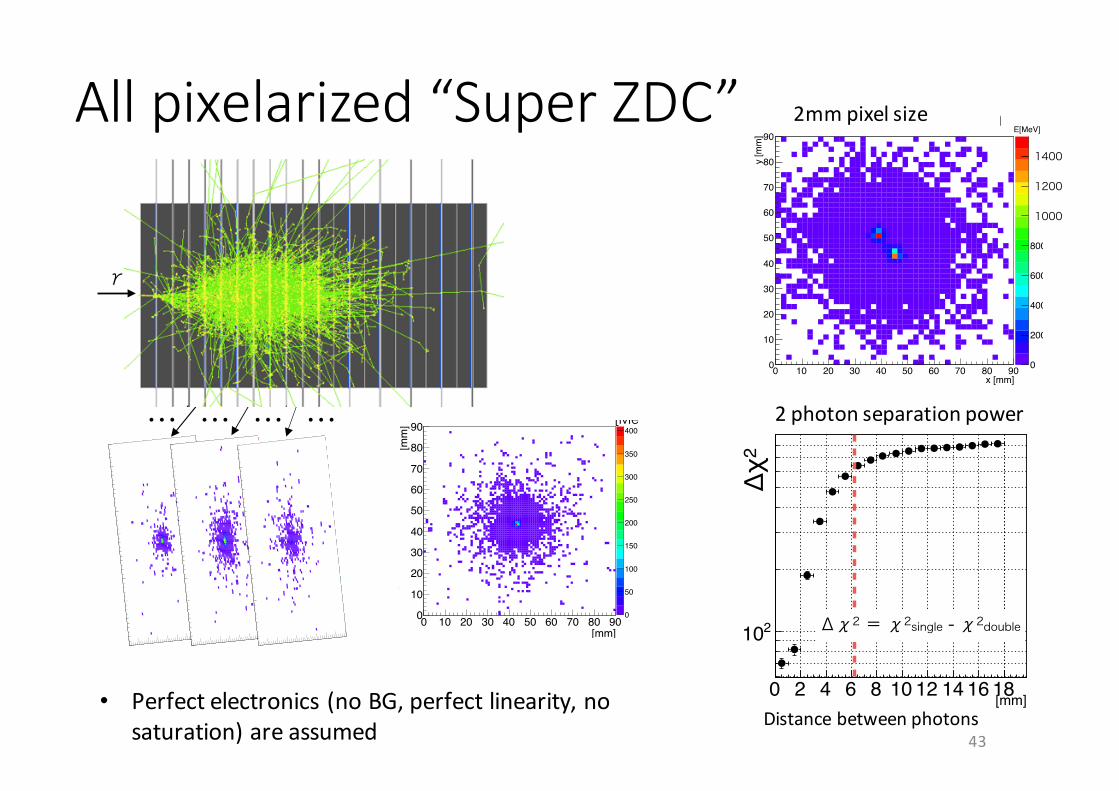
Allpixelarized “SuperZDC”
43
シャワー発達の様子500 GeVのガンマ線を入射させたときのシャワー発達
120 10 20 30 40 50 60 70 80 900
10
20
30
40
50
60
70
80
90
0
5
10
15
20
25
30
35
40
45
50demap2
0 10 20 30 40 50 60 70 80 900
10
20
30
40
50
60
70
80
90
0
5
10
15
20
25
30
35
40
45
50demap5
0 10 20 30 40 50 60 70 80 900
10
20
30
40
50
60
70
80
90
0
5
10
15
20
25
30
35
40
45
50demap8… …… …
[mm]0 10 20 30 40 50 60 70 80 90
[mm]
0
10
20
30
40
50
60
70
80
90
0
50
100
150
200
250
300
350
400
各位置での 電離損失
[MeV]
1~11層目までの各位置での 電離損失の和
ピクセルサイズが1 mmの場合
このシャワーの形状を解析した
γ
シャワー発達の様子500 GeVのガンマ線を入射させたときのシャワー発達
120 10 20 30 40 50 60 70 80 900
10
20
30
40
50
60
70
80
90
0
5
10
15
20
25
30
35
40
45
50demap2
0 10 20 30 40 50 60 70 80 900
10
20
30
40
50
60
70
80
90
0
5
10
15
20
25
30
35
40
45
50demap5
0 10 20 30 40 50 60 70 80 900
10
20
30
40
50
60
70
80
90
0
5
10
15
20
25
30
35
40
45
50demap8… …… …
[mm]0 10 20 30 40 50 60 70 80 90
[mm]
0
10
20
30
40
50
60
70
80
90
0
50
100
150
200
250
300
350
400
各位置での 電離損失
[MeV]
1~11層目までの各位置での 電離損失の和
ピクセルサイズが1 mmの場合
このシャワーの形状を解析した
γ シャワー発達の様子500 GeVのガンマ線を入射させたときのシャワー発達
120 10 20 30 40 50 60 70 80 900
10
20
30
40
50
60
70
80
90
0
5
10
15
20
25
30
35
40
45
50demap2
0 10 20 30 40 50 60 70 80 900
10
20
30
40
50
60
70
80
90
0
5
10
15
20
25
30
35
40
45
50demap5
0 10 20 30 40 50 60 70 80 900
10
20
30
40
50
60
70
80
90
0
5
10
15
20
25
30
35
40
45
50demap8… …… …
[mm]0 10 20 30 40 50 60 70 80 90
[mm]
0
10
20
30
40
50
60
70
80
90
0
50
100
150
200
250
300
350
400
各位置での 電離損失
[MeV]
1~11層目までの各位置での 電離損失の和
ピクセルサイズが1 mmの場合
このシャワーの形状を解析した
γ
ピクセルサイズの最適化2つのガンマ線が入射した場合のデータを作成した ピクセルサイズ別に二粒子識別性能・位置分解能を解析
13
x [mm]0 10 20 30 40 50 60 70 80 90
y [m
m]
0
10
20
30
40
50
60
70
80
90
0
100
200
300
400
500
600
700
1.0mm E[MeV]
x [mm]0 10 20 30 40 50 60 70 80 90
y [m
m]
0
10
20
30
40
50
60
70
80
90
0
100
200
300
400
500
600
700
800
900
1.5 mmE[MeV]
x [mm]0 10 20 30 40 50 60 70 80 90
y [m
m]
0
10
20
30
40
50
60
70
80
90
0
200
400
600
800
1000
1200
1400
2.0 mmE[MeV]
x [mm]0 10 20 30 40 50 60 70 80 90
y [m
m]
0
10
20
30
40
50
60
70
80
90
0
200
400
600
800
1000
1200
1400
1600
1800
2.5 mmE[MeV]
1400
1200
1000
1TeVのガンマ線2つが入射したときの ピクセルサイズ別のシャワー形状の例
ピクセルサイズが大きくなると入射位置の情報がなまる。 一方でピクセルサイズが小さいほどデータ量の増加や
回路の複雑化などデメリットが増える。 測定に十分な性能を達成できる
最大のピクセルサイズを求めることが重要。
ピクセルサイズ 1mm ピクセルサイズ 2mmピクセルサイズ 1.5mm
ピクセルサイズ 2.5mm [mm]0 2 4 6 8 10 12 14 16 18
/ 0.
52 χ
∆
1.0 mm
[mm]0 2 4 6 8 10 12 14 16 18
/ 0.
52 χ
∆
1.5 mm
[mm]0 2 4 6 8 10 12 14 16 18
/ 0.
52 χ
∆
210
2.0 mm
[mm]0 2 4 6 8 10 12 14 16 18
/ 0.
52 χ
∆
210
2.5 mm
検出器の性能 -二粒子識別-
16
• どの場合でも一粒子と二粒子の区別ができている
• 入射位置が離れる程差が大きくなり、6mmあたりを境に変化率が小さくなる。400
200
100 GeVと1 TeVのガンマ線が入射したとき各ピクセルサイズで二粒子間距離別の解析結果 Δχ2はFdoubleのフィットの方が成功していれば自由度の差 (4)より大きくなる
二粒子間距離
Δχ2 = χ2single - χ2doubleピクセルサイズ 1mm ピクセルサイズ 1.5mm
ピクセルサイズ 2mm ピクセルサイズ 2.5mm
二粒子間距離
二粒子間距離 二粒子間距離
Δχ2
Δχ2
Δχ2
Δχ2
[mm]0 2 4 6 8 10 12 14 16 18
/ 0.
52 χ
∆
1.0 mm
[mm]0 2 4 6 8 10 12 14 16 18 /
0.5
2 χ ∆
1.5 mm
[mm]0 2 4 6 8 10 12 14 16 18
/ 0.
52 χ
∆
210
2.0 mm
[mm]0 2 4 6 8 10 12 14 16 18
/ 0.
52 χ
∆
210
2.5 mm
検出器の性能 -二粒子識別-
16
• どの場合でも一粒子と二粒子の区別ができている
• 入射位置が離れる程差が大きくなり、6mmあたりを境に変化率が小さくなる。400
200
100 GeVと1 TeVのガンマ線が入射したとき各ピクセルサイズで二粒子間距離別の解析結果 Δχ2はFdoubleのフィットの方が成功していれば自由度の差 (4)より大きくなる
二粒子間距離
Δχ2 = χ2single - χ2doubleピクセルサイズ 1mm ピクセルサイズ 1.5mm
ピクセルサイズ 2mm ピクセルサイズ 2.5mm
二粒子間距離
二粒子間距離 二粒子間距離
Δχ2
Δχ2
Δχ2
Δχ2
2mmpixelsize
2photonseparationpower
Distancebetweenphotons• Perfectelectronics(noBG,perfectlinearity,no
saturation)areassumed
Summary• LHCf/RHICf measureneutralparticlesatverycharacteristicphasespace–zerodegree– wherealargefractionofcollisionenergyiscarried
• LHCf testsinteractionmodelsatLHC• EPOS-LHCandQGSJETII-04aretwobestmodels todescribe𝜋0 production• Allmodelsunderproduceneutrons
• √sscaling• Marginallyscalingin𝜋0 between2.76and7TeVisobserved• Indicationofscalingviolationinneutronbetween0.2and7TeVisobserved• LHCf continuesanalysisof0.9,2.76,7,and13TeV p-pcollisiondata• RHICf willtakedataat0.51TeVin2017
• RCHIf isexpectedtotestpT scalingofsingle-spinasymmetry• DetectordesignforfutureLHCO-Ocollisionisongoing[notmentionedtoday:wehave5TeVp-Pb dataandwillhave8.2TeVp-Pb]
44