vertical movement in the los medanos and … depository library program, a network of about 1,300...
TRANSCRIPT
NOAA Technical Memorandum NOS NGS 37
VERTICAL MOVEMENT IN THE LOS MEDANOS AND
NASH DRAW AREAS, NEW MEXICO, AS INDICATED
BY 1977 AND 1981 LEVELING SURVEYS
Rockville, Md.October 1982
u.s. DEPARTMENT OF
/COMMERCENational Oceanic and
Atmospheric Administration / National Ocean
Survey
NOAA Technical Publications
National Ocean Survey/National Geodetic Surveysubseries
The National Geodetic Survey (NGS) of the National Ocean Survey (NOS), NOAA,establishes and maintains the basic national horizontal and vertical networks
of geodetic control and provides governmentwide leadership in the improve-
ment of geodetic surveying methods and instrumentation, coordinates opera-tions to assure network development, and provides specifications and criteria
for survey operations by Federal, State, and other agencies.
NGS engages in research and development for the improvement of knowledge of
the figure of the Earth and its gravity field, and has the responsibility to
procure geodetic data from all sources, process these data, and make themgenerally available to users through a central data base.
NOAA geodetic publications and relevant geodetic publications of the former
U.S. Coast and Geodetic Survey are sold in paper form by the National
Geodetic Information Center. To obtain a price list or to place an ordercontact:
National Geodetic Information Center
OA/C18x2
National Ocean Survey, NOAARockville, MD 20852
(301) 443-8316
Publications can also be purchased over the counter at the National
Geodetic Information Center, 11400 Rockville Pike, Room 14, Rock'lille, Md.(Do not send correspondence to this address.)
An excellent reference source for all Government publications is the
National Depository Library Program, a network of about 1,300 designated
libraries. Requests for borrowing Depository Library material may be made
through your local library. A free listing of libraries in this system is
available from the Library Division, U.S. Government Printing Office,
5236 Eisenhower Ave., Alexandria, VA 22304 (703-557-9013).

NOAA Technical Memorandum NOS NGS 37
VERTICAL MOVEMENT IN THE LOS MEDANOS AND
NASH DRAW AREAS, NEW MEXICO, AS INDICATED
BY 1977 AND 1981 LEVELING SURVEYS
Emery I. Balazs
National Geodetic SurveyRockville, Md.October ;1.982
For sale by the National Geodetic Information Center,Rockville, MD 20852 Price $2.45
UNITEDSTATESDEPARTMENTOF COMMERCE
Malcolm Baldrige,Secretary /National Ocean
Survey
Herbert R. Lippold, Jr, Director/National Oceanic and
Atmospheric Administration
John V Byrne, Administrator

Abstract
Introduction
The 1977 survey
The 1981 survey
Adjustment
Comparison
Conclusion
CONTENTS
.. .. .. .. .. .. .. .. .. ~ .. .. .. .. .. .. .. .. .. .. .. .. .. .. .. .. .. .. .. .. .. .. .. .. .. .. .. .. .. .. .. .. .. .. .. .. .. .. .. .. .. .. .. .. .. .. .. .. .. .. .. ..
.. ........
10 ................
....
.. 'I! ............
.. .. .. .. .. ..
References
Acknowledgments
Appendix.
.. .. ".. ....................
.. ........
.. .. ..
Adjusted heights of the 1981 survey .. ., .. .. .. .. .. .. .. .. .. .. . . . ~ . . . . . . . . . . . .
iii
1
1
1
4
4
5
11
11
12
13

VERTICAL MOVEMENT IN.THE LOS MEDANOS AND NASH DRAW AREAS, NEW MEXICO,AS INDICATED BY 1977 AND 1981 LEVELING SURVEYS
Emery 1. Balazs-National Geodetic Survey
National Ocean Survey, NOAARockville, Md. 20852
ABSTRACT. Free-adjusted heights of two survey epochs werecompared for the Los Medanos and Nash Draw areas. Thechanges in heights of common bench marks were tabulated andplotted. The apparent movement for the area documented inthis report is relative to bench mark 1 BOR, set in a bridgein Carlsbad, N. Mex. A total of 122 of the 147 common benchmarks indicates consistent subsidence averaging approximately18 mm between 1977 and 1981 (4.6 mm/yr). At two bench marks,located over potash mines in the area, the subsidence is muchlarger.
INTRODUCTION
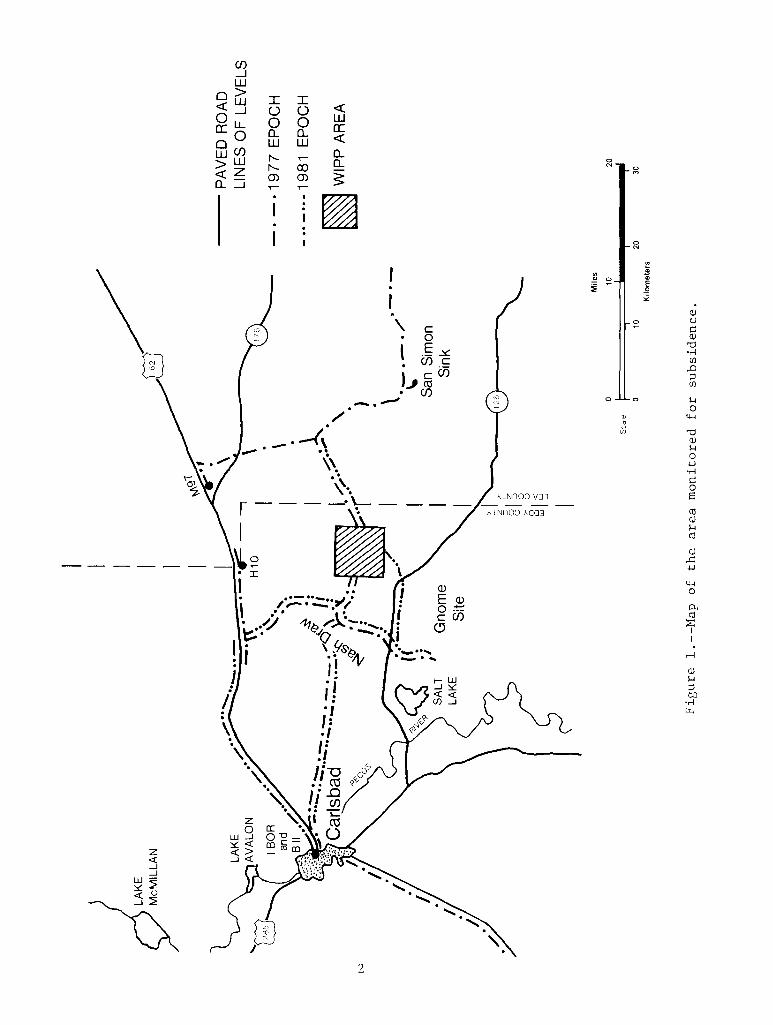
In the fall of 1977, the National Geodetic Survey (NGS) completed afirst-order, class I leveling survey in the vicinity of Carlsbad, N. Mex. The
survey was requested by Sandia National Laboratories, Albuquerque, N. Mex., to
establish a vertical reference network for evaluating elevation changes in thearea of the Waste Isolation Pilot Plant (WIPP). WIPP is located in the Los
Medanos area, about 45 km east of Carlsbad. (See fig. 1.) Plans were made in
1977 to relevel this network frequently to monitor vertical ground movement due
to geological and mining activities in the area. Knowledge of the Earth's
movement is one of the factors used to evaluate the suitability of the area for
disposal of radioactive waste material. Because the time interval between thetwo surveys was very short, the resulting vertical movement velocities should be
extrapolated cautiously and in conjunction with available geologicalinformation.
Releveling of the 1977of reduced funding, onlyThis report compares and
network was begun by NGS in August 1981. As a result192 km of the 314-kilometer network were releveled.
evaluates the results of the 1977 and 1981 surveys.
THE 1977 SURVEY
The 1977 survey was accomplished in two parts. Part one was the releveling ofa 202-kilometer segment of an existing first-order line of the National GeodeticVertical Network from Carlsbad to 70 km north of Sierra Blanca, Tex. The
purpose of the releveling of the first-order line was to determine movement at
Carlsbad relative to bench marks in the Diablo Plateau in Texas. Comparison ofheight differences determined in 1977 and in 1957-58 indicated a gradual
increase in relative subsidence along the line from bench mark L 181, set in the
mountains about 102 km east of El Paso, Tex., on Highway 62, to the Carlsbadarea. Average regional subsidence in the Carlsbad area, as determined front
these two precise leveling surveys between 1957 and 1977, was 104 mm (5 mm/yr),relative to bench mark L 181. (See fig. 2.)
1
N
Gno
me
Site
PA
VE
DR
OA
DLI
NE
SO
FLE
VE
LS
-.-.
1977
EP
OC
H
-..
1981
EP
OC
H
~W
IPP
AR
EA
Figure
l.--Map
of
the
area
monitored
for
subsidence.
Mile
s
1020
Scal
eI
I
I
II
,
1020
30
Kilo
met
ers

Bas
eL
ine
(195
7-58
Lev
elin
g)
(/)
.Q .Q o I
.....
,...
,...
,...
....
o14
016
018
020
022
024
026
028
030
0
Kilo
met
ers
6080
100
120
2040
Fig
ure
2.~
-Ave
rage
regi
onal
subs
iden
cein
the
Car
lsba
d,N
.M
ex.
area
.
,...
co ,...
...J
0X Q
)f- 18(/
) ro a. [jJ
20u.
iE .:.
::3N
a ,-
4C
I)"- Q
)+
-- Q)
5E :+
:;c Q
)w
()6 7 8 9
10
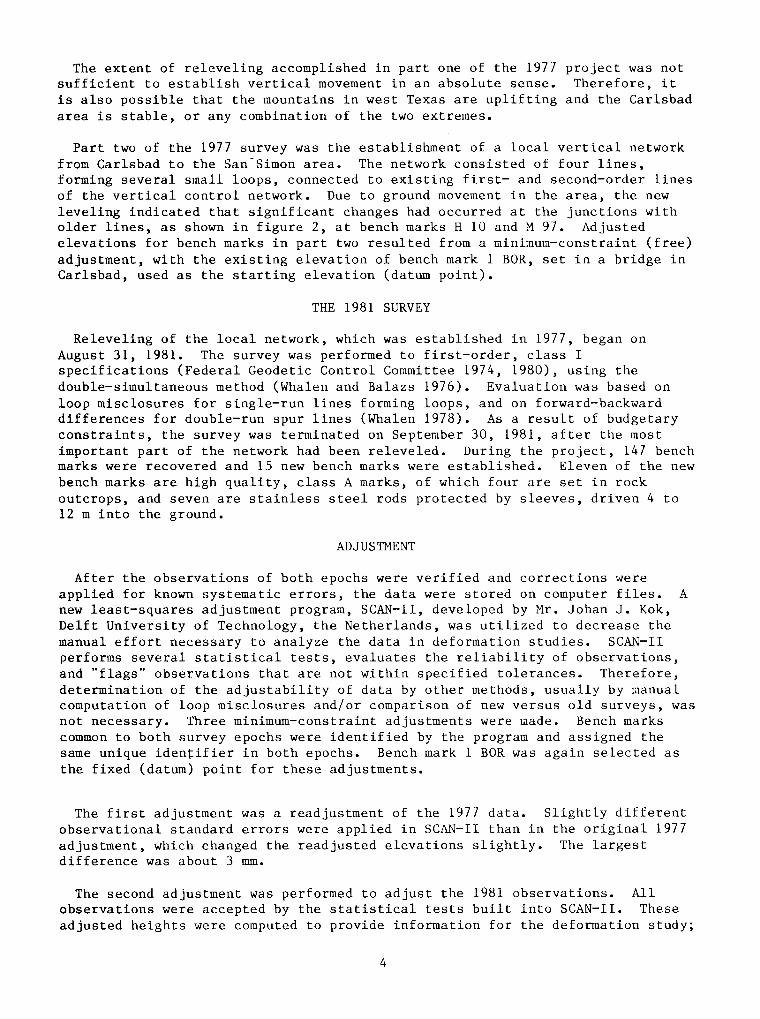
The extent of releveling accomplished in part one of the 1977sufficient to establish vertical movement in an absolute sense.
is also possible that the mountains in west Texas are uplifting
area is stable, or any combination of the two extremes.
project was notTherefore, it
and the Carlsbad
Part two of the 1977 survey was the establishment of a local vertical networkfrom Carlsbad to the San~Simon area. The network consisted of four lines,
forming several small loops, connected to existing first- and second-order linesof the vertical control network. Due to ground movement in the area, the new
leveling indicated that significant changes had occurred at the junctions witholder lines, as shown in figure 2, at bench marks H 10 and M 97. Adjusted
elevations for bench marks in part two resulted from a minimum-constraint (free)
adjustment, with the existing elevation of bench mark 1 BOR, set in a bridge inCarlsbad, used as the starting elevation (datum point).
THE 1981 SURVEY
Releveling of the local network, which was established in 1977, began on
August 31, 1981. The survey was performed to first-order, class Ispecifications (Federal Geodetic Control Committee 1974, 1980), using thedouble-simultaneous method (Whalen and Balazs 1976). Evaluation was based on
loop misclosures for single-run lines forming loops, and on forward-backwarddifferences for double-run spur lines (Whalen 1978). As a result of budgetary
constraints, the survey was terminated on September 30, 1981, after the most
important part of the network had been releveled. During the project, 147 benchmarks were recovered and 15 new bench marks were established. Eleven of the new
bench marks are high quality, class A marks, of which four are set in rock
outcrops, and seven are stainless steel rods protected by sleeves, driven 4 to12 m into the ground.
ADJUSTMENT
After the observations of both epochs were verified and corrections were
applied for known systematic errors, the data were stored on computer files. Anew least-squares adjustment program, SCAN-II, developed by Mr. Johan J. Kok,
Delft University of Technology, the Netherlands, was utilized to decrease the
manual effort necessary to analyze the data in deformation studies. SCAN-IIperforms several statistical tests, evaluates the reliability of observations,
and "flags" observations that are not within specified tolerances. Therefore,
determination of the adjustability of data by other methods, usually by manualcomputation of loop misclosures and/or comparison of new versus old surveys, wasnot necessary. Three minimum-constraint adjustments were made. Bench marks
common to both survey epochs were identified by the program and assigned the
same unique identifier in both epochs. Bench mark 1 BOR was again selected as
the fixed (datum) point for these adjustments.
The first adjustment was a readjustment of the 1977 data. Slightly differentobservational standard errors were applied in SCAN-II than in the original 1977adjustment, which changed the readjusted elevations slightly. The largestdifference was about 3 mm.
The second adjustment was performed to adjust the 1981 observations. Allobservations were accepted by the statistical tests built into SCAN-II. These
adjusted heights were computed to provide information for the deformation study;
4

i.e., the difference between the 1977 and 1981 adjusted elevations provides theapparent movement of the bench marks tabulated in table 1. The results of theadjustment of the 1981 observations are listed in the appendix. The standarddeviations (sigma) of the adjusted heights were computed by SCAN-II as afunction of the a priori standard deviation and the geometry of the network (Koket al. 1980).
Observations from part two of the 1977 survey and from the 1981 survey werecombined in the third adjustment. The third adjustment was performed to test if
the changes in bench mark heights reflect actual movement or whether they can beaccounted for by the uncertainty of the observations. Only the "quality" of
observations was tested against statistical standards; other possible effects,
such as movement of bench marks, were not modeled. Therefore, if some of theobservations are flagged (rejected) in the combined adjustment, which had
already been accepted in either one of the first two adjustments, the reason for
the flagging is probably movement of the bench mark during the time between thetwo surveys. Observational data for 46 of the 147 common bench marks were
flagged by the program, marking those points where movement was most
significant. The statistical test for significant movement could have been moreeffective if a mathematical model for movement had been available, and if thebench marks which showed obvious movement were removed from the third
adjustment.
COMPARISION
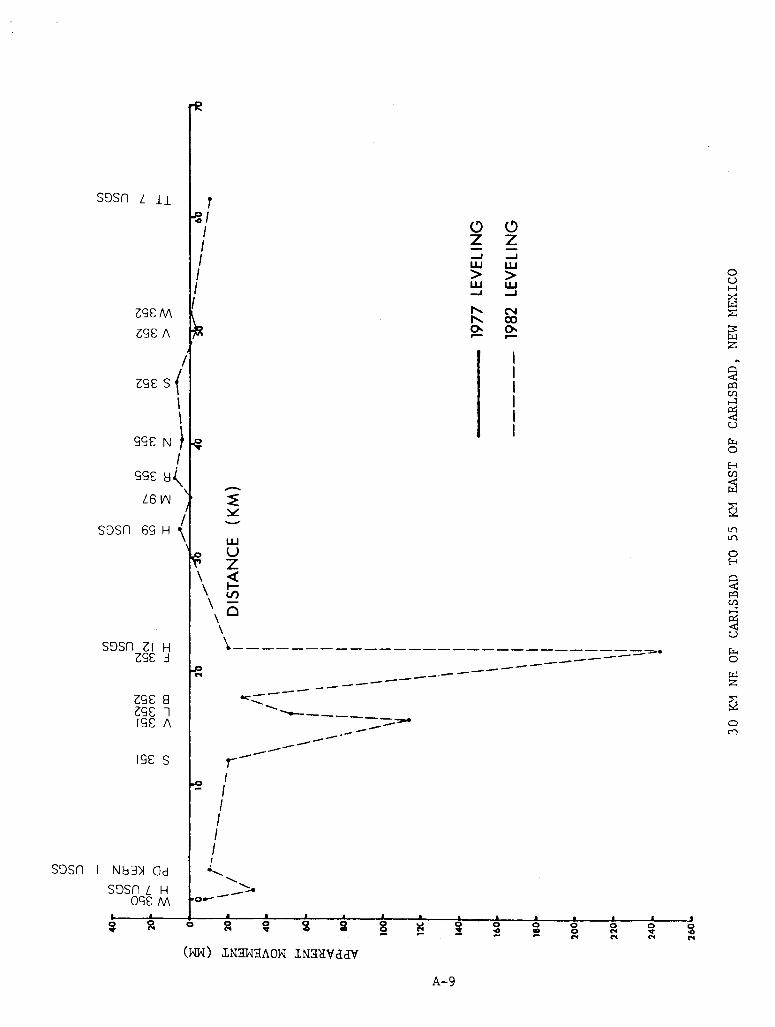
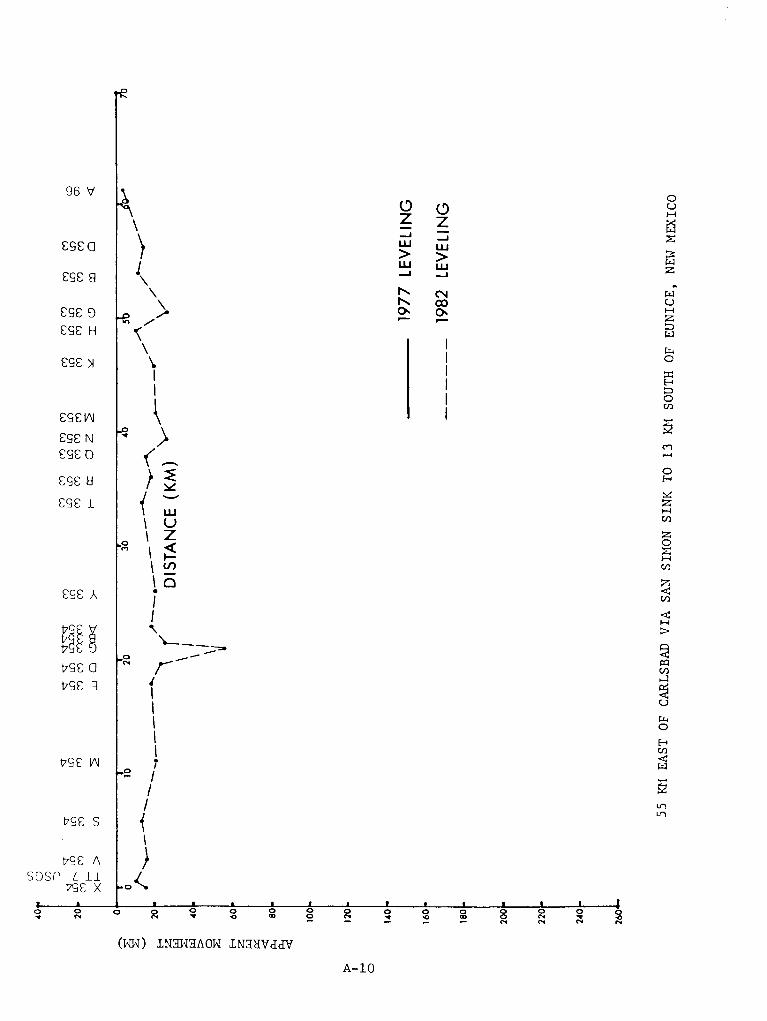
The adjusted heights and the differences between the 1977 and 1981 heights ofcommon bench marks of the two surveys have been tabulated and plotted. (See
table 1.) Figure 3 shows the bench mark locations with a unique number listedin table 1 under the heading "serial no." Figure 4 shows the bench mark
locations with the movement in millimeters, which are listed in table 1 under
the heading "H2-H1".
The height differences (H2-H1) of 10 bench marks near Carlsbad, where H1 is
the height of the bench marks in 1977 and H2 in 1981, indicate small, relativeuplift of approximately 1 mm/yr. Since all bench marks in the area are
subsiding relative to bench mark L 181, as shown in figure 2, the apparent
uplift should be interpreted as additional subsidence; i.e., all bench markssubsided an additional 9 mm relative to bench mark R 345, which showed 9 mm
(maximum) apparent uplift. The remaining common bench marks indicate a slightly
larger subsidence. The average subsidence, computed from 122 heightdifferences, is 18.3 mm with a standard deviation of 6.9 mm. The first 22
points east of Carlsbad and three other points, L 350, USP 60 USGS, and B 348
(where the differences are significantly larger), were not included in thecomputation of average subsidence.
The large changes at the three bench marks can be explained as follows: A1.027-meter subsidence at bench mark L 350 and a 0.254-meter subsidence atneighboring bench mark USP 60 USGS could result from localized subsidence overunderground potash mines. The -O.183-meter change at bench mark B 348 is mostlikely due to movement of the well casing on which the bench mark wasestablished. The survey team reported in 1981 that the well casing was loose.
5

32'3
0'+
0"1
32'1
5'+
in
1,2
67O
.00
3.4,
5
; o
+
12
1011
089
0000
00
1314
o 15o 16
o0
1718
o 19o 20
o 21o
022
23
<:>
o ; o12
3122
1211
20o
00
0012
4"I
Io
,,1,
119
@00
112,
113,
114,
115
1160
@10
9,11
0,11
110
801
07 0106
0105 01
04
0103
0102
o 84
78 o
8079
0081
820
goo
8389
90
'" v ~ o
+32
'30' 61 o 06
064
65 00
+
o 1o
oO:'~
02
3478
9.10 .o 11
0101
0100 99
1J13
3f03
91~
00
00o
1540
4142
1644
0004
347
o46
045
00
0 48
51 o00 49
50
58 o05
962
5556
5b0
530
0
520
66b1
098
o54
00
7473
7267
070
097
o0
00
068
7775
7606
909
6o
00
009
594
63 o
170 18
019 o
o 22
088
2008
700
21 o0
8685
920
o93
091
+32
'15'
230
240
250
260
270
2900
2834
0.30
,31,
32,3
3
350
360
370
<:>
o ; o
Figure
3.~-Bench
mark
locations
with
unique
numbers.
32'3
0'+
,2
0/,2
,20
o.0
-,,-
1.-2
'-l
32"5
+cO ;:, o
43
90
6600
g 37
o 6o 8
o 5o ,3
o 4o 1
o 7o ,7
o ,9
o o ;:, o
~-7
-6,0
00.'
o,,"
9O
~O,"
,,7'1
011
,29
00,1
0,.1
,8,1
10,
12
0,11
0,7 0,
16
0,14 0,1]
-14
-20
o0
,17
00'1
8~1
6'1O
0,1
9
o ,21
,25 o
-24
-22
00,2
6,2
30
g0
,25
,21
in .. i'J o +32
'30'
,1] o 0,
18
-,9
-22
o0 ,1
9 o
,17 o
,18 o
.15.
1500
+
,4,6
,7
o0
0
+ o ,13
-16
"tr
o00
.0-1
6.17
-21
-18
0,16
0'16 ,6
0;:'"
0
.15
00":
,,'\-
1~O
'22
o0
0.23
,,~'\
o-2
0~»
~20
't>
o ,18
,20 o o '2
4
,183
,19
0o
21'8
0,2
00,
200,
16o
0,20 0,20
0,23 o
o'2
1'2
1o '21
-34,
-41 . -170
,190
,18
1800
,20 o o ,21
-21
-18
o0
-22
-21
-21
o0
0
0-17
'26 o
,210
'54
00'2
3
2~0 ,19
,220
,18 o
'190
200
,190
'200 ,200 200
1200
,20
-130
.19
,-17
-20,
-21
,200
'210
,220
o ~ o
+32
015
Figure
4,--Bench
mark
locations
with
movement
in
millimeters,

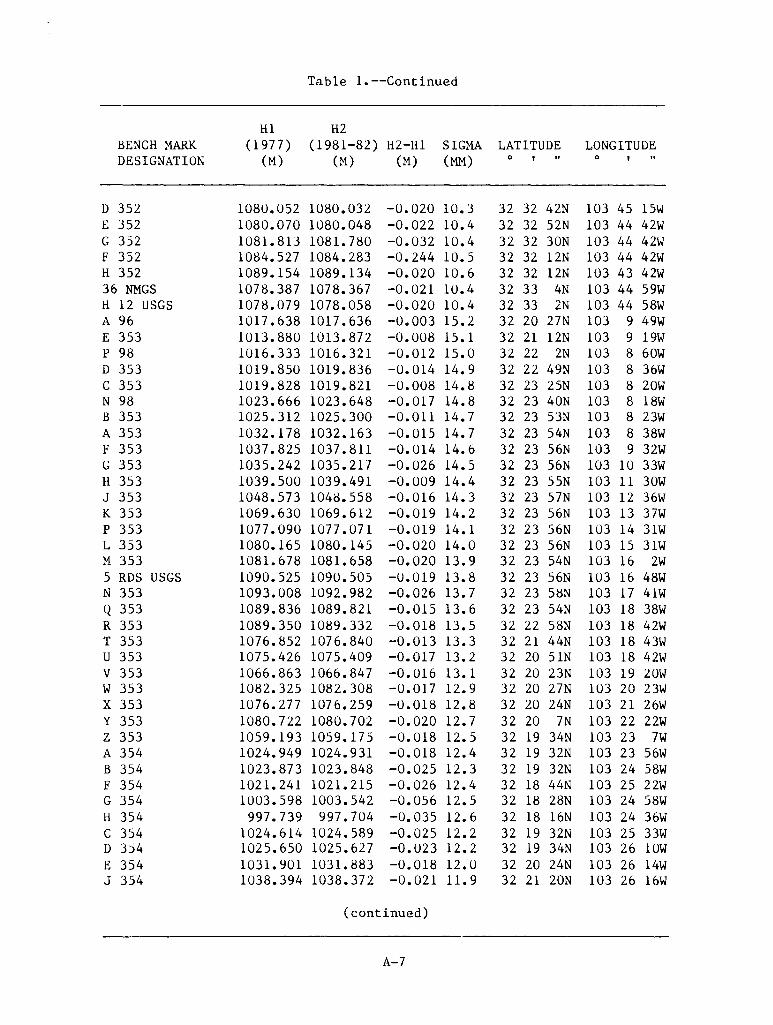
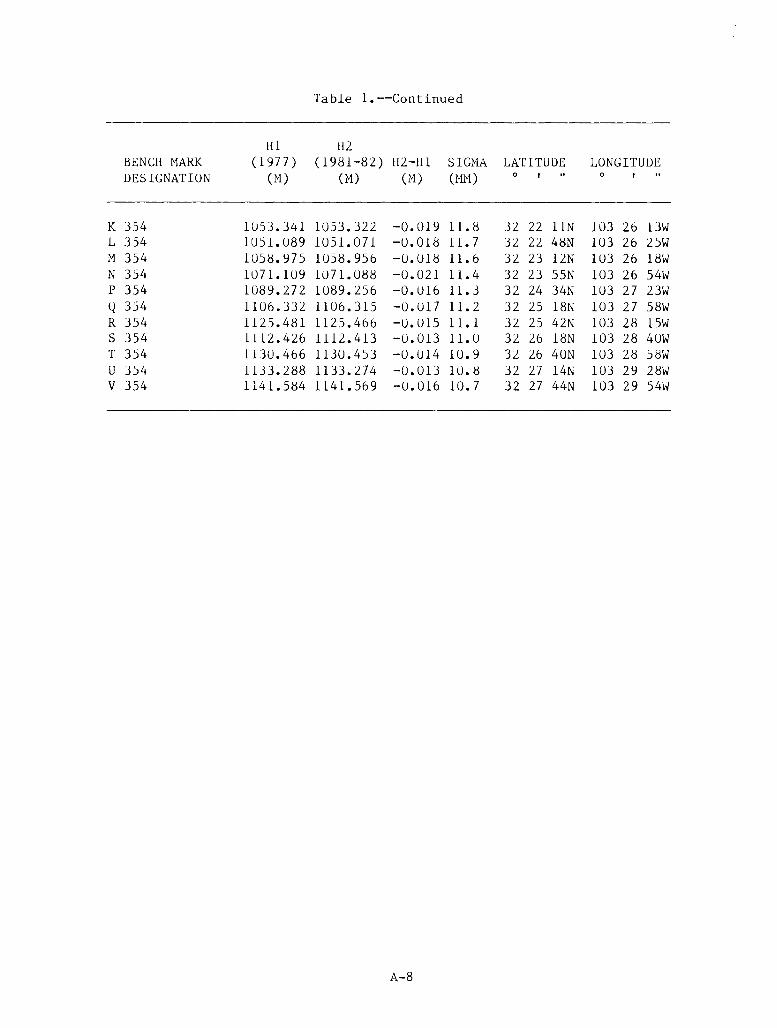
Table 1.--Heights and height differences of common bench marks in
quad N 32104 W, WIPP project in the San Simon area, New Mex.
8
SERIAL NO. BENCH MARK H1(1977) H2(1981) H2-H1 SIGMA LATITUDE LONGITUDE
DESIGNATION (m) (m) (m) (mm)0 , " 0 , "
1 1 BOR 946.617 946.617 0.0 0.0 32 25 3N 104 13 28W2 GAGE USGS 944.217 944.215 -0.002 0.2 32 25 3N 104 13 28W3 B 11 948.095 948.094 -0.001 0.6 32 25 8N 104 13 30W4 z 344 947.716 947.715 -0.001 1.1 32 25 14N 104 13 40W5 N 345 946.404 946.402 -0.002 0.6 32 25 4N 104 13 25W6 P 345 968.274 968.273 -0.002 1.5 32 25 14N 104 12 48W7 U 256 RESET
1960 968.121 968.120 -0.002 2.0 32 25 25N 104 12 26W8 M 96 954.515 954.506 -0.009 2.6 32 25 50N 104 11 34W9 Q 345 961. 435 961. 439 0.004 2.8 32 25 56N 104 11 12W10 R 345 965.034 965.043 0.009 3.0 32 26 ION 104 10 38W11 S 345 974.180 974.185 0.004 3.2 32 26 27N 104 10 8W12 N 96 963.565 963.568 0.003 3.5 32 26 44N 104 9 46W13 T 345 958.845 958.848 0.003 3.0 32 25 60N 104 10 46W14 U 345 962.462 962.469 0.007 3.3 32 26 4N 104 10 12W15 W 345 944.488 944.495 0.006 4.0 32 25 52N 104 8 39W16 X 345 955.688 955.696 0.008 4.4 32 25 46N 104 7 40W17 Y 345 967.002 967.007 0.005 4.7 32 25 41N 104 6 44W18 Z 345 958.721 958.725 0.004 4.9 32 25 32N 104 6 OW19 B 346 961. 753 961. 750 -0.003 5.3 32 25 32N 104 4 22W20 C 346 965.959 965.958 -0.001 5.6 32 25 26N 104 3 22W21 D 346 980.808 980.801 -0.007 5.8 32 25 20N 104 2 24W22 E 346 995.596 995.589 -0.007 6.0 32 25 16N 104 1 22W23 F 346 1,015.947 1,015.938 -0.009 6.2 32 25 12N 104 o 30W
TOTAL NUMBER OF STATIONS IN THIS QUAD = 23
(continued)
-,---_.

9
Table l.--Continued, Quad N 32103 \-1
SERI AL BENCH MARK DESIGNATION Hl( 19711 H21l981)H2-Hl SIGMA LATITUDE LONGITUDENO. (M) (M) (101) (101M) 0 . " 0--
I G 346 1039.589 103'.576 -0.013 6.4 32 25 5N 103 59 301012 H 346 1024.931 1024.91'i -0.016 6.6 32 25 ON 103 58 301013 J 346 1015.943 1015.926 -0 . 017 6.7 32 24 57N 103 57 541014 K 346 1014.613 1014.651 -0.016 6.1 32 24 56N 103 57 381015 L 346 985.351 985.329 -0.02 1 6.8 32 24 52N 103 51 271016 MC 361 USGS 986.174 986.15'1 -0.021 6.13 32 24 52N 103 51 271011 221 IMCe USGS 911.550 977.533 -0.018 6.9 32 24 49N 103 56 581018 UNION 8 USGS 991 .14'5 991.100 -0.045 1.0 32 25 IN 103 56 321019 N 346 984.262 98 '.. 22 8 -0.034 7.3 32 25 22N 103 55 16101
10 LOMMASSON 2 USGS 986.059 986.019 -0.041 1.3 32 25 22N 103 55 1610111 P 346 956.757 956.742 -0.015 7.4 32 24 49N 103 54 4610112 Q 346 958.044 958.021 -0.017 1.6 32 24 22N 103 54 1210113 328 USGS 9'58.575 958.558 -0.017 7.6 32 24 12N 103 53 5410114 338 USGS 952.425 952.408 -0.017 7.6 32 24 5N 103 53 401011 5 T 346 954.496 54.476 -0.020 7.7 32 23 60N 103 53 111011 6 N 34 1 947.579 947.559 -0.020 7.9 32 23 21N 103 54 OW1 7 Q 347 922.303 922.285 -0.017 8.2 32 21 58N 103 54 581011 8 R 347 916.119 916.091 -0.022 8.4 32 21 14N 103 54 4410119 U 348 927.448 927.429 -0.018 8.4 32 20 54N 103 54 2010120 T 348 942.785 942.164 -0.021 8.6 32 20 41N 103 53 2510121 S 348 951.32'1 951.301> -0.023 8.1> 32 20 36N 103 52 6010122 181 IMCC 913 .618 913.591 -0.020 8.6 32 20 23N 103 54 401012 3 T 347 914.817 914.198 -0.019 8.8 32 20 14N 103 55 4410124 S 1 S 6 S 12 S 7 USGLO 917.505 917.4136 -0.019 8.9 32 19 36N 103 55 461012 5 U 34 1 912.438 912.418 -0.020 9.0 32 19 12N 103 55 4610126 S 12 S 7 S 13 S 18 USGLO 914.680 914.659 -0.020 9.1 32 18 44N 103 55 4610127 V 347 922.412 92 2. 393 -0 . 020 9.3 32 18 6N 103 55 4410128 101347 920.378 920.359 -0.020 9.4 32 17 26N 103 55 4410129 X 347 '124.365 924.353 -0.012 9.5 32 17 23N 103 55 6010130 F 350 944.214 944.194 -0.019 9.5 32 17 8N 103 56 210131 G 350 958.743 95 8 . 72 6 -0.017 9.5 32 17 8N 103 55 5810132 H 350 960.527 960.506 -0.020 9.5 32 17 4N 103 55 5810133 J 350 952.209 95 2. 18 9 -0.021 9.5 32 16 60N 103 55 6010134 22 USGS 934.701 934.687 -0.013 9.6 32 16 54N 103 56 1410135 N 348 '133.926 933.906 -0.020 9.1 32 16 18N 103 56 1810136 18 USGS 926.540 926.519 -0.021 9.8 32 15 40N 103 56 2410137 P 348 '145.283 945.261 -0.022 9.9 32 15 22N 103 56 2210138 U 346 <"/55.7'15 955.777 -0.018 7.8 32 24 13N 103 52 38101"39 V 346 9%.086 956.065 -0.022 7.8 32 24 18N 103 52 2510140 104346 900 . 1 96 0 . 16 'i -0.023 7.9 32 23 48N 103 52 29101it 1 X 346 989.470 989.452 -0.019 8.0 32 23 26N 103 51 5110142 Y 346 1007.239 1001.222 -0.017 8.1 32 23 18N 103 51 3610143 l 34" 1016.105 1016.089 -0 . 0V, 8.1 32 23 7N 103 51 2410144 D 347 1002.049 1002.030 -0.019 8.3 32 22 36N 103 52 910145 E 347 1004.028 1004.010 -0.018 8.4 32 22 8N 103 51 5210146 F 347 100.8g 1008.370 -0.018 8.4 32 22 14N 103 51 2210141 G 347 1028.891 1028.875 -0.017 8.6 32 22 28N 103 50 2610148 H 34 1 1023 .825 1021.806 -0.019 8.6 32 22 14N 103 50 2610149 104 USGS 1032.761 1032.745 -0.016 8.'" 32 22 38N 103 49 4810450 J 347 1031.807 1031.797 -0.010 8.7 32 22 46N 103 49 301015 1 K 347 1029.610 1028.602 -0.014 B.7 32 2'1 6N 103 49 32101
(con tinued)
10
Table 1.-Continued, Quad N 32103 W
SERIAL BENCH MARK DESIGNATION Hl(1971) H2119811H2-H1 SIGMA LATITUDE LON G ITUDENO. ('1) ('1) ('1) fMM) 0 , 0
52 M 347 1036.548 1036.528 -0.020 8.7 32 22 58N 103 48 2810153 Y 341 1053.2111053.191 -0.020 8.8 32 23 16N 103 41 2610154 Z 341 1058.280 1058.259 -0.021 8.8 32 23 2N 103 47 261015 5 A 348 10S4.771 1054.752 -0.019 8.8 32 23 33N 103 46 2410156 B 348 1069.837 1069.655 -0.183 9.0 32 23 48N 103 45 2410157 C 348 1089.172 1089.153 -0.019 9.0 32 24 4N 103 44 2210158 0 348 1078.607 1078.587 -0.019 9.2 32 24 42N 103 44 2210159 E 348 1076.809 1076.188 -0 . 022 9.3 32 24 42N 103 44 5810160 F 348 1081.177 1081.759 -0.018 9.3 32 25 28N 103 44 241016 1 G 34 8 1079.860 1079.843 -0.017 9.4 32 26 3N 103 44 3010162 H 348 1109.731 1109.120 -0.011 9.2 32 24 20N 103 43 2010163 M 348 1130.994 1130.916 -0.018 9.4 32 24 34N 103 42 2010164 Q 348 1135.025 1135.010 -0.015 9.6 32 24 52N 103 41 1210165 C 355 1150.720 1150.705 -0.015 9.6 32 24 54N 103 40 6010166 L 349 1064.592 1064.576 -0.016 8.9 32 22 51N 103 46 2410161 p 349 1011.614 1011.594 -0.020 9.1 32 22 12N 103 45 5410168 Q 349 1019.001 1078.981 -0.020 9.2 32 22 ION 103 45 2410169 R 349 1010.022 1070.002 -0.020 9.3 32 21 44N 103 45 2110170 S 349 1082.294 1082.275 -0.020 9.2 32 22 24N 103 45 2610171 U 349 1068.260 1068.240 -0.021 9.3 32 23 2N 103 45 2210112 M 349 1061.042 1061.023 -0.018 9.0 32 22 8N 103 46 5010113 K 349 1031.649 1037.629 -0 . 021 9.0 32 22 6N 103 47 5010114 N 349 1031.5531031.536 -0.018 9.1 32 22 12N 103 48 2610175 J 349 1033.466 1033.445 -0.021 9.0 32 21 12N 103 47 4810176 U 355 1049.331 1049.311 -0.02 1 9.1 32 21 16N 103 47 610171 H 349 1019.996 1019.914 -0.022 9.0 32 21 21N 103 48 1810178 314 USGS 1018.808 1018.183 -0.025 9.0 32 21 20N 103 49 210179 F 349 1008.650 1008.628 -0.022 8.9 32 20 34N 103 49 3110180 E 349 1005.843 1005.819 -0.024 8.9 32 20 29N 103 49 5410181 C 349 1010.301 1010.275 -0 .026 9.1 32 20 15N 103 48 5610182 A 349 1001.146 1001.124 -0.023 8.9 32 19 51N 103 49 5210183 Z 348 999.699 999.674 -0.025 8.9 32 19 32N 103 49 5010184 X 348 918 .719 918.698 -0.02 1 8.8 32 19 46N 103 51 1410185 101348 959.486 959.461 -0.019 8.7 32 19 50N 103 52 6101
86 R 348 941.445 941.422 -0.022 8.1 32 19 59N 103 53 4101
81 218 USGS 959.401 959.353 -0.054 8.1 32 21 9N 103 52 551018'J V 348 964.551 964.526 -0.026 8.8 32 21 16N 103 52 5610189 V 349 1010.030 1010.009 -0.021 9.0 32 19 42N 103 48 5010190 Y 349 1011.733 1011.715 -0.018 9.0 32 19 44N 103 48 8101
91 101349 1016.662 1016.638 -0.024 9.2 32 19 46N 103 41 2010192 X 349 1018.099 1018.079 -0 . 020 9.1 32 20 20N 103 47 2410193 Z 349 1040.309 1040.288 -0.021 9.2 32 20 40N 103 46 2810194 A 350 1047.915 1047.894 -0.02 1 9.2 32 21 4N 103 45 2210195 B 350 1065.741 1065.120 -0 . 02 1 9.2 32 21 30N 103 44 2610196 E 350 1059.930 1059.907 -0.023 9.2 32 21 18N 103 44 3010197 0 350 1089.218 1089.202 -0.016 9.2 32 22 18N 103 44 2410198 C 350 1083.146 1083.129 -0.017 9.1 32 23 ION 103 44 1810199 K 351 9'>6.904 956.898 -0.006 1.8 32 24 44N 103 52 36101
100 L 351 967.062 967.046 -0.016 1.9 32 25 21N 103 52 40101101 M 351 964.920 964.904 -0.016 8.0 32 25 SON 103 52 40101102 N 351 955.058 Q55.041 -0.017 8.1 32 26 41N 103 52 SOW
(con tinued)
CONCLUSION
The first 22 bench marks located in Carlsbad and east of the city indicatelittle movement. The 122 remaining bench marks indicate a small but consistent
subsidence of approximately 4.6 mm/yr for the area. Large elevation differencesat bench marks L 350 and USP 60 USGS may be the result of localized subsidence
over potash mines in the area, while the large change in elevation of bench markB 348 is probably due to an unstable monument.
ACKNOWLEDGMENTS
I thank Mr. Johan J. Kok for
accept NGS data, Ms. Janice M.Young for helpful criticism of
by NGS Field Party G-35, under
acknowledged.
helpful comments and for modifying SCAN-II to
Bengston for programing aid, and Mr. Gary M.the draft report. The high-quality observations
the direction of Mr. Robert Kokesh, are also
This project was funded by the Sandia National Laboratories under contract
document no. 68-1766, dated April 21, 1981.
11
Table l.--Continued, Quad N 32103 W
SERIAL BENCH MARK DESIGNATION HI 119771 H2 119811 H2-H 1 SIGMA LATITUDE LONGITUDENO. (M) (M) (M) (MM) 0 , " 0
103 J 351 955.768 955.754 -0.014 9.2 32 27 8N 103 52 55W104 H 351 961.174 961.158 -0.016 8.2 32 27 44N 103 52 56W105 G 351 965.019 965.011 -0.007 8.3 32 28 12N 103 53 8W106 F 351 982.011 982.000 -0.011 8.4 32 28 42N 103 53 52W107 M 350 986.678 98.6.666 -0.012 8.5 32 29 19N 103 54 20W108 F 97 1001.335 1001.324 -0 . 0 11 8.5 32 29 56N 103 54 40W109 B 351 1027.416 1027.406 -0.010 6.6 32 30 6N 103 54 8W110 A 351 1043.236 1043.230 -0.007 8.6 32 30 4N 103 54 loW111 Z 350 1019.428 1019.420 -0.008 6.6 32 30 ION 103 54 15W112 Y 350 1047.232 1047.221 -0.011 8.6 32 30 36N 103 54 34W113 X 350 1049.063 1049.056 -0.007 8.6 32 30 32N 103 54 36W114 W 350 1037.370 1037.359 -0.010 8.7 32 30 30N 103 54 37W115 U 350 1022.458 1022.447 -0.011 8.7 32 30 26N 103 54 38W116 H 7 USGS 1014.831 1014.802 -0.029 8.7 32 30 26N 103 54 58W117 USP 60 USGS 1024.619 1024.365 -0.254 8.7 32 30 31N 103 55 12W118 L 350 1030.313 1029.286 -1.027 8.7 32 30 35N 103 55 14W119 PO KERN 1 USGS 1034.007 1033.998 -0 . 00 9 8.8 32 30 54N 103 55 46W120 K 350 1037.743 1037.736 -0.007 8.8 32 31 ION 103 56 4W121 N 350 1029.635 1029.628 -0.007 8.8 32 31 8N 103 56 44W122 P 352 1037.325 1037.318 -0.006 8.8 32 31 12N 103 57 20W123 0 97 1034.450 1034.447 -0.004 8.9 32 31 18N 103 58 OW124 C 351 1045.223 1045.217 -0.006 9.8 32 31 14N 103 55 34W
"--.--
REFERENCES
Federal Geodetic Control Committee» 1974: Classification» Standards, of Accuracy,
and General Specifications of Geodetic Control Surveys, 12 pp.
Federal Geodetic Control Committee» 1975» rev. 1980: Specifications to SupportClassifications» Standards of Accuracy, and General Specifications of Geodetic
Control Surveys. Superintendent of Documents» U.S. Government PrintingOffice» Washington, D. C.» 46 pp. (set).
Kok, J. J.» Ehrnsperger W.,and Rietveld H., 1980: The 1979 adjustment of the
united European levelling network (UELN) and its analysis of precision andreliability. Proceedings of the Second International Symposium on Problems
Related to the Redefinition of North American Vertical Geodetic Networks,May 26-30» 1980» Canadian Institute of Surveying, Ottawa, 455-483.
Whalen» C. T.» 1978: Control leveling. NOAA Technical Report NOS 73 NGS 8»National Geodetic Information Center» NOS/NOAA» Rockville» Md., 21 pp.
Whalen» C. T. and Balazs» E. I.» 1976: Test results of first-order class IIIleveling. NOAA Technical Report NOS 68 NGS 4, National Geodetic InformationCenter» NOS/NOAA» Rockville, Md.» 30 pp.
12
13
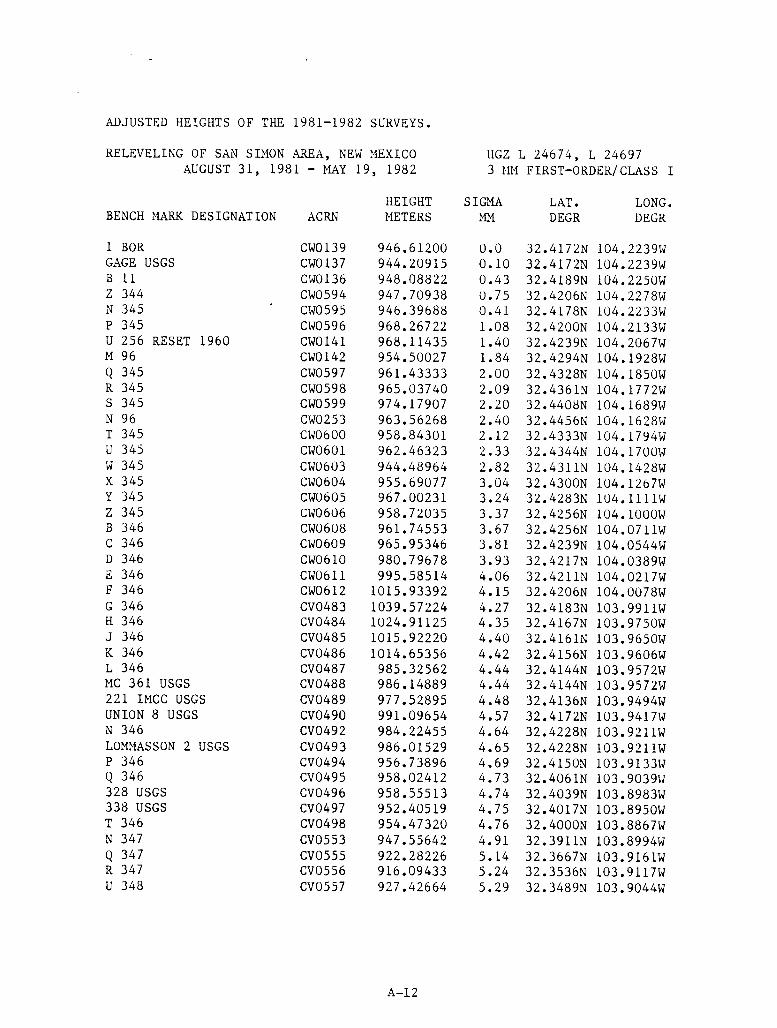
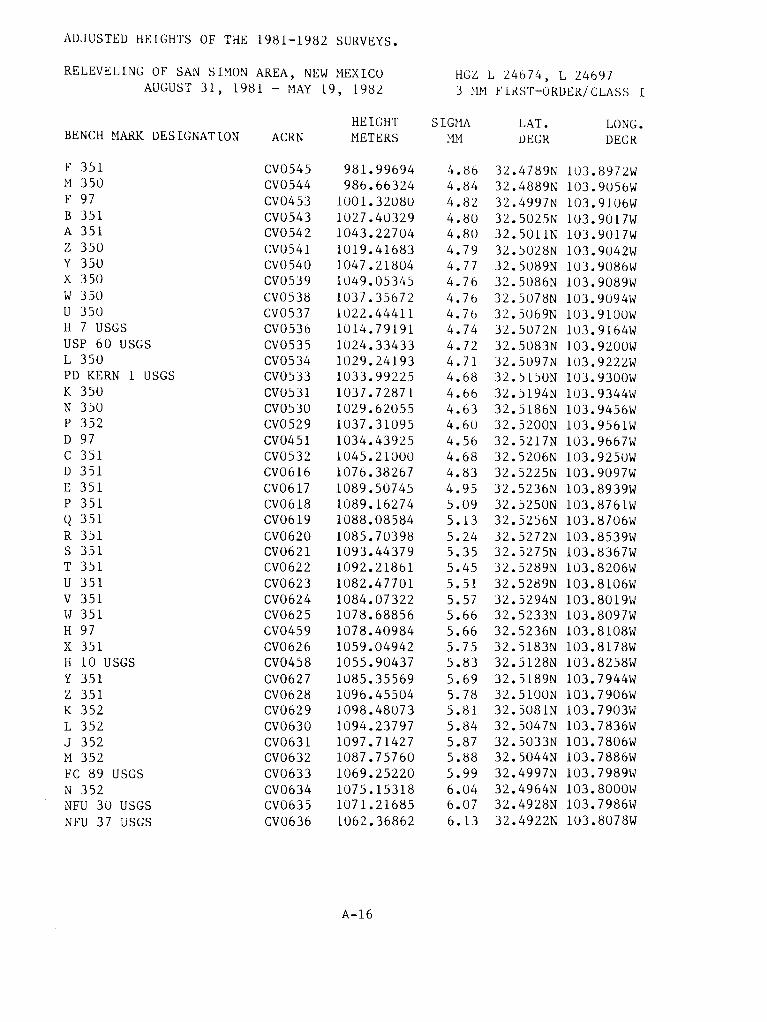
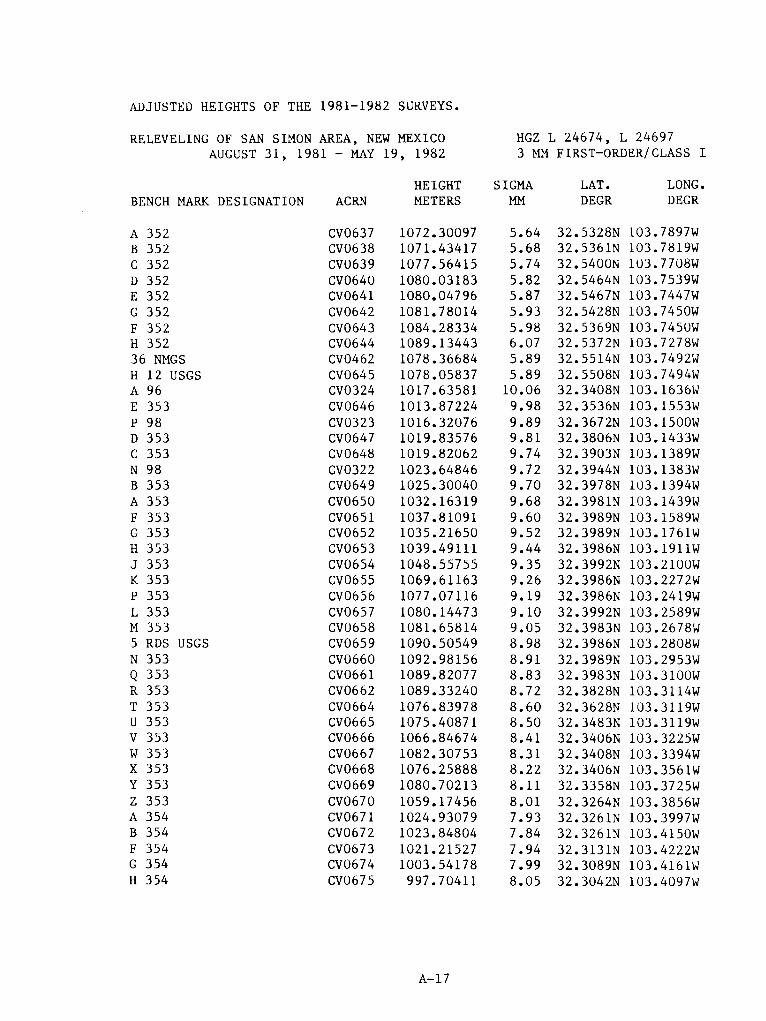
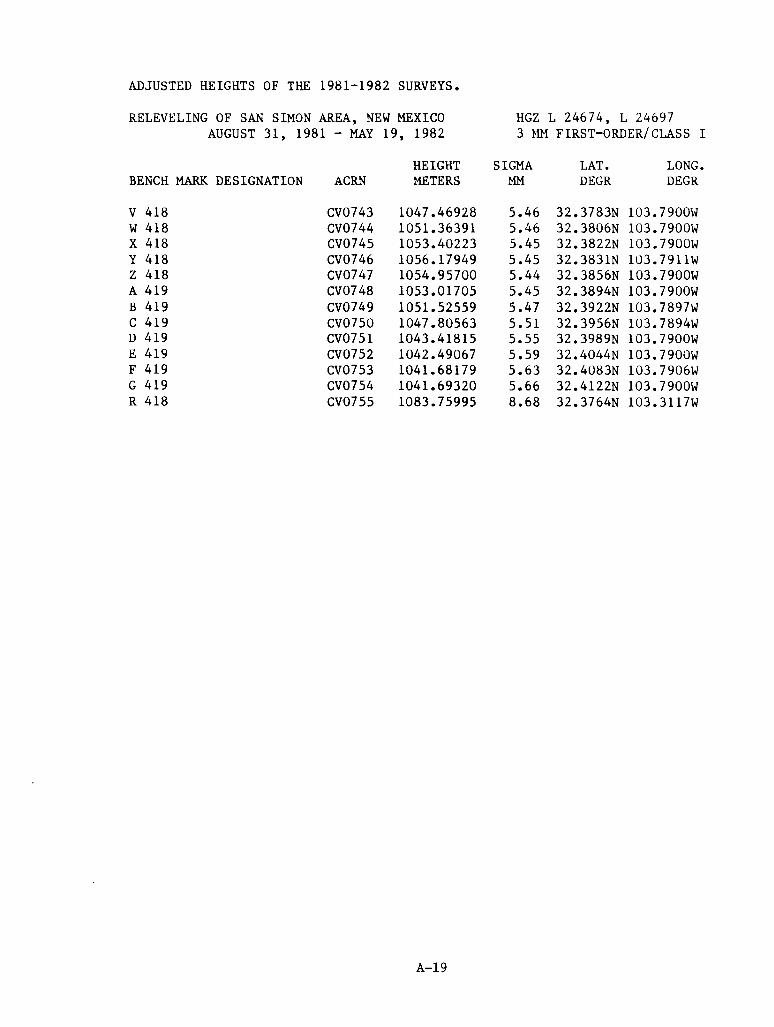
APPENDIX.--ADJUSTED HEIGHTS OF THE 1981 SURVEY
RELEVELING OF SAN SIMON AREA, NEW MEXICO HGZ L 24674AUGUST 31 -SEPTEMBER 30, 1981 3 MM FIRST-oRDER/CLASS I
HEIGHT SIGMA LAT. LONG.BENCH MARK DESIGNATION ACRN METERS MM DEGR DEGR
1 BOR CW0139 946.61200 0.0 32.4172N 104.2239WGAGE USGS CW0137 944.20915 0.10 32.4172N 104.2239WB 11 CW0136 948.08822 0.43 32.4189N 104.225OWZ 344 CW0594 947.70938 0.75 32.4206N 104.2278WN 345 CW0595 946.39688 0.41 32.4178N 104.2233WP 345 CW0596 968.26722 1.08 32.4200N 104.2133WU 256 RESET 1960 CW0141 968.11435 1.40 32.4239N 104.2067WM 96 CW0142 954.50027 1.84 32.4294N 104.1928WQ 345 CW0597 961.43333 2.00 32.4328N 104.185OWR 345 CW0598 965.03743 2.09 32.4361N 104.1772WS 345 CW0599 974.17914 2.20 32.4408N 104.1689WN 96 CW0253 963.56282 2.40 32.4456N 104.1628WT 345 CW0600 958.84297 2.12 32.4333N 104.1794WU 345 CW0601 962.46312 2.33 32.4344N 104.1700WV 345 CW0603 944.48932 2.82 32.4311N 104.1428WX 345 C\.,r0604 955.69033 3.05 32.4300N 104.1267WY 34) CW0605 967.00176 3.24 32.4283N 104.1111WZ 345 CW0606 958.71972 3.38 32.4256N 104.100OWB 346 CW0608 961. 74468 3.68 32.4256N 104.0711WC 346 CW0609 965.95249 3.83 32.4239N 104.0544WD 346 CW0610 980.79570 3.95 32.4217N 104.0389WE 346 CW0611 995.58393 4.08 32.4211N 104.0217WF 346 CW0612 1015.93260 4.18 32.4206N 104.0078WG 346 CV0483 1039.57079 4.30 32.4183N 103.9911WH 346 CV0484 1024.90968 4.39 32.4167N 103.975OWJ 346 CV0485 1015.92056 4.43 32.4161N 103.965OWK 346 CV0486 1014.65189 4.45 32.4156N 103.9606WL 346 CV0487 985.32391 4.48 32.4144N 103.9572WMC 361 USGS CV0488 986.14717 4.48 32.4144N 103.9572W221 IMCC USGS CV0489 977.52717 4.53 32.4136N 103.9494WUNION 8 USGS CV0490 991.09460 4.61 32.4172N 103.9417WN 346 CV0492 984.22243 4.70 32.4228N 103.9211WLOMMASSON 2 USGS CV0493 986.01317 4.70 32.4228N 103.9211WP 346 CV0494 956.73671 4.76 32.4150N 103.9133WQ 346 CV0495 958.02173 4.80 32.4D61N 103.9039W328 USGS CV0496 958.55269 4.82 32.4039N 103.8983W338USGS CV0497 952.40273 4.82 32.4017N 103.895OWT 346 CV0498 954.47066 4.84 32.4000N 103.8867WN 347 CV0553 947.55387 5.00 32.3911N 103.8994WQ 347 CV0555 922.27967 5.25 32.3667N 103.9161WR 347 CV0556 916.09172 5.36 32.3536N 103.9117WU 348 CV0557 927.42402 5.42 32.3489N 103.9044W
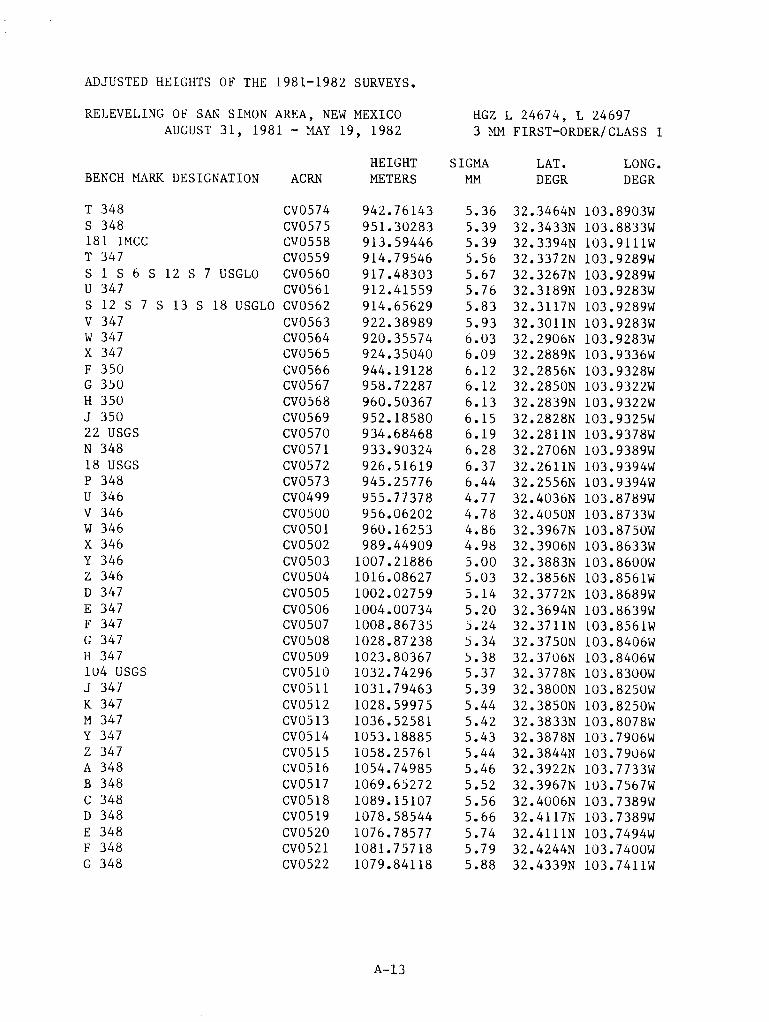
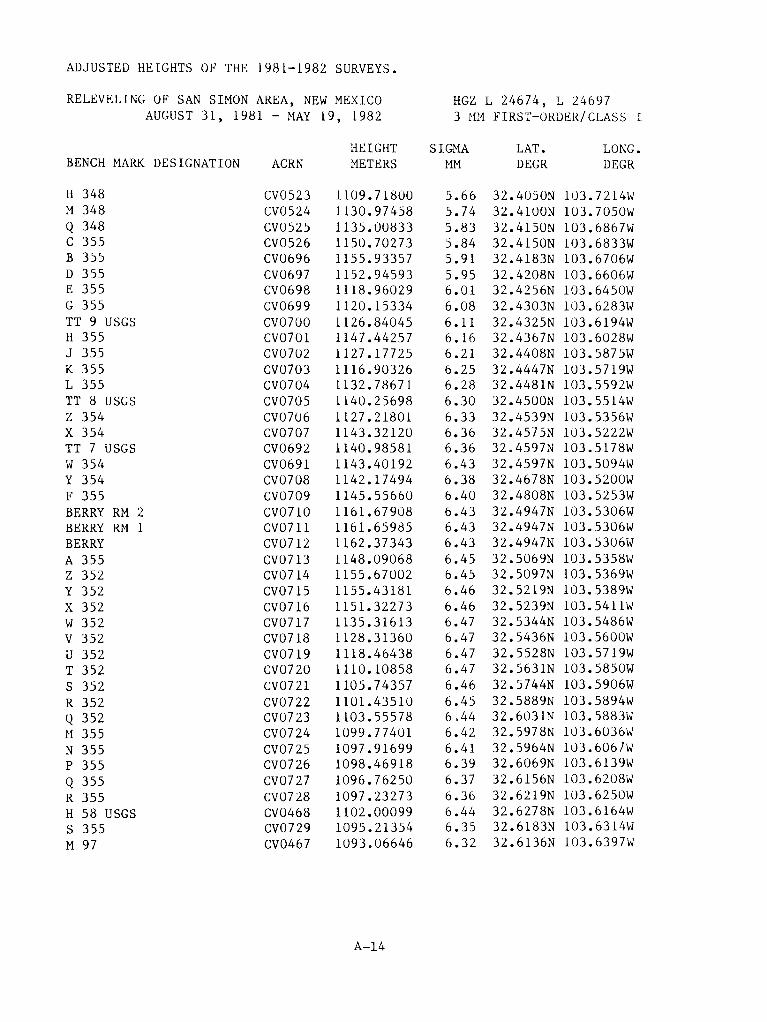
14
RELEVELING OF SAN SIMON AREA, NEW MEXICO HGZ L 24674AUGUST31 - SEPTEMBER 30, 1981 3 MM FIRST-oRDER/CLASS I
HEIGHT SIGMA LAT. LONG.BENCH MARK DESIGNATION ACRN METERS MM DEGR DEGR
T 348 CV0574 942. 75880 5.50 32.3464N 103.8903WS 348 CV0575 951.30019 5.54 32.3433N 103.8833W181 IMCC CV0558 913.59184 5.52 32.3394N 103.9111WT 347 CV0559 914.79284 5.69 32.3372N 103.9289WS 1 S 6 S 12 S 7 US GLO CV0560 917.48041 5.79 32.3267N 103.9289WU 347 CV0561 912.41297 5.88 32.3189N 103.9283WS 12 S 7 S 13 S 18 USGLO CV0562 914.65367 5.95 32.3117N 103.9289WV 347 CV0563 922.38727 6.05 32.3011N 103.9283WW 347 CV0564 920.35312 6.15 32.2906N 103.9283WX 347 CV0565 924.34778 6.20 32.2889N 103.9336WF 350 CV0566 944.18866 6.23 32.2856N 103.9328WG 350 CV0567 958.72025 6.24 32.2850N 103.9322WH 350 CV0568 960.50105 6.24 32.2839N 103.9322WJ 350 CV0569 952.18318 6.26 32.2828N 103.9325W22 USGS CV0570 934.68206 6.30 32.2811N 103.9378WN 348 CV0571 933.90063 6.39 32.2706N 103.9389W18USGS CV0572 926.51357 6.48 32.2611N 103.9394wP 348 CV0573 945.25514 6.54 32.2556N 103.9394WU 346 CV0499 955.77121 4.85 32.4036N 103.8789WV 346 CV0500 956.05944 4.86 32.4050N 103.8733WW 346 CV0501 960.15990 4.94 32.3967N 103.8750WX 346 CV0502 989.44637 5.07 32.3906N 103.8633WY 346 CV0503 1007.21611 5.10 32.3883N 103.860OWZ 346 CV0504 1016.08351 5.14 32.3856N 103.8561WD 347 CV0505 1002.02472 5.26 32.3772N 103.8689WE 347 CV0506 1004.00441 5.33 32.3694N 103.8639WF 347 CV0507 1008.86437 5.38 32.3711N 103.8561WG 347 CV0508 1028.86925 5.52 32.3750N 103.8406WH 347 CV0509 1023.80054 5.55 32.3706N 103.8406W104 USGS CV0510 1032.73976 5.57 32.3778N 103.8300WJ 347 CV0511 1031. 79140 5.59 32.3800N 103.8250WK 347 CV0512 1028.59652 5.64 32.3850N 103.825OWM 347 CV0513 1036.52249 5.64 32.3833N 103.8078WY 347 CV0514 1053.18542 5.69 32.3878N 103.7906WZ 347 CV0515 1058.25380 5.72 32.3844N 103.7906WA 348 CV0516 1054.74649 5.71 32.3922N 103.7733WB 348 CV0517 1069.64932 5.80 32.3967N 103.7567WC 348 CV0518 1089.14763 5.87 32.4006N 103.7389WD 348 CV0519 1078.58201 5.96 32.4117N 103.7389WE 348 CV0520 1076.78234 6.04 32.4111N 103.7494WF 348 CV0521 1081. 75374 6.08 32.4244N 103.740OWG 348 CV0522 1079.83774 6.17 32.4339N 103.7411W
15
RELEVELING OF SAN SIMON AREA, NEW MEXICO HGZ L 24674AUGUST31 - SEPTEMBER 30, 1981 3 MM FIRST-oRDER/CLASS I
HEIGHT SIGMA LAT. LONG.BENCH MARK DESIGNATION ACRN METERS MM DEGR DEGR
H 348 CV0523 1109.71444 6.02 32.4050N 103.7214WM 348 CV0524 1130.97091 6.15 32.4100N 103.7050WQ 348 CV0525 1135.00454 6.28 32.4150N 103.686lWC 355 CV0526 1150. 69911 6.31 32.4150N 103.6833wL 349 CV0593 1064.57035 5.75 32.3828N 103.7736WP 349 CV0594 1071.58904 5.89 32.3700N 103.7656WQ 349 CV0595 1078.97569 5.95 32.3683N 103.7572WR 349 CV0596 1069.99626 6.03 32.3614N 103.7550WS 349 CV0597 1082.26950 5.99 32.3733N 103.7572WU 349 CV0599 1068.23439 6.08 32.3850N 103.7569WM 349 CV0600 1061.01808 5.80 32.3689N 103.7806WK 349 CV0601 1037.62332 5.84 32.3683N 103.7972WN 349 CV0602 1031.53021 5.92 32.3700N 103.8072WJ 349 CV0603 1033.43958 5.85 32.3533N 103.796lWU 355 CV0604 1049.31145 5.95 32.3544N 103.7850WH 349 CV0605 1019.96822 5.85 32.3544N 103.8053W374 USGS CV0606 1018.77714 5.84 32.3556N 103.8172WF 349 CV0607 1008.62297 5.80 32.3417N 103.8250WE 349 CV0608 1005.81356 5.78 32.3411N 103.831lWC 349 CV0609 1010.26949 5.94 32.3361N 103.8161WA 349 CV0582 1001.71841 5.73 32.3308N 103.8306wZ 348 CV0581 999.66842 5.73 32.3256N 103.830OWX 348 CV0580 978.69237 5.69 32.3297N 103.8533wW 348 CV0579 959.46116 5.65 32.3303N 103.8694wR 348 CV0578 941. 41708 5.59 32.3331N 103.8847W218 USGS CV0576 959.34745 5.64 32.3528N 103.8822WV 348 CV0577 964.52016 5.66 32.3550N 103.8822WV 349 CV0583 1010.00397 5.82 32.3283N 103.8136WY 349 CV0584 1011.71010 5.87 32.3289N 103.8019WW 349 CV0585 1016.63224 5.98 32.3294N 103.7889wX 349 CV0586 1018.07381 5.92 32.3394N 103.790OWZ 349 CV0587 1040.28262 5.96 32.3447N 103.7736WA 350 CV0588 1047.88893 5.98 32.3517N 103.7561WB 350 CV0589 1065.71467 5.98 32.3578N 103.7406WE 350 CV0590 1059.90162 6.02 32.3550N 103.741lWD 350 CV0591 1089.19635 5.96 32.3717N 103.7400WC 350 CV0592 1083. 12340 5.92 32.3861N 103.7389WK 351 CV0552 956.89260 4.87 32.4128N 103.876lWL 351 CV0551 967.04010 4.89 32.4242N 103.8778WM 351 CV0550 964.89840 4.89 32.4306N 103.8778WN 351 CV0549 955.03572 4.91 32.4444N 103.8806WJ 351 CV0548 955.74895 4.91 32.4522N 103.881lW
16
RELEVELING OF SAN SIMON AREA, NEW MEXICO HGZ L 24674AUGUST 31 - SEPTEMBER 30, 1981 3 MM FIRST-oRDER/CLASS I
HEIGHT SIGMA LAT. LONG.BENCH MARK DESIGNATION ACRN METERS MM DEGR DEGR
H 351 CV0547 961.15309 4.91 32.4622N 103.8817WG 351 CV0546 965.00599 4.91 32.4697N 103.8853WF 351 CV0545 981. 99430 4.90 32.4789N 103.8972WM 350 CV0544 986.66060 4.89 32.4889N 103.9056WF 97 CV0453 1001.31814 4.88 32.4997N 103.9106WB 351 CV0543 1027.40063 4.86 32.5025N 103.901lWA 351 CV0542 1043.22438 4.86 32.5011N 103.901lWZ 350 CV0541 1019.41417 4.85 32.5028N 103.9042WY 350 CV0540 1047.21538 4.84 32.5089N 103.9086wX 350 CV0539 1049.05079 4.84 32.5086N 103.9089WW 350 CV0538 1037.35405 4.83 32.5078N 103.9094WU 350 CV0537 1022.44118 4.83 32.5069N 103.910OWH 7 USGS CV0536 1014.79641 4.82 32.5072N 103.9164WUSP 60 USGS CV0535 1024.35967 4.81 32.5083N 103.9200WL 350 CV0534 1029.28023 4.80 32.5097N 103.9222WPD KERN 1 USGS CV0533 1033.99273 4.78 32.5150N 103.930OWK 350 CV0531 1037.73087 4.72 32.5194N 103.9344WN 350 CV0530 1029.62263 4.68 32.5186N 103.9456WP 352 CV0529 1037.31295 4.65 32.5200N 103.9561WD 97 CV0451 1034.44118 4.61 32.5217N 103.9667WC 351 CV0532 1045.21148 4.74 32.5206N 103.925OWA 417 CW0602 948.39642 2.58 32.4333N 104.1561WB 417 CW0607 959.56016 3.52 32.4261N 104.0872WC 417 CV0491 992.60537 4.64 32.4222N 103.9383WQ 417 CW0613 951.90528 2.74 32.4544N 104.1506WY 95 RESET 1960 CW0255 957.74893 2.97 32.4633N 104.1394WP 417 CW0614 970.44148 3.,.22 32.4739N 104.1244WZ 95 RESET 1960 CW0257 973. 58466 3.42 32.4833N 104.111lWN 417 CW0615 981.61094 3.58 32.4922N 104.0994WM 417 CW0616 987.3.0807 3.n 32.5006N 104.0883WL 417 CW0617 997.4$904 3.86 32.5083N 104.0767WK417 CW0618 1006.45871 3.99 32.5167N 104.0628WJ417 CW0619 1011.29919 4.12 32.5239N 104.0478WM 1 NMGS CWOl22 1008.66722 4.25 32.5339N 104.0339WH 417 CW0620 1011.08517 4.37 32.5300N 104.0172WC 97 RESET 1960 CW0124 1017.09980 4.46 32.5275N 104.0006WG 417 CV0527 1024.31381 4.53 32.5250N 103.9861WF 417 CV0528 1034.54852 4.57 32.5233N 103.9761WD 417 CV0598 1080.83789 6.05 32.3742N 103.7500WE 417 CV0554 927.75991 5.13 32.3800N 103.9106W


U.S. DEPARTMENTOF COMMERCE
National Oceanic and Atmospheric AdministrationNational Geodetic Survey, OAI C18x2Rockville. Maryland 20852
POSTAGE AND FEES PAID
US DEPARTMENT OF COMMERCE
COM.210
THIRD CLASS MAILOFFICIAL BUSINESS
U.S.MAIL