vermont electricity overview -- richard watts, june 9, 2004
TRANSCRIPT

Vermont Electricity Overview
-- Richard Watts, June 9, 2004

2001 Electric Use2001 Vermont Own Load Electric Energy
Supply
Nuclear36.3%
Renewable4.9%Hydro
6.9%
Hydro Quebec34.9%
System14.4%
Gas1.0%
Coal0.0%
Oil1.6%

Vermont’s Electric Needs• 1,000 MW peak demand now
– Growing at about 2 MW per year since 1992; 100 MW 1984-92, But 550 MW will need to be replaced in 2012- 2015 timeframe!!
• Current Sources– Vermont Yankee - about 30% demand and 36% energy
• Contract Expires 2012 – Hydro Quebec - about 30% demand and 32% energy
• Contract expires from 2012 to 2020, most expiring in 2015– Independent Power Producers - about 10% demand and 5%
energy (all renewable) • Contracts expire 2008 to 2020+
• Other sources - about 30% of demand and 27% of energy

Vermont Gross Electric Energy by Source1980-2001

Slow growth in annual peak, summer peak rising faster
5960
6162
6364
6566
6768
6970
7172
7374
7576
7778
7980
8182
8384
8586
8788
8990
9192
9394
9596
9798
9900
01
0
100
200
300
400
500
600
700
800
900
1,000
1,100T
hou
sand
s
KW
1.10
1.20
1.30
1.40
1.50
1.60
1.70
Power Year Peak Summer Peak Ratio - Winter Max / Summer Minimum
Power Year Peak - 997,020 - December 1999Power Year Peak - 967,846 - December 1989
VERMONT STATE PEAK LOAD - POWER PERIODPERIOD NOVEMBER 1, TO OCTOBER 31

Load Forecast
Vermont Peak Loads by Season
750
850
950
1050
1150
1250
1350
1450
1550
1989
1990
1991
1992
1993
1994
1995
1996
1997
1998
1999
2000
2001
2002
2003
2004
2005
2006
2007
2008
2009
2010
2011
2012
2013
2014
2015
2016
2017
2018
2019
2020
Year
Load
(MW
s)
Summer Demand Winter Demand Summer Net DSM (DPS Base)

Positive steps:
• Since 1984 peak demand in VT has risen by ~125 MW, all met by new, in-state renewables
• 40 MW - small hydro, IPP, WEC, GMP • 73 MW - McNeil and Ryegate wood chip plants• 6 MW - Searsburg wind project• small landfill gas projects – Brattleboro and Burlington
• Vermont utilities’ energy efficiency efforts, including Efficiency Vermont, have saved over 80 MW of demand
• Bottom line – current portfolio mix is very high in renewables, and America’s lowest in CO2
• BUT – VT still imports a large % of our electricity
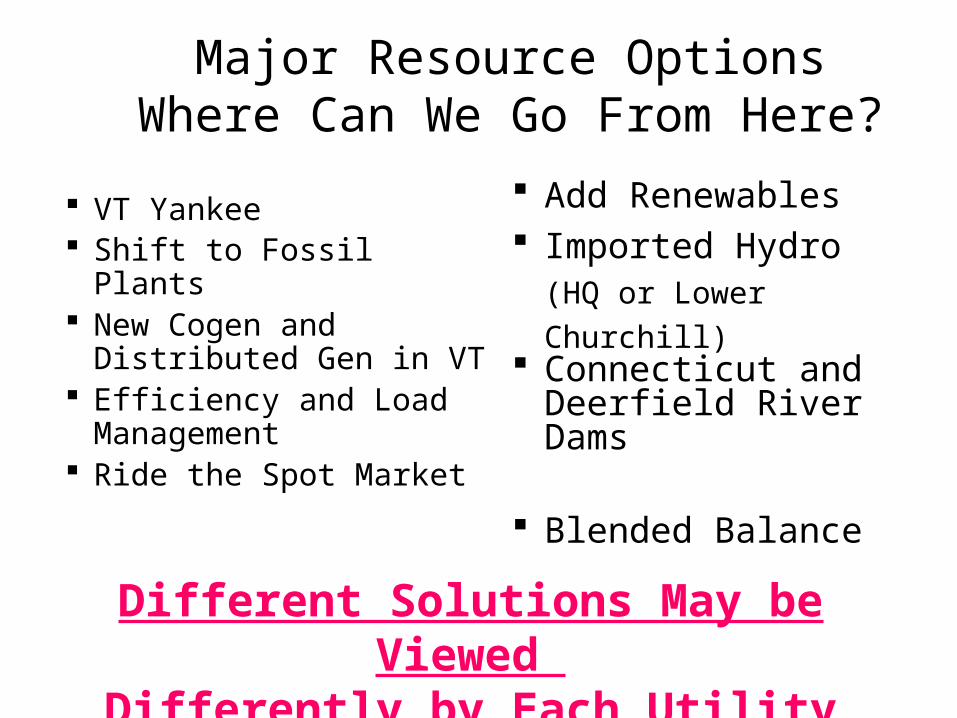
VT Yankee Shift to Fossil Plants New Cogen and
Distributed Gen in VT Efficiency and Load
Management Ride the Spot Market
Add Renewables Imported Hydro (HQ
or Lower Churchill) Connecticut and
Deerfield River Dams
Blended Balance
Major Resource OptionsWhere Can We Go From Here?
Different Solutions May be Viewed Differently by Each Utility
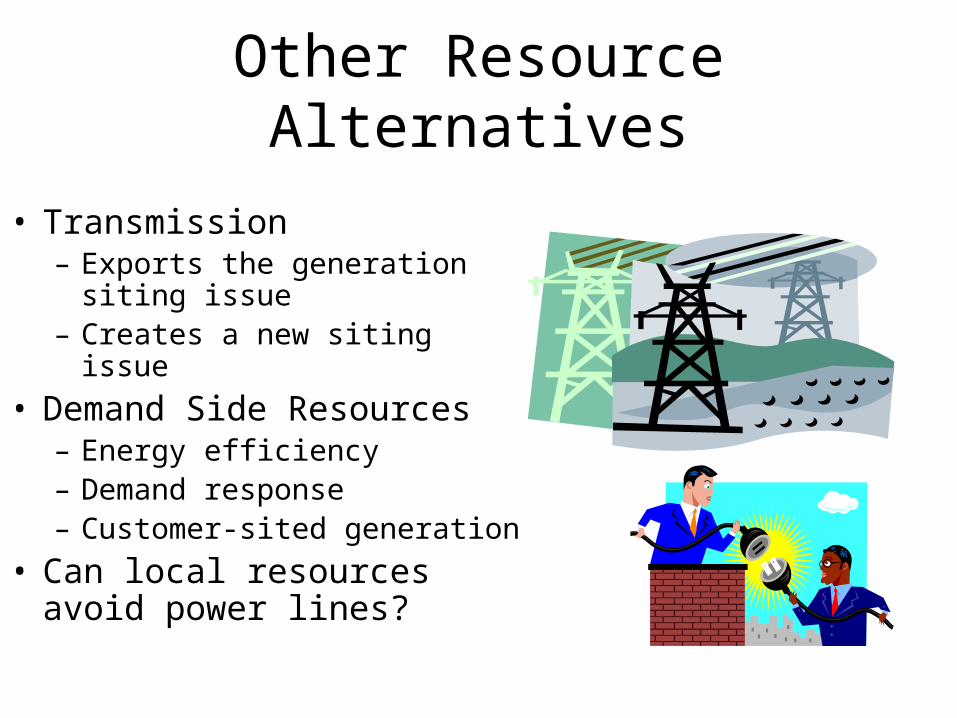
Other Resource Alternatives
• Transmission– Exports the generation siting
issue– Creates a new siting issue
• Demand Side Resources– Energy efficiency– Demand response– Customer-sited generation
• Can local resources avoid power lines?

Reliance on Existing Paradigm
• Big power lines• Big plants (300)• Generation
meets Load -- 1/60th of Second
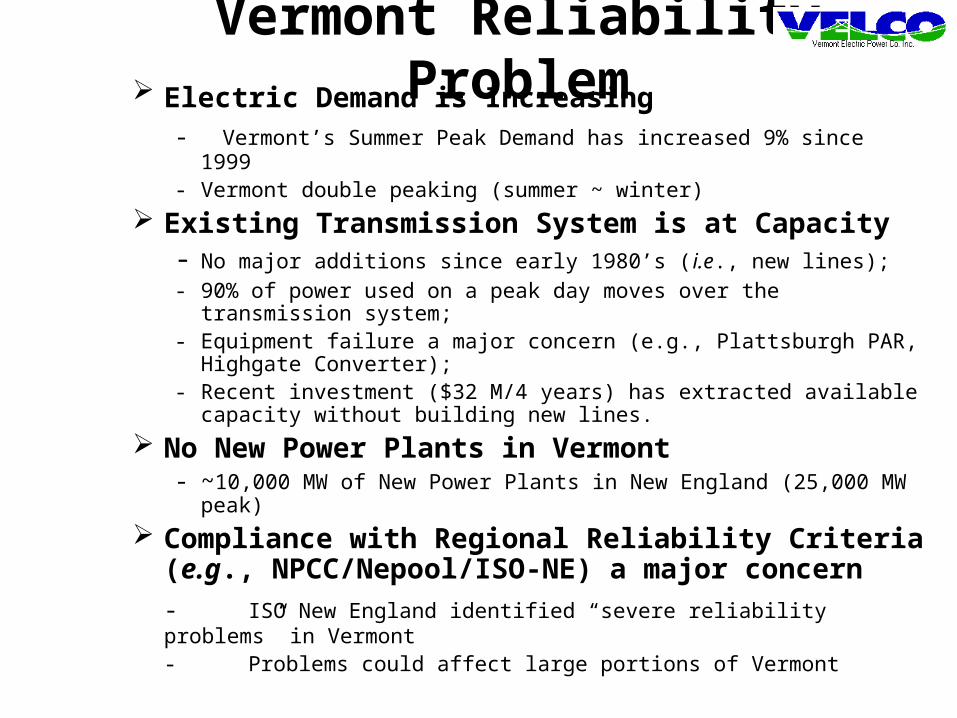
Vermont Reliability Problem Electric Demand is Increasing
- Vermont’s Summer Peak Demand has increased 9% since 1999 - Vermont double peaking (summer ~ winter)
Existing Transmission System is at Capacity- No major additions since early 1980’s (i.e., new lines);- 90% of power used on a peak day moves over the transmission
system;- Equipment failure a major concern (e.g., Plattsburgh PAR,
Highgate Converter);- Recent investment ($32 M/4 years) has extracted available
capacity without building new lines.
No New Power Plants in Vermont- ~10,000 MW of New Power Plants in New England (25,000 MW
peak)
Compliance with Regional Reliability Criteria (e.g., NPCC/Nepool/ISO-NE) a major concern- ISO New England identified “severe reliability
problems” in Vermont - Problems could affect large portions of Vermont

Solving the Reliability ProblemReduce Electric Demand
Energy Efficiency/ Demand Response ProgramsCost & rate of acquisition questions.
Build power plants in NW VTAdditional infrastructure needed;Cost of fuel (natural gas) a concern;New England generation market saturated;Vermont power supply portfolio adequate;Permitting challenges—air emissions, noise, &
cost.Expand transmission system to
increase system capacityRequires extensive upgrades-aesthetic & land
use impacts.Combination of the all three
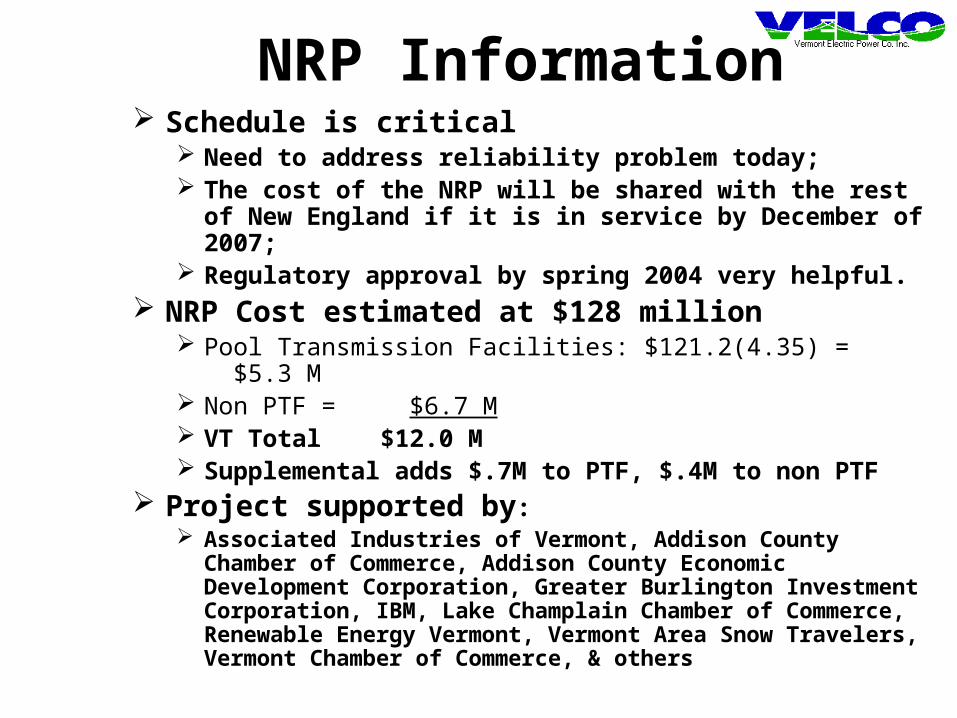
NRP Information Schedule is critical
Need to address reliability problem today; The cost of the NRP will be shared with the rest of
New England if it is in service by December of 2007; Regulatory approval by spring 2004 very helpful.
NRP Cost estimated at $128 million Pool Transmission Facilities: $121.2(4.35) = $5.3 M Non PTF = $6.7 M VT Total $12.0 M Supplemental adds $.7M to PTF, $.4M to non PTF
Project supported by: Associated Industries of Vermont, Addison County
Chamber of Commerce, Addison County Economic Development Corporation, Greater Burlington Investment Corporation, IBM, Lake Champlain Chamber of Commerce, Renewable Energy Vermont, Vermont Area Snow Travelers, Vermont Chamber of Commerce, & others
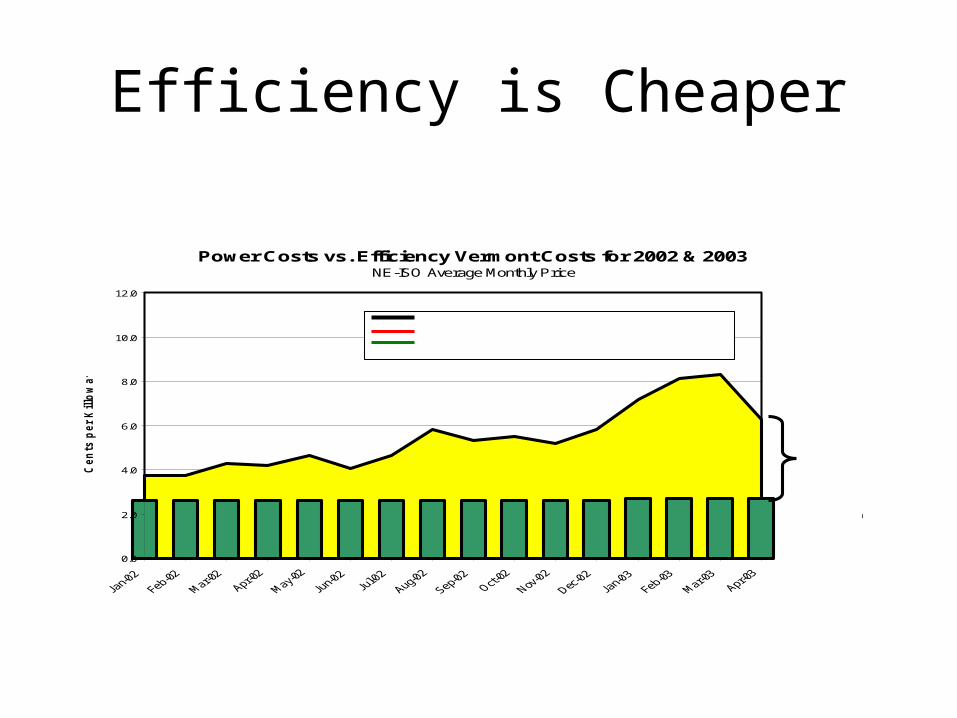
Efficiency is Cheaper
Power Costs vs. Efficiency Vermont Costs for 2002 & 2003NE-ISO Average Monthly Price
0.0
2.0
4.0
6.0
8.0
10.0
12.0
Cen
ts p
er
Killo
watt
ho
ur
EfficiencySavings:
1 cent/KWh(Jan 2002),more than
6 cents/KWh(Mar 2003).Currently
3.6 cents/KWh
Delivered Cost of Wholesale Power * Wholesale Spot Market Price Efficiency Vermont, Contract Commitment
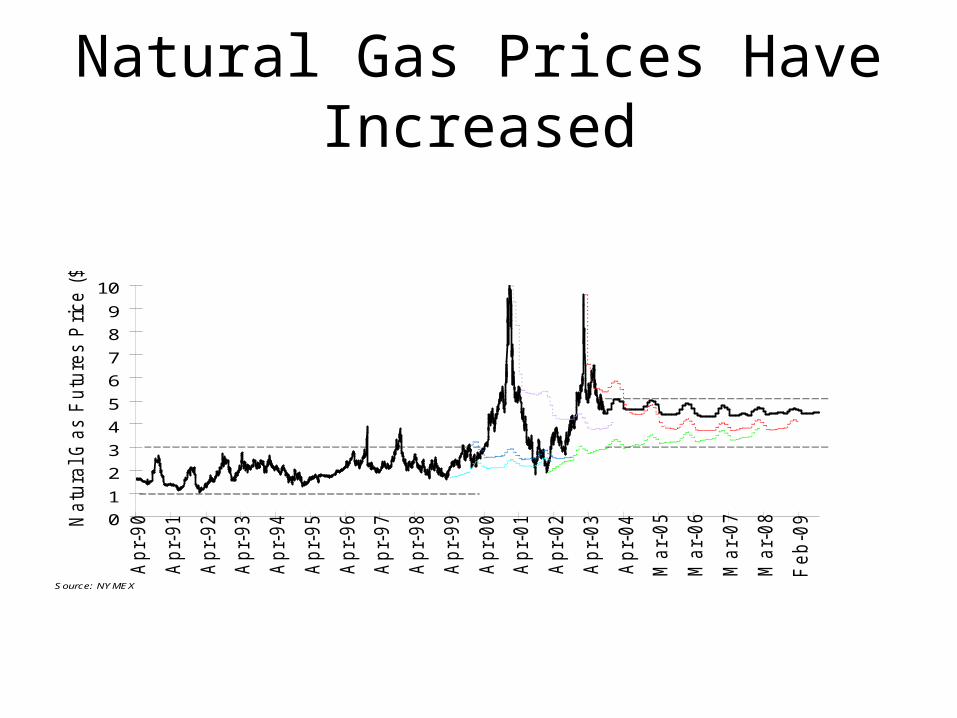
Natural Gas Prices Have Increased
0
1
2
3
4
5
6
7
8
9
10
Apr-
90
Apr-
91
Apr-
92
Apr-
93
Apr-
94
Apr-
95
Apr-
96
Apr-
97
Apr-
98
Apr-
99
Apr-
00
Apr-
01
Apr-
02
Apr-
03
Apr-
04
Mar-
05
Mar-
06
Mar-
07
Mar-
08
Feb-0
9Natu
ral G
as F
utu
res P
rice (
$/M
MB
tu)
Source: NYMEX

Who Decides?
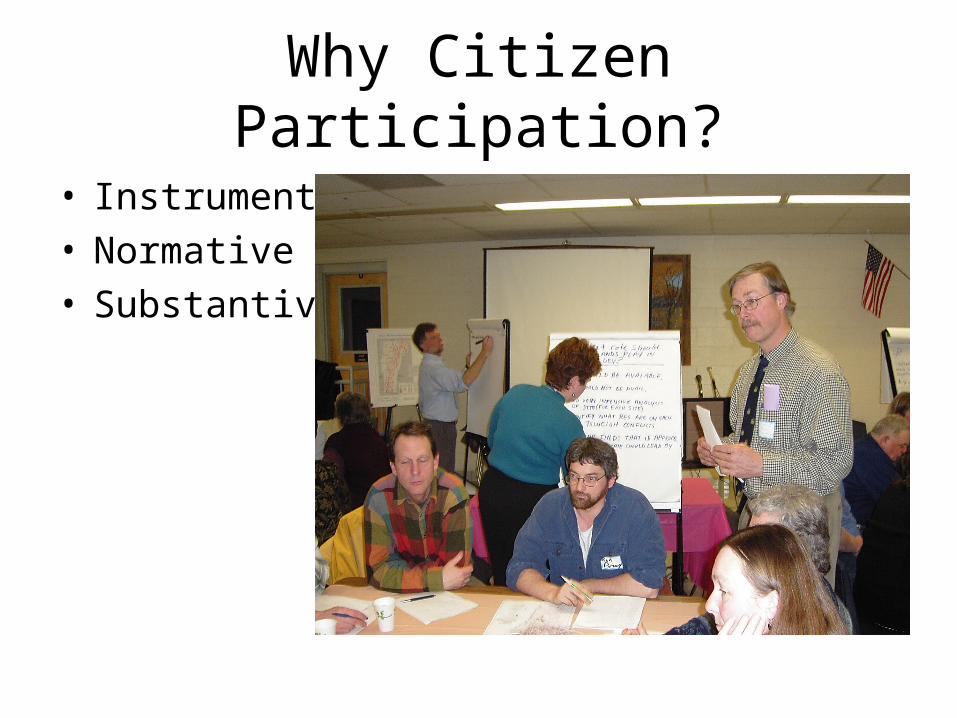
Why Citizen Participation?
• Instrumental• Normative• Substantive

Now is the time to have a conversation about where we’re going to generate our power.” (1/26/03 BFP)

Does Participation Reduce Conflict?

DPS Energy Plan
• Rigorous Decision Analysis Techniques• The plan does not mention a role for the public in planning
Vermont’s energy future. There is little or no acknowledgement in the plan that the public may have ideas or knowledge to communicate. A word search through the 2004 Draft Energy plan reveals that nowhere in this document are the terms “public involvement” or “citizen participation” used. No public participation strategies are offered, but an entire chapter is devoted to explaining an expert-managed process for decision-making. The only role mentioned for the public is on the last page of the plan where public meetings are referenced in the context of legal requirements for these meetings.
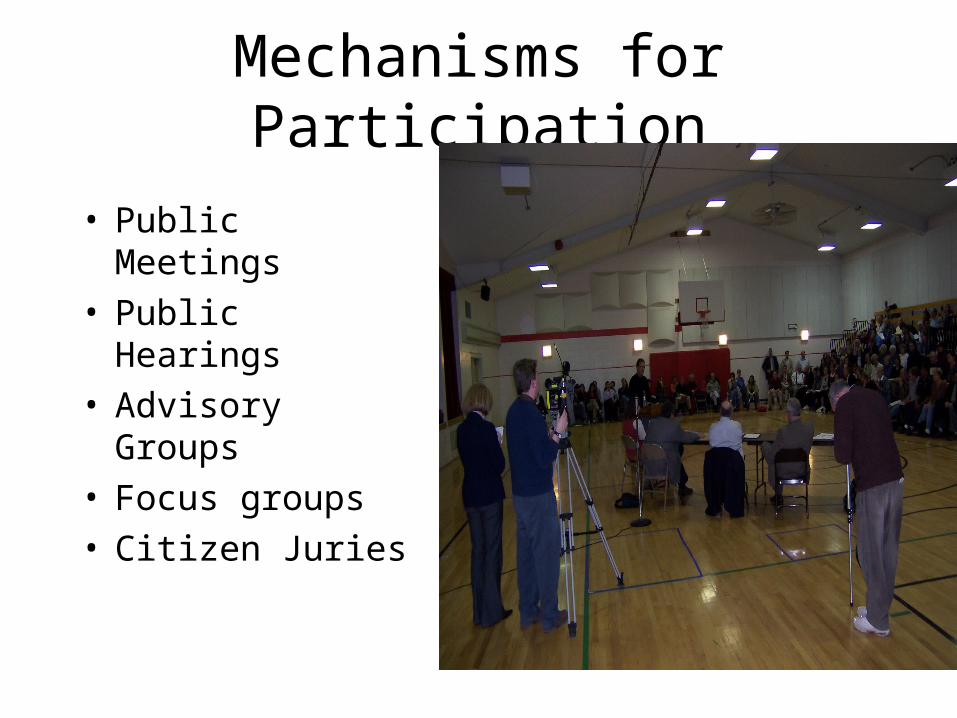
Mechanisms for Participation
• Public Meetings• Public Hearings• Advisory Groups• Focus groups• Citizen Juries

Deliberative
• Face-to-face conversation• Make sense together

Experts
• Equal Access to experts
• Experts not privileged
• Technical Issues to Hide Value Issues

Is this Participation?

Conclusions
• Looking at the state, Vermont needs to make a major commitment for new power sources before 2015
• Some smaller utilities have more immediate needs
• There needs to be a public process, a “statewide” conversation about how we get there.