vermilion vital signs · vermilion vital signs ... cri-usa textiles apparel & luxury goods....
TRANSCRIPT

Vermilion Vital SignsMarket Rankings for the most Positive and Negative Domestic Stocks February 27, 2015
In this product we rank the most positive and negative domestic stocks, filter the symbols by market-cap and trading volume, and then divide the companies into Sectors and Groups. We then manually analyze the charts of the filtered names for technical significance: breakouts/breakdowns,Sector/Group themes, relative strength leadership changes, bottoms-up/top-down ideas, short-term patterns that may have long-term significance, etc. We believe you will find this product valuable as significant price and relative moves begin in the daily charts.
______________________________________________________________________________________________________________________David P. Nicoski, CMT Shelley D. Moen, CMT Joe W. Jasper, CFA John M. Betz, CMT 952-922-7502 952-922-7504 952-922-7501 952-922-7506 [email protected] [email protected] [email protected] [email protected]________________________________________________________________________________________________________________________
900 2nd Avenue South • Suite 270 • Minneapolis, MN 55402 • 952-922-7500 • www.vermilioncap.com
55
60
65
70
75
80
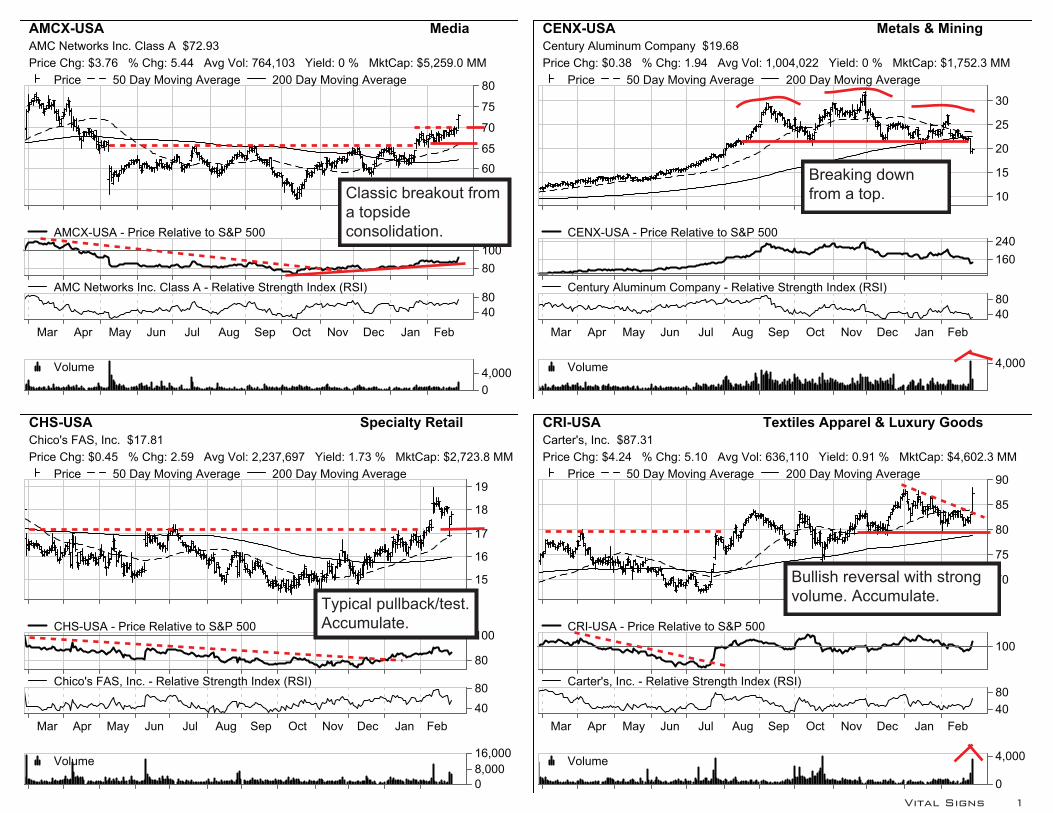
AMCX-USA MediaAMC Networks Inc. Class A $72.93Price Chg: $3.76 % Chg: 5.44 Avg Vol: 764,103 Yield: 0 % MktCap: $5,259.0 MM
Price 50 Day Moving Average 200 Day Moving Average
80100
AMCX-USA - Price Relative to S&P 500
Mar Apr May Jun Jul Aug Sep Oct Nov Dec Jan Feb
4080
AMC Networks Inc. Class A - Relative Strength Index (RSI)
04,000Volume
10
15
20
25
30
CENX-USA Metals & MiningCentury Aluminum Company $19.68Price Chg: $0.38 % Chg: 1.94 Avg Vol: 1,004,022 Yield: 0 % MktCap: $1,752.3 MM
Price 50 Day Moving Average 200 Day Moving Average
160240
CENX-USA - Price Relative to S&P 500
Mar Apr May Jun Jul Aug Sep Oct Nov Dec Jan Feb4080
Century Aluminum Company - Relative Strength Index (RSI)
4,000Volume
15
16
17
18
19
CHS-USA Specialty RetailChico's FAS, Inc. $17.81Price Chg: $0.45 % Chg: 2.59 Avg Vol: 2,237,697 Yield: 1.73 % MktCap: $2,723.8 MM
Price 50 Day Moving Average 200 Day Moving Average
80
100CHS-USA - Price Relative to S&P 500
Mar Apr May Jun Jul Aug Sep Oct Nov Dec Jan Feb40
80Chico's FAS, Inc. - Relative Strength Index (RSI)
08,00016,000
Volume
70
75
80
85
90
CRI-USA Textiles Apparel & Luxury GoodsCarter's, Inc. $87.31Price Chg: $4.24 % Chg: 5.10 Avg Vol: 636,110 Yield: 0.91 % MktCap: $4,602.3 MM
Price 50 Day Moving Average 200 Day Moving Average
100
CRI-USA - Price Relative to S&P 500
Mar Apr May Jun Jul Aug Sep Oct Nov Dec Jan Feb4080
Carter's, Inc. - Relative Strength Index (RSI)
0
4,000Volume
Vital Signs 1
Breaking downfrom a top.Classic breakout from
a topsideconsolidation.
Typical pullback/test.Accumulate.
Bullish reversal with strongvolume. Accumulate.
24262830323436
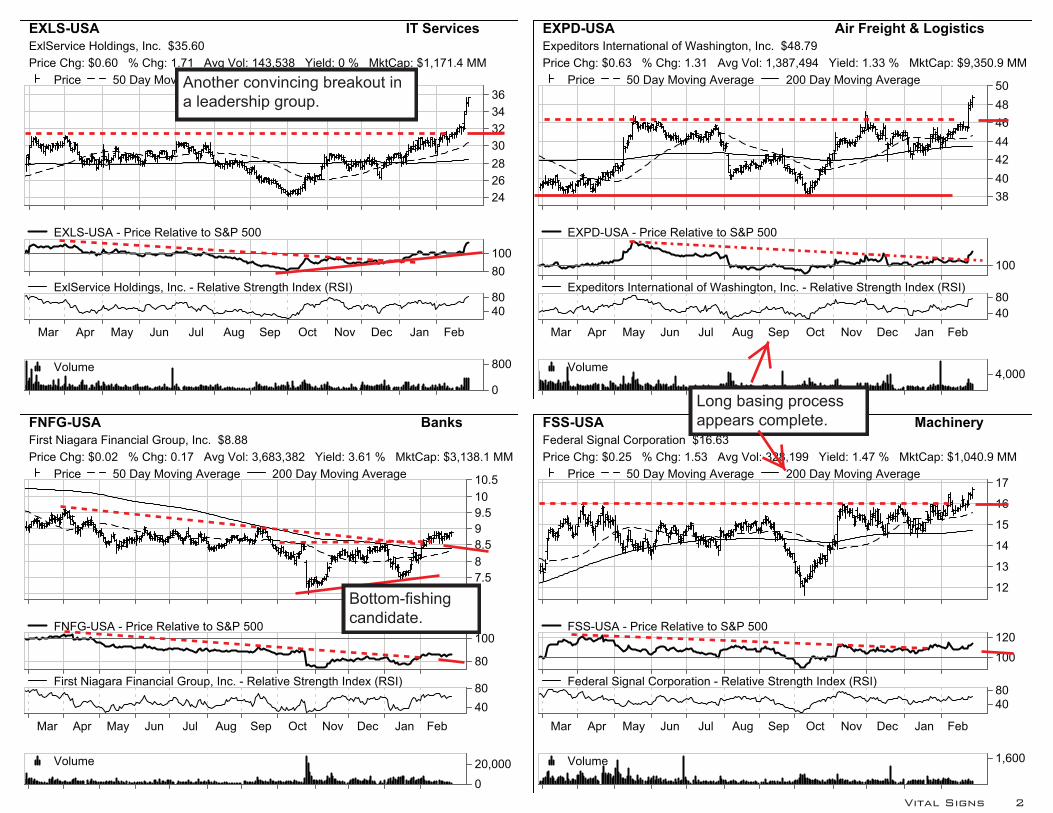
EXLS-USA IT ServicesExlService Holdings, Inc. $35.60Price Chg: $0.60 % Chg: 1.71 Avg Vol: 143,538 Yield: 0 % MktCap: $1,171.4 MM
Price 50 Day Moving Average 200 Day Moving Average
80100
EXLS-USA - Price Relative to S&P 500
Mar Apr May Jun Jul Aug Sep Oct Nov Dec Jan Feb
4080
ExlService Holdings, Inc. - Relative Strength Index (RSI)
0
800Volume
38404244464850
EXPD-USA Air Freight & LogisticsExpeditors International of Washington, Inc. $48.79Price Chg: $0.63 % Chg: 1.31 Avg Vol: 1,387,494 Yield: 1.33 % MktCap: $9,350.9 MM
Price 50 Day Moving Average 200 Day Moving Average
100
EXPD-USA - Price Relative to S&P 500
Mar Apr May Jun Jul Aug Sep Oct Nov Dec Jan Feb4080
Expeditors International of Washington, Inc. - Relative Strength Index (RSI)
4,000Volume
77.588.599.51010.5
FNFG-USA BanksFirst Niagara Financial Group, Inc. $8.88Price Chg: $0.02 % Chg: 0.17 Avg Vol: 3,683,382 Yield: 3.61 % MktCap: $3,138.1 MM
Price 50 Day Moving Average 200 Day Moving Average
80
100FNFG-USA - Price Relative to S&P 500
Mar Apr May Jun Jul Aug Sep Oct Nov Dec Jan Feb4080First Niagara Financial Group, Inc. - Relative Strength Index (RSI)
0
20,000Volume
12
13
14
15
16
17
FSS-USA MachineryFederal Signal Corporation $16.63Price Chg: $0.25 % Chg: 1.53 Avg Vol: 328,199 Yield: 1.47 % MktCap: $1,040.9 MM
Price 50 Day Moving Average 200 Day Moving Average
100
120FSS-USA - Price Relative to S&P 500
Mar Apr May Jun Jul Aug Sep Oct Nov Dec Jan Feb
4080
Federal Signal Corporation - Relative Strength Index (RSI)
1,600Volume
Vital Signs 2
Another convincing breakout ina leadership group.
Long basing processappears complete.
Bottom-fishingcandidate.
26
28
30
32
34
36
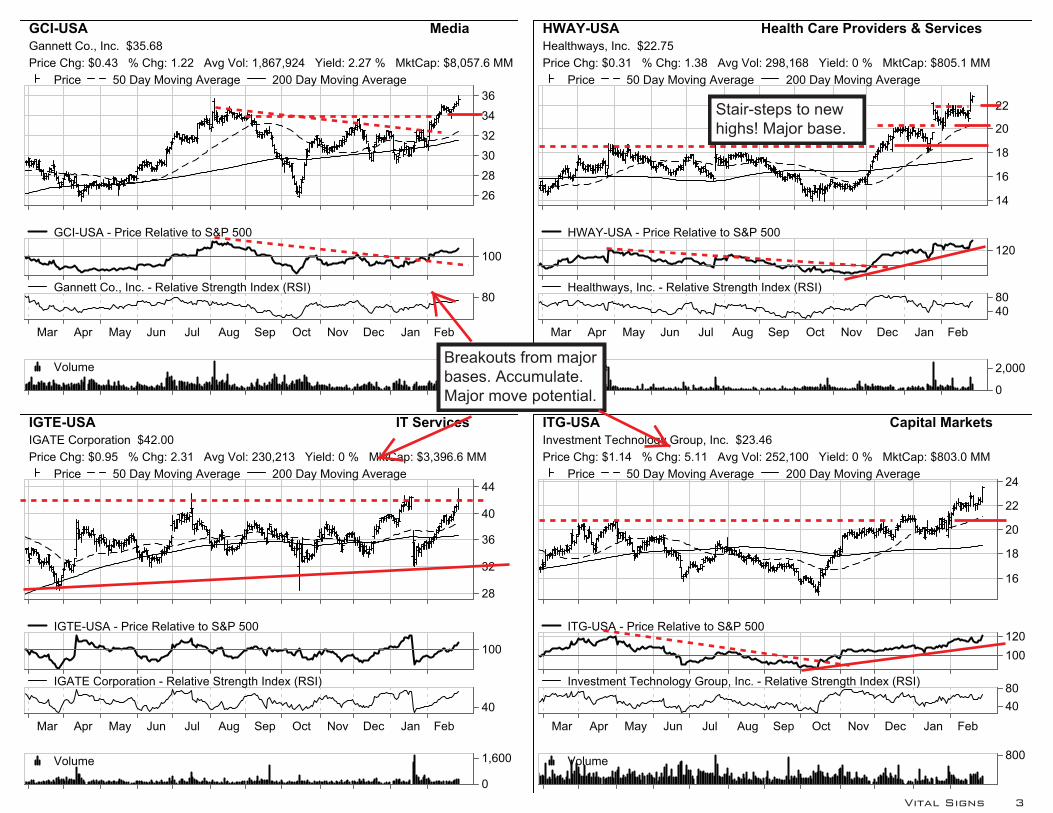
GCI-USA MediaGannett Co., Inc. $35.68Price Chg: $0.43 % Chg: 1.22 Avg Vol: 1,867,924 Yield: 2.27 % MktCap: $8,057.6 MM
Price 50 Day Moving Average 200 Day Moving Average
100
GCI-USA - Price Relative to S&P 500
Mar Apr May Jun Jul Aug Sep Oct Nov Dec Jan Feb
80Gannett Co., Inc. - Relative Strength Index (RSI)
8,000Volume
14
16
18
20
22
HWAY-USA Health Care Providers & ServicesHealthways, Inc. $22.75Price Chg: $0.31 % Chg: 1.38 Avg Vol: 298,168 Yield: 0 % MktCap: $805.1 MM
Price 50 Day Moving Average 200 Day Moving Average
120HWAY-USA - Price Relative to S&P 500
Mar Apr May Jun Jul Aug Sep Oct Nov Dec Jan Feb
4080
Healthways, Inc. - Relative Strength Index (RSI)
0
2,000Volume
28
32
36
40
44
IGTE-USA IT ServicesIGATE Corporation $42.00Price Chg: $0.95 % Chg: 2.31 Avg Vol: 230,213 Yield: 0 % MktCap: $3,396.6 MM
Price 50 Day Moving Average 200 Day Moving Average
100
IGTE-USA - Price Relative to S&P 500
Mar Apr May Jun Jul Aug Sep Oct Nov Dec Jan Feb40
IGATE Corporation - Relative Strength Index (RSI)
0
1,600Volume
16
18
20
22
24
ITG-USA Capital MarketsInvestment Technology Group, Inc. $23.46Price Chg: $1.14 % Chg: 5.11 Avg Vol: 252,100 Yield: 0 % MktCap: $803.0 MM
Price 50 Day Moving Average 200 Day Moving Average
100120
ITG-USA - Price Relative to S&P 500
Mar Apr May Jun Jul Aug Sep Oct Nov Dec Jan Feb
4080Investment Technology Group, Inc. - Relative Strength Index (RSI)
800Volume
Vital Signs 3
Breakouts from majorbases. Accumulate.Major move potential.
Stair-steps to newhighs! Major base.

2224262830323436
KS-USA Paper & Forest ProductsKapStone Paper and Packaging Corporation $35.00Price Chg: $0.88 % Chg: 2.58 Avg Vol: 936,880 Yield: 0.29 % MktCap: $3,360.0 MM
Price 50 Day Moving Average 200 Day Moving Average
80
100KS-USA - Price Relative to S&P 500
Mar Apr May Jun Jul Aug Sep Oct Nov Dec Jan Feb
4080
KapStone Paper and Packaging Corporation - Relative Strength Index (RSI)
2,000Volume
88
92
96
100
104
MCD-USA Hotels Restaurants & LeisureMcDonald's Corporation $99.51Price Chg: $0.85 % Chg: 0.86 Avg Vol: 5,623,388 Yield: 3.45 % MktCap: $96,843.5 MM
Price 50 Day Moving Average 200 Day Moving Average
100MCD-USA - Price Relative to S&P 500
Mar Apr May Jun Jul Aug Sep Oct Nov Dec Jan Feb
40
McDonald's Corporation - Relative Strength Index (RSI)
20,000Volume
7580859095100105110
MPC-USA Oil Gas & Consumable FuelsMarathon Petroleum Corporation $107.04Price Chg: $2.38 % Chg: 2.27 Avg Vol: 3,241,032 Yield: 1.91 % MktCap: $29,329.0 MM
Price 50 Day Moving Average 200 Day Moving Average
80
100MPC-USA - Price Relative to S&P 500
Mar Apr May Jun Jul Aug Sep Oct Nov Dec Jan Feb
4080
Marathon Petroleum Corporation - Relative Strength Index (RSI)
8,000Volume
40
45
50
55
60
MYL-USA PharmaceuticalsMylan Inc. $57.24Price Chg: $0.74 % Chg: 1.32 Avg Vol: 4,327,938 Yield: 0 % MktCap: $21,425.3 MM
Price 50 Day Moving Average 200 Day Moving Average
100
MYL-USA - Price Relative to S&P 500
Mar Apr May Jun Jul Aug Sep Oct Nov Dec Jan Feb
4080
Mylan Inc. - Relative Strength Index (RSI)
0
20,000Volume
Vital Signs 4
Out of nowhere a movetopside a consolidation.
Topside breakout.Paper/packagingcontinues to be a placeof interest.
Buy. Bullishreversal at support.Refiners are the only
game in Energy.

30323436384042
PNFP-USA BanksPinnacle Financial Partners, Inc. $41.69Price Chg: $0.81 % Chg: 1.98 Avg Vol: 146,827 Yield: 1.17 % MktCap: $1,489.7 MM
Price 50 Day Moving Average 200 Day Moving Average
96
PNFP-USA - Price Relative to S&P 500
Mar Apr May Jun Jul Aug Sep Oct Nov Dec Jan Feb4080
Pinnacle Financial Partners, Inc. - Relative Strength Index (RSI)
400Volume
4
5
6
7
8
QNST-USA Internet Software & ServicesQuinStreet, Inc. $6.65Price Chg: $0.21 % Chg: 3.26 Avg Vol: 144,196 Yield: 0 % MktCap: $295.9 MM
Price 50 Day Moving Average 200 Day Moving Average
80
QNST-USA - Price Relative to S&P 500
Mar Apr May Jun Jul Aug Sep Oct Nov Dec Jan Feb4080QuinStreet, Inc. - Relative Strength Index (RSI)
0
800Volume
28
30
32
34
36
38
SHOO-USA Textiles Apparel & Luxury GoodsSteven Madden, Ltd. $36.77Price Chg: $0.79 % Chg: 2.20 Avg Vol: 547,878 Yield: 0 % MktCap: $2,361.6 MM
Price 50 Day Moving Average 200 Day Moving Average
80
100SHOO-USA - Price Relative to S&P 500
Mar Apr May Jun Jul Aug Sep Oct Nov Dec Jan Feb
4080Steven Madden, Ltd. - Relative Strength Index (RSI)
2,000Volume
52
56
60
64
68
SMG-USA ChemicalsScotts Miracle-Gro Company Class A $66.60Price Chg: $1.53 % Chg: 2.35 Avg Vol: 275,441 Yield: 2.77 % MktCap: $4,052.5 MM
Price 50 Day Moving Average 200 Day Moving Average
100
SMG-USA - Price Relative to S&P 500
Mar Apr May Jun Jul Aug Sep Oct Nov Dec Jan Feb
4080Scotts Miracle-Gro Company Class A - Relative Strength Index (RSI)
800Volume
Vital Signs 5
More of the same but allare enticingly bullishtechnically.

28
30
32
34
36
38
UBSI-USA BanksUnited Bankshares, Inc. $37.57Price Chg: $0.65 % Chg: 1.76 Avg Vol: 280,268 Yield: 3.47 % MktCap: $2,603.4 MM
Price 50 Day Moving Average 200 Day Moving Average
100
UBSI-USA - Price Relative to S&P 500
Mar Apr May Jun Jul Aug Sep Oct Nov Dec Jan Feb
4080United Bankshares, Inc. - Relative Strength Index (RSI)
0
4,000Volume
70
80
90
100
110
UHS-USA Health Care Providers & ServicesUniversal Health Services, Inc. Class B $112.49Price Chg: $3.30 % Chg: 3.02 Avg Vol: 887,487 Yield: 0.37 % MktCap: $11,133.1 MM
Price 50 Day Moving Average 200 Day Moving Average
120UHS-USA - Price Relative to S&P 500
Mar Apr May Jun Jul Aug Sep Oct Nov Dec Jan Feb4080
Universal Health Services, Inc. Class B - Relative Strength Index (RSI)
08,000Volume
55
606570
7580
WBA-USA Food & Staples RetailingWalgreens Boots Alliance Inc $81.65Price Chg: $1.64 % Chg: 2.05 Avg Vol: 6,129,976 Yield: 1.69 % MktCap: $77,211.7 MM
Price 50 Day Moving Average 200 Day Moving Average
100WBA-USA - Price Relative to S&P 500
Mar Apr May Jun Jul Aug Sep Oct Nov Dec Jan Feb
4080
Walgreens Boots Alliance Inc - Relative Strength Index (RSI)
0
80,000Volume
30
35
40
45
ZTS-USA PharmaceuticalsZoetis, Inc. Class A $46.62Price Chg: $0.90 % Chg: 1.97 Avg Vol: 3,661,988 Yield: 0.73 % MktCap: $23,371.8 MM
Price 50 Day Moving Average 200 Day Moving Average
120
ZTS-USA - Price Relative to S&P 500
Mar Apr May Jun Jul Aug Sep Oct Nov Dec Jan Feb4080
Zoetis, Inc. Class A - Relative Strength Index (RSI)
20,000Volume
Vital Signs 6
Bullish reversal.Accumulate.
Bullish inflectionimminent.
Leadership stocks ofshort- and long-terminterest.

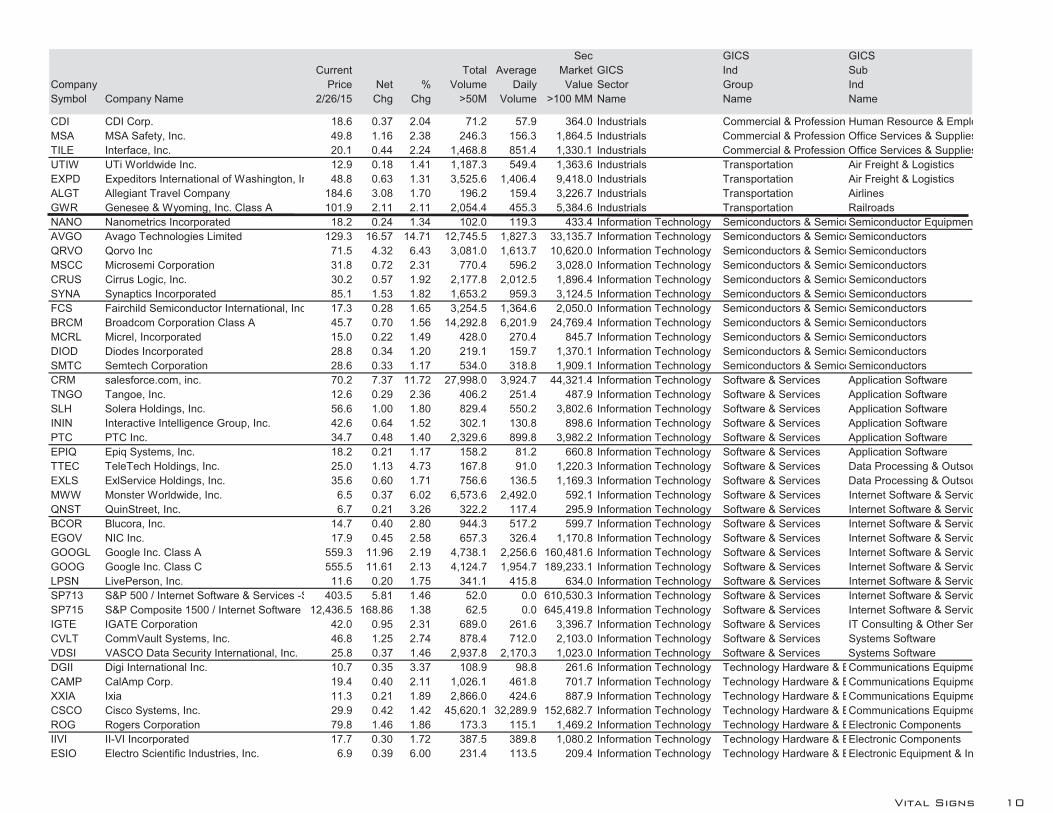
Leaders. Highlighting inflections and themes. Sorted by Sector/Group.Sec GICS GICS
Current Total Average Market GICS Ind SubCompany Price Net % Volume Daily Value Sector Group IndSymbol Company Name 2/26/15 Chg Chg >50M Volume >100 MM Name Name Name
LEADERSWGO Winnebago Industries, Inc. 23.5 0.61 2.66 872.7 424.5 633.7 Consumer Discretionary Automobiles & ComponenAutomobile ManufacturersCRI Carter's, Inc. 87.3 4.24 5.10 5,161.7 616.7 4,619.2 Consumer Discretionary Consumer Durables & Ap Apparel Accessories & LuHBI Hanesbrands Inc. 128.9 3.83 3.06 1,801.9 771.2 12,916.8 Consumer Discretionary Consumer Durables & Ap Apparel Accessories & LuUEIC Universal Electronics Inc. 55.6 1.06 1.94 261.8 118.0 878.6 Consumer Discretionary Consumer Durables & Ap Consumer ElectronicsSHOO Steven Madden, Ltd. 36.8 0.79 2.20 1,771.3 623.8 2,361.6 Consumer Discretionary Consumer Durables & Ap FootwearIRBT iRobot Corporation 33.1 0.66 2.04 778.7 612.0 980.7 Consumer Discretionary Consumer Durables & Ap Household AppliancesRGR Sturm, Ruger & Company, Inc. 52.7 6.68 14.52 3,202.1 269.1 1,023.1 Consumer Discretionary Consumer Durables & Ap Leisure ProductsELY Callaway Golf Company 9.0 0.13 1.47 912.8 834.3 694.3 Consumer Discretionary Consumer Durables & Ap Leisure ProductsUFI Unifi, Inc. 32.4 0.43 1.34 81.4 77.2 589.6 Consumer Discretionary Consumer Durables & Ap TextilesBYD Boyd Gaming Corporation 14.2 0.18 1.28 1,747.0 1,464.6 1,544.0 Consumer Discretionary Consumer Services Casinos & GamingMCD McDonald's Corporation 99.5 0.85 1.72 32,840.1 7,913.9 95,641.0 Consumer Discretionary Consumer Services RestaurantsPNRA Panera Bread Company Class A 161.5 2.56 1.61 811.1 685.5 4,108.6 Consumer Discretionary Consumer Services RestaurantsOMC Omnicom Group Inc 80.2 1.05 1.33 4,175.4 1,510.8 19,787.0 Consumer Discretionary Media AdvertisingAMCX AMC Networks Inc. Class A 72.9 3.76 5.44 2,818.8 686.4 4,421.4 Consumer Discretionary Media Cable & SatelliteCVC Cablevision Systems Corporation Class A 18.9 0.32 1.72 13,417.2 2,881.0 4,144.0 Consumer Discretionary Media Cable & SatelliteGCI Gannett Co., Inc. 35.7 0.43 1.22 4,249.5 1,553.4 8,057.7 Consumer Discretionary Media PublishingCHS Chico's FAS, Inc. 17.8 0.45 2.59 12,015.7 2,344.5 2,723.8 Consumer Discretionary Retailing Apparel RetailZUMZ Zumiez Inc. 38.8 0.64 1.68 319.6 195.3 1,135.1 Consumer Discretionary Retailing Apparel RetailPLCE Children's Place, Inc. 56.8 0.77 1.37 557.9 414.9 1,204.8 Consumer Discretionary Retailing Apparel RetailAZO AutoZone, Inc. 645.0 7.85 1.23 420.1 238.8 20,573.3 Consumer Discretionary Retailing Automotive RetailJCP J. C. Penney Company, Inc. 9.1 0.13 1.45 44,501.3 10,177.7 2,780.3 Consumer Discretionary Retailing Department StoresSCSS Select Comfort Corporation 31.5 0.64 2.08 1,161.5 1,099.3 1,661.6 Consumer Discretionary Retailing Homefurnishing RetailBKS Barnes & Noble, Inc. 25.9 1.67 6.89 3,379.4 426.0 1,561.5 Consumer Discretionary Retailing Specialty StoresCAB Cabela's Incorporated 54.3 0.78 1.46 1,548.1 1,458.5 3,863.1 Consumer Discretionary Retailing Specialty StoresWBA Walgreens Boots Alliance Inc 81.7 1.64 2.05 9,708.6 4,101.3 88,996.5 Consumer Staples Food & Staples Retailing Drug RetailTAP Molson Coors Brewing Company Class B 77.2 1.56 2.06 2,115.4 1,611.6 12,579.4 Consumer Staples Food Beverage & Tobacc BrewersSTZ Constellation Brands, Inc. Class A 115.8 1.64 1.44 1,769.4 917.1 19,692.9 Consumer Staples Food Beverage & Tobacc Distillers & VintnersSJM J. M. Smucker Company 115.2 2.10 1.86 1,607.0 996.9 11,724.1 Consumer Staples Food Beverage & Tobacc Packaged Foods & MeatsSAFM Sanderson Farms, Inc. 85.7 1.24 1.47 793.9 498.5 1,985.3 Consumer Staples Food Beverage & Tobacc Packaged Foods & MeatsUVV Universal Corporation 48.0 0.83 1.76 422.5 286.7 1,084.6 Consumer Staples Food Beverage & Tobacc TobaccoEXH Exterran Holdings, Inc. 33.7 1.51 4.69 3,344.1 965.8 2,301.7 Energy Energy Oil & Gas Equipment & SeHOS Hornbeck Offshore Services, Inc. 20.1 0.49 2.50 1,897.7 946.0 713.6 Energy Energy Oil & Gas Equipment & SeSLCA U.S. Silica Holdings, Inc. 30.7 0.56 1.86 7,440.6 3,071.5 1,656.3 Energy Energy Oil & Gas Equipment & SePVA Penn Virginia Corporation 6.9 0.67 10.81 20,240.5 4,963.7 491.6 Energy Energy Oil & Gas Exploration & PGPOR Gulfport Energy Corporation 45.7 1.56 3.55 6,037.3 1,539.9 3,905.0 Energy Energy Oil & Gas Exploration & PAREX Approach Resources Inc. 7.6 0.20 2.69 3,442.8 1,562.3 302.2 Energy Energy Oil & Gas Exploration & PWNR Western Refining, Inc. 47.1 3.42 7.84 4,214.6 1,397.9 4,640.8 Energy Energy Oil & Gas Refining & Mark
Vital Signs 7

Sec GICS GICSCurrent Total Average Market GICS Ind Sub
Company Price Net % Volume Daily Value Sector Group IndSymbol Company Name 2/26/15 Chg Chg >50M Volume >100 MM Name Name Name
HFC HollyFrontier Corporation 44.4 2.16 5.11 10,919.8 3,196.5 8,689.2 Energy Energy Oil & Gas Refining & MarkTSO Tesoro Corporation 93.5 2.63 2.89 4,907.6 4,002.5 11,753.7 Energy Energy Oil & Gas Refining & MarkMPC Marathon Petroleum Corporation 107.0 2.38 2.27 6,024.8 3,433.3 29,991.9 Energy Energy Oil & Gas Refining & MarkPSX Phillips 66 80.1 0.97 1.23 7,108.9 4,293.3 43,512.5 Energy Energy Oil & Gas Refining & MarkPACW PacWest Bancorp 46.8 1.17 2.55 1,000.7 477.6 4,771.5 Financials Banks Regional BanksPNFP Pinnacle Financial Partners, Inc. 41.7 0.81 1.98 253.3 109.5 1,486.5 Financials Banks Regional BanksUCBI United Community Banks, Inc. 19.2 0.37 1.96 279.2 228.1 965.3 Financials Banks Regional BanksUBSI United Bankshares, Inc. 37.6 0.65 1.76 376.2 500.6 2,600.0 Financials Banks Regional BanksBXS BancorpSouth, Inc. 22.6 0.37 1.67 801.4 497.4 2,175.0 Financials Banks Regional BanksCATY Cathay General Bancorp 25.8 0.25 1.37 743.0 335.7 2,062.4 Financials Banks Regional BanksSFNC Simmons First National Corporation Class 41.0 0.47 1.16 131.8 49.2 738.7 Financials Banks Regional BanksBKMU Bank Mutual Corporation 7.2 0.12 1.69 164.6 119.2 336.2 Financials Banks Thrifts & Mortgage FinancFNGN Financial Engines, Inc. 41.5 0.50 1.22 551.9 531.3 2,154.1 Financials Diversified Financials Asset Management & CusWRLD World Acceptance Corporation 83.2 1.85 2.27 239.0 139.5 793.0 Financials Diversified Financials Consumer FinanceAXP American Express Company 83.3 1.08 1.31 16,862.0 10,353.7 84,846.3 Financials Diversified Financials Consumer FinanceITG Investment Technology Group, Inc. 23.5 1.14 5.11 433.4 216.0 816.1 Financials Diversified Financials Investment Banking & BroPJC Piper Jaffray Companies 55.2 0.78 1.43 168.1 102.6 898.3 Financials Diversified Financials Investment Banking & BroGHL Greenhill & Co., Inc. 39.7 0.49 1.25 441.0 463.6 1,116.6 Financials Diversified Financials Investment Banking & BroMKTX MarketAxess Holdings Inc. 80.9 1.10 1.38 194.7 172.4 3,025.0 Financials Diversified Financials Specialized FinanceUVE Universal Insurance Holdings, Inc. 25.3 2.79 12.41 1,548.8 304.3 866.1 Financials Insurance Property & Casualty InsuraHCI HCI Group, Inc. 47.5 1.28 2.77 247.9 78.0 522.4 Financials Insurance Property & Casualty InsuraUIHC United Insurance Holdings Corp. 24.7 0.66 2.75 460.6 495.1 516.3 Financials Insurance Property & Casualty InsuraIPCC Infinity Property and Casualty Corporation 75.8 1.40 1.88 85.8 24.8 871.1 Financials Insurance Property & Casualty InsuraNAVG Navigators Group, Inc. 74.8 1.20 1.63 58.9 44.9 1,068.9 Financials Insurance Property & Casualty InsuraMIG Meadowbrook Insurance Group, Inc. 8.5 0.12 1.44 884.5 380.1 423.8 Financials Insurance Property & Casualty InsuraLAMR Lamar Advertising Company Class A 59.0 1.13 1.95 3,313.0 911.6 4,770.8 Financials Real Estate Specialized REITsCYBX Cyberonics, Inc. 66.6 6.23 10.32 9,700.5 280.8 1,752.4 Health Care Health Care Equipment & Health Care EquipmentCMN Cantel Medical Corp. 46.2 0.77 1.70 163.2 105.3 1,918.1 Health Care Health Care Equipment & Health Care EquipmentABMD ABIOMED, Inc. 61.0 0.83 1.38 996.7 661.0 2,507.5 Health Care Health Care Equipment & Health Care EquipmentUHS Universal Health Services, Inc. Class B 112.5 3.30 3.11 1,524.8 668.1 10,313.2 Health Care Health Care Equipment & Health Care FacilitiesSEM Select Medical Holdings Corporation 13.2 0.33 2.57 3,443.2 1,189.9 1,721.7 Health Care Health Care Equipment & Health Care FacilitiesAMSG AmSurg Corp. 58.0 1.38 2.44 1,599.8 452.9 2,789.8 Health Care Health Care Equipment & Health Care FacilitiesTHC Tenet Healthcare Corporation 46.7 1.11 2.43 3,817.9 1,715.5 4,603.6 Health Care Health Care Equipment & Health Care FacilitiesCYH Community Health Systems, Inc. 48.8 1.09 2.29 3,260.8 1,678.9 5,695.1 Health Care Health Care Equipment & Health Care FacilitiesHGR Hanger, Inc. 25.4 0.54 2.17 630.7 265.8 897.1 Health Care Health Care Equipment & Health Care FacilitiesHCA HCA Holdings, Inc. 72.3 1.29 1.82 6,299.8 7,722.9 30,387.9 Health Care Health Care Equipment & Health Care FacilitiesENSG Ensign Group, Inc. 44.1 0.70 1.61 404.7 169.3 1,106.5 Health Care Health Care Equipment & Health Care FacilitiesLPNT LifePoint Hospitals, Inc. 72.1 1.14 1.61 391.4 383.3 3,186.5 Health Care Health Care Equipment & Health Care FacilitiesLHCG LHC Group, Inc. 33.6 4.68 16.18 287.1 46.7 598.2 Health Care Health Care Equipment & Health Care ServicesAFAM Almost Family, Inc. 33.2 2.05 6.58 118.2 31.4 314.6 Health Care Health Care Equipment & Health Care ServicesAMED Amedisys, Inc. 30.9 1.29 4.36 546.9 162.7 1,031.4 Health Care Health Care Equipment & Health Care ServicesIPCM IPC Healthcare, Inc. 43.9 1.50 3.54 293.4 168.9 759.1 Health Care Health Care Equipment & Health Care ServicesCCRN Cross Country Healthcare, Inc. 13.0 0.31 2.44 378.3 319.5 460.8 Health Care Health Care Equipment & Health Care ServicesPRSC Providence Service Corporation 46.0 1.01 2.24 199.9 100.1 729.5 Health Care Health Care Equipment & Health Care ServicesAIRM Air Methods Corporation 45.7 0.97 2.17 726.6 358.9 1,790.5 Health Care Health Care Equipment & Health Care Services
Vital Signs 8

Sec GICS GICSCurrent Total Average Market GICS Ind Sub
Company Price Net % Volume Daily Value Sector Group IndSymbol Company Name 2/26/15 Chg Chg >50M Volume >100 MM Name Name Name
OCR Omnicare, Inc. 76.8 1.61 2.14 2,301.9 753.5 7,459.4 Health Care Health Care Equipment & Health Care ServicesLH Laboratory Corporation of America Holdin 124.5 2.11 1.72 2,867.5 1,480.5 12,426.0 Health Care Health Care Equipment & Health Care ServicesHWAY Healthways, Inc. 22.8 0.31 1.38 1,757.8 499.9 807.9 Health Care Health Care Equipment & Health Care ServicesCHE Chemed Corporation 116.5 1.27 1.29 260.9 141.2 1,981.5 Health Care Health Care Equipment & Health Care ServicesHAE Haemonetics Corporation 45.3 1.11 2.51 457.9 298.7 2,330.0 Health Care Health Care Equipment & Health Care SuppliesVIVO Meridian Bioscience, Inc. 19.8 0.32 1.64 543.7 347.3 826.2 Health Care Health Care Equipment & Health Care SuppliesNEOG Neogen Corporation 51.6 0.82 1.61 230.1 115.5 1,908.1 Health Care Health Care Equipment & Health Care SuppliesVASC Vascular Solutions, Inc. 29.2 0.40 1.37 262.3 193.1 502.4 Health Care Health Care Equipment & Health Care SuppliesCOO Cooper Companies, Inc. 165.5 1.99 1.22 747.1 391.6 7,991.2 Health Care Health Care Equipment & Health Care SuppliesMDSO Medidata Solutions, Inc. 48.4 0.66 1.38 600.8 449.0 2,624.1 Health Care Health Care Equipment & Health Care TechnologyRGEN Repligen Corporation 26.2 0.32 1.24 332.6 270.9 857.3 Health Care Pharmaceuticals BiotechnBiotechnologyPRXL PAREXEL International Corporation 65.3 1.11 1.74 615.7 500.8 3,575.9 Health Care Pharmaceuticals BiotechnLife Sciences Tools & SerCBM Cambrex Corporation 34.4 0.43 1.27 711.2 432.2 1,069.8 Health Care Pharmaceuticals BiotechnLife Sciences Tools & SerAKRX Akorn, Inc. 53.5 7.07 15.24 7,154.3 1,647.2 5,765.7 Health Care Pharmaceuticals BiotechnPharmaceuticalsSGNT Sagent Pharmaceuticals, Inc. 28.3 1.08 3.96 512.0 243.3 904.3 Health Care Pharmaceuticals BiotechnPharmaceuticalsMNK Mallinckrodt Plc 119.6 3.46 2.98 1,690.5 1,164.7 13,932.4 Health Care Pharmaceuticals BiotechnPharmaceuticalsMDCO Medicines Company 29.5 0.69 2.41 1,961.6 1,067.7 1,931.5 Health Care Pharmaceuticals BiotechnPharmaceuticalsZTS Zoetis, Inc. Class A 46.6 0.90 1.97 7,861.8 3,907.4 23,371.8 Health Care Pharmaceuticals BiotechnPharmaceuticalsPRGO Perrigo Co. Plc 155.3 2.52 1.65 1,728.1 1,061.6 21,858.4 Health Care Pharmaceuticals BiotechnPharmaceuticalsJNJ Johnson & Johnson 102.8 1.59 1.57 21,120.7 9,912.1 285,834.3 Health Care Pharmaceuticals BiotechnPharmaceuticalsLCI Lannett Company, Inc. 65.2 0.95 1.48 1,549.6 886.8 2,333.2 Health Care Pharmaceuticals BiotechnPharmaceuticalsMYL Mylan Inc. 57.2 0.74 1.32 5,394.8 3,192.9 21,468.7 Health Care Pharmaceuticals BiotechnPharmaceuticalsPCP Precision Castparts Corp. 217.1 5.46 2.58 2,743.7 1,435.7 30,777.8 Industrials Capital Goods Aerospace & DefenseTWI Titan International, Inc. 10.2 0.81 8.62 2,438.1 611.4 547.4 Industrials Capital Goods Agricultural & Farm MachiPGTI PGT, Inc. 10.5 1.98 23.38 2,645.8 255.3 497.6 Industrials Capital Goods Building ProductsAMWD American Woodmark Corporation 49.1 2.74 5.92 480.6 113.1 776.6 Industrials Capital Goods Building ProductsAPOG Apogee Enterprises, Inc. 47.8 1.36 2.93 327.2 118.3 1,386.0 Industrials Capital Goods Building ProductsNX Quanex Building Products Corporation 19.8 0.27 1.38 353.7 249.1 688.0 Industrials Capital Goods Building ProductsORN Orion Marine Group, Inc. 10.3 0.38 3.85 186.8 109.9 282.4 Industrials Capital Goods Construction & EngineerinAEGN Aegion Corporation 17.7 0.54 3.15 622.5 248.9 660.9 Industrials Capital Goods Construction & EngineerinFSS Federal Signal Corporation 16.6 0.25 1.53 492.6 278.0 1,040.9 Industrials Capital Goods Construction Machinery &WIRE Encore Wire Corporation 36.7 1.10 3.09 183.9 115.8 759.4 Industrials Capital Goods Electrical Components & EVICR Vicor Corporation 13.3 0.39 3.02 133.0 52.8 356.2 Industrials Capital Goods Electrical Components & EPOWL Powell Industries, Inc. 34.2 0.64 1.91 118.4 90.5 412.2 Industrials Capital Goods Electrical Components & EFELE Franklin Electric Co., Inc. 36.7 0.50 1.38 596.0 174.5 1,743.3 Industrials Capital Goods Electrical Components & ELDL Lydall, Inc. 33.0 0.85 2.64 167.0 93.3 566.7 Industrials Capital Goods Industrial MachineryESE ESCO Technologies Inc. 38.8 0.48 1.25 186.4 68.8 1,013.9 Industrials Capital Goods Industrial MachineryCIR CIRCOR International, Inc. 53.9 0.65 1.22 216.9 122.9 952.8 Industrials Capital Goods Industrial MachineryAIT Applied Industrial Technologies, Inc. 43.9 0.73 1.69 463.5 285.8 1,803.8 Industrials Capital Goods Trading Companies & DisRRD R.R. Donnelley & Sons Company 19.6 0.79 4.19 7,704.9 1,795.1 3,924.1 Industrials Commercial & Profession Commercial PrintingECOL US Ecology, Inc. 47.5 0.94 2.02 245.3 135.2 1,027.3 Industrials Commercial & Profession Environmental & FacilitiesCLH Clean Harbors, Inc. 57.0 0.96 1.71 2,733.6 663.9 3,414.6 Industrials Commercial & Profession Environmental & FacilitiesABM ABM Industries Incorporated 31.1 0.39 1.27 267.4 175.9 1,739.1 Industrials Commercial & Profession Environmental & FacilitiesNSP Insperity, Inc. 52.4 1.73 3.41 1,280.8 437.4 1,328.0 Industrials Commercial & Profession Human Resource & EmploWAGE WageWorks, Inc. 59.5 1.76 3.05 422.3 283.3 2,111.4 Industrials Commercial & Profession Human Resource & Emplo
Vital Signs 9
Sec GICS GICSCurrent Total Average Market GICS Ind Sub
Company Price Net % Volume Daily Value Sector Group IndSymbol Company Name 2/26/15 Chg Chg >50M Volume >100 MM Name Name Name
CDI CDI Corp. 18.6 0.37 2.04 71.2 57.9 364.0 Industrials Commercial & Profession Human Resource & EmploMSA MSA Safety, Inc. 49.8 1.16 2.38 246.3 156.3 1,864.5 Industrials Commercial & Profession Office Services & SuppliesTILE Interface, Inc. 20.1 0.44 2.24 1,468.8 851.4 1,330.1 Industrials Commercial & Profession Office Services & SuppliesUTIW UTi Worldwide Inc. 12.9 0.18 1.41 1,187.3 549.4 1,363.6 Industrials Transportation Air Freight & LogisticsEXPD Expeditors International of Washington, In 48.8 0.63 1.31 3,525.6 1,406.4 9,418.0 Industrials Transportation Air Freight & LogisticsALGT Allegiant Travel Company 184.6 3.08 1.70 196.2 159.4 3,226.7 Industrials Transportation AirlinesGWR Genesee & Wyoming, Inc. Class A 101.9 2.11 2.11 2,054.4 455.3 5,384.6 Industrials Transportation RailroadsNANO Nanometrics Incorporated 18.2 0.24 1.34 102.0 119.3 433.4 Information Technology Semiconductors & SemicoSemiconductor EquipmenAVGO Avago Technologies Limited 129.3 16.57 14.71 12,745.5 1,827.3 33,135.7 Information Technology Semiconductors & SemicoSemiconductorsQRVO Qorvo Inc 71.5 4.32 6.43 3,081.0 1,613.7 10,620.0 Information Technology Semiconductors & SemicoSemiconductorsMSCC Microsemi Corporation 31.8 0.72 2.31 770.4 596.2 3,028.0 Information Technology Semiconductors & SemicoSemiconductorsCRUS Cirrus Logic, Inc. 30.2 0.57 1.92 2,177.8 2,012.5 1,896.4 Information Technology Semiconductors & SemicoSemiconductorsSYNA Synaptics Incorporated 85.1 1.53 1.82 1,653.2 959.3 3,124.5 Information Technology Semiconductors & SemicoSemiconductorsFCS Fairchild Semiconductor International, Inc 17.3 0.28 1.65 3,254.5 1,364.6 2,050.0 Information Technology Semiconductors & SemicoSemiconductorsBRCM Broadcom Corporation Class A 45.7 0.70 1.56 14,292.8 6,201.9 24,769.4 Information Technology Semiconductors & SemicoSemiconductorsMCRL Micrel, Incorporated 15.0 0.22 1.49 428.0 270.4 845.7 Information Technology Semiconductors & SemicoSemiconductorsDIOD Diodes Incorporated 28.8 0.34 1.20 219.1 159.7 1,370.1 Information Technology Semiconductors & SemicoSemiconductorsSMTC Semtech Corporation 28.6 0.33 1.17 534.0 318.8 1,909.1 Information Technology Semiconductors & SemicoSemiconductorsCRM salesforce.com, inc. 70.2 7.37 11.72 27,998.0 3,924.7 44,321.4 Information Technology Software & Services Application SoftwareTNGO Tangoe, Inc. 12.6 0.29 2.36 406.2 251.4 487.9 Information Technology Software & Services Application SoftwareSLH Solera Holdings, Inc. 56.6 1.00 1.80 829.4 550.2 3,802.6 Information Technology Software & Services Application SoftwareININ Interactive Intelligence Group, Inc. 42.6 0.64 1.52 302.1 130.8 898.6 Information Technology Software & Services Application SoftwarePTC PTC Inc. 34.7 0.48 1.40 2,329.6 899.8 3,982.2 Information Technology Software & Services Application SoftwareEPIQ Epiq Systems, Inc. 18.2 0.21 1.17 158.2 81.2 660.8 Information Technology Software & Services Application SoftwareTTEC TeleTech Holdings, Inc. 25.0 1.13 4.73 167.8 91.0 1,220.3 Information Technology Software & Services Data Processing & OutsouEXLS ExlService Holdings, Inc. 35.6 0.60 1.71 756.6 136.5 1,169.3 Information Technology Software & Services Data Processing & OutsouMWW Monster Worldwide, Inc. 6.5 0.37 6.02 6,573.6 2,492.0 592.1 Information Technology Software & Services Internet Software & ServicQNST QuinStreet, Inc. 6.7 0.21 3.26 322.2 117.4 295.9 Information Technology Software & Services Internet Software & ServicBCOR Blucora, Inc. 14.7 0.40 2.80 944.3 517.2 599.7 Information Technology Software & Services Internet Software & ServicEGOV NIC Inc. 17.9 0.45 2.58 657.3 326.4 1,170.8 Information Technology Software & Services Internet Software & ServicGOOGL Google Inc. Class A 559.3 11.96 2.19 4,738.1 2,256.6 160,481.6 Information Technology Software & Services Internet Software & ServicGOOG Google Inc. Class C 555.5 11.61 2.13 4,124.7 1,954.7 189,233.1 Information Technology Software & Services Internet Software & ServicLPSN LivePerson, Inc. 11.6 0.20 1.75 341.1 415.8 634.0 Information Technology Software & Services Internet Software & ServicSP713 S&P 500 / Internet Software & Services -S 403.5 5.81 1.46 52.0 0.0 610,530.3 Information Technology Software & Services Internet Software & ServicSP715 S&P Composite 1500 / Internet Software 12,436.5 168.86 1.38 62.5 0.0 645,419.8 Information Technology Software & Services Internet Software & ServicIGTE IGATE Corporation 42.0 0.95 2.31 689.0 261.6 3,396.7 Information Technology Software & Services IT Consulting & Other SerCVLT CommVault Systems, Inc. 46.8 1.25 2.74 878.4 712.0 2,103.0 Information Technology Software & Services Systems SoftwareVDSI VASCO Data Security International, Inc. 25.8 0.37 1.46 2,937.8 2,170.3 1,023.0 Information Technology Software & Services Systems SoftwareDGII Digi International Inc. 10.7 0.35 3.37 108.9 98.8 261.6 Information Technology Technology Hardware & ECommunications EquipmeCAMP CalAmp Corp. 19.4 0.40 2.11 1,026.1 461.8 701.7 Information Technology Technology Hardware & ECommunications EquipmeXXIA Ixia 11.3 0.21 1.89 2,866.0 424.6 887.9 Information Technology Technology Hardware & ECommunications EquipmeCSCO Cisco Systems, Inc. 29.9 0.42 1.42 45,620.1 32,289.9 152,682.7 Information Technology Technology Hardware & ECommunications EquipmeROG Rogers Corporation 79.8 1.46 1.86 173.3 115.1 1,469.2 Information Technology Technology Hardware & EElectronic ComponentsIIVI II-VI Incorporated 17.7 0.30 1.72 387.5 389.8 1,080.2 Information Technology Technology Hardware & EElectronic ComponentsESIO Electro Scientific Industries, Inc. 6.9 0.39 6.00 231.4 113.5 209.4 Information Technology Technology Hardware & EElectronic Equipment & In
Vital Signs 10

Sec GICS GICSCurrent Total Average Market GICS Ind Sub
Company Price Net % Volume Daily Value Sector Group IndSymbol Company Name 2/26/15 Chg Chg >50M Volume >100 MM Name Name Name
FARO FARO Technologies, Inc. 60.8 2.28 3.90 429.2 98.3 1,050.5 Information Technology Technology Hardware & EElectronic Equipment & InFEIC FEI Company 79.8 1.11 1.41 779.6 377.9 3,337.8 Information Technology Technology Hardware & EElectronic Equipment & InPKE Park Electrochemical Corp. 21.8 0.31 1.45 62.9 65.3 455.8 Information Technology Technology Hardware & EElectronic Manufacturing SNSIT Insight Enterprises, Inc. 26.9 1.01 3.90 450.9 176.1 1,070.2 Information Technology Technology Hardware & ETechnology DistributorsSCSC ScanSource, Inc. 37.7 0.66 1.78 146.4 108.5 1,080.5 Information Technology Technology Hardware & ETechnology DistributorsQLGC QLogic Corporation 15.1 0.48 3.29 2,694.7 992.5 1,315.4 Information Technology Technology Hardware & ETechnology Hardware StoSMCI Super Micro Computer, Inc. 41.1 0.98 2.44 1,691.7 537.9 1,914.2 Information Technology Technology Hardware & ETechnology Hardware StoAAPL Apple Inc. 130.4 1.63 1.26 165,570.0 65,023.5 759,634.5 Information Technology Technology Hardware & ETechnology Hardware StoCENX Century Aluminum Company 19.7 0.38 1.94 5,893.1 1,148.3 1,750.1 Materials Materials AluminumHW Headwaters Incorporated 16.6 0.32 1.97 2,573.2 815.5 1,221.9 Materials Materials Construction MaterialsLXU LSB Industries, Inc. 37.3 1.15 3.18 292.5 113.0 843.2 Materials Materials Diversified ChemicalsSMG Scotts Miracle-Gro Company Class A 66.6 1.53 2.35 674.7 261.4 4,052.5 Materials Materials Fertilizers & Agricultural CMYE Myers Industries, Inc. 20.0 0.70 3.64 314.6 102.3 628.7 Materials Materials Metal & Glass ContainersWPP Wausau Paper Corp. 9.6 0.30 3.23 308.4 165.7 479.0 Materials Materials Paper ProductsKS KapStone Paper and Packaging Corporat 35.0 0.88 2.58 1,390.4 913.4 3,360.0 Materials Materials Paper ProductsKRA Kraton Performance Polymers, Inc. 20.1 0.94 4.92 1,373.4 243.7 658.6 Materials Materials Specialty ChemicalsBCPC Balchem Corporation 61.3 1.86 3.13 358.5 159.9 1,885.1 Materials Materials Specialty ChemicalsSHLM A. Schulman, Inc. 43.0 0.92 2.19 266.2 115.1 1,250.4 Materials Materials Specialty ChemicalsPOL PolyOne Corporation 40.3 0.54 1.36 777.0 636.2 3,593.4 Materials Materials Specialty ChemicalsFF FutureFuel Corp. 12.6 0.10 1.29 139.9 81.3 548.7 Materials Materials Specialty ChemicalsZEUS Olympic Steel, Inc. 14.7 0.70 5.16 140.2 39.5 160.9 Materials Materials SteelCAS A. M. Castle & Co. 5.0 0.13 2.65 489.7 284.5 118.2 Materials Materials SteelTMST TimkenSteel Corp 30.1 0.61 2.07 429.3 564.7 1,373.2 Materials Materials SteelIRDM Iridium Communications Inc. 9.9 0.14 1.44 2,100.4 1,116.7 923.4 Telecommunication ServicTelecommunication ServicAlternative CarriersATNI Atlantic Tele-Network, Inc. 68.9 2.22 3.33 96.6 43.9 1,096.2 Telecommunication ServicTelecommunication ServicIntegrated TelecommunicaSPOK Spok Holdings, Inc. 19.7 0.70 3.68 133.1 68.6 427.4 Telecommunication ServicTelecommunication ServicWireless TelecommunicatUIL UIL Holdings Corporation 52.1 9.74 23.01 4,029.9 306.0 2,944.4 Utilities Utilities Electric UtilitiesAES AES Corporation 12.6 0.63 5.25 20,833.8 6,170.9 9,005.8 Utilities Utilities Independent Power Produ
LAGGARDS Laggards. Highlighting inflections and themes. Sorted by Sector/Group.DAN Dana Holding Corporation 22.0 -0.36 -1.61 2,966.5 2,852.8 3,628.6 Consumer Discretionary Automobiles & ComponenAuto Parts & EquipmentSMP Standard Motor Products, Inc. 41.5 -1.10 -2.58 306.5 62.0 950.3 Consumer Discretionary Automobiles & ComponenAuto Parts & EquipmentPVH PVH Corp. 108.0 -3.00 -2.70 2,812.9 1,267.9 8,903.1 Consumer Discretionary Consumer Durables & Ap Apparel Accessories & LuICON Iconix Brand Group, Inc. 34.2 -1.06 -3.01 4,175.8 995.2 1,639.8 Consumer Discretionary Consumer Durables & Ap Apparel Accessories & LuETH Ethan Allen Interiors Inc. 27.4 -0.89 -3.15 533.7 311.8 791.3 Consumer Discretionary Consumer Durables & Ap Home FurnishingsMDC M.D.C. Holdings, Inc. 26.9 -0.40 -1.46 1,876.5 1,020.7 1,316.0 Consumer Discretionary Consumer Durables & Ap HomebuildingKBH KB Home 13.9 -0.21 -1.48 5,840.2 4,880.4 1,281.8 Consumer Discretionary Consumer Durables & Ap HomebuildingAPOL Apollo Education Group, Inc. Class A 27.9 -0.58 -2.04 1,781.1 970.2 3,011.5 Consumer Discretionary Consumer Services Education ServicesVAC Marriott Vacations Worldwide Corporation 75.7 -1.42 -1.84 329.7 133.5 2,468.1 Consumer Discretionary Consumer Services Hotels Resorts & Cruise LDIN DineEquity, Inc. 109.7 -2.16 -1.93 678.7 177.0 2,079.2 Consumer Discretionary Consumer Services RestaurantsPLKI Popeyes Louisiana Kitchen, Inc. 60.1 -6.14 -9.27 2,966.5 416.7 1,402.2 Consumer Discretionary Consumer Services RestaurantsDISCA Discovery Communications, Inc. Class A 32.4 -0.49 -1.50 9,647.7 5,757.1 4,822.6 Consumer Discretionary Media BroadcastingSNI Scripps Networks Interactive, Inc. Class A 72.9 -1.47 -1.67 1,554.0 961.9 7,125.0 Consumer Discretionary Media BroadcastingDISCK Discovery Communications, Inc. Class C 30.8 -0.54 -1.72 9,400.6 3,656.0 8,760.8 Consumer Discretionary Media Broadcasting
Vital Signs 11

Sec GICS GICSCurrent Total Average Market GICS Ind Sub
Company Price Net % Volume Daily Value Sector Group IndSymbol Company Name 2/26/15 Chg Chg >50M Volume >100 MM Name Name Name
TWC Time Warner Cable Inc. 152.4 -2.22 -1.44 5,958.5 2,375.4 42,809.2 Consumer Discretionary Media Cable & SatelliteDWA DreamWorks Animation SKG, Inc. Class A 21.8 -0.58 -2.61 3,460.2 1,186.1 1,686.5 Consumer Discretionary Media Movies & EntertainmentMW Men's Wearhouse, Inc. 50.2 -0.79 -1.55 1,112.4 542.0 2,416.6 Consumer Discretionary Retailing Apparel RetailTJX TJX Companies, Inc. 68.1 -1.31 -1.89 14,617.0 3,250.3 46,893.4 Consumer Discretionary Retailing Apparel RetailANN ANN INC. 34.8 -0.73 -2.06 1,460.3 630.9 1,589.1 Consumer Discretionary Retailing Apparel RetailANF Abercrombie & Fitch Co. Class A 24.0 -0.83 -3.34 6,384.4 2,059.3 1,666.1 Consumer Discretionary Retailing Apparel RetailHSNI HSN, Inc. 64.9 -2.65 -3.92 741.3 448.2 3,400.9 Consumer Discretionary Retailing Catalog RetailBBY Best Buy Co., Inc. 37.6 -0.75 -1.96 8,962.5 4,953.0 13,171.0 Consumer Discretionary Retailing Computer & Electronics RLKQ LKQ Corporation 24.8 -3.07 -11.02 16,774.6 1,484.7 7,509.2 Consumer Discretionary Retailing DistributorsLL Lumber Liquidators Holdings, Inc. 49.2 -1.40 -2.77 22,137.1 1,397.4 1,332.6 Consumer Discretionary Retailing Home Improvement RetaiBBBY Bed Bath & Beyond Inc. 73.8 -1.13 -1.51 5,387.9 2,030.9 13,688.1 Consumer Discretionary Retailing Homefurnishing RetailWSM Williams-Sonoma, Inc. 79.8 -1.34 -1.65 1,102.5 635.6 7,351.5 Consumer Discretionary Retailing Homefurnishing RetailEXPE Expedia, Inc. 93.3 -1.36 -1.44 3,284.3 3,165.4 10,623.0 Consumer Discretionary Retailing Internet RetailSPLS Staples, Inc. 16.4 -0.26 -1.56 18,074.5 13,759.2 10,488.4 Consumer Discretionary Retailing Specialty StoresOUTR Outerwall Inc. 63.7 -1.60 -2.45 1,037.8 607.7 1,207.3 Consumer Discretionary Retailing Specialty StoresDF Dean Foods Company 16.1 -0.23 -1.41 3,097.1 2,765.2 1,514.0 Consumer Staples Food Beverage & Tobacc Packaged Foods & MeatsCPB Campbell Soup Company 46.5 -0.70 -1.48 5,063.9 1,814.7 14,561.1 Consumer Staples Food Beverage & Tobacc Packaged Foods & MeatsCVGW Calavo Growers, Inc. 42.0 -1.13 -2.62 158.3 114.1 726.2 Consumer Staples Food Beverage & Tobacc Packaged Foods & MeatsCLD Cloud Peak Energy Inc. 8.1 -0.42 -4.92 2,588.5 2,154.2 494.9 Energy Energy Coal & Consumable FuelsCNX CONSOL Energy Inc. 32.3 -2.02 -5.89 3,984.0 3,162.3 7,437.6 Energy Energy Coal & Consumable FuelsBTU Peabody Energy Corporation 7.4 -0.50 -6.31 15,431.7 12,723.2 2,041.9 Energy Energy Coal & Consumable FuelsCVX Chevron Corporation 107.1 -1.52 -1.40 10,647.3 8,831.2 201,292.1 Energy Energy Integrated Oil & GasHES Hess Corporation 75.4 -1.22 -1.59 4,749.5 3,581.3 22,551.2 Energy Energy Integrated Oil & GasOXY Occidental Petroleum Corporation 78.3 -1.89 -2.36 7,583.4 5,266.4 60,349.5 Energy Energy Integrated Oil & GasRIG Transocean Ltd. 15.8 -0.25 -1.56 31,013.1 12,594.4 5,719.8 Energy Energy Oil & Gas DrillingHP Helmerich & Payne, Inc. 66.2 -1.45 -2.14 4,612.6 3,069.3 7,125.8 Energy Energy Oil & Gas DrillingPES Pioneer Energy Services Corp. 5.2 -0.18 -3.33 1,889.7 1,661.3 334.0 Energy Energy Oil & Gas DrillingDO Diamond Offshore Drilling, Inc. 29.1 -1.15 -3.81 4,816.1 1,920.8 3,984.1 Energy Energy Oil & Gas DrillingNBR Nabors Industries Ltd. 12.5 -0.52 -4.00 13,259.9 10,918.7 3,615.1 Energy Energy Oil & Gas DrillingSPN15 S&P Composite 1500 / Oil & Gas Drilling 433.6 -18.40 -4.07 62.9 0.0 36,943.2 Energy Energy Oil & Gas DrillingRDC Rowan Cos. Plc Class A 20.7 -0.88 -4.08 10,634.5 2,639.6 2,576.7 Energy Energy Oil & Gas DrillingUNT Unit Corporation 30.5 -1.36 -4.28 1,972.3 601.5 1,517.2 Energy Energy Oil & Gas DrillingATW Atwood Oceanics, Inc. 30.4 -1.41 -4.43 3,907.4 2,402.3 1,965.2 Energy Energy Oil & Gas DrillingNE Noble Corporation plc 16.6 -1.23 -6.90 15,287.0 7,720.2 4,108.5 Energy Energy Oil & Gas DrillingESV Ensco plc 24.4 -2.17 -8.16 19,011.3 5,224.1 5,718.2 Energy Energy Oil & Gas DrillingCAM Cameron International Corporation 47.3 -0.70 -1.46 6,031.3 3,851.5 9,153.4 Energy Energy Oil & Gas Equipment & SeSLB Schlumberger NV 83.9 -1.32 -1.55 14,055.9 8,298.6 107,203.5 Energy Energy Oil & Gas Equipment & SeSPN19 S&P Composite 1500 / Oil & Gas Equipm 676.7 -11.28 -1.64 66.2 0.0 249,220.8 Energy Energy Oil & Gas Equipment & SeBAS Basic Energy Services, Inc. 7.1 -0.12 -1.67 4,094.8 2,982.4 295.0 Energy Energy Oil & Gas Equipment & SeGIFI Gulf Island Fabrication, Inc. 16.1 -0.29 -1.77 56.3 42.3 233.9 Energy Energy Oil & Gas Equipment & SeERA Era Group, Inc. 22.3 -0.41 -1.81 119.9 94.1 454.3 Energy Energy Oil & Gas Equipment & SeBHI Baker Hughes Incorporated 62.5 -1.18 -1.85 6,034.0 4,870.2 27,157.6 Energy Energy Oil & Gas Equipment & SeSPN Superior Energy Services, Inc. 21.9 -0.48 -2.14 7,244.2 3,698.1 3,334.1 Energy Energy Oil & Gas Equipment & SeHAL Halliburton Company 42.7 -0.98 -2.24 27,291.1 16,693.2 36,281.0 Energy Energy Oil & Gas Equipment & SeFTI FMC Technologies, Inc. 40.0 -0.97 -2.37 6,624.8 4,319.3 9,253.2 Energy Energy Oil & Gas Equipment & Se
Vital Signs 12
Sec GICS GICSCurrent Total Average Market GICS Ind Sub
Company Price Net % Volume Daily Value Sector Group IndSymbol Company Name 2/26/15 Chg Chg >50M Volume >100 MM Name Name Name
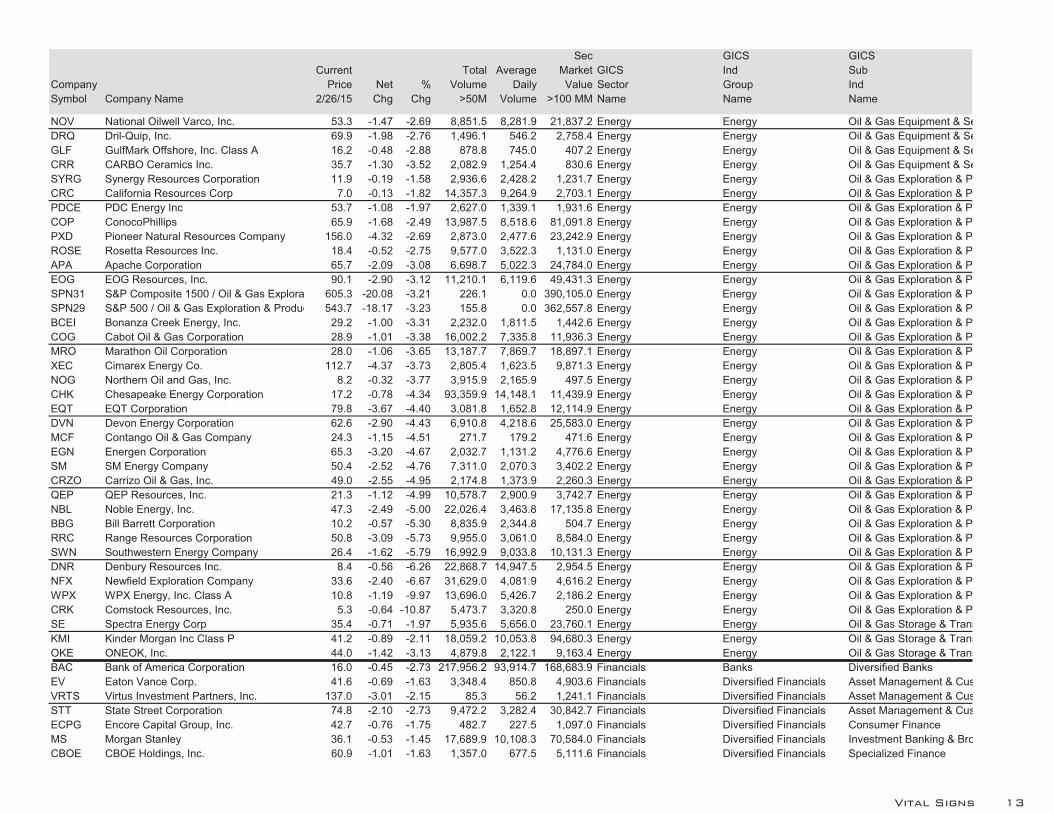
NOV National Oilwell Varco, Inc. 53.3 -1.47 -2.69 8,851.5 8,281.9 21,837.2 Energy Energy Oil & Gas Equipment & SeDRQ Dril-Quip, Inc. 69.9 -1.98 -2.76 1,496.1 546.2 2,758.4 Energy Energy Oil & Gas Equipment & SeGLF GulfMark Offshore, Inc. Class A 16.2 -0.48 -2.88 878.8 745.0 407.2 Energy Energy Oil & Gas Equipment & SeCRR CARBO Ceramics Inc. 35.7 -1.30 -3.52 2,082.9 1,254.4 830.6 Energy Energy Oil & Gas Equipment & SeSYRG Synergy Resources Corporation 11.9 -0.19 -1.58 2,936.6 2,428.2 1,231.7 Energy Energy Oil & Gas Exploration & PCRC California Resources Corp 7.0 -0.13 -1.82 14,357.3 9,264.9 2,703.1 Energy Energy Oil & Gas Exploration & PPDCE PDC Energy Inc 53.7 -1.08 -1.97 2,627.0 1,339.1 1,931.6 Energy Energy Oil & Gas Exploration & PCOP ConocoPhillips 65.9 -1.68 -2.49 13,987.5 8,518.6 81,091.8 Energy Energy Oil & Gas Exploration & PPXD Pioneer Natural Resources Company 156.0 -4.32 -2.69 2,873.0 2,477.6 23,242.9 Energy Energy Oil & Gas Exploration & PROSE Rosetta Resources Inc. 18.4 -0.52 -2.75 9,577.0 3,522.3 1,131.0 Energy Energy Oil & Gas Exploration & PAPA Apache Corporation 65.7 -2.09 -3.08 6,698.7 5,022.3 24,784.0 Energy Energy Oil & Gas Exploration & PEOG EOG Resources, Inc. 90.1 -2.90 -3.12 11,210.1 6,119.6 49,431.3 Energy Energy Oil & Gas Exploration & PSPN31 S&P Composite 1500 / Oil & Gas Explora 605.3 -20.08 -3.21 226.1 0.0 390,105.0 Energy Energy Oil & Gas Exploration & PSPN29 S&P 500 / Oil & Gas Exploration & Produc 543.7 -18.17 -3.23 155.8 0.0 362,557.8 Energy Energy Oil & Gas Exploration & PBCEI Bonanza Creek Energy, Inc. 29.2 -1.00 -3.31 2,232.0 1,811.5 1,442.6 Energy Energy Oil & Gas Exploration & PCOG Cabot Oil & Gas Corporation 28.9 -1.01 -3.38 16,002.2 7,335.8 11,936.3 Energy Energy Oil & Gas Exploration & PMRO Marathon Oil Corporation 28.0 -1.06 -3.65 13,187.7 7,869.7 18,897.1 Energy Energy Oil & Gas Exploration & PXEC Cimarex Energy Co. 112.7 -4.37 -3.73 2,805.4 1,623.5 9,871.3 Energy Energy Oil & Gas Exploration & PNOG Northern Oil and Gas, Inc. 8.2 -0.32 -3.77 3,915.9 2,165.9 497.5 Energy Energy Oil & Gas Exploration & PCHK Chesapeake Energy Corporation 17.2 -0.78 -4.34 93,359.9 14,148.1 11,439.9 Energy Energy Oil & Gas Exploration & PEQT EQT Corporation 79.8 -3.67 -4.40 3,081.8 1,652.8 12,114.9 Energy Energy Oil & Gas Exploration & PDVN Devon Energy Corporation 62.6 -2.90 -4.43 6,910.8 4,218.6 25,583.0 Energy Energy Oil & Gas Exploration & PMCF Contango Oil & Gas Company 24.3 -1.15 -4.51 271.7 179.2 471.6 Energy Energy Oil & Gas Exploration & PEGN Energen Corporation 65.3 -3.20 -4.67 2,032.7 1,131.2 4,776.6 Energy Energy Oil & Gas Exploration & PSM SM Energy Company 50.4 -2.52 -4.76 7,311.0 2,070.3 3,402.2 Energy Energy Oil & Gas Exploration & PCRZO Carrizo Oil & Gas, Inc. 49.0 -2.55 -4.95 2,174.8 1,373.9 2,260.3 Energy Energy Oil & Gas Exploration & PQEP QEP Resources, Inc. 21.3 -1.12 -4.99 10,578.7 2,900.9 3,742.7 Energy Energy Oil & Gas Exploration & PNBL Noble Energy, Inc. 47.3 -2.49 -5.00 22,026.4 3,463.8 17,135.8 Energy Energy Oil & Gas Exploration & PBBG Bill Barrett Corporation 10.2 -0.57 -5.30 8,835.9 2,344.8 504.7 Energy Energy Oil & Gas Exploration & PRRC Range Resources Corporation 50.8 -3.09 -5.73 9,955.0 3,061.0 8,584.0 Energy Energy Oil & Gas Exploration & PSWN Southwestern Energy Company 26.4 -1.62 -5.79 16,992.9 9,033.8 10,131.3 Energy Energy Oil & Gas Exploration & PDNR Denbury Resources Inc. 8.4 -0.56 -6.26 22,868.7 14,947.5 2,954.5 Energy Energy Oil & Gas Exploration & PNFX Newfield Exploration Company 33.6 -2.40 -6.67 31,629.0 4,081.9 4,616.2 Energy Energy Oil & Gas Exploration & PWPX WPX Energy, Inc. Class A 10.8 -1.19 -9.97 13,696.0 5,426.7 2,186.2 Energy Energy Oil & Gas Exploration & PCRK Comstock Resources, Inc. 5.3 -0.64 -10.87 5,473.7 3,320.8 250.0 Energy Energy Oil & Gas Exploration & PSE Spectra Energy Corp 35.4 -0.71 -1.97 5,935.6 5,656.0 23,760.1 Energy Energy Oil & Gas Storage & TransKMI Kinder Morgan Inc Class P 41.2 -0.89 -2.11 18,059.2 10,053.8 94,680.3 Energy Energy Oil & Gas Storage & TransOKE ONEOK, Inc. 44.0 -1.42 -3.13 4,879.8 2,122.1 9,163.4 Energy Energy Oil & Gas Storage & TransBAC Bank of America Corporation 16.0 -0.45 -2.73 217,956.2 93,914.7 168,683.9 Financials Banks Diversified BanksEV Eaton Vance Corp. 41.6 -0.69 -1.63 3,348.4 850.8 4,903.6 Financials Diversified Financials Asset Management & CusVRTS Virtus Investment Partners, Inc. 137.0 -3.01 -2.15 85.3 56.2 1,241.1 Financials Diversified Financials Asset Management & CusSTT State Street Corporation 74.8 -2.10 -2.73 9,472.2 3,282.4 30,842.7 Financials Diversified Financials Asset Management & CusECPG Encore Capital Group, Inc. 42.7 -0.76 -1.75 482.7 227.5 1,097.0 Financials Diversified Financials Consumer FinanceMS Morgan Stanley 36.1 -0.53 -1.45 17,689.9 10,108.3 70,584.0 Financials Diversified Financials Investment Banking & BroCBOE CBOE Holdings, Inc. 60.9 -1.01 -1.63 1,357.0 677.5 5,111.6 Financials Diversified Financials Specialized Finance
Vital Signs 13

Sec GICS GICSCurrent Total Average Market GICS Ind Sub
Company Price Net % Volume Daily Value Sector Group IndSymbol Company Name 2/26/15 Chg Chg >50M Volume >100 MM Name Name Name
EHTH eHealth, Inc. 9.4 -0.72 -7.11 1,005.9 322.1 167.7 Financials Insurance Insurance BrokersSAFT Safety Insurance Group, Inc. 58.9 -1.60 -1.49 99.7 35.6 883.9 Financials Insurance Property & Casualty InsuraPRA ProAssurance Corporation 45.1 -1.19 -2.57 630.6 196.7 2,517.8 Financials Insurance Property & Casualty InsuraLPT Liberty Property Trust 37.1 -0.72 -1.91 1,623.7 770.4 5,553.3 Financials Real Estate Diversified REITsCUZ Cousins Properties Incorporated 10.5 -0.37 -3.40 3,061.9 1,769.8 2,272.6 Financials Real Estate Diversified REITsLTC LTC Properties, Inc. 43.9 -0.63 -1.42 245.9 162.8 1,529.5 Financials Real Estate Health Care REITsHR Healthcare Realty Trust Incorporated 28.3 -0.42 -1.46 1,222.8 654.3 2,817.3 Financials Real Estate Health Care REITsCTRE CareTrust REIT Inc 12.8 -0.22 -1.69 198.7 196.4 403.7 Financials Real Estate Health Care REITsHCN Health Care REIT, Inc. 76.1 -1.56 -2.01 7,256.2 3,045.2 25,096.5 Financials Real Estate Health Care REITsAVIV Aviv REIT, Inc. 35.9 -0.74 -2.02 427.8 229.6 1,738.9 Financials Real Estate Health Care REITsMPW Medical Properties Trust, Inc. 15.0 -0.33 -2.15 3,306.6 2,167.3 3,055.3 Financials Real Estate Health Care REITsOHI Omega Healthcare Investors, Inc. 40.0 -0.88 -2.15 3,683.4 1,967.5 5,485.0 Financials Real Estate Health Care REITsEGP EastGroup Properties, Inc. 62.6 -0.93 -1.46 408.3 209.9 2,014.7 Financials Real Estate Industrial REITsCOR CoreSite Realty Corporation 46.9 -0.68 -1.43 323.3 147.2 1,020.6 Financials Real Estate Office REITsFSP Franklin Street Properties Corp. 12.6 -0.21 -1.65 434.3 331.4 1,257.3 Financials Real Estate Office REITsGOV Government Properties Income Trust 23.1 -0.41 -1.74 1,847.4 609.2 1,627.4 Financials Real Estate Office REITsBMR BioMed Realty Trust, Inc. 22.2 -0.63 -2.76 3,813.0 1,915.9 4,518.3 Financials Real Estate Office REITsPPS Post Properties, Inc. 56.3 -0.79 -1.38 642.7 454.7 3,064.0 Financials Real Estate Residential REITsHME Home Properties, Inc. 66.4 -1.11 -1.64 617.6 416.6 3,835.5 Financials Real Estate Residential REITsMAA Mid-America Apartment Communities, Inc 72.0 -1.48 -2.01 902.7 616.7 5,419.1 Financials Real Estate Residential REITsSKT Tanger Factory Outlet Centers, Inc. 35.5 -0.57 -1.58 1,116.7 822.6 3,385.8 Financials Real Estate Retail REITsROIC Retail Opportunity Investments Corp. 16.7 -0.28 -1.65 1,113.2 433.1 1,552.9 Financials Real Estate Retail REITsPEI Pennsylvania Real Estate Investment Tru 22.9 -0.62 -1.74 1,339.4 566.8 1,580.4 Financials Real Estate Retail REITsSPG Simon Property Group, Inc. 187.1 -3.34 -1.75 2,306.9 1,341.3 58,160.9 Financials Real Estate Retail REITsO Realty Income Corporation 49.8 -1.29 -2.15 4,974.1 2,737.1 11,209.4 Financials Real Estate Retail REITsSSS Sovran Self Storage, Inc. 91.8 -1.42 -1.52 864.0 189.8 3,136.2 Financials Real Estate Specialized REITsRMD ResMed Inc. 64.2 -1.03 -1.58 1,003.4 1,161.3 9,029.3 Health Care Health Care Equipment & Health Care EquipmentBABY Natus Medical Incorporated 36.0 -1.07 -2.89 756.6 233.6 1,170.8 Health Care Health Care Equipment & Health Care EquipmentANIK Anika Therapeutics, Inc. 40.0 -5.25 -11.61 805.2 133.1 579.6 Health Care Health Care Equipment & Health Care SuppliesUTHR United Therapeutics Corporation 155.6 -2.34 -1.48 1,775.0 505.2 7,260.3 Health Care Pharmaceuticals BiotechnBiotechnologyLGND Ligand Pharmaceuticals Incorporated 55.8 -0.87 -1.53 840.3 267.4 1,092.8 Health Care Pharmaceuticals BiotechnBiotechnologySPPI Spectrum Pharmaceuticals, Inc. 6.2 -0.16 -2.52 4,244.9 1,447.1 407.1 Health Care Pharmaceuticals BiotechnBiotechnologyLMNX Luminex Corporation 16.0 -0.24 -1.48 419.1 462.6 684.0 Health Care Pharmaceuticals BiotechnLife Sciences Tools & SerAVAV AeroVironment, Inc. 27.5 -0.40 -1.43 175.2 143.4 642.1 Industrials Capital Goods Aerospace & DefenseASEI American Science and Engineering, Inc. 51.3 -0.78 -1.50 85.3 67.0 379.1 Industrials Capital Goods Aerospace & DefenseKLXI KLX Inc 40.5 -0.62 -1.51 1,854.0 1,053.1 2,134.0 Industrials Capital Goods Aerospace & DefenseTXT Textron Inc. 44.2 -0.76 -1.69 3,915.9 2,125.9 12,204.1 Industrials Capital Goods Aerospace & DefenseOA Orbital ATK, Inc. 67.7 -1.22 -1.77 1,051.5 946.9 4,010.5 Industrials Capital Goods Aerospace & DefenseAIR AAR CORP. 28.6 -0.64 -2.19 351.7 198.6 1,136.4 Industrials Capital Goods Aerospace & DefenseEGL Engility Holdings, Inc. 46.5 -1.05 -2.21 185.4 109.9 817.1 Industrials Capital Goods Aerospace & DefenseTASR TASER International, Inc. 22.7 -4.37 -16.14 15,071.8 1,289.6 1,191.3 Industrials Capital Goods Aerospace & DefenseFBHS Fortune Brands Home & Security, Inc. 46.9 -0.68 -1.43 2,649.0 1,783.4 7,399.3 Industrials Capital Goods Building ProductsMAS Masco Corporation 26.2 -0.57 -2.13 5,142.3 3,804.1 9,165.1 Industrials Capital Goods Building ProductsKBR KBR, Inc. 17.9 -0.27 -1.49 2,480.3 2,130.3 2,595.5 Industrials Capital Goods Construction & EngineerinEME EMCOR Group, Inc. 43.5 -0.68 -1.54 656.3 225.0 2,817.8 Industrials Capital Goods Construction & Engineerin
Vital Signs 14

Sec GICS GICSCurrent Total Average Market GICS Ind Sub
Company Price Net % Volume Daily Value Sector Group IndSymbol Company Name 2/26/15 Chg Chg >50M Volume >100 MM Name Name Name
FLR Fluor Corporation 58.1 -1.06 -1.79 3,160.3 2,148.8 8,589.6 Industrials Capital Goods Construction & EngineerinCAT Caterpillar Inc. 83.8 -1.35 -1.59 7,906.8 7,527.2 50,796.8 Industrials Capital Goods Construction Machinery &SXI Standex International Corporation 72.6 -1.10 -1.49 109.5 66.9 926.7 Industrials Capital Goods Industrial MachineryJBT John Bean Technologies Corporation 34.4 -0.80 -2.27 165.7 90.9 1,002.6 Industrials Capital Goods Industrial MachineryHSC Harsco Corporation 16.7 -0.76 -4.35 2,573.5 490.6 1,350.3 Industrials Capital Goods Industrial MachineryVRTV Veritiv Corp 49.5 -1.22 -2.41 70.2 50.6 791.8 Industrials Capital Goods Trading Companies & DisDNOW NOW Inc 21.4 -0.81 -3.66 3,344.4 1,635.7 2,285.9 Industrials Capital Goods Trading Companies & DisNLSN Nielsen N.V. 45.8 -0.69 -1.48 4,388.5 2,355.2 17,000.1 Industrials Commercial & Profession Research & Consulting SeDAL Delta Air Lines, Inc. 45.9 -0.92 -1.96 25,127.4 12,587.7 37,850.6 Industrials Transportation AirlinesCSX CSX Corporation 34.3 -0.90 -2.56 15,863.9 6,000.7 33,986.3 Industrials Transportation RailroadsSUNE SunEdison, Inc. 22.3 -0.57 -2.49 23,144.1 10,484.1 6,037.1 Information Technology Semiconductors & SemicoSemiconductor EquipmenADSK Autodesk, Inc. 61.0 -1.00 -1.61 5,673.2 1,679.0 13,881.1 Information Technology Software & Services Application SoftwareMENT Mentor Graphics Corporation 24.6 -0.69 -2.73 1,606.8 630.7 2,826.9 Information Technology Software & Services Application SoftwareACIW ACI Worldwide, Inc. 19.9 -0.56 -2.74 1,849.3 457.5 2,286.1 Information Technology Software & Services Application SoftwareMA MasterCard Incorporated Class A 91.3 -1.41 -1.52 11,809.5 5,921.8 101,413.7 Information Technology Software & Services Data Processing & OutsouPAY VeriFone Systems, Inc. 35.3 -0.71 -1.97 2,456.5 1,541.9 4,006.8 Information Technology Software & Services Data Processing & OutsouCLGX CoreLogic, Inc. 33.7 -0.74 -2.15 2,804.6 473.0 3,020.6 Information Technology Software & Services Data Processing & OutsouXRX Xerox Corporation 13.4 -0.34 -2.48 18,933.5 7,271.3 14,859.0 Information Technology Software & Services Data Processing & OutsouSYMC Symantec Corporation 25.1 -0.44 -1.73 6,935.8 3,630.5 17,093.6 Information Technology Software & Services Systems SoftwareROVI Rovi Corporation 22.9 -1.27 -5.25 2,396.6 555.4 2,109.1 Information Technology Software & Services Systems SoftwareJNPR Juniper Networks, Inc. 24.1 -0.39 -1.59 8,296.2 4,777.4 9,812.5 Information Technology Technology Hardware & ECommunications EquipmeADTN ADTRAN, Inc. 21.3 -0.69 -3.14 1,799.6 584.2 1,136.1 Information Technology Technology Hardware & ECommunications EquipmeKN Knowles Corp. 19.3 -0.35 -1.79 1,991.9 2,234.8 1,637.6 Information Technology Technology Hardware & EElectronic ComponentsDTSI DTS, Inc. 29.1 -1.05 -3.49 316.7 142.1 499.4 Information Technology Technology Hardware & EElectronic ComponentsDAKT Daktronics, Inc. 10.2 -0.77 -6.99 1,228.0 213.4 446.0 Information Technology Technology Hardware & EElectronic Equipment & InHPQ Hewlett-Packard Company 34.0 -0.66 -1.90 95,389.2 12,477.9 62,152.8 Information Technology Technology Hardware & ETechnology Hardware StoCBT Cabot Corporation 45.4 -0.75 -1.62 716.0 468.4 2,894.7 Materials Materials Commodity ChemicalsLYB LyondellBasell Industries NV 86.8 -2.84 -2.39 9,459.0 5,074.6 41,392.1 Materials Materials Commodity ChemicalsRTI RTI International Metals, Inc. 27.9 -0.51 -1.80 256.5 208.8 857.4 Materials Materials Diversified Metals & MininFCX Freeport-McMoRan, Inc. 21.1 -0.39 -1.81 25,483.6 21,945.2 21,935.8 Materials Materials Diversified Metals & MininIPI Intrepid Potash, Inc. 14.0 -0.29 -2.03 937.1 713.6 1,063.2 Materials Materials Fertilizers & Agricultural CMON Monsanto Company 120.0 -4.26 -3.43 6,940.4 2,368.8 58,017.7 Materials Materials Fertilizers & Agricultural CLPX Louisiana-Pacific Corporation 17.0 -0.46 -2.63 4,301.7 2,782.0 2,423.3 Materials Materials Forest ProductsSWC Stillwater Mining Company 14.5 -0.32 -2.16 3,322.5 1,194.8 1,743.9 Materials Materials Precious Metals & MineraFTK Flotek Industries, Inc. 17.2 -0.50 -2.83 1,463.1 1,072.8 915.2 Materials Materials Specialty ChemicalsSTLD Steel Dynamics, Inc. 18.6 -0.30 -1.59 6,976.1 4,040.1 4,471.7 Materials Materials SteelSXC SunCoke Energy, Inc. 17.7 -0.41 -2.26 926.4 559.4 1,175.7 Materials Materials SteelX United States Steel Corporation 24.2 -0.68 -2.73 10,955.3 11,822.6 3,529.4 Materials Materials SteelCNSL Consolidated Communications Holdings, 21.8 -1.48 -6.35 1,059.3 214.0 1,101.5 Telecommunication ServicTelecommunication ServicIntegrated TelecommunicaTDS Telephone and Data Systems, Inc. 25.2 -1.30 -4.91 1,269.5 585.3 2,536.9 Telecommunication ServicTelecommunication ServicWireless TelecommunicatEXC Exelon Corporation 34.0 -0.53 -1.54 16,412.3 7,238.3 29,199.9 Utilities Utilities Electric UtilitiesGXP Great Plains Energy Incorporated 26.7 -0.42 -1.55 3,284.1 1,186.1 4,118.2 Utilities Utilities Electric UtilitiesEE El Paso Electric Company 37.4 -0.68 -1.79 407.8 125.9 1,509.8 Utilities Utilities Electric UtilitiesOGE OGE Energy Corp. 32.7 -1.08 -3.19 2,998.6 1,223.2 6,523.7 Utilities Utilities Electric UtilitiesNFG National Fuel Gas Company 64.8 -2.81 -4.16 1,033.9 581.1 5,461.5 Utilities Utilities Gas Utilities
Vital Signs 15

Sec GICS GICSCurrent Total Average Market GICS Ind Sub
Company Price Net % Volume Daily Value Sector Group IndSymbol Company Name 2/26/15 Chg Chg >50M Volume >100 MM Name Name Name
NRG NRG Energy, Inc. 24.8 -0.61 -2.40 6,579.4 3,837.9 8,375.0 Utilities Utilities Independent Power ProduAEE Ameren Corporation 42.5 -0.60 -1.39 4,860.0 1,960.6 10,319.3 Utilities Utilities Multi-UtilitiesWEC Wisconsin Energy Corporation 50.8 -0.78 -1.51 3,212.7 2,074.4 11,454.0 Utilities Utilities Multi-UtilitiesSCG SCANA Corporation 57.0 -1.03 -1.77 2,403.2 1,110.8 8,128.2 Utilities Utilities Multi-UtilitiesCNP CenterPoint Energy, Inc. 21.0 -0.55 -2.55 11,143.3 4,119.8 9,034.3 Utilities Utilities Multi-UtilitiesMDU MDU Resources Group, Inc. 22.5 -0.64 -2.77 1,999.7 1,852.0 4,366.7 Utilities Utilities Multi-Utilities
Vital Signs 16
Disclaimer: The information contained herein is privileged, confidential and protected from disclosure. Any unauthorized disclosuredistribution, dissemination or copying of this material or any attachment is strictly prohibited; such information, whether derived from Vermilion Technical Research, LLC or from any oral or written communication by way of opinion, advice, or otherwise with a principal of the company is not warranted in any manner whatsoever, is for the use of our customers only and may be obtained from internal and externalresearch sources considered to be reliable. It is not necessarily complete and its accuracy is not guaranteed by Vermilion Technical Research, LLC, its operating entity or the principals therein. Neither the information nor any opinion expressed constitutes a solicitation for the purchase of any future or security referred to in Vermilion research publications. Principals of Vermilion Technical Research, LLC may or may not hold, or be short of, securities discussed herein, or of any other securities, at any time. The foregoing also expressly applies to any trial subscription.