verisk insurance solutions | iso air worldwide xactware © 2015 verisk analytics, inc. all rights...
TRANSCRIPT
Verisk Insurance Solutions | ISO AIR Worldwide Xactware© 2015 Verisk Analytics, Inc. All rights reserved. Confidential and Proprietary
Avoiding Fraud at the Point of Sale
Bill Ayscue, Sr. Product Manager, Verisk UnderwritingJohn Petricelli, VP Product Management, Verisk Underwriting
Verisk Insurance Solutions | ISO AIR Worldwide Xactware© 2015 Verisk Analytics, Inc. All rights reserved. Confidential and Proprietary
2
Agenda• Fraud – The issue and costs• What to do?-Traditional approach-Perimeter defense
• Fraud correlation• Loss ratio correlation• Other findings• Conclusions

Verisk Insurance Solutions | ISO AIR Worldwide Xactware© 2015 Verisk Analytics, Inc. All rights reserved. Confidential and Proprietary
3
Cost of Fraud
US$80 billion (entire industry)1
3
9% - 18% of auto claim payments (C$769M to C$1.56 billion)2
C$116 to C$236 per year per family2
US$64 billion (P&C) industry3
US$15.4 billion in lost auto premium4
10% of P&C claims, US$13.2 billion in personal auto5
1. Coalition Against Insurance Fraud (http://www.insurancefraud.org/the-impact-of-insurance-fraud.htm)2. Insurance Bureau of Canada / BAC. (http://www.fin.gov.on.ca/en/autoinsurance/submissions/Fraud_Task_Force_Submission.ATTACH.170812.FINAL.pdf)3. FBI (http://www.insurance-research.org/sites/default/files/downloads/IRC_Fraud_NR.pdf)4. Aite Study(http://www.aitegroup.com/report/escalating-war-insurance-fraud-pc-carriers-and-fraudsters-their-games)5. QPC (http://www.verisk.com/underwriting/resources/qpc%20rating%20error%20report%202010_final.pdf6. SNL 2012 P&C Underwriting Analysis

Verisk Insurance Solutions | ISO AIR Worldwide Xactware© 2015 Verisk Analytics, Inc. All rights reserved. Confidential and Proprietary
4
Recent headlines“Insurance Fraud: A $40 billion battle” (Chicago Tribune, 5/3/2013)
“Feds allege $279 million auto insurance fraud scheme in New York” (NBC News, 2/29/2012)
“Two North Texas women sentenced to federal prison for bilking auto insurance companies” (Dallas News, 11/27/2012)
“19 Fraudsters Nabbed As Florida PIP Reform Takes Hold” (PropertyCasualty360, 1/4/2013)
“Durham Group accused of staging car crashes for cash” (WRAL.com, 5/31/2013)
“Vandling man charged with insurance fraud” (The Scranton Times – Tribune, 2/25/2014)
Minn. Man Charged In Auto Insurance Fraud (insurancenewsnet.com, 10/1/2013)
Claims and Coverage: Lawyers key in fight against motor vehicle insurance fraud (Law Times, 10/5/2015)
“Canadian auto personal accident benefits loss ratio highest since 2010” (Canadian Underwriter, 9/24/2015)

Verisk Insurance Solutions | ISO AIR Worldwide Xactware© 2015 Verisk Analytics, Inc. All rights reserved. Confidential and Proprietary
5
Loss ratio is increasing…
4TH 1ST 2ND 3RD 4TH 1ST 2ND 3RD 4TH 1ST 2ND 3RD 4TH 1ST 2ND 3RD 4TH10 11 11 11 11 12 12 12 12 13 13 13 13 14 14 14 14
0.500
0.550
0.600
0.650
0.700
0.750
0.800
0.850
0.900
Liability
Phys Dam
Combined
Linear (Combined)
Lo
ss
Ra
tio
Source: ISO Fast Track

Verisk Insurance Solutions | ISO AIR Worldwide Xactware© 2015 Verisk Analytics, Inc. All rights reserved. Confidential and Proprietary
6
As rates and costs increase…
Source: BLS.gov
Jan 2010
Feb 2010
Mar 2010
Apr 2010
May 2010
Jun 2010
Jul 2010
Aug 2010
Sep 2010
Oct 2010
Nov 2010
Dec 2010
Jan 2011
Feb 2011
Mar 2011
Apr 2011
May 2011
Jun 2011
Jul 2011
Aug 2011
Sep 2011
Oct 2011
Nov 2011
Dec 2011
Jan 2012
Feb 2012
Mar 2012
Apr 2012
May 2012
Jun 2012
Jul 2012
Aug 2012
Sep 2012
Oct 2012
Nov 2012
Dec 2012
Jan 2013
Feb 2013
Mar 2013
Apr 2013
May 2013
Jun 2013
Jul 2013
Aug 2013
Sep 2013
Oct 2013
Nov 2013
Dec 2013
Jan 2014
Feb 2014
Mar 2014
Apr 2014
May 2014
Jun 2014
Jul 2014
Aug 2014
Sep 2014
Oct 2014
Nov 2014
Dec 2014
1
1.05
1.1
1.15
1.2
1.25
PPI
CPI
PP
I/C
PI. J
an
20
10
= 1
.00

Verisk Insurance Solutions | ISO AIR Worldwide Xactware© 2015 Verisk Analytics, Inc. All rights reserved. Confidential and Proprietary
7
And questionable claims increase…
20082009
20102011
20122013
1.00
1.20
1.40
1.60
1.80
Index Exposures Index Claims Index QC Linear (Index QC)
Ind
ex:
20
08
= 1
.0
Sources: Index Exposures and Claims: ISO Fast Track; Questionable Claims: NICB Questionable Claims Report
Verisk Insurance Solutions | ISO AIR Worldwide Xactware© 2015 Verisk Analytics, Inc. All rights reserved. Confidential and Proprietary
8
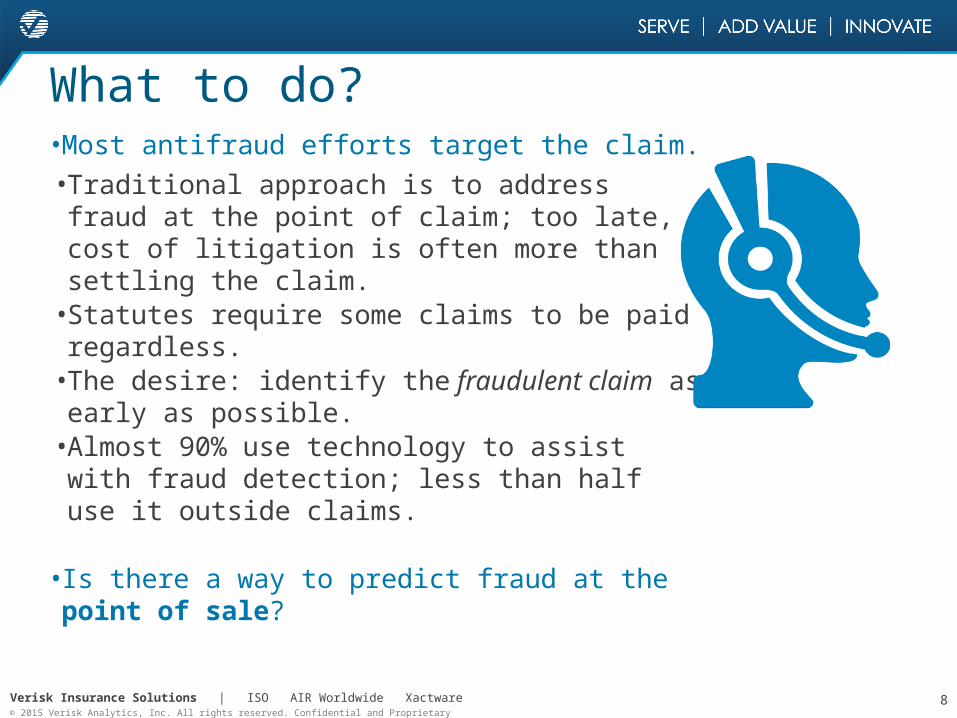
What to do?• Most antifraud efforts target the claim.• Traditional approach is to address fraud at the point of claim; too late, cost of litigation is often more than settling the claim.
• Statutes require some claims to be paid regardless.
• The desire: identify the fraudulent claim as early as possible.
• Almost 90% use technology to assist with fraud detection; less than half use it outside claims.
• Is there a way to predict fraud at the point of sale?

Verisk Insurance Solutions | ISO AIR Worldwide Xactware© 2015 Verisk Analytics, Inc. All rights reserved. Confidential and Proprietary
9
Identify fraud at the point of sale
By validating the information on the application, can we predict:1.A consumer’s propensity to commit fraud
at point of sale prior to bind (hard fraud)?
2.A consumer’s propensity to exaggerate a claim (severity) and/or report nuisance claims (frequency) (soft fraud)?
3.A consumer’s premium avoidance due to the purposeful misrepresentation of characteristics (soft fraud)?

Verisk Insurance Solutions | ISO AIR Worldwide Xactware© 2015 Verisk Analytics, Inc. All rights reserved. Confidential and Proprietary
10
FrameworkFraud is pervasive throughout all aspects of insurance. Carriers need an integrated multifactor framework designed to quantify and predict both hard and soft fraud:
1.Identity • Verify consumers’ identity. Are they who they say
they are, or have they assumed an alternative identity?
2.Location/territory– Is the asset located where the consumer indicated it
is? What’s the proximity to external risks/hazards?
3.Exposure(s)– Are consumers representing the risk adequately or
have they masked/omitted characteristics that could affect rating?

Verisk Insurance Solutions | ISO AIR Worldwide Xactware© 2015 Verisk Analytics, Inc. All rights reserved. Confidential and Proprietary
11
Framework (continued)
4.Asset use• Does the consumer use the asset per the terms of
the policy?
5.Asset ownership– Is the consumer the owner or otherwise authorized
to insure the property?
6.Rating variable validation– Did the consumer represent the characteristics and
condition of the asset correctly?
7.Miscellaneous– Other verifications that do not fit into any of the
other six categories; condition and restrictions fall into this category.

Verisk Insurance Solutions | ISO AIR Worldwide Xactware© 2015 Verisk Analytics, Inc. All rights reserved. Confidential and Proprietary
12
Study methodology
• Analyzed 3+ million policies ($2.64 billion earned premium)
• 1.84 million associated claims ($2.54 billion losses)
• 1,160,626 policies had no claims (38% of policies)
• 920,438 policies had non-suspicious claims (50% of claims)
• 892,034 policies had suspicious claims (48.5% of claims)
• 26,982 flagged as known fraud(1.5% of claims)

Verisk Insurance Solutions | ISO AIR Worldwide Xactware© 2015 Verisk Analytics, Inc. All rights reserved. Confidential and Proprietary
13
Study methodology• We analyzed policyholder applications to
see which exceptions had the highest correlation with known fraud claims.
• Used 7-factor framework approach.
• We performed a loss ratio analysis. • Examined frequency, severity, and
premium leakage/rate evasion.

Verisk Insurance Solutions | ISO AIR Worldwide Xactware© 2015 Verisk Analytics, Inc. All rights reserved. Confidential and Proprietary
14
High exception rate predicts known fraud claims
• The 20% of policies with the most exceptions are 5x more likely to have a known fraud claim.
• Policies with a fraud trigger on the application (2.8%) are 16 times more likely to have a known fraud claim.
• Conversely, the 20% of policies with the fewest exceptions are 60% less likely to have a known fraud claim.
Best 20% Mid 60% Worst 20%0%
20%
40%
60%
80%
% Policies % Claims
% Suspect Claims % Known Fraud
% o
f to
tal p
olic
ies
Fraud Trigger0%
20%
40%

Verisk Insurance Solutions | ISO AIR Worldwide Xactware© 2015 Verisk Analytics, Inc. All rights reserved. Confidential and Proprietary
15
Fraud triggersWithin the 7-factor framework, we have 2 major types of
exceptions:
Application information cannot be confirmed.
Could be due to fraud, but could also be the result of a transitory lifestyle.
Application information is negatively confirmed.
Reflects information that is intentionally excluded or misrepresented (e.g., I “forgot about” my 16-year-old child).
Fraud triggers are the negative exceptions most highly correlated with known fraud claims.

Verisk Insurance Solutions | ISO AIR Worldwide Xactware© 2015 Verisk Analytics, Inc. All rights reserved. Confidential and Proprietary
16
High exception rate also predicts loss ratio
• In addition to predicting fraudulent claims, high incidence of application misrepresentation correlated to higher loss ratios.
• Studies of more recent data continue to show this relationship.
Best 2
0%
Mid
60%
Wor
st 20
%
Highe
st Exc
eptio
n Gro
up50%
70%
90%
110%
130%

Verisk Insurance Solutions | ISO AIR Worldwide Xactware© 2015 Verisk Analytics, Inc. All rights reserved. Confidential and Proprietary
17
Findings from recent studies
0%
100%
200%
300%
400%
0%
20%
40%
60%
80%
68.1%
2.1% 2.9% 1.4% 0.4% 0.8% 0.4%
1.0
1.6 1.6 1.61.8
2.5
2.9
% PIFLR Relativity
LR
re
lativ
ity
% P
IF
More recent studies show correlations between types of exceptions and loss ratio:
• 0–1 exception group is base loss ratio.
• Identity and branded title have a 60% loss ratio relativity.
• Combination of address, ownership, and branded title has the highest LR relativity.

Verisk Insurance Solutions | ISO AIR Worldwide Xactware© 2015 Verisk Analytics, Inc. All rights reserved. Confidential and Proprietary
18
Other interesting correlations
Individual triggers with high loss ratios
• Phone number = paging service
• Vehicle registration state ≠ policy state
Foreign driver’s license
• FDLs tend to have favorable performance, unless (pretenders) attempting to hide a valid state DL.
Verisk Insurance Solutions | ISO AIR Worldwide Xactware© 2015 Verisk Analytics, Inc. All rights reserved. Confidential and Proprietary
19
Conclusion
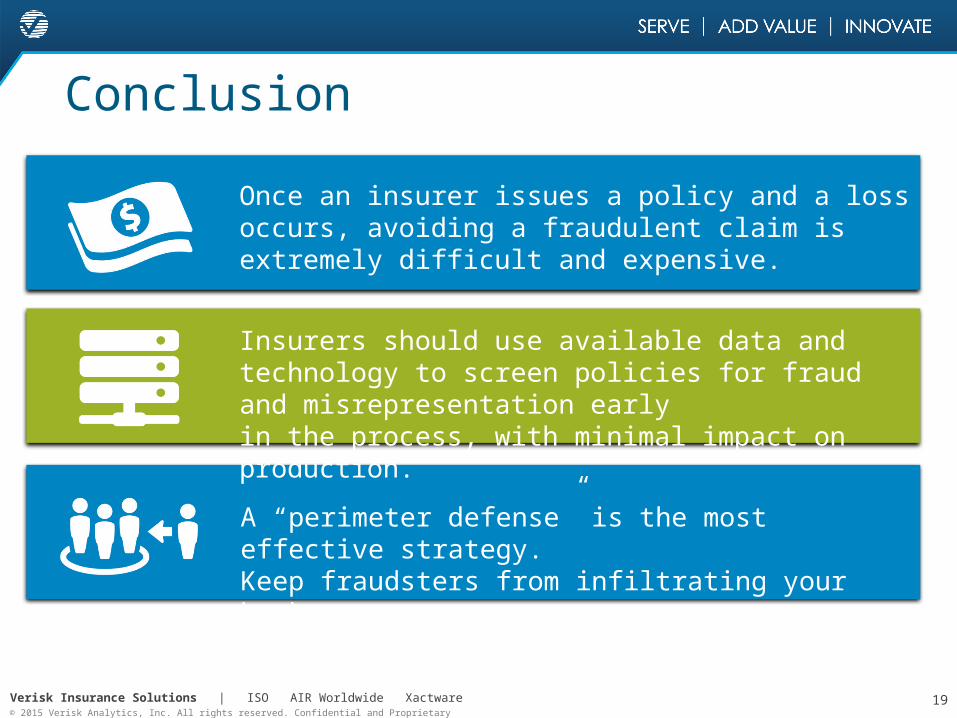
Once an insurer issues a policy and a loss occurs, avoiding a fraudulent claim is extremely difficult and expensive.
Insurers should use available data and technology to screen policies for fraud and misrepresentation early in the process, with minimal impact on production.
A “perimeter defense” is the most effective strategy. Keep fraudsters from infiltrating your book.

Verisk Insurance Solutions | ISO AIR Worldwide Xactware© 2015 Verisk Analytics, Inc. All rights reserved. Confidential and Proprietary© 2015 Verisk Analytics, Inc. All rights reserved. Confidential and Proprietary
Recent Studies

Verisk Insurance Solutions | ISO AIR Worldwide Xactware© 2015 Verisk Analytics, Inc. All rights reserved. Confidential and Proprietary
21
Need for change• Millennial demographic not as concerned
with price as older consumers; want easy and fair;
– Not into vehicles like Baby Boomers– Migrating to cities, leverage “shared”
vehicles, many people using the same vehicle– Into Uber, Lyft, Zipcar (as users and
providers)
• Insurers who present the most accurate/fair quote early in the process will win.
• Sale of insurance needs to be like every other online transaction: short, minimal input, easy to close, and high quality.
• Verification must be behind the scenes and transparent to the customer.

Verisk Insurance Solutions | ISO AIR Worldwide Xactware© 2015 Verisk Analytics, Inc. All rights reserved. Confidential and Proprietary
22
And the winner is…
• Can simplify consumer’s interaction and dramatically reduce the time to acquisition to 1 minute or less
• Can figure out how to break out of the current “household” paradigm and define the household and thus the risk
• Finds alternative ways to consume information and underwriting reports
– Current information providers are not helping; they have defined when and how consumer reports are purchased
– Consuming the same underwriting reports earlier in the acquisition lifecycle will lead to more expense
The carrier that:

Verisk Insurance Solutions | ISO AIR Worldwide Xactware© 2015 Verisk Analytics, Inc. All rights reserved. Confidential and Proprietary
23
And the winner is…
The serviceprovider that:
• Can apply population-specific advanced analytics at point of sale
• Will assess and adjust the information being provided before transmission to the insurer (quality is key)
• Invents new ways to format and deliver underwriting reports early in the quoting process without dramatically increasing an insurer’s expense
• Will work with and help the insurer determine when enough is enough; not all consumers will require the same level of information and scrutiny
• The result is lower acquisition cost per unit
Verisk Insurance Solutions | ISO AIR Worldwide Xactware© 2015 Verisk Analytics, Inc. All rights reserved. Confidential and Proprietary
24
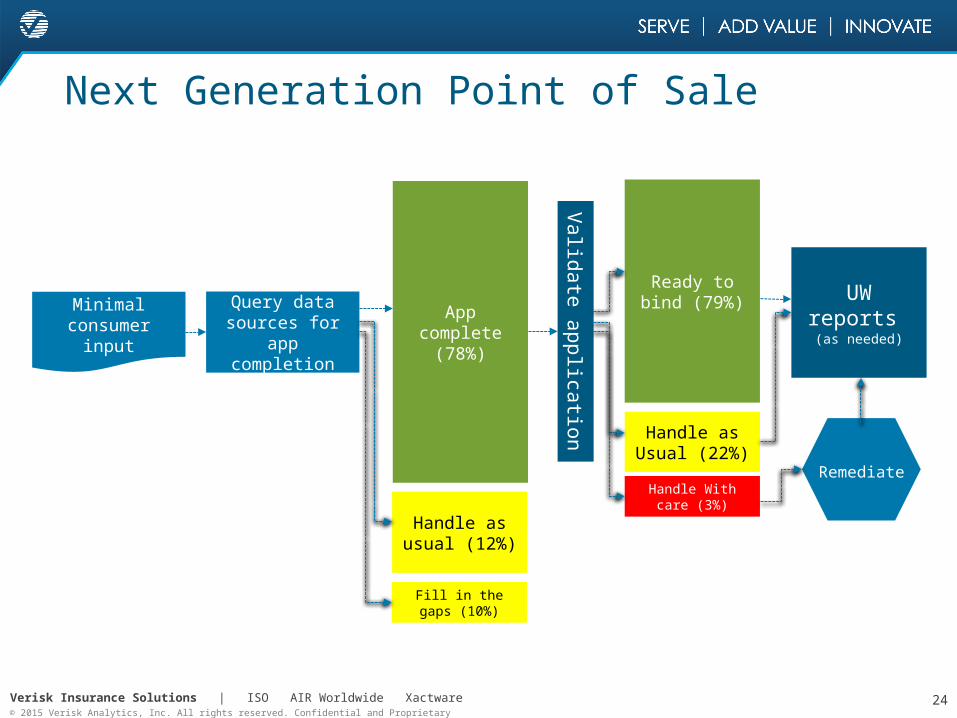
Next Generation Point of Sale
Minimal consumer
input
Query data sources for app
completion
App complete
(78%)
Ready to bind (79%)
Handle as Usual (22%)
Handle With care (3%)
Fill in the gaps (10%)
Handle as usual (12%)
Valid
ate
applica
tion
Remediate
UW reports (as needed)

Verisk Insurance Solutions | ISO AIR Worldwide Xactware© 2015 Verisk Analytics, Inc. All rights reserved. Confidential and Proprietary
25
Findings• Initial analysis showed that 78% of applications
could be completed using independent data sources with minimal customer input.
– The resulting applications were validated using secondary sources.
– Over 50% of the applications were fully validated; nearly double what we see in applications completed by consumers or using standard application prefill approaches.
• 12% had minimal exceptions
– 2.5% of applications contained significant variations; current processes result in two to three times as many “high-risk” applications.
• Financial outcomes– Historical analysis shows that policies with
minimal exceptions (62% above) perform 52% better than those “high-risk” policies with significant variances .
– The distribution shift alone yields a loss ratio improvement before any remediation.

Verisk Insurance Solutions | ISO AIR Worldwide Xactware© 2015 Verisk Analytics, Inc. All rights reserved. Confidential and Proprietary
26
Questions / Discussion