verisign distributed denial of service …verisign ddos trends report | q2 2016 10 figure 5: peak...
TRANSCRIPT

VERISIGN DISTRIBUTED DENIAL OF SERVICE TRENDS REPORTVOLUME 3, ISSUE 2 – 2ND QUARTER 2016

EXECUTIVE SUMMARY 3
VERISIGN-OBSERVED DDoS ATTACK TRENDS: Q2 2016 4DDoS Attacks Become More Sophisticated and Persistent 4Multi-Vector DDoS Attacks Dominate 6DDoS Attacks Remain Unpredictable 8Every Organization Is at Risk 9
FEATURE: DEFENDING AGAINST LAYER 7 APPLICATION ATTACKS 11
VERISIGN DDoS TRENDS REPORT | Q2 2016 2
CONTENTS

EXECUTIVE SUMMARYThis report contains the observations and insights derived from distributed denial of service (DDoS) attack mitigations enacted on behalf of, and in cooperation with, customers of Verisign DDoS Protection Services from April 1, 2016 through June 30, 2016 (“Q2 2016”) and the security research of Verisign iDefense® Security Intelligence Services conducted during that time. It represents a unique view into the attack trends unfolding online, including attack statistics and behavioral trends for Q2 2016.*
Verisign observed the following key trends in Q2 2016:
VERISIGN DDoS TRENDS REPORT | Q2 2016 3
75%increase year over year
Number of Attacks
Volume256 Gigabits per second (Gbps)
Peak Attack Size
Speed64 Million packets per second (Mpps)
17.37 GbpsDriven by multiple, persistent 100+ Gbps attacks
Average Peak Attack Size
32%of attacks over 10 Gbps
56%of attacks were User Datagram Protocol (UDP) floods
Most Common Attack Mitigated
64%of attacks employed multiple attack types
45%of mitigation activity
IT Services/Cloud/SaaS

VERISIGN-OBSERVED DDoS ATTACK TRENDS: Q2 2016DDoS Attacks Become More Sophisticated and PersistentDDoS attacks are a reality for today’s web-reliant organizations. In Q2 2016, DDoS attacks continued to become more frequent, persistent and complex.
Attack Frequency
Attackers in Q2 2016 launched sustained attacks against targets with a few customers attacked repeatedly throughout the quarter.
Figure 1: Mitigation Peaks by Quarter from Q3 2014 to Q2 2016
2015-Q1 2015-Q2 2015-Q3 2015-Q4 2016-Q1 2016-Q2
>10 Gbps>5<10 Gbps>1<5 Gbps<1 Gbps
0
20
40
60
80
100
Perc
ent o
f Atta
cks
2014-Q3 2014-Q4
VERISIGN DDoS TRENDS REPORT | Q2 2016 4
75% increase year over year
75% peaked over 1 Gbps 32% peaked over
10 Gbps
Attack Size
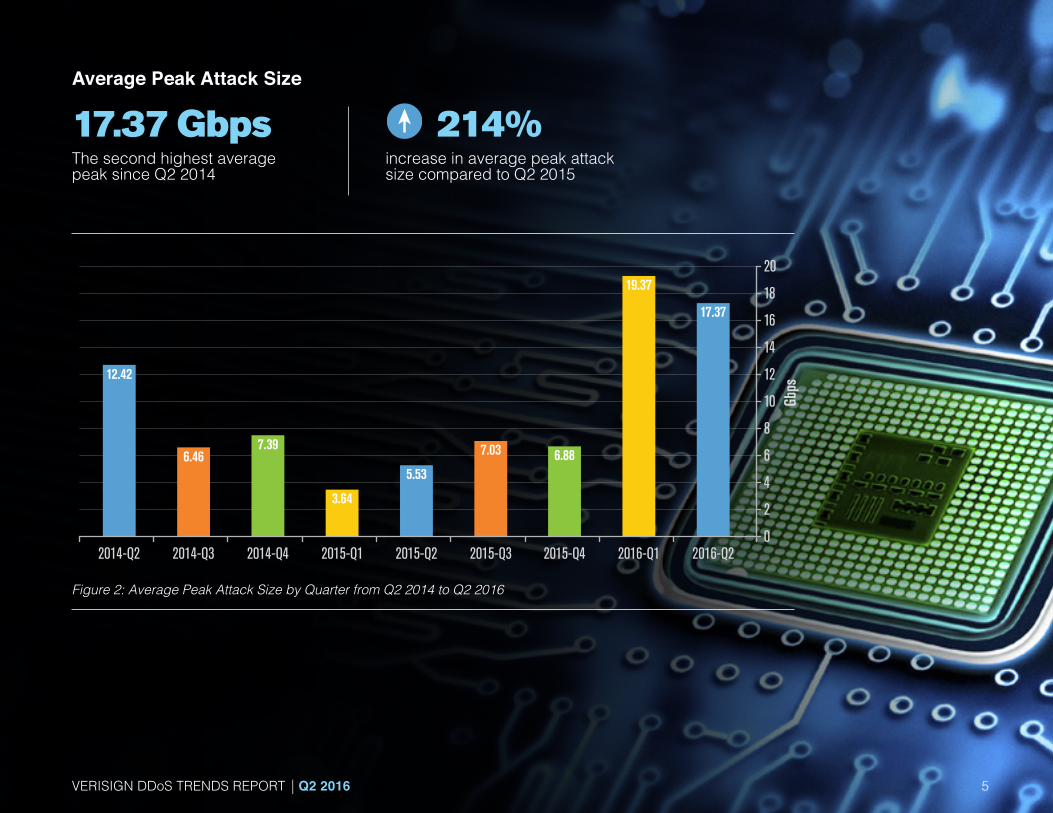
Average Peak Attack Size
Figure 2: Average Peak Attack Size by Quarter from Q2 2014 to Q2 2016
6.885.53
3.64
7.036.467.39
2015-Q1 2015-Q2 2015-Q3 2015-Q4
19.37
2016-Q1
17.37
2016-Q20
2
4
6
8
10
12
14
16
18
20
2014-Q42014-Q3
12.42
2014-Q2
Gbps
VERISIGN DDoS TRENDS REPORT | Q2 2016 5
17.37 GbpsThe second highest average peak since Q2 2014
214%increase in average peak attack size compared to Q2 2015

64%of the DDoS attacks in Q2
2016 employed multiple attack types
Multi-Vector DDoS Attacks DominateSixty-four percent of the DDoS attacks mitigated by Verisign in Q2 2016 employed multiple attack types indicating that DDoS attacks continue to increase in complexity, and as a result, require more time and effort to mitigate.
Figure 3: Number of Attack Types Per DDoS Event in Q2 2016
1 Attack Type2 Attack Types3 Attack Types4 Attack Types5 or More Attack Types
36%
29%
19%
7%
9%
VERISIGN DDoS TRENDS REPORT | Q2 2016 6

VERISIGN DDoS TRENDS REPORT | Q2 2016 7
IP Fragment AttacksApplication LayerTCP BasedUDP BasedOther
56%
18%
15%
8%
3%
Continuing the trend from Q1 2016, the most common DDoS attack types in Q2 2016 were UDP floods (including Domain Name System (DNS), Network Time Protocol (NTP), Simple Service Discovery Protocol (SSDP) and Chargen) - making up 56 percent of the total attacks in the quarter. The most common UDP floods mitigated were DNS reflection attacks, followed by NTP reflection attacks. 56%
of attacks were UDP FLOODS
Figure 4: Types of DDoS Attacks in Q2 2016
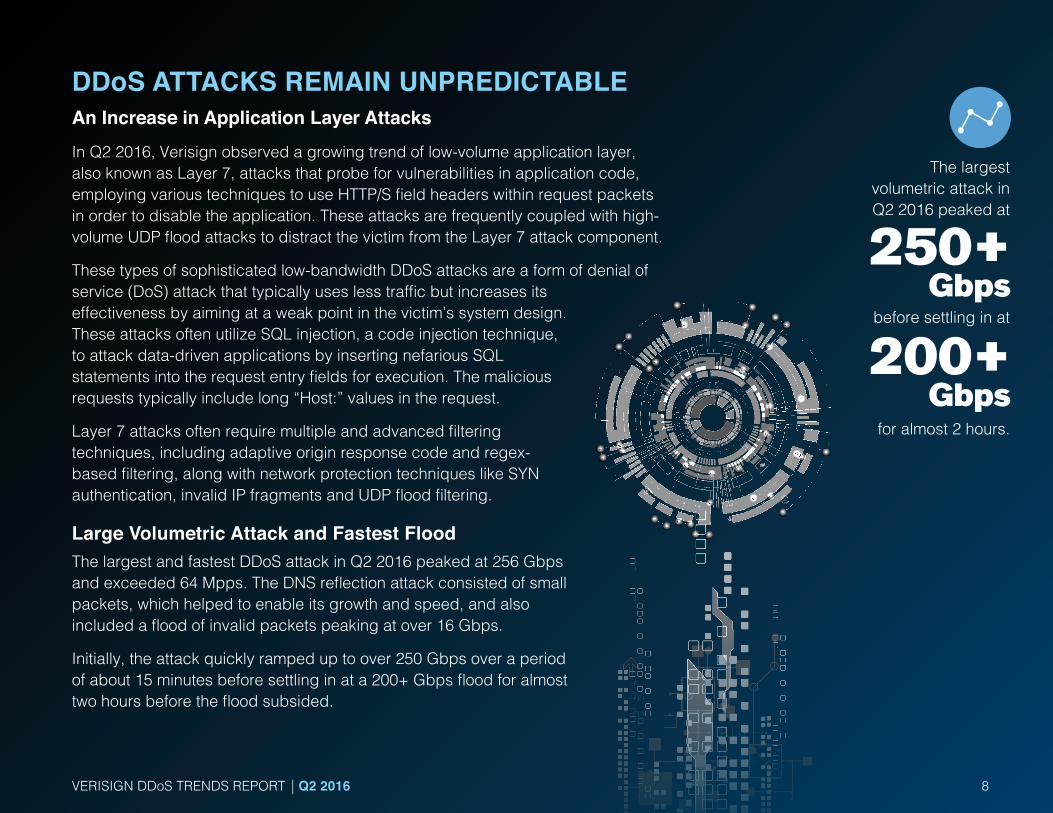
DDoS ATTACKS REMAIN UNPREDICTABLE An Increase in Application Layer AttacksIn Q2 2016, Verisign observed a growing trend of low-volume application layer, also known as Layer 7, attacks that probe for vulnerabilities in application code, employing various techniques to use HTTP/S field headers within request packets in order to disable the application. These attacks are frequently coupled with high-volume UDP flood attacks to distract the victim from the Layer 7 attack component.
These types of sophisticated low-bandwidth DDoS attacks are a form of denial of service (DoS) attack that typically uses less traffic but increases its effectiveness by aiming at a weak point in the victim’s system design. These attacks often utilize SQL injection, a code injection technique, to attack data-driven applications by inserting nefarious SQL statements into the request entry fields for execution. The malicious requests typically include long “Host:” values in the request.
Layer 7 attacks often require multiple and advanced filtering techniques, including adaptive origin response code and regex-based filtering, along with network protection techniques like SYN authentication, invalid IP fragments and UDP flood filtering.
Large Volumetric Attack and Fastest FloodThe largest and fastest DDoS attack in Q2 2016 peaked at 256 Gbps and exceeded 64 Mpps. The DNS reflection attack consisted of small packets, which helped to enable its growth and speed, and also included a flood of invalid packets peaking at over 16 Gbps.
Initially, the attack quickly ramped up to over 250 Gbps over a period of about 15 minutes before settling in at a 200+ Gbps flood for almost two hours before the flood subsided.
VERISIGN DDoS TRENDS REPORT | Q2 2016 8
250+ Gbps
200+ Gbps
The largest volumetric attack in Q2 2016 peaked at
before settling in at
for almost 2 hours.

17.2 Gbps
Average attack size:
29.1 Gbps
Average attack size:
3.54 Gbps
Average attack size:
5.5 Gbps
Average attack size:
67.8 Gbps
Average attack size:
(driven by several large events targeting this vertical)
VERISIGN DDoS TRENDS REPORT | Q2 2016 9
Mitigations on behalf of Verisign Customers by Industry for Q2 20161
45%of mitigations
IT Services/Cloud/SaaS
Financial
23%of mitigations
Public Sector
14%of mitigations
11%of mitigations(up from 4% of mitigations in Q1)
E-Commerce and Online Advertising
Media and Entertainment/Content
5%of mitigations
Telecommunications and Other
2%of mitigations
Every Organization is at RiskDDoS attacks are not limited to any specific industry or vertical.
1 The attacks reported by industry in this document are solely a reflection of the Verisign-protected customer base; however, this data may be helpful in understanding the evolution of attacks by industry and the importance of prioritizing security expenditures to ensure protection mechanisms are in place.
9.7 Gbps
Average attack size:
The Media & Entertainment and Financial industries continue to experience some of the largest average attack sizes in Q2 2016. The average attack size for the Media & Entertainment industry was 67.8 Gbps and 29.1 Gbps for the Financial industry.

VERISIGN DDoS TRENDS REPORT | Q2 2016 10
Figure 5: Peak Attack Size by Industry (Quarterly)
Financial IT Services/Cloud/SaaS
E-Commerce/Online
Media &Entertainment
Q1 2016 Q2 2016Q3 2015 Q4 2015
0
50
100
150
200
250
300
Gbps
Telecommunications& Other
Public Sector
Peak Attack Size by Industry (Quarterly)

FEATUREDEFENDING AGAINST LAYER 7 DDoS ATTACKS Layer 7 attacks are some of the most difficult attacks to mitigate because they mimic normal user behavior and are harder to identify. The application layer (per the Open Systems Interconnection model) consists of protocols that focus on process-to-process communication across an IP network and is the only layer that directly interacts with the end user. A sophisticated Layer 7 attack may target specific areas of a website, making it even more difficult to separate from normal traffic. For example, a Layer 7 DDoS attack might target a website element (e.g., company logo or page graphic) to consume resources every time it is downloaded with the intent to exhaust the server. Additionally, some attackers may use Layer 7 DDoS attacks as diversionary tactics to steal information.
A Multi-Vector Approach
Verisign’s recent trends show that DDoS attacks are becoming more sophisticated and complex, including an increase in application layer attacks. Verisign has observed that Layer 7 attacks are regularly mixed in with Layer 3 and Layer 4 DDoS flooding attacks. In fact, 35 percent of DDoS attacks mitigated in Q2 2016 utilized three or more attack types.
In a recent Layer 7 DDoS attack mitigated by Verisign, the attackers started out with NTP and SSDP reflection attacks that generated volumetric floods of UDP traffic peaking over 50 Gbps and over 5 Mpps designed to consume the target organization’s bandwidth. Verisign’s analysis shows that the attack was launched from a well-distributed botnet of more than 30,000 bots from across the globe with almost half of the attack traffic originating in the United States.
VERISIGN DDoS TRENDS REPORT | Q2 2016 11

VERISIGN DDoS TRENDS REPORT | Q2 2016 12
Figure 6: Map of Botnets From Recent Layer 7 Attack Mitigated by Verisign(Note: The above geolocation is based on source IPs that may have been spoofed)
Once the attackers realized that the volumetric attack was mitigated, they progressed to Layer 7 HTTP/HTTPS attacks. Hoping to exhaust the server, the attackers flooded the target organization with a large number of HTTPS GET/POST requests using the following methods, amongst others:
• Basic HTTP Floods: Requests for URLs with an old version of HTTP no longer used by the latest browsers or proxies
• WordPress Floods: WordPress pingback attacks where the requests bypassed all caching by including a random number in the URL to make each request appear unique
• Randomized HTTP Floods: Requests for random URLs that do not exist – for example, if www.example.com is the valid URL, the attackers were abusing this by requesting pages like www.example.com/loc id=12345, etc.

VERISIGN DDoS TRENDS REPORT | Q2 2016 13
Lessons Learned
The challenge with a Layer 7 DDoS attack lies in the ability to distinguish human traffic from bot traffic, which can make it harder to defend against the volumetric attacks. As Layer 7 attacks continue to grow in complexity with ever-changing attack signatures and patterns, organizations and DDoS mitigation providers will need to have a dynamic mitigation strategy in place. Layer 7 visibility along with proactive monitoring and advanced alerting are critical to effectively defend against increasing Layer 7 threats.
As organizations develop their DDoS protection strategies, many may focus solely on solutions that can handle large network layer attacks. However, they should also consider whether the solution can detect and mitigate Layer 7 attacks, which require less bandwidth and fewer packets to achieve the same goal of bringing down a site.
TO LEARN MORE ABOUT VERISIGN DDoS PROTECTION SERVICES, VISIT Verisign.com/DDoS.
About VerisignVerisign, a global leader in domain names and internet security, enables internet navigation for many of the world’s most recognized domain names and provides protection for websites and enterprises around the world. Verisign ensures the security, stability and resiliency of key internet infrastructure and services, including the .com and .net domains and two of the internet’s root servers, as well as performs the root-zone maintainer function for the core of the internet’s Domain Name System (DNS). Verisign’s Security Services include intelligence-driven Distributed Denial of Service Protection, iDefense Security Intelligence and Managed DNS. To learn more about what it means to be Powered by Verisign, please visit Verisign.com.
*The information in this Verisign Distributed Denial of Service Trends Report (this “Report”) is believed by Verisign to be accurate at the time of publishing based on currently available information. Verisign provides this Report for your use in “AS IS” condition and at your own risk. Verisign does not make and disclaims all representations and warranties of any kind with regard to this Report including, but not limited to, any warranties of merchantability or fitness for a particular purpose.

Verisign Public VRSN_DDoS_TR_Q2-16_201608
Verisign.com© 2016 VeriSign, Inc. All rights reserved. VERISIGN and other trademarks, service marks, and designs are registered or unregistered trademarks of VeriSign, Inc. and its subsidiaries in the United States and in foreign countries. All other trademarks are property of their respective owners.