verifying the validity of altman’s z” score as a predictor...
TRANSCRIPT

1 | P a g e
Verifying the Validity of Altman’s Z” Score as a Predictor of
Bank Failures in the Case of the Eurozone
Jasmine Rose Chieng
MSc. Management
National College of Ireland
Submitted to the National College of Ireland, September 2013

2 | P a g e
Abstract
In light of recent events that have taken place in the Eurozone, the importance of
knowing the financial position of banks is imperative to stakeholders. There is a major dearth
of literature that examines the applicability of Altman’s Z” Score model to forecasting
banking failures. The focus of this study is to confirm the validity of Altman’s Z” Score
model as a predictor of Eurozone bank failures. This requires two data sets: failed and non-
failed banks. Four distressed banks were benchmarked to four comparable control banks.
Ratio analysis was carried out on the failed bank’s financial statements for five years prior to
their bankruptcy or nationalisation as the Z” Score model has predictive power of up to five
years pre-bankruptcy. The empirical findings verified the predictive ability of the Z” Score
model to the euro area banks.

3 | P a g e
Declaration
I declare that this thesis, which I submit to NCI for examination in consideration of
the award of a higher degree MSc. Management is my own personal effort. Where any of the
content presented is the result of input or data from a related collaborative research
programme this is duly acknowledged in the text such that it is possible to ascertain how
much of the work is my own. I have not already obtained a degree in NCI or elsewhere on the
basis of this work. Furthermore, I took reasonable care to ensure that the work is original,
and, to the best of my knowledge, does not breach copyright law, and has not been taken
from other sources except where such work has been cited and acknowledged within the text.
Signed _____________________________________________________
Student Number ______________________________________________
Date _______________________________________________________

4 | P a g e
Acknowledgements
I would like to thank David Robert Jones for the inspirational guidance he has given
me these past few months. Along with other influential people such as Ben Bernanke, Robert
Winston, MC Ride and Luca Pacioli who have given me such interest in approaching this
study. I would also like to thank my family; my parents, grandparents and my auntie Brenda.
And also my best friends Lyndsey, Helen, Lewis and in particular, I would like to thank
Conor Robotham for his unrelentless support, care and encouragement throughout my higher
level education.

5 | P a g e
Contents
Abstract ................................................................................................................................................... 2
Declaration .............................................................................................................................................. 3
Acknowledgements ................................................................................................................................. 4
I. Introduction ..................................................................................................................................... 6
II. Literature Review ............................................................................................................................ 9
III. Methodology ............................................................................................................................. 24
Dataset .............................................................................................................................................. 25
The Statistical Model ........................................................................................................................ 27
Variables Explained ........................................................................................................................... 28
X1: Working Capital/Total Assets .................................................................................................. 28
X2: Retained Earnings/Total Assets ............................................................................................... 28
X3: Earnings before Interest and Taxes/Total Assets .................................................................... 28
X4: Book Value Equity/ Total Liabilities ......................................................................................... 29
IV. Empirical Results ....................................................................................................................... 29
Z” Score Results ................................................................................................................................ 29
Book Value of Equity to Total Liabilities ........................................................................................... 32
V. Discussion ..................................................................................................................................... 33
VI. Limitations................................................................................................................................. 39
VII. Conclusion ................................................................................................................................. 42
Bibliography .......................................................................................................................................... 44
Appendix ............................................................................................................................................... 48
Financial Statements ......................................................................................................................... 48
Z” Score Model Excel Workings (See disc attached for files) ............................................................ 53
AIB ................................................................................................................................................. 53
Anglo Irish Bank ............................................................................................................................ 54
Banca D’Italia ................................................................................................................................ 55
Danske Bank .................................................................................................................................. 56
Deutsche Bank .............................................................................................................................. 57
Dexia ............................................................................................................................................. 58
Proton ........................................................................................................................................... 59
Santander ...................................................................................................................................... 60
Statistics ........................................................................................................................................ 61

6 | P a g e
I. Introduction
The current financial crisis is the biggest cataclysm since the 1929 great depression in the
US although extensive research carried out post-depression fixated only on corporate failures.
Considering the depression was itself caused by undiversifiable risk due to the collapsed
banking system and not by the corporations themselves, there has been a major dearth of
accounting and finance literature related to banking failure prediction models. The studies
would have been more effective and relevant if they were focused on the fragility of the
banking structure. The global financial system has been under astronomical stress the past six
years; this has affected the credit market directly by fostering downgraded consumer
confidence and hence diminishing growth in economic activity, particularly for the Eurozone.
The reason why Eurozone banks will be the focus of this study is due to the
unprecedented events that have occurred over the past six years. The most significant
occurring in April 2010; the downgrading of Greek government debt to junk bond status sent
alarms throughout the global financial markets. This contagion from Greece threatened the
fate of the Euro-area and the common currency. It highlighted large fault lines in the
Eurozone as the collapse of a banking system in one European country could easily trigger
the demise of other euro banks. The IMF had no option but to inject a €110 billion bailout.
While Greece is ‘temporarily patched up’ the focus has shifted to the other Eurozone
countries Ireland, Spain, Italy and Portugal. The ECB is keeping very tight surveillance of its
monetary policy, with very low inflation levels amid the euro area recovery. Meanwhile, the
Bank of England and Federal Reserve are ‘routinely’ injecting heavy doses of quantitative
easing into their economies. The US are deliberately weakening the dollar in order to increase
economic growth. This is exposing a host of problems to the Euro as it is making the euro
currency stronger and less competitive. Contagion from Greece still threatens the euro.
(Merk, 2012) This pattern was also evident from the great depression as the countries holding

7 | P a g e
on to the gold standard had stronger currencies but endured painful fiscal and political
consequences which can be seen in the euro zone today.
Business failures are a natural phenomena in our economic system with firms entering
and exiting as a function of overall business activity and expectations (Altman & Loris, 1976,
p.1). Corporate failure is the sequential conclusion due to systematic and non-systematic
factors. Financial and accounting literature has over and over again renewed the confidence
in ratio analysis as a proficient predictor of corporate failure. Nevertheless, more attention
should be focused on the prediction of banking failures. While ratio analysis forecasts
potential corporate failures using Altman’s Z test (1968), Beaver’s (1966) univarite test and
so forth, the significant limitation of these models are the fact they can only be applied to
manufacturing firms.
The focus of my study is to apply an evolved model of Altman’s Z Score namely the
‘Z” Score model’ (Altman, Hartzell and Peck, 1995) to failed Eurozone banks. This model
overcomes the manufacturing limitation of Altman’s pioneering model and can be used on
financial institutions. The main objective is to verify if the Z” Score is a true indicator of
financial failure for a Eurozone financial institution. The recent global crisis has
demonstrated the importance of banks both at national and international levels. In particular,
the Eurozone has been greatly affected by widespread contagion which has drastically
diminished the credibility of the single currency euro.
The remaining part of this study shall be outlined as follows: in section II, an up-to
date review of the literature in relation to failure prediction models will be carried out with
particular focus on the evolution of Altman’s Z Score model which will be later on utilised in
the research. In section III, there will be an explanation of the data collected and used,
applicable to the statistical model that will answer the objectives of this study. Section IV will
contain the empirical results of the analysis. Section V will be the discussion of these Z”

8 | P a g e
Score results. The limitations associated with the methodology used will be discussed in
section VI and, finally, the conclusion of this study will be discussed in section VII.

9 | P a g e
On Franklin National
"People who can read a balance sheet were out of there long ago."
—Harry Keefe
II. Literature Review
The emergence of the financial crisis in 2008, brought with it a tide of corporate failures
rooted in the American subprime mortgage crisis. A January 2011 report put forward by the
U.S. Financial Crisis Inquiry Commission concluded that
"the crisis was avoidable and was caused by: Widespread failures in financial
regulation, including the Federal Reserve’s failure to stem the tide of toxic
mortgages; Dramatic breakdowns in corporate governance including too many
financial firms acting recklessly and taking on too much risk; An explosive mix of
excessive borrowing and risk by households and Wall Street that put the financial
system on a collision course with crisis; Key policy makers ill prepared for the crisis,
lacking a full understanding of the financial system they oversaw; and systemic
breaches in accountability and ethics at all levels.’’ (Tucker, 2011, p.1)
Deterring away from this domestic view, monetarist and chairman of the Federal Reserve
took a more macroeconomic view coining the famous ‘global savings glut’ theory. In a
statement made at a lecture in Virginia 2005, he spoke about the correlation between
excessive savings made in developing countries, particularly China, and the US current
account deficit along with low-long term interest rates globally (Bernanke, 2005).
Nevertheless, numerous economists are assigning the causations to be rooted “in high interest
rates, recession-squeezed profits and heavy debt burdens. Furthermore, industry-specific
characteristics, such as government regulation and the nature of operations, can contribute to
a firm’s financial distress” (Charitou, Neophytou & Charalambous, 2000, p.3). Failure has
been also significantly linked to the “prevailing tight monetary policy; the investor's
expectations' about economic conditions; and the state of the economy” (Dambolena &
Khoury, 1980, p.1019)

10 | P a g e
At any rate, although there remains a multitude of possible roots, it is without a doubt
that the financial crisis raised its aggressive head in the American banking system and
crossed the Atlantic in the form of detrimental financial contagion. The 2008 bankruptcy of
the Lehman brothers, the largest bankruptcy in US history, spread shock to the whole
financial system and to other financial markets. Ireland was one of the first Eurozone
countries to slip into recession days after the Lehman Brothers collapse. Ireland had sustained
growth achievement for two decades yet it was one of the most severely affected countries in
the global crisis. This shows the fragility of the banking system in response to contagion.
This has had substantial affects on the credit market leading to a high rate of corporate
failures, particularly with highly geared companies.
Simic, Kovac & Simic (2012, p.536) stated ‘corporate failure prediction is essential
for the prevention or mitigation of negative economic cycles in a national economy.
Particularly after the collapse of large banks during the great depression such as Fannie Mae,
Citigroup New York, Merrill Lynch and, of course, Lehman Brothers and Anglo Irish Bank.
The importance of bankruptcy prediction has become a significant concern for corporate
governance (Gilson, 1989; Gilson, 1990; Datta & Iskandar-Datta, 1995). It is also argued by
Daily and Dalton (1994) that there is a relationship between corporate failure and corporate
governance characteristics.
The identification of early warning signals in failing firms can deter managers from
making poor investment decisions and implementing preventative actions to offset possible
future catastrophes. Telmoudi et al (2011) stated:
‘‘Prediction may avoid high social costs affecting stakeholders (i.e. investors,
managers, governments, etc. and limit its undesirable impact on a country’s economic
performance. Firms are always endeavouring to find a countermeasure for
undesirable situations where bankruptcy plays an increasingly important role
because it has a significant impact on the profitability of business units. It serves to
provide owners with a timely early warning system.’’

11 | P a g e
Contemporary corporate failure prediction models have been based on the pioneering
work of William H. Beaver. Beaver (1966) carried out univariate analysis, comparing the
financial ratios of 79 failed firms and 79 non-failing firms. His utilization of the paired-
sample approach and the use of a hold-out sample to validate the model has been a
benchmark for later researchers (Moghadam, Zadeh, Fard, 2011, p.3). He examined the
predictive power of thirty accounting ratios for five consecutive years leading up to the
bankruptcy of the tested firms. Beaver applied 3 criteria in selecting these ratios; “widely
used in past literature, good performance of ratios in past studies and the capability of ratios
to be defined as "cash flow" concept” (Siew Bee & Abdollahi, 2011, p.6826). A
misclassification rate was used as an index to gauge the predictive power of the variables.
Misclassification could either be a Type I error (classifying a failing firm as non-failing), or
Type II error (classifying a non-failing firm as failing) (Bunyaminu & Issah, 2012). The
smaller the misclassification rate; the greater the accuracy. The ‘cash flow to debt ratio’
resulted in being the best predictor of corporate failure with a 78% success rate as
“Five years before failure, an optimal prediction criterion (i.e., cutoff value) based on
the single accounting ratio misclassified only 22 per cent of the validation; one year
prior to failure the criterion misclassified only 13 per cent of the validation sample.”
(Salehi & Abedini, 2009, p.399)
The second best indicator was ‘net income to total assets’ ratio with misclassification rate of
13% for first year before failure and misclassification rate of 28% for the 5th year before
failure. The 3rd
, 4th
, 5th
, and 6th
ranks belonged to ‘total debt to total assets’, ‘working capital
to total assets’, current ratio, and no credit interval ratios respectively.
A limitation of Beaver’s work is based primarily on the univariate nature of the model
he developed. It only allows for one ratio used at a time, this can give inconsistent results for
a firm should other ratios be utilized. Not only this, but the financial complexity of a firm
cannot be captured by one single ratio. Lastly, the cut-off point determined is chosen post-

12 | P a g e
failure of a company which means that, in reality, the failure status of a company must be
predicted resulting in inaccurate classifications.
In 1968 Edward Altman advanced upon Beaver’s work by incorporating four more
variables into the model to give an overall more precise prediction of manufacturing
corporate failure. Altman’s multi-discriminant analysis (MDA) model differed to Beavers
model in relation to the ratios chosen of highest prediction. Altman classifies the companies
into two mutually exclusive groups; bankrupt and non-bankrupt (Altman, 1968, p.591).
Altman’s discriminate analysis became a dominant model used in corporate failure prediction
literature due to its simplicity and accuracy. His multi-discriminant approach allowed him to
develop the equation into a combination of five ratios consisting of liquidity, profitability,
financial leverage, solvency, and sales activity (sales to total assets). This linear equation
distinguished between failing and non-failing companies. The result of the combination of
ratios gives rise to a discriminant score otherwise known as the ‘Z score’. Altman applied 22
ratios to 66 manufacturing firms (with an equal number of failures and non-failures). From
the 22 ratios he utilized, the best five predictors were chosen. These were then presented in
the linear equation as shown below.
The original Altman model took the following form:
Z=0.012 X1 + 0.014 X2 + 0.033 X3 + 0.006 X4 + 0.999 X5
Where:
X1=Working capital/Total assets;
X2=Retained earnings/ Total assets;
X3=Earnings before interest and taxes/Total assets;
X4=Market value of equity/Book value of Total liabilities;
X5=Sales/Total assets.
Boundary values:
Z > 2.99 Safe Zone: Considered financially healthy
1.81 < Z < 2.99 Grey Zone: Could go either way
Z < 1.81 Distress Zone: Risk that company will go bankrupt within two years
Source: (Altman, 1968, p.594)
13 | P a g e
A resulting low score suggests the firm is in financial distress. Companies with Z scores
below 1.81 would be classified as potential failures; Z scores between 1.81 and 2.99 are said
to be in the zone of ignorance or grey area and above 2.99 indicates the company is not in any
financial distress. The Z-Score is calculated by multiplying each of the financial ratios by an
appropriate coefficient and then adding the results together. The coefficients describe the
importance of each ratio, as larger coefficients affect the Z-score more. Using the above
model, Altman’s Z Score provided evidence to predict bankruptcy of 94% of the failed
companies in his sample (Altman, 1968 p.609). However, in a study carried out by Moyer
(1977), he tested the effectiveness of Altman’s (1968) model on 27 failed and 27 non-failed
firms between 1965-1975. The firms paired according to industry and assets ranging from
$15million to $1billion. The result of the investigation indicated that the forecasting accuracy
on a post-dated sample of firm failure was 75% a year before failure. This is in contrast to a
94% accuracy rate proposed by Altman (1968).
Then in 1977, Altman, Haldeman and Narayanan (1977) used US data to investigate
the period between 1969-1975 with a sample of fifty-three failed and fifty-eight non-failed
companies. They derived a Zeta value based on seven financial ratios, return on assets,
stability of earnings, debt service, cumulative profitability, liquidity, capitalization, and
finally size. Like Altman (1968), to test the models rigorously for both failed and non-failed
companies, a holdout sample was introduced. The study achieved an overall miss-
classification of 7% for type I error and 3% higher (i.e., 10%) type II error a year prior to
failure. The predictive power of the model reduced significantly five years prior to failure to
70% and 82% for failed and non-failed companies respectively. This surveillance highlights
that the variables are irregular across various studies. Furthermore, these two studies were
exceedingly precise in the short-run, but the precision shrinks vividly when the facts were for
time periods of more than two years prior to ruin. Overall, the Zeta model did produce

14 | P a g e
significantly improved accuracy compared to the original Z Score model with ‘bankruptcy
classification accuracy ranges from over 96% one period prior to bankruptcy’ (Altman et al,
1977, p.49).
Another opponent of Altman’s Z score is Hillegeist as he indicated in a (2004) study
that the model is ‘deficient’ and failed to include a measure of asset volatility as “tracking a
company’s asset volatility is important because it measures the probabilities that the value of
a firms assets decline to the extent that it is unable to pay its debts” (Li & Rahgozar, 2012,
p.13).
The ‘Z score’ is a highly accurate corporate failure predictor however it does have its
limitations. The model is industry specific, as it was formulated for operating manufacturing
companies. This means it cannot make accurate predictions for non-industrial companies
such as firms in the financial sector. Another drawback was “regarding the assumptions of
similar variance covariance matrices and linear distributions of independent variables that
might lead to invalid results.”(Abdullah, Halim, Ahmad & Rus, 2008, p.202). Researchers
have also criticized Altman’s work on the basis of lack of evidence of ex-ante predictive
ability of ratios (Appiah, 2011) .
The Z Score performs better with manufacturing companies than with any other
industries (Grice and Ingram, 2011). Li and Rahgozar (2012) also found that both “In almost
all cases, the average 5-year Z Score is superior in predicting financial distress over one, two,
and average of 3-year Z-scores”. This being said the Z score is still a very relevant statistical
model developed over 40 years ago which has retained its high accuracy for predicting
corporate failures.
Ohlson (1980) wanted to offset the limitations of the discriminant analysis model and
he employed logit analysis or a logistic regression model into corporate failure prediction
studies. Eisenbeis (1977), Ohlson (1980), and Jones (1987) found that there were some

15 | P a g e
inadequacies in MDA with respect to the assumptions of normality and group dispersion. The
assumptions were often violated in MDA. This may bias the test of significance and
estimated error rates (Abdullah et al. 2008). Logit uses data averages where a healthy
company is given a value of 0 and a distressed company is given a value of 1 (Abdullah et al,
2008). Hence, the logit model treats bankrupt companies as if they were bankrupt ever since
their inception. Ohlson analysed 105 bankrupt companies and 2058 non-bankrupt companies
from 1970 to 1976 (Ohlson, 1980). The results showed that size, financial structure (total
liabilities to total assets), performance and current liquidity were important determinants of
bankruptcy (Abdullah et al, 2008). Zmijewski (1984) followed up on Ohlson’s study, who
first applied the probit function. Research carried out by Collins and Green (1982), Ingram
and Frazier (1982), Harrell and Lee (1985) and Gessner, Kamakura, Malhortra, and
Zmijewski (1988) all have similar results, showing that the logit model is superior to the
discriminant one. The studies by (Chen, Huang & Lin, 2009) stated that: "Logit Regression
would have a better theoretical jurisdiction and more diversity and breadth for the
independent variables selected." These variables included; Retained Earnings/Total Asset,
Net Income/Net Sale, OPBAT/ Shareholder's Fund and Quick ratio (Siew Bee et al. 2011).
Ohlson’s (1980) model was further advanced: using the effect of industry-related
ratios on the likelihood of corporate failure (Platt and Platt, 1990); discrimination between
financially distressed firms and failed firms (Gilbert, Menon and Schwartz, 1990);
development of industry-specific model (Platt and Platt, 1994); and the introduction of
multinomial logit approach to reduce misclassification error (Johnsen and Melicher, 1994).
Just like Beavers (1966) and Altman’s (1968; 1977) model, Ohlson’s model
also has its fair share of limitations. Hillegeist (2004) points out there are “two econometric
problems with the single period logit model”. The first is the sample selection bias that arises
from using only one, non-randomly selected observation for each bankrupt company, and

16 | P a g e
second, the model fails to include time varying changes to reflect the underlying risk of
bankruptcy. These problems demonstrated that the results would be biased, inefficient and
inconsistent coefficient estimates. Shumway (2001) “predicted bankruptcy using the hazard
model and found that it was superior to the logit and the MDA models” (Abdullah et al.,
2008, p.203).
In a (2008) report ‘Predicting Corporate Failure of Malaysia’s Listed Companies:
Comparing Multiple Discriminant Analysis, Logistic Regression and the Hazard Model’
written by Abdullah et al., they analysed three corporate failure predictors comparing
Altman’s MDA, Ohlson’s logistic regression and Shumway’s hazard model. In this study
they examined 26 bankrupt and 26 non-bankrupt companies listed in Bursa Malaysia. Of the
52 companies, twenty companies were the holdout sample. Ten of them were distressed with
a matching ten companies in distress of similar size and industry. The hazard model was seen
to predict 94.9% and 63.9% of the estimation and holdout sample respectively. The MDA
model provided an overall accuracy rate of 80.8 % and 85 % for the estimation and the
holdout sample respectively and for the logit model, it could correctly predict 82.7 % and
80% of the respective estimation and holdout sample. In conclusion it was seen the hazard
model “provides a higher overall accuracy rate in the estimation model, but when the
estimated equation is applied in the holdout sample, MDA gives a higher accuracy
rate”(Abdullah et al., 2008, p.215).
The aforementioned corporate failure prediction models are both beneficial and
limited, however, “no technique is consistently superior to other techniques” (Collins &
Green, 1982; Tam, 1991; Taffler, 1995). A major limitation to research made in relation to
predicting corporate failures is the focus exclusive to statistical models (Appiah, 2011).
The fragility of the banking system to economic downturns significantly paves the
way for future failures of highly leveraged firms. The tightening of credit conditions, in

17 | P a g e
particular for small and medium firms, can have immense negative effects on corporate
survival rates. With the uncertainty surrounding financial markets, particularly for the
Eurozone, implicating early warning systems to determine possible failures is advantageous
to all stakeholders involved be it an institution or a company. Not only this but auditors also
face the threat of a potential lawsuit if they fail to provide early warning signals about failing
firms through the issuance of qualified audit opinions (Zavgren, 1983; Jones, 1987; Boritz,
1991; Laitinen and Kankaanpaa, 1999). Majority of the failed banks were caught in the real
estate market collapse and because they did not have sufficient capital to ride out the cycle,
were forced by the FDIC to merge with or be sold to other institutions (Jordan, Rice,
Sanchez, Walker & Wort, 2010).
The focus of this study is to analyse the predictive capability of using the Z” Score
applicable to banking institutions and to apply this to failed/nationalised banks and to
benchmark these to current banks that may be in financial distress. The traditional and early
corporate failure prediction models have been addressed in this study, however, they all lack
the industry specific characteristic that makes them ineffective in predicting the failure of
non-manufacturing firms.
In (1975) Joseph F. Sinkey carried out a multi statistical analysis of the balance sheet
and income statement to identify characteristics of problem banks. MDA was used to test for
group mean differences to classify banks as either problematic banks or non-problematic. The
newly identified banks were matched with non-problem or control banks.
The empirical findings indicate that measures of banking factors such as asset
composition, loan characteristics, capital adequacy, sources and uses of revenue, efficiency,
and profitability are good discriminators between the groups (i.e., group mean differences
exist). Then in 1977, Sinkey identified large problem/failed banks: in the case of Franklin
National Bank. Sinkey utilized univariate, bivariate, and multivariate outlier tests. The results

18 | P a g e
indicated that by year-end 1972 it was time to have been very ‘suspicious’ about Franklin
National Bank. Even as early as year-end 1971, univariate income measures and risk-return
analysis indicated that Franklin was a significant outlier (Sinkey, 1977, p.795). Sinkey’s
(1977) study had demonstrated that “existing, routinely collected banking data, if properly
analyzed, should be useful in identifying potential problem banks” (Sinkey, 1977, p.795)
The mainstream definition used to define bankruptcy is “a law for the benefit and the
relief of creditors and their debtors, in cases in which the latter are unable and unwilling to
pay their debts.” Furthermore, Ross, Westerfield, Jaffe, and Jordan (2008, p.853) define
“financial distress as a situation where a firm's operating cash flows are not sufficient to
satisfy current obligations and the firm is forced to take corrective actions.” To avoid
bankruptcy, the first step is to identify a ‘problem bank’.
Banking authorities characterised a ‘problem’ bank “to be one with a large volume of
adversely-classified (i.e., highest-risk) assets relative to its capital and reserves.”(Sinkey,
1977, p.780). Sinkey (1978) advanced this definition further by identifying ‘problem’ banks
as those with “low net capital ratios (NCR); (2) the most important component of the NCR is
the volume of "substandard" loans; and (3) banks that failed in recent years almost invariably
had low NCRs months before failure, although most banks with low NCRs do not
fail.”(Sinkey, 1978, p.184). Bank capital and substandard loan classification are important
variables as substandard loans conveyed in a low NCR account for approximately 80 percent
of a problem banks classified loans. It has been observed that the NCR has been a favoured
predictor of most bank failures.
As previously mentioned using Altman’s Z score model it is accompanied by Type-I
and Type-II failure errors. Sinkey was also concerned with identifying Type-I failure errors
(classifying a bank as failing or as non failing) and Type-II errors (problem banks that do not
fail or require financial assistance). Regarding the financial difficulties of billion-dollar

19 | P a g e
banks, the FDIC has had a zero Type-I error (Sinkey, 1978). These banks had low net capital
ratios (i.e., 0.0 and -1.0) and large volumes of "substandard" loans. Of course, given their
goal of failure prevention, the banking authorities try to correct a bank's financial difficulties
and thus NCR predictions will be biased towards becoming Type-II errors (Sinkey, 1978).
Prior to Sinkey’s (1975;1977) study regarding identifying problem banks, Meyer and
Pifer (1970) took a different perception of predicting Bank Failures. They listed four factors
that explain bank failures (1) local economic conditions, (2) general economic conditions, (3)
quality of management, and (4) integrity of employees. They positioned each failed bank as
"matched" with a comparable solvent bank. The banks comparability requirements, in order
of importance were that the banks (a) were in the same city, or in the case of a one-bank
town, in the same economic area, (b) were approximately the same size and age, and (c) had
the same regulatory requirements. Data for a solvent bank covered the same period as its
matched closed bank.
Apart from Sinkey’s, Meyer’s and Pifer’s studies, there was limited early literature
regarding the corporate failure of banks until the emergence of the recession in the mid-
twenty first century. Ozkan-Gunay and Ozkan (2007) analyzed 59 Turkish banks, 23 of
which were failed banks and 36 were non-failed using a non-linear artificial network
approach. They found that 66% of the failed banks were correctly indicated and 90% of the
non-failed banks were correctly indicated. Using a hybrid artificial neural network Yim
(2007) predicted firm failure of Australia’s financial services sector. Yim (2007) successfully
predicted 100% of failed firms a year before failing but only predicted 33.3% of failed firms
two years before failure. Schaek (2008) used a quantile regression approach to compare high-
cost to low-cost bank failures. (Jordan et al, 2010, p.6). Then in 2009 Ercan and Evirgen
investigated the factors that are of imperative to the failure of Turkish banks using a principal
component analysis methodology. Furthermore to studies in 2009, Jesswein compared a

20 | P a g e
sample of 37 failed banks from 2008 and 2009 compared to 7, 075 non-failed banks using the
“Texas Ratio”. The Texas Ratio is calculated “by dividing the bank's non-performing assets
(non-performing loans plus other real estate owned) by the sum of its tangible equity capital
and loan loss reserves” (Jesswein, 2007). Moreover, it was noted that “such a measure offers
important insights but may not be sufficient as a general, all-purpose tool.” (Jesswein, 2007).
The first statistical discriminant model used to predict company failure by Beaver
(1966) using a univaritate approach has certainly been adapted to the contemporary business
environment; however, the basic linear model has remained fairly constant in the form of:
Z=A1X1+A2X2...ANXN,
Where Z = Overall Score
A1... AN = Discriminant Coefficients
X1...XN = Discriminant Variables
Since then, the univariate model has evolved into a multi discriminant model which utilizes
many financial ratios at the same time (Altman, 1968). The primary purpose of this was to
discriminate between a sample of bankrupt firms with a matched control sample (healthy
firms).
The first MDA devised by Altman (1968) took the following form:
Z = .012X1 + .014X2 + .033X3 + .OO6X4 + .999X5
Where,
X1 = Working capital/Total assets
X2 = Retained Earnings/Total assets
X3 = Earnings before interest and taxes/Total assets
X4 = Book Value of Equity/Total Liabilities
X5 = Sales/Total assets
Z = Overall Index
(Source: Altman, 1968, p.594)

21 | P a g e
This model was then revolutionised by Altman, Haldeman and Narayanan creating the Zeta®
Credit Risk Model (1977) as a second generation discriminant model which “appeared to be
quite accurate for up to five years prior to failure” (Altman, 2000). The Zeta® model consists
of seven variables: (1) return on assets, (2) stability of earnings, (3) debt service, (4)
cumulative profitability, (5) liquidity, (6) capitalization, and (7) asset size. The major
limitation to Altman’s first two models was the fact they were only useful for manufacturing
firms and they did not work well for financial corporations or institutions such as banks.
This limitation was then progressed into a new model created by Richard J. Taffler (1983)
which used a UK-based Z score model and has shown the ability to predict failure (Agarwal
& Taffler, 2007)
The Z score model is being constantly updated by (Altman, 1983; 2002; Altman,
Hartzell, and Peck, 1995) to adapt to different parameters and the changing corporate
landscape. This is key considering the service industry is now larger than the manufacturing
sector. In 1983, Altman devised the Z score to be adapted for private companies ‘The Z’
Score’. This model took the following form:
Z’= 0.717X1+0.847X2+3.107X3 + 0.420X4+ 0.998X5
Where:
X1: Working Capital/Total Assets
X2: Retained Earnings/Total Assets
X3: EBIT/Total Assets
X4: Book Value Equity/Total liabilities
X5: Sales/Total Assets
Source: Altman (1983:122)
22 | P a g e
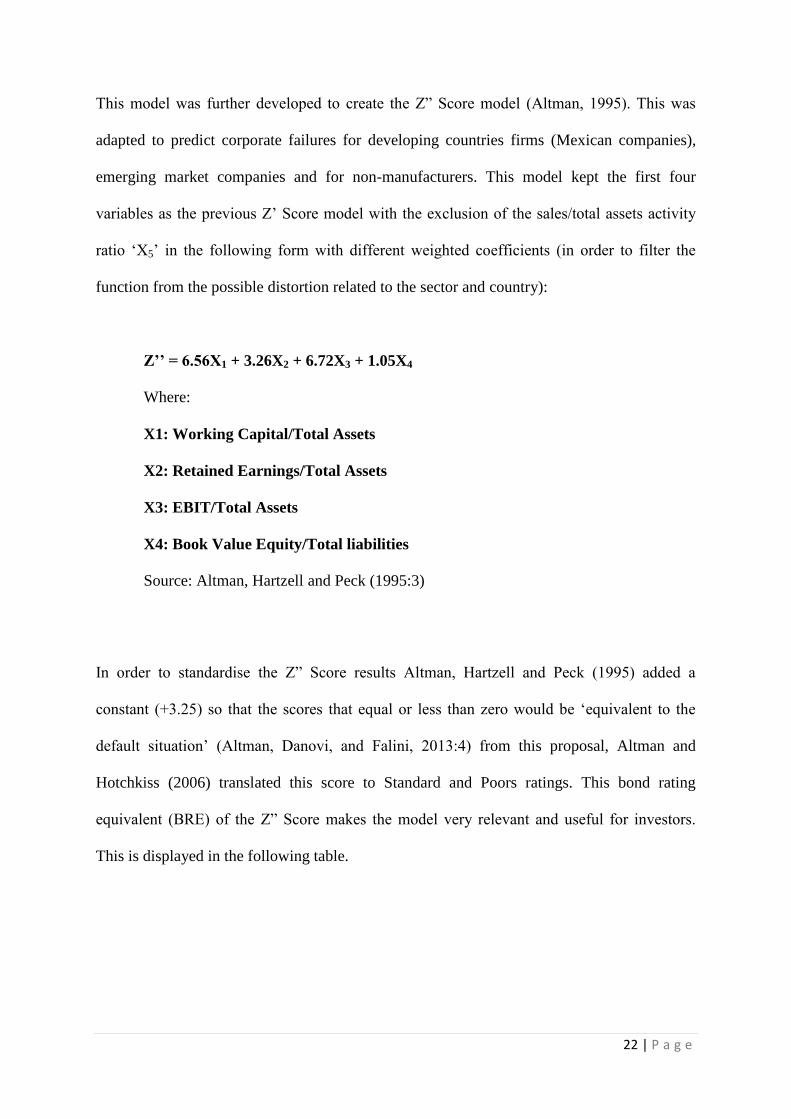
This model was further developed to create the Z” Score model (Altman, 1995). This was
adapted to predict corporate failures for developing countries firms (Mexican companies),
emerging market companies and for non-manufacturers. This model kept the first four
variables as the previous Z’ Score model with the exclusion of the sales/total assets activity
ratio ‘X5’ in the following form with different weighted coefficients (in order to filter the
function from the possible distortion related to the sector and country):
Z’’ = 6.56X1 + 3.26X2 + 6.72X3 + 1.05X4
Where:
X1: Working Capital/Total Assets
X2: Retained Earnings/Total Assets
X3: EBIT/Total Assets
X4: Book Value Equity/Total liabilities
Source: Altman, Hartzell and Peck (1995:3)
In order to standardise the Z” Score results Altman, Hartzell and Peck (1995) added a
constant (+3.25) so that the scores that equal or less than zero would be ‘equivalent to the
default situation’ (Altman, Danovi, and Falini, 2013:4) from this proposal, Altman and
Hotchkiss (2006) translated this score to Standard and Poors ratings. This bond rating
equivalent (BRE) of the Z” Score makes the model very relevant and useful for investors.
This is displayed in the following table.

23 | P a g e
Correspondence between Z” Score and Standard and Poor Rating
(Source: Altman and Hotchkiss, 2006:314)
Another adaptation was the introduction of the Z-Metrics System (Altman and Rijken
et. al., 2010). It refines the original model, includes both market equity levels and volatility,
as well as macro-economic variables. The parameters are not made explicit, considering the
proprietary nature of this technique. The Z-Metrics approach was used by the authors to
assess the sovereign risk, particularly in Europe today, with encouraging results (Altman and
Rijken, 2010).
Safe
Zone
Rating Z” Score
Threshold
Rating Z” Score
Threshold Grey
Area AAA >8.15 BB+ 5.65
AA+ 8.15 BB 5.25
AA 7.60 BB- 4.95
AA- 7.30 B+ 4.75
A+ 7.00 B 4.50
A 6.85 B- 4.15 Distress
A- 6.65 CCC+ 3.75
BBB+ 6.40 CCC 3.20
BBB 6.25 CCC- 2.50
BBB- 5.83 D <1.75

24 | P a g e
III. Methodology
The focus of my study is to apply the most suitable Z score model to 4 distressed and
non-distressed Eurozone banks between 2005 and 2012. From the outset of the financial
trouble, the banks have been at the centre of the financial crisis due to the frail capital
structure of banks to provide liquidity to both borrowers and lenders (Diamond and Rajan,
2001, p.289). Failed Eurozone banks were forced to merge with other banks or became
nationalised. In particular, the Eurozone has been awash with (negative) mainstream media.
The onset of the uncertainty surrounding the euro has made the financial market trading
conditions difficult to attract investors. The primary reason for this investigation is not just
verify the validity of the Z” Score model but to predict possible ‘future’ failures. To identify
a trend in the Z” Score of the failed banks and to see if this is parallel to a current bank. The
development of an early warning system is imperative to Eurozone traders in such financial
circumstances.
The Z score model is a form of discriminant analysis. This is a multivariate technique
utilized in the social and physical sciences for many decades. The first application of
discriminant analysis to the problem of failure prediction in business was performed in 1966
(Beaver, 1966) and concentrated on the manufacturing sector of the economy (Altman &
Loris, 1976). Since then, the model has evolved to pertain to the contemporary business
environment. In the Euro-area the services industry has the largest share of total output
’73.1% GDP’ (ECB Report, 2012). Along with the model being a valid indicator of corporate
failure, it is imperative that it has adapted to suit a wider range of firms. This flexibility to
modification is the main reason it is one of the most widely used corporate predictors today
and is as relevant today as it was in the late sixties. In this case the evolution of the Z Score
that will be used in this study is Altman’s Z” Score.

25 | P a g e
The analysis undertaken in this study requires a comparison be made between ‘failed’
and ‘non-failed’ Eurozone banks. The best suited analysis is discriminant analysis as it ‘seeks
to combine and weight several independent variables in such a way as to maximize the
discrimination between two or more clearly identifiable groups.’ (Altman and Lorris, 1976,
p.1203)
The importance of the going-concern concept was emphasized by William J. Casey,
then Chairman of the Securities and Exchange Commission, in a speech' to the National
Investor Relations Institute on October 3, (1972):
"Auditors sometimes find themselves so dubious about a company's viability as a
going concern that they find themselves unable to give an opinion as to the overall
fairness of the financial statements, which rest after all on the implicit assumption
that there is a going business here which can reasonably be expected to continue
operating for an indefinite period in the future."
We think it imperative that such prime candidates for bankruptcy or reorganization
proceedings be spotted at the earliest possible moment so that investors may guide
themselves accordingly. The most fundamental judgment by an auditor concerning the future
in relation to an enterprise is its ability to continue to operate as a going concern.
Dataset
In the United States, the Federal Deposit Insurance Corporation (FDIC) keeps a public log of
all the failed/nationalised banks which can be accessed from:
http://www.fdic.gov/bank/individual/failed/banklist.html. However, information regarding
the actual number of failed Eurozone banks since the crisis has not been collected or
disclosed in any type of log. The only source found was an independently created blog which
featured known Eurozone bank failures. This can be accessed from:

26 | P a g e
https://docs.google.com/spreadsheet/pub?key=0AkitojFFyvjCdC1lcmRhRU9WWExSdmJ6O
FpySExzb3c&single=true&gid=0&output=html.
The banks required for this research had to meet the following characteristics:
1) Euro area bank
2) Failed or nationalised between 2007 to 2012
3) Banks had to be in operation for at least five years before the collapse
4) For each closed bank, there is a comparable(control) bank
5) Financial statements for five years prior to the failed banks collapse had to be
publically available
It was imperative that the bank be of Eurozone origin as this analysis is to validate the Z”
Score as a predictor of bank failure even in financially turbulent markets. The banks analysed
had to have failed during the 2007-2012 period as this model needed to forecast failure
withstanding recession induced stress. In order to confirm the Z” Score can predict failure
five years prior to failure, it was paramount that the banks examined had to be of going
concern at least five years prior to failure. To discriminate between the two data sets,
comparable banks were required to identify any similar or dissimilar trends. Entirely public
data was required as this Z” Score model is to prove it can be used by any stakeholders that
can utilize ratio analysis. Data required to carry out ratio analysis was extracted from the
statement of comprehensive income and statement of financial position of the banks
analysed. "The basic objective of financial statements is to provide information useful for
making economic decisions"' (AICPA,1973, p.13). This is why it was important that financial
statements were accessible.

27 | P a g e
The Statistical Model
The statistical model used in this analysis is the Z” Score model is outlined below.
Z’’ = 6.56X1 + 3.26X2 + 6.72X3 + 1.05X4
Where:
X1: Working Capital/Total Assets
X2: Retained Earnings/Total Assets
X3: EBIT/Total Assets
X4: Book Value Equity/Total liabilities
Source: Altman, Hartzell and Peck (1995:3)
It was first used in 1995 to predict the corporate failures of non-manufacturing and
developing countries firms (Altman, Hartzell and Peck, 1995). Then recently in 2013,
(Altman, Danovi & Falini, 2013) applied this model to predict the corporate failure of Italian
banks subject to extraordinary administration. The results of the Z” Score predicted 95.5% of
failure a year before declaring bankruptcies. The main reason for choosing the Z” Score as a
statistical model was due to it’s the high predictive ability that it produced for Italian banks.
This made the model very relevant for my analysis considering it had worked correctly on a
Eurozone bank. The weightings of the variables did not change for my study as the objective
was to use the original existing model to verify its validity as a corporate predictor for other
Eurozone banks.

28 | P a g e
Variables Explained
X1: Working Capital/Total Assets
The first variable in Altman’s Z” Score model is the working capital to total assets
ratio. This liquidity ratio calculates the ability of the bank to finance its short term
obligations. It is the measure of the net liquid assets of the firm relative to capitalisation. An
increasing liquidity figure shows a positive sign. A decreasing figure will suggest and
increase in liabilities and thus distress caused to a bank. If a bank is experiencing operating
losses its current assets will be shrinking in relation to total assets. It has proven to be the
most valuable of the liquidity ratios in a Merwin study “which rated the net net working
capital to total asset ratio as the best indicator of ultimate discontinuance” (Altman, 1968,
p.595).
X2: Retained Earnings/Total Assets
The second variable indicates the ability of a bank to accumulate earnings using its
assets. The higher the ratio the better as it suggests the bank can accumulate earnings. A
young firm will usually display a very low RE/TA as it has not had the time to build up
cumulative profits hence “the incidence of failure is much higher in a firm's earlier years”
(Altman, 1968, p.595).
X3: Earnings before Interest and Taxes/Total Assets
Earnings before interest and tax (EBIT) to total assets ratio indicates a proportion between
the measure that shows company’s profitability and company’s assets. It measures the productivity
of the firm’s assets notwithstanding any tax or leverage factors. “Since a firm's ultimate existence is
based on the earning power of its assets, this ratio appears to be particularly appropriate for studies
dealing with corporate failure” (Altman, 1968, p.595). In short, it represents general profitability of
the company’s assets. EBITDA would not be a very accurate measure of a bank’s financial position as

29 | P a g e
it takes into account depreciation and amortization which would not be applicable to the nature of a
bank’s operations.
X4: Book Value Equity/ Total Liabilities
The final variable expresses the financial leverage i.e. the proportion of equity. “The
measure shows how much the firm's assets can decline in value (measured by market value of
equity plus debt) before the liabilities exceed the assets and the firm becomes insolvent”
(Altman, 1968, p.595). A high value depicts firm’s aggressiveness in financing its growth
with debt. If the cost of the debt financing outweighs the return that the company generates
on the debt, it could even lead to the possible bankruptcy. This ratio adds a market value
dimension which other failure studies did not consider. It also appears to be a more effective
predictor of bankruptcy than a similar, more commonly used ratio: Net worth/Total debt
(Altman, 1968).
IV. Empirical Results
Z” Score Results
Anglo Irish
Bank
BRE Banca
D’Italia
BRE Dexia BRE Proton BRE
YE 1 -1.67791813 D 0.520948689 B- -0.2913136 CCC- 0.266671417 CCC
YE 2 0.596302337 CCC+ 0.820345294 CCC+ -0.4340555 CCC- 0.197624157 CCC
YE 3 0.642211501 CCC+ 0.39423437 CCC -0.5279191 CCC- 0.340833957 CCC
YE 4 0.612608571 CCC+ 0.280897174 CCC -0.5353641 CCC- 0.551694481 CCC+
YE 5 1.133891456 B- 1.178578682 B- -0.0545136 CCC+ 4.806 AA
The above table are the Z” score results and bond related equivalents (BRE) of the
failed/nationalised banks analysed in this study. Year end 1 ‘YE 1’ is the year prior to
bankruptcy onwards to year end 5 ‘YE 5’ which is five years ex ante failure. Anglo Irish
Bank is seen to have a decreasing Z” Score from ‘YE 5’ through to the penultimate year in

30 | P a g e
‘YE 1’. With this the BRE has also decreased from B- in ‘YE 5’ to D in the year of its
collapse. However, it is seen that it had a constant BRE of CCC+ for three years prior to its
D- rating.
Banca D’Italia had a dissimilar trend as it’s Z” Score took upswings and downswings
throughout the five years, varying from a Z” Score of 1.179 to 0.28. The BRE also varied and
even showed a positive increase in its BRE a year prior to its bankruptcy. Even so, the Z”
Score has kept Banca D’Italia in the distress zone.
Belgian bank Dexia had a very steadily decreasing Z” Score from 2007 through to
2011. The BRE did not converge from the CCC- rating in the four years prior to Dexia’s
bankruptcy.
Similar to the Irish and Belgian bank, Greek bank Proton was noted to have a
degrading Z” score from YE 5 to the year of its demise. Nevertheless, in YE 5 it made a large
decrease in Z” Score from 4.806 to 0.266. There was also very little divergence in its BRE
from YE 4-YE1 as it degraded from CCC+ to CCC and had this grade till the year of its
collapse.
AIB BRE Danske
Bank
BRE
Santander BRE Deutsche
Bank
BRE
YE 1 0.581541138
CCC+ 3.494825565
A- 0.534706394
CCC+ 0.156084062
CCC YE 2 1.055304576
B- 3.605562769
A 0.402582189
CCC 0.286575594
CCC YE 3 -0.21490060
CCC- 3.592252973
A- 0.270528183
CCC 0.10477709
CCC YE 4 0.670081938
CCC+ 3.770023354
A+ 0.357228169
CCC -2.67224596
D YE 5 0.537263374
CCC+ 3.445638896
A 0.519940526
CCC+ 3.863090325
A+
The second table consists of the Z” Score results for non-failed banks with the accompanying
BRE’s. And as these banks have not failed ‘YE 1’ represents the current year and ‘YE 5’ is
the banks Z” Score and BRE five years ago.

31 | P a g e
In the first column, the Z” Score shows AIB is in a distressed position and continues
to be with a slight improvement in YE 2 with an increase in grade to B-. However, this is
then offset in ‘YE 1’ with a large decrease in Z” Score and a degradation to CCC+.
Danish Danske Bank has shown the highest current Z” Score for ‘YE 1’ compared to
the other three peer control banks with a Z” Score of 3.494. It is a consistently stable bank
with the BRE ranging from A- to A+ for the five years.
The third control bank analysed is Spanish bank Santander. The Z” Scores show the
bank to be in a distressed position with low Z” Scores and low BRE’s of CCC and CCC+. It
is in quite a similar position to AIB with the same BRE.
The final control bank analysed is German Deutsche Bank. This has had the most
variance in relation to Z” Score and BRE. The Z” Score in 2008 was positively high at 3.863
giving Deutsche bank a credit rating of A+, however, the following year left Deutsche bank
with a dramatic downgrade to the lowest grade of D. The reason for this was due to Deutsche
bank putting risky assets into the CDO. And also put mortgage bonds that its own mortgage
department had but couldn’t sell. The CDO was marketed as a good product, described as
having A level ratings. By 2009, the entire CDO was worthless and all the investors had lost
all of their funds. This is reminiscent of the credit rating given to Anglo Irish Bank in its
penultimate year before bankruptcy. The following year it quickly regained CCC status and
has remained so for the past three years.

32 | P a g e
Book Value of Equity to Total Liabilities
Anglo Irish Bank Banca D’Italia Dexia Proton
YE 1 0.042250833 0.044320018 -0.00077467 0.122289865
YE 2 0.018321976 0.070754345 0.019294721 0.156767839
YE 3 0.043904652 0.077805796 0.021193617 0.183978805
YE 4 0.038131392 0.079947271 0.008704841 0.320150712
YE 5
0.131031444 0.428312859 0.027872894
4.244845221
The resulting values for the book value of equity to total liabilities ratio appeared to
show a decrease from ‘YE 1’ to ‘YE 5’. This showed true for Banca D’Italia, Dexia and
Proton but with some variance for Anglo Irish Bank.
Looking at the table below showing the book value of equity to total liabilities values,
there is a slight improvement for Danske, Santander and Deutsche Bank, with a minor
deviation for AIB which slightly decreased for ‘YE 1’.
Perhaps even more significant, the book value of equity to total liabilities ratio is
showing a negatively correlated trend between these two data sets as the BVE/Tl ratio is
shown to decrease for the failed banks and the BVE/TL is shown to increase for the control
banks.
AIB Danske Bank Santander Deutsche Bank
YE 1 0.101019996 0.04130152 0.071143 0.0205791
YE 2 0.118366779 0.038154667 0.0709 0.0185223
YE 3 0.030871778 0.033688372 0.071191 0.0212326
YE 4 0.069548838 0.033577422 0.071258 0.0150172
YE 5 0.059827419 0.028512706 0.060631 0.0093922

33 | P a g e
V. Discussion
From the above graph you can see Anglo Irish Bank was already showing distress signals
between ‘YE 5’ and ‘YE 4’. It had taken a deep plunge from a Z” Score of 1.13 to .612. This
trend is very similar to Dexia in the same ‘YE 5’ to ‘YE 4’ in the lead up to their collapse.
Considering a Z” Score of less than 1.81 signals insolvency, Anglo Irish Bank and Dexia
were already very much on the road to bankruptcy. This shows the Z” Score could predict a
high risk of bankruptcy five years prior to collapse. The trend between ‘YE 4’ and ‘YE 3’ are
again quite similar between Dexia and Anglo Irish bank as their Z” Score remains quite
constant. However, in ‘YE 2’ to ‘YE 1’ Anglo Irish Bank makes a very steep fall with a Z”
Score of -1.667. From this data you can see the Z” Score made an accurate prediction in the
five year lead to the demise of Anglo Irish Bank. On the other hand, Dexia was already
deemed with a high level risk of bankruptcy from ‘YE 5’. Dexia’s Z” Score improved slightly
from -.434 to -.291 in the penultimate year of its bankruptcy.
YE 5 YE 4 YE 3 YE 2 YE 1
Anglo Irish Bank 1.13 0.612 0.642 0.596 -1.677
Banca Di Italia 1.179 0.281 0.394 0.820 0.521
Dexia -0.055 -0.535 -0.527 -0.434 -0.291
Proton 4.806 0.552 0.34 0.197 0.266
-3
-2
-1
0
1
2
3
4
5
6
Z" S
core
Failed Banks

34 | P a g e
The three banks Banca D’Italia, Proton and Dexia converged very closely in ‘YE 1’.
Which can be seen later on in relation the their Book value of equity to total liabilities ratio
results.
From ‘YE 5’, or five years before the collapse of the failed banks, the Z” Scores
already depicted these banks in the distress zone. This is a 100% bankruptcy prediction value
from ‘YE 5’, which even over predicts Altman’s Italian bank study in which ‘72.3% were
classified in the distress zone’ five years before bankruptcy (Altman et al, 2013:132).
Altman’s results suggests that the Z-Score is an accurate forecaster of bankruptcy up to two
years prior to distress and that accuracy diminishes substantially as the lead time increases.
Nevertheless, the trend towards bankruptcy can be seen straight away from ‘YE 5’ on the
graph using the Z” Score results of the failed banks.
The Z” Score encompasses four ratios to give the best prediction of corporate failure.
However, the ratio ‘book value of Equity to total liabilities’(BVE/TL) also appears to give
quite accurate prediction capabilities in terms of banking failures. As you can see from the
graph above there is a declining trend from ‘YE 5’ to ‘YE 1’ apart from a slight upturn for
Year 5 Year 4 Year 3 Year 2 Year 1
Anglo Irish Bank 0.131 0.038 0.044 0.018 0.042
Banca Di Italia 0.428 0.080 0.078 0.071 0.044
Dexia 0.027 0.008 0.021 0.019 -0.001
Proton 4.244 0.32 0.183 0.156 0.122
-0.5
0
0.5
1
1.5
2
2.5
3
3.5
4
4.5
Bo
ok
Val
ue
of
Equ
ity/
to
tal L
iab
ilite
s Failed Banks

35 | P a g e
Anglo Irish Bank between ‘YE 2’ and ‘YE 1’. The BVE/TL ratio has displayed considerable
bank failure predictive abilities. Like the Z” Score graph, it is also showing very similar
trends towards the bank’s failure. All four banks converge between ‘YE 3’ and ‘YE 1’. This
movement could suggest the BVE/TL is a significant indicator. Altman (1968) also suggests
in his pioneering study that the book value of equity/total liabilities ‘appears to be a more
effective predictor of bankruptcy than a similar, more commonly used ratio: Net worth/Total
debt’ (Altman, 1968, p.595). It is widely known that a banks debt-to-equity structure affects
the probability of insolvency. The results of this ratio have proven it to be a considerable
indicator in this analysis.
Above is a graph depicting the Z” Score values of the non-failed banks data set for five years.
The trend is divergent compared to the failed-banks data set. There is considerably more
variance, with the control banks not converged as much as the trend to its failed counterparts.
Straight away, it can be seen Danske has the best Z” Score and has a constant flat progression
YE 5 YE 4 YE 3 YE 2 YE 1
AIB 0.537 0.670 -0.215 1.055 0.582
Danske 3.446 3.770 3.592 3.606 3.495
Santander 0.520 0.357 0.271 0.403 0.535
Deutsche Bank 3.863 -2.672 0.105 0.287 0.156
-3.000
-2.000
-1.000
0.000
1.000
2.000
3.000
4.000
5.000
Z" S
core
Non-Failed Banks

36 | P a g e
compared to Deutsche Bank which took a large downswing in ‘YE 4’. In ‘YE 3’, Santander,
AIB and Deutsche bank have become intersected, which could be due to sharing the same
financial environment. They remain close through to their current period ‘YE 1’.
Risk-averse investors utilising this information can evidently see from this graph that
perhaps the best bank to trade with would be Danske. Other stakeholders could also benefit
from this information as the Z” Score does place Santander, AIB and Deutsche bank in the
distress zone.
The graph above again highlights a major difference between the control banks and their
failed counterparts. The BVE/TL ratio has shown the control banks to vary from each other
and also to have a constant BVE/TL progression apart from a large plummet in ‘YE 3’ for
AIB. The trends are very promising as they convey the BVE/TL ratio to be a valid predictor
of corporate failure.
These graphs have emphasised the predictive power of Eurozone bank failures
utilizing the Z” Score and the BVE/TL.
YE 5 YE 4 YE 3 YE 2 YE 1
AIB 0.060 0.070 0.031 0.118 0.101
Danske 0.029 0.034 0.034 0.038 0.041
Santander 0.061 0.071 0.071 0.071 0.071
Deustche Bank 0.009 0.015 0.021 0.019 0.021
0.000
0.020
0.040
0.060
0.080
0.100
0.120
0.140
Bo
ok
Val
ue
of
Equ
ity
to T
ota
l Lia
bili
tes Non-Failed Banks

37 | P a g e
The mean, standard deviation and standard error were calculated for failed and non failed
banks. The results were only calculated on the year before bankruptcy ‘YE 1’ and the current
year for the control banks. The mean Z” Score for the failed banks was -.569 compared to a
mean value of 1.192 for the control banks. This shows a large discrimination between the two
data sets. Nevertheless, the control banks still have a mean Z” Score of less than 1.81 which
implies that they are also currently in the distress zone. The standard deviation for the failed
banks was also showed a lot less variation from the mean unlike the control banks. There is a
large dispersion within the control banks in relation to their mean. This can be seen straight
from the BRE’s as two of the banks are ‘A’ and ‘B-‘rate whereas the other two banks are
Bank
(Failed)
Z”Score (+3.25=BRE)
1 year prior to bankruptcy
Bond Rate Equivalent
(Standard & Poor
Rating)
Anglo Irish Bank -1.677(1.572) D
Banca Di Italia .521(3.77) B-
Dexia -0.291(2.958) CCC
Proton 0.266(3.516) CCC+
Mean -0.569(2.680) CCC
Standard Deviation .818
Standard Error .408
Banks(non-distressed) Present Z” Score
(+3.25, BRE)
Bond Rate Equivalent
(Standard & Poors
Rating)
AIB 0.581(3.832) CCC+
Dankse Bank 3.495(6.745) A
Santander 0.535(3.785) CCC+
Deutche Bank 0.156(3.406) CCC
Mean 1.192(4.442) B-
Standard Deviation 1.547
Standard Error 0.774

38 | P a g e
‘CCC’ and ‘CCC+’. The standard error for the failed banks resulted in a smaller error
compared to the control banks which suggests the sample of failed banks is more
representative of the overall population. This is mainly due to the fact that the control banks
are made up of ‘thriving’ and ‘surviving’ banks which causes a large gap in the data
collected.
In relation to the BRE’s, there was very little variance to what you might expect. Out
of the four failed banks, only Anglo Irish Bank had a BRE of “D” or default status in the
entity’s final year. This is 25% of the banks analysed compared to ‘65.9% of the companies’
with a “D” rating in Altman’s study in their final year before bankruptcy (Altman, 2013,
p.132).
Benchmarking the failed to the control banks, you can see there are similarities
regarding the Z” Scores and BRE’s. Taking Anglo Irish Bank and its most compatible control
bank AIB due to size and location, AIB’s present BRE is the same compared to Anglo Irish
Bank’s BRE YE 2, two years before its demise. This result is quite significant as it could
possibly predict perhaps AIB’s fate is on the path to bankruptcy also considering its
predecessor was declared bankrupt a year later. And given the accuracy of the Z” Score it
should probably be a one to watch for future problems.
Belgian and French bank Dexia collapsed the same weekend as Proton in November
2011. It is interesting to compare the two Z” Scores and BRE’s as the BRE for Dexia and
Proton was shown to be “CCC-“ unstable and “CCC” neutral respectively. This result
demonstrates that there is no real difference between an unstable or neutral rating as there is
still the possibility a neutral rated bank can also become bankrupt. Keeping this in mind this
could have also proven the two may have failed due to interbank contagion.
The failed bank with the highest BRE and Z” Score prior to the year of bankruptcy
was Banca D’Italia with grade B- and 0.521 respectively. This is quite a high BRE for the

39 | P a g e
year of collapse considering currently AIB, Santander and Deutsche bank have a lower BRE.
Perhaps, a singular BRE or Z” Score is not enough to determine a failure in the year prior, an
overall trend or progression needs to be analysed to determine if a bank has possibility of
failing.
Danske bank has the leading Z” Score and BRE, with a current grade of “A-” and is
currently the only bank analysed in the ‘safe zone’. It has had consistently high Z” scores
varying between ‘3.44’ and ‘3.77’ in the past five years. From an investor’s point of view, it
would be classed as a financially sound bank to invest in.
The results have predicted the bankruptcy of the failed banks as far back as ‘YE 5’,
but it also has classed 75% of the control banks in distress zone also. As indicated by the
author (Altman, 1970), the model is not probabilistic but descriptive-comparative. It should
be used as a warning device rather than as a definitive prediction tool since the score
indicates the proximity of a firm to one group or the other (Teodori, 1989, p.129)
VI. Limitations
No singular model can possibly explain every detail of a corporate failure phenomena.
There are many limitations associated with the Z” Score model used in this study. The public
information used in the ratio analysis extracted from these failed and ongoing banks financial
statements could have been possibly subject to creative accounting or manipulated in some
way. There is an inherent problem with accounting data being manipulated as companies’ are
motivated by the benefits of concealing failure signals to the public. It has been found in a
study that during recession’s companies tend to omit the bad and exaggerate the good.
(Tilden & Janes, 2012, p.5) (Altman et al., 2013, p.135). This would greatly affect the results
of the Z” Score model and ultimately create void results. As the ratio analysis depends on the
accuracy of the financial statements completely.

40 | P a g e
Another large limitation the Z” Score produces is the fact it is only a valid corporate
prediction model five years prior to a firm or banks collapse. This is unfortunate as analysing
a banks Z” Score without recession induced stress would have been beneficial. Considering
the predictive power is only viable five years prior to bankruptcy, even if the Z” Score
forecast the failure at YE 5. This may not give the company enough time to force an
organization to review its strategic processes and practices Shukla (1994).
A major limitation utilising the Z” Score and which accompanies most accounting
models is the fact is is largely based on historical information. The determination of future
results is based on analysing past trends. Moreover, aggregate factors (such as interest rates,
FX rates, inflation) in the macro economy can substantially affect the viability of a company.
Notwithstanding the use of accounting information as a primary predictor has a major fault
lying in its ability to account for uncontrollable macro elements. . The euro area has become
particularly prone to volatile stocks and with the ever-deteriorating investor confidence it is a
very unpredictable market. Heavily geared companies are non-resilient to the effects
emerging from the macroeconomy. Unstable macro variables in the global economy have
significant effects on the going concern of euro companies, in particular, SME’s. Harsh credit
conditions have distressed corporate performance, particularly in the case of financially
“distressed companies that are usually small and bank-dependent” (Platt and Platt, 1994).
Investor confidence in European markets has greatly eroded due to the uncertainty
surrounding the instability of European countries. There are a number of reasons to believe
that accounting data-based failure prediction models are sensitive to recession-induced
changes in the risk of default and firm failure. First, Rose, Andrews, and Giroux (1982)
studied the effect of economic developments on the probability of failure. From an initial
listing of 28 business cycle indicators, they applied correlation analysis, leadlag relationships,
and stepwise regression to arrive at a failure prediction model consisting of six

41 | P a g e
macroeconomic variables that had an R-squared of 0.912. They concluded that
macroeconomic conditions are significant factors in the process of business failure. Second,
Kane (1994) found that the associations of accounting data with subsequent abnormal returns
are acutely sensitive to the occurrence of recession-associated market valuation periods.
Similarly, Lev and Thiagarajan (1993) and Johnson (1993) report that the abnormal return
associations of "unexpected" information components of accounting data are sensitive to the
business cycle. These studies document that accounting data have information content about
stock returns that is conditional across varying stages of the business cycle.
Another limitation to this study was the actual access to information. not only was it
difficult to find a list of failed banks but public information required i.e. financial statements
in some cases did not exist. A larger sample size would have been more beneficial to the
results as it would have given a clearer and more defined picture to verify the validity of the
Z” Score as a predictor of bank failures. A larger sample size would have also decreased the
standard error.
A limit associated with this analysis is that the data set for failed banks are based on
ex post applications, on a sample of companies whose destiny was already known. (Altman et
al, 2013, p.132).
The Z” Score model has been proven to have a 100% predictive Eurozone bank
failure capability. However, this model may not be as accurate in another industry or non-
Euro area institution.

42 | P a g e
VII. Conclusion
In conclusion, empirical results suggest the Z” Score model is a reliable predictor of
Eurozone bank failure within five years prior to bankruptcy. In this study it has predicted
100% of banking failures from five years to the year of their demise. The Z” Scores of the
control banks (AIB, Deutsche Bank and Santander) are currently relatively low compared to
Danske Bank with a high Z” Score. These low Z” Scores could possibly mean future failures
as they are trending the same way as their failed counterparts. It also depicts that the current
Eurozone financial climate is harsh and banks are just about surviving.
The Z” Score has predicted the banking failures successfully but a number of factors
could suggest that the analysis was somewhat biased considering the fate of the failed banks
were already known. Nevertheless, this study was to verify the Z” Score as a valid predictor
and it required the data set consist of failed and non-failed banks. The Z” Score is only valid
five years prior to bankruptcy, perhaps a model with an increase in predictive capabilities of
up to ten years or more would be beneficial to stakeholders.
The Z” Score model used entirely historical results, going forward models should
encompass not only accounting but also macro determinants of corporate failure. There is a
major dearth of economic literature providing evidence to suggest macroeconomic variables
enormously affect a company’s going concern. It should be recognised that volatile shocks
created in the external environment such as the escalation in oil prices, high exchange rates,
tight credit, inflation and high interest rates can have devastating effects on the health of a
bank. And it is evident from the recessionary years that “low or negative economic growth
occurs during periods of economic stress, which is most devastating to vulnerable entities”
(Altman, 1983).
From this study it was perceived that the ratio ‘Book value of equity to total
liabilities’ had significant results to prove it possessed bank failure prediction capabilities .

43 | P a g e
Further analysis should be carried out on this ratio on a larger sample size to verify if it is
itself a valid bank failure predictor.
With the uncertainty surrounding the future of the Eurozone and the common
currency, it is an important time to be forward thinking to avoid making poor investment
decisions. A bank's deterioration to problem status (or failure) is not an overnight transition
but a gradual financial retrogression which can be predicted up to five years using Altman’s
Z” Score model. The Z” Score has revealed a great predictive power which can be beneficial
to many stakeholders.

44 | P a g e
Bibliography
Abdullah, N.A.H, Halim, A., Ahmad, H. and Rus, R.Md. (2008) ‘Predicting Corporate
Failure of Malaysia’s Listed Companies: Comparing Multiple Discriminant Analysis,
Logistic Regression and the Hazard Model’. International Research Journal of Finance
and Economics, 1(15): pp.201-217.
ACCA (2008) ‘Business failure prediction and prevention relevant to ACCA qualification P4
and P5’. [Online] Available from:
http://www.chinaacc.com/upload/html/2013/06/27/lixingcun8c846789889d4126a35b01d5
d3f922b7.pdf: [Accessed on 10th July 2013]
Agarwal, V. and Taffler , R.J. (2007) ‘Twenty-five years of the Taffler z-score model: does it
really have predictive ability?’. Accounting and Business Research, 37(4): pp. 285–300.
AICPA (1973) Objectives of Financial Statements. New York: American Institute of
Certified Public Accountants.
Altman, E. I. (1968) ‘Financial Ratios, Discriminant Analysis and the Prediction of Corporate
Bankruptcy’. The Journal of Finance, 23(4): pp. 589-609.
Altman, E. I. and Loris, B. (1976) ‘A Financial early warning system for over-the-counter
broker-dealers’ The Journal of Finance, 31(4): pp. 1201-1217.
Altman, E. I., Haldeman, R.G. and Narayanan, P. (1977) ‘ZETA Analysis: A New Model to
Identify Bankruptcy Risk of Corporations’. Journal of Banking and Finance, 1(1): pp.
29-54.
Altman, E.I. (1983) Corporate Financial Distress. New York: Wiley Interscience.
Altman E.I. and La Fleur J.K. (1985) ‘I Modelli di Previsione delle Insolvenze: Le Loro
Applicazioni alla Gestione d’Impresa’. Finanza, Marketing, Produzione, 4(1): pp. 77-93.
Altman, E., Hartzell, J. and Peck, M. (1995) Emerging Markets Corporate Bonds: A Scoring
System. New York: Wiley and Sons.
Altman E.I. (2002). ‘Revisiting Credit Scoring Models in a Basel 2 Environment’. Salomon
Center for the Study of Financial Institutions, 2(1): pp.2-37.
Altman, E.I. and Rijken, H. (2010a) ‘Assessing Sovereign Debt Default Risk: A Bottom-up
Approach’. The Journal of Applied Corporate Finance, 41(3): pp. 1-30.
Altman, E.I., Rijken, H., et. al. (2010b). “The Z-Metrics Approach to Assessing the
Probability of Default of Corporate Debt”. [Online] MSCI, Available from:
www.msci.com.[Accessed 5th August 2013]
Altman, E.I, Danovi, A. and Falini, A. (2013) ‘Z-Score Models'Application to Italian
Companies Subject to Extraordinary Administration’. Journal of Applied Finance, 23(1):
pp. 128-137.
Appiah, K.O, (2011). ‘Corporate Failure Prediction: Some Empirical Evidence from Listed
Firms in Ghana.’ China-USA Business Review, 10(1): pp.32-41.

45 | P a g e
Beaver, W. H. (1966) ‘Financial ratios as predictors of failure’. Journal of Accounting
Research, 4: pp.71-111.
Bernanke, Ben (2005). Remarks by Governor Ben S. Bernanke at the Sandridge Lecture,
Virginia Association of Economists, Richmond, Virginia., [Online] Federal Reserve
Board, Available from:
http://www.federalreserve.gov/boarddocs/speeches/2005/200503102/ [Accessed
4/5/2013]
Bunyaminu, A. and Issah, M. (2012) ‘Predicting Corporate Failure of UK’s Listed
Companies: Comparing Multiple Discriminant Analysis and Logistic Regression’.
International Research Journal of Finance and Economics, 94: p.6.
Charitou, A., Neophytou, E. and Charalambous, C. (2000) ‘Predicting Corporate Failure:
Empirical Evidence for the UK’, [Online] Unpublished thesis, Available from:
http://eprints.soton.ac.uk/36125/1/01-173.pdf [Accessed 8th August 2013]
Chen, H. J. & Huang, S. Y. and Lin C. S. (2009) ‘Alternative diagnosis of corporate
bankruptcy: A neuro fuzzy approach. Expert Systems with Applications’. Expert Systems
with Applications: An International Journal, 36(4): pp. 7710–7720.
Daily, C. and Dalton D.R, (1994) ‘Bankruptcy and Corporate Governance: The Impact of
Board Composition and Structure’. The Academy of Management Journal, 37(6): pp.
1603-1617.
Dambolena, I.G and Khoury, S.J. (1980) ‘Ratio Stability and Corporate Failure’. The Journal
of Finance, 35(4): pp. 1017-1026.
Datta, S. and Iskandar-Datta, M. E. (1995) ‘Corporate partial acquisitions, total firm
valuation and the effect of financing method’, Journal of Banking & Finance, 19(1): pp.
97-115.
Diamond, D.W. and Rajan, R.G. (2001) ‘Liquidity Risk, Liquidity Creation, and Financial
Fragility: A Theory of Banking’. Journal of Political Economy, 109(2): pp. 287-327.
ECB Report (2012) ‘Structure of the euro area economy’ [Online] Accessed from:
http://www.ecb.europa.eu/mopo/eaec/html/index.en.html [Accessed 18th August 2013]
Gilbert L., Menon, K. and Schwartz, K. (1990) “Predicting Bankruptcy for Firms in Financial
Distress”. Journal of Business Finance, 17(1): pp. 161-171.
Gilson, S. C. (1989) ‘Management Turnover and Financial Distress’. Journal of Financial
Economics, 25(2): pp. 241-262.
Gilson, S.C. (1990) ‘Bankruptcy, Boards, Banks, and Blockholders’. Journal of Financial
Economics, 27(2): pp. 355-387.
Hillegeist, S.A., Keating, E.K., Cram, D. P. and Lundstedt, K. G.(2004). ‘Assessing the
Probability of Bankruptcy’. Review of Accounting Studies, 9(1): pp. 5-34.
Jesswein, K. R. (2009). ‘An Examination of the “Texas Ratio” as a Bank Failure Model.’
Academy of Banking Studies Journal, 8(2): pp. 63-73.

46 | P a g e
Johnsen T. and Melicher, R. W. (1994) ‘Predicting Corporate Bankruptcy and Financial
Distress: Information Value Added by Multinomial Logit Models’. Journal of Economics
and Business, 46(4): pp. 269-286.
Jordan, D.J, Rice, D., Sanchez, J., Walker, C. and Wort, D.H, (2010) ‘Predicting Bank
Failures: Evidence from 2007 to 2010’. SRN, 3rd
August 2010: pp. 1-27.
Li, J. and Rahgozar, R. (2012) ‘Application of the Z -Score Model with Consideration of
Total Assets Volatility in Predicting Corporate Financial Failures from 2000-2010’.
Journal of Accounting and Finance, 12(2): pp. 11-19.
Merk, A. (2012) ‘Contagion from Greece still threatens euro’ [Online]. Financial Times, 12th
March, Available from: http://www.ft.com/cms/s/0/d90d8cc2-695a-11e1-956a-
00144feabdc0.html#ixzz2eDikwJhA [Accessed 10th
July 2013].
Meyer, P.A. and Pifer, H.W. (1970) ‘Prediction of Bank Failures’. The Journal of Finance,
25(4): pp. 853-868.
Moghadam, A.G, Zadeh, F.N, and Fard, M.M.G. (2011) ‘Review of the prediction power of
Altman and Ohlson Models in predicting bankruptcy of Listed Companies in Tehran
Stock Exchange – Iran’ unpublished work, [Online] Available
from:http://www.mbaforum.ir/download/mba/m/7th/236.pdf [Accessed 18th August
2013]
Moyer, R.C. (1977) ‘Forecasting Financial Failure: A Re-examination’. Financial
Management, 7(4): pp. 11-17.
Ohlson, J. A. (1980) ‘Financial ratios and the probabilistic prediction of bankruptcy’. Journal
of Accounting Research, 18(1): pp. 109-131.
Platt H. D., Platt, M. B. and Pedersen, J. (1994) “Bankruptcy Discriminant with Real
Variables”, Journal of Business Finance & Accounting (1994), pp. 491-510.
Platt H. D. and Platt, M. B. (1990) “Development of a Class of Stable Predictive Variables:
The Case of Bankruptcy Prediction”. Journal of Business Finance & Accounting, 17(1):
pp. 31-51.
Ross, S. A., Westerfield, R. W., Jaffe, J., and Jordan, B. D. (2007) Modern Financial
Management . 8th ed. New York: McGraw Hill.
Shukla, M. (1994). ‘Why organisations fail to learn’ [Online] Available from:
http://www.geocities.com/madhukar_shukla/corpfailures.html [Accessed on 9th August
2013]
Shumway, T. (2001) "Forecasting bankruptcy more accurately: A simple hazard model".
Journal of Business, 74 (1): pp. 101-124.
Siew Bee, T. and Abdollahi, M., (2011) ‘Corporate failure prediction: Malaysia’s emerging
market’. The International Journal of Finance, 23(2): pp. 6825-6851.
Simic, D., Evic, I.K, Simic, S. (2012). ‘Insolvency prediction for assessing corporate
financial health’. Logic Journal of the IGPL, 20 (3): pp. 536-549.

47 | P a g e
Sinkey, J. F., (1977). ‘Identifying Large Problem/Failed Banks: The Case of Franklin
National Bank of New York’. Journal of Financial And Quantitative Analysis, 12(5): pp.
779-800.
Sinkey, J. F. (1978). ‘Identifying "Problem" Banks: How Do the Banking Authorities
Measure a Bank’s Risk Exposure?’. Journal of Money, Credit and Banking, 10(2): pp.
184-193.
Sinkey, J. F. (1975) ‘A Multivariate Statistical Analysis of the Characteristics of Problem
Banks’. Journal of Finance, 30(1): pp. 21-36.
Telmoudi, F., Ghourabi, M. E. and Limam, M. (2011). ‘RST–GCBR‐Clustering‐Based
RGA–SVM Model for Corporate Failure Prediction’. Int. Syst. in Accounting, Finance
and Management, 18 (2-3): pp. 105-120.
Tilden, C. and Janes, T. (2012) ‘Empirical evidence of financial statement manipulation
during economic recessions’. Journal of Finance and Accountancy, 10: pp. 1-15.
Tucker, W. (2011) ‘Financial Crisis Inquiry Commission Releases Report on the Causes of
the Financial Crisis’. FCIC, 27th January 2011: pp. 1-2. [Online] Available from:
http://fcic-static.law.stanford.edu/cdn_media/fcic-news/2011-0127-fcic-releases-
report.pdf [Accessed 16th July 2013]
Zmijewski, M.E. (1984). ‘Methodological issues related to the estimation of financial distress
prediction models’. Journal of Accounting Research, 22: pp. 59-82.

48 | P a g e
Appendix
Financial Statements
Allied Irish Bank
Annual Report 2012:
http://ir2.flife.de/data/allied_irish_banks/igb_html/index.php?bericht_id=1000001&lang=EN
G
Annual Report 2011:
http://online.morningstarir.com/ir/aib/ar_2011/ar.jsp
Annual Report 2010:
http://online.hemscottir.com/ir/aib/ar_2010/ar.jsp
Annual Report 2009:
http://online.hemscottir.com/ir/aib/ar_2009/ar.jsp
Annual Report 2008:
http://online.hemscottir.com/ir/aib/ar_2008/ar.jsp
Anglo Irish Bank
Annual Report 2005:
http://www.ibrc.ie/About_us/Financial_information/Archived_reports/Annual_Report_2005.
Annual Report 2009:
http://www.rte.ie/news/2010/0331/angloreport1.pdf
Annual Report 2008:
http://www.ibrc.ie/About_us/Financial_information/Archived_reports/Annual_Report_2008.
Annual Report 2007:
http://www.ibrc.ie/About_us/Financial_information/Archived_reports/Annual_Report_2007.
Annual Report 2006:
http://www.ibrc.ie/About_us/Financial_information/Archived_reports/Annual_Report_2006.

49 | P a g e
Annual Report 2005:
http://www.ibrc.ie/About_us/Financial_information/Archived_reports/Annual_Report_2005.
Banca D’Italia
Annual Report 2011:
http://www.bancaditalia.it/pubblicazioni/relann/rel11/rel11en/en_rel_2011.pdf
Annual Report 2010:
http://www.bancaditalia.it/pubblicazioni/relann/rel10/rel10en/en_rel_2010.pdf
Annual Report 2009:
http://www.bancaditalia.it/pubblicazioni/relann/rel09/rel09en/en_rel_2009.pdf
Annual Report 2008:
http://www.bancaditalia.it/pubblicazioni/relann/rel08/rel08en/Text%20book_internet.pdf
Annual Report 2007:
http://www.bancaditalia.it/pubblicazioni/relann/rel07/encf07/rel_07_abr_anrep.pdf
Danske Bank
Annual Report 2012:
http://www.danskebank.com/Documents/Publications/AnnualReport-2012.html
Annual Report 2011:
http://www.danskebank.com/en-uk/ir/Documents/2011/Q4/Annualreport-2011-online.pdf
Annual Report 2010:
http://www.danskebank.com/Flash/ePages/Reports/Q42010/Report-UK/index.html
Annual Report 2009:
http://www.danskebank.com/en-uk/ir/Documents/2009/Q4/Annualreport-2009.pdf
Annual Report 2008:
http://www.danskebank.com/en-uk/ir/Documents/2008/Q4/Annualreport2008.pdf

50 | P a g e
Deutsche Bank
Annual Report 2012:
https://annualreport.deutsche-bank.com/2012/ar/servicepages/welcome.html
Annual Report 2011:
https://www.db.com/ir/en/download/DB_Annual_Report_2011_entire.pdf
Annual Report 2010:
https://www.db.com/ir/en/download/Deutsche_Bank_Annual_Report_2010_entire.pdf
Annual Report 2009:
https://www.db.com/ir/en/download/Annual_Report_2009_entire.pdf
Annual Report 2008:
https://www.db.com/ir/en/download/DB_Annual_Review_2008_entire.pdf
Dexia
Annual Report 2011:
http://www.dexia.com/EN/shareholder_investor/individual_shareholders/publications/Docum
ents/RA_2011_EN.pdf
Annual Report 2010:
http://www.dexia.com/EN/shareholder_investor/individual_shareholders/publications/Docum
ents/annual_report_2010_UK.pdf
Annual Report 2009:
http://www.dexia.com/EN/shareholder_investor/individual_shareholders/publications/Docum
ents/annual_report_2009_UK.pdf
Annual Report 2008:
http://www.dexia.com/EN/shareholder_investor/individual_shareholders/publications/Docum
ents/annual_report_2008_UK.pdf
Annual Report 2007:
http://www.dexia.com/EN/shareholder_investor/individual_shareholders/publications/Docum
ents/annual_report_2007_UK.pdf

51 | P a g e
Santander
Annual Report 2012:
http://www.santander.com/csgs/StaticBS?ssbinary=true&blobtable=MungoBlobs&blobkey=i
d&SSURIsscontext=Satellite+Server&blobcol=urldata&SSURIcontainer=Default&SSURIse
ssion=false&blobwhere=1278692235367&blobheader=application%2Fpdf&SSURIapptype=
BlobServer
Annual Report 2011:
http://www.santander.com/csgs/StaticBS?ssbinary=true&blobkey=id&SSURIsscontext=Satel
lite+Server&blobcol=urldata&blobheadervalue0=application%2Fpdf&blobheader=applicatio
n%2Fpdf&blobheadervalue1=inline%3B+filename%3D588%5C553%5CInforme+anual_ingl
es.pdf&blobwhere=1278681725312&SSURIsession=false&SSURIapptype=BlobServer&blo
btable=MungoBlobs&SSURIcontainer=Default&blobheadername0=content-
type&blobheadername1=content-disposition#satellitefragment
Annual Report 2010:
http://www.santander.com/csgs/StaticBS?ssbinary=true&blobkey=id&SSURIsscontext=Satel
lite+Server&blobcol=urldata&blobheadervalue0=application%2Fpdf&blobheader=applicatio
n%2Fpdf&blobheadervalue1=inline%3B+filename%3DAnnual+report_ENG%2C3.pdf&blo
bwhere=1278680670554&SSURIsession=false&SSURIapptype=BlobServer&blobtable=Mu
ngoBlobs&SSURIcontainer=Default&blobheadername0=content-
type&blobheadername1=content-disposition#satellitefragment
Annual Report 2009:
http://www.santander.com/csgs/StaticBS?ssbinary=true&blobkey=id&SSURIsscontext=Satel
lite+Server&blobcol=urldata&blobheadervalue0=application%2Fpdf&blobheader=applicatio
n%2Fpdf&blobheadervalue1=inline%3B+filename%3DInforme+anual_ENG.pdf&blobwher
e=1278680652317&SSURIsession=false&SSURIapptype=BlobServer&blobtable=MungoBl
obs&SSURIcontainer=Default&blobheadername0=content-type&blobheadername1=content-
disposition#satellitefragment
Annual Report 2008:
http://www.santander.com/csgs/StaticBS?ssbinary=true&blobkey=id&SSURIsscontext=Satel
lite+Server&blobcol=urldata&blobheadervalue0=application%2Fpdf&blobheader=applicatio
n%2Fpdf&blobheadervalue1=inline%3B+filename%3D01+SAN_AnnualReport_Complete_
WEB.pdf&blobwhere=1278680481513&SSURIsession=false&SSURIapptype=BlobServer&
blobtable=MungoBlobs&SSURIcontainer=Default&blobheadername0=content-
type&blobheadername1=content-disposition#satellitefragment

52 | P a g e
Proton
Annual Report 2009:
https://www.proton.gr/uploaded/downloads/6M_FEK_ENGLISH.pdf
Annual Report 2008:
http://www.athex.gr/content/gr/companies/listedco/annualreports/files/00950_2008_EN.PDF
Annual Report 2007:
http://www.athex.gr/content/gr/companies/listedco/annualreports/files/00950_2007_EN.PDF
Annual Report 2006:
https://www.proton.gr/uploaded/downloads/Proton_Bank_Eng_12M_2006.pdf
Annual Report 2005:
https://www.proton.gr/uploaded/downloads/Proton_Bank_Eng_12M_2006.pdf

53 | P a g e
Z” Score Model Excel Workings (See disc attached for files)
AIB
AIB 2008-2012
CA CL TA X,
X,: Working Capital/Total AssetsYE 2012 14463 5301 122516 0.074782
YE 2011 16600 5123 136651 0.083988
YE 2010 13200 8383 145222 0.03317
YE 2009 21283 9493 174314 0.067637
YE 2008 18105 9286 182143 0.048418
RE TA X2
X2: Retained Earnings/Total AssetsYE 2012 3145 122516 0.02567
YE 2011 4367 136651 0.031957
YE 2010 330 145222 0.002272
YE 2009 330 174314 0.001893
YE 2008 698 182143 0.003832
X3: EBIT/Total Assets
OR OE Non-operating incomeEBIT X3
YE 2012 621 1,937 485 -1,801 -0.0147
YE 2011 4340 1720 2990 5610 0.041053
YE 2010 3357 1649 5201 -10207 -0.07029
YE 2009 4106 1522 1234 3818 0.021903
YE 2008 5068 2357 1201 3912 0.021478
X4: Book Value Equity/Total liabilities
BVE(TA-TL) TL X4
YE 2012 11241 111,275 0.101019996
YE 2011 14,463 122,188 0.118366779
YE 2010 4349 140,873 0.030871778
YE 2009 11335 162,979 0.069548838
YE 2008 10282 171861 0.059827419
3.25
Z" = 6.56X, + 3.26X2 + 6.72X3 + 1.05x4 Addition 3.25
Z'' YE 2012 0.581541138 3.831541138
Z''YE 2011 1.055304576 4.305304576
Z''YE 2010 -0.214900604 3.035099396
Z"YE 2009 0.670081938 3.920081938
Z"YE 2008 0.537263374 3.787263374

54 | P a g e
Anglo Irish Bank
ANGLO IRISH BANK 2005-2009
CA CL TA X,
X,: Working Capital/Total Assets YE 2009 54175 86885 92851 -0.35228
YE 2008 102053 96495 103166 0.053874
YE 2007 90019 84270 96652 0.059481
YE 2006 70385 66077 73290 0.05878
YE 2005 6810.8 956.7 48263.6 0.121294
RE TA X2
X2: Retained Earnings/Total Assets YE 2009 9258 92851 0.099708
YE 2008 3389 101321 0.033448
YE 2007 2883 96652 0.029829
YE 2006 1971 73290 0.026893
YE 2005 399.6 48263.6 0.00828
X3: EBIT/Total Assets
OR OE Non-operating income EBIT X3
YE 2009 2774 380 1,249 3,643 0.039235
YE 2008 1972 328 84 1728 0.017055
YE 2007 1761 393 195 1563 0.016171
YE 2006 1240 328 171 1083 0.014777
YE 2005 977 291.8 21.8 1247 0.025837
X4: Book Value Equity/Total liabilities
BVE(TA-TL) TL X4
YE 2009 3764 89087 0.042250833
YE 2008 1823 99,498 0.018321976
YE 2007 4065 92587 0.043904652
YE 2006 2692 70598 0.038131392
YE 2005 5591.4 42672.2 0.131031444
BRE Constant 3.25
Z" = 6.56X, + 3.26X2 + 6.72X3 + 1.05x4 Addition 3.25
Z'' YE 2009 -1.67791813 1.57208187
Z''YE 2008 0.596302337 3.846302337
Z''YE 2007 0.642211501 3.892211501
Z"YE 2006 0.612608571 3.862608571
Z"YE 2005 1.133891456 4.383891456

55 | P a g e
Banca D’Italia Banca D'Italia 2007-2011
CA CL TA X,
X,: Working Capital/Total AssetsYE 2011 49,297 19,932 538,978 0.0545
YE 2010 47,485 18,862 332,961 0.0860
YE 2009 49,688 44,611 301,256 0.0169
YE 2008 45,700 46,331 267,431 -0.0024
YE 2007 88,683 61,032 324,200 0.0853
RE TA X2
X2: Retained Earnings/Total AssetsYE 2011 21,744 538,978 0.040343796
YE 2010 21,149 332,961 0.063518719
YE 2009 20,079 301,256 0.066649823
YE 2008 19,622 267,431 0.073373115
YE 2007 17,300 324,200 0.053361641
X3: EBIT/Total Assets
OR OE Non-operating incomeEBIT X3
YE 2011 590 1,863 109 -1,163 -0.00216
YE 2010 613 1921 73 -1235 -0.00371
YE 2009 1,249 2005 71 -685 -0.00227
YE 2008 907 2,049 77 -1065 -0.00398
YE 2007 1403 1687 62 -222 -0.00069
X4: Book Value Equity/Total liabilities
BVE(TA-TL) TL X4
YE 2011 22,874 516,104 0.044320018
YE 2010 22,002 310,959 0.070754345
YE 2009 21,747 279,509 0.077805796
YE 2008 19,798 247,633 0.079947271
YE 2007 97,219 226,981 0.428312859
3.25
Z" = 6.56X, + 3.26X2 + 6.72X3 + 1.05x4 Addition 3.25
Z'' YE 2011 0.520948689 3.770948689 B-
Z''YE 2010 0.820345294 4.070345294 CCC+
Z''YE 2009 0.39423437 3.64423437 CCC
Z"YE 2008 0.280897174 3.530897174 CCC
Z"YE 2007 1.178578682 4.428578682 B-

56 | P a g e
Danske Bank
Danske Bank 2008-2011
CA CL TA X,
X,: Working Capital/Total AssetsYE 2012 2,016,010 204795 3485181 0.51969037
YE 2011 2027953 184668 3424403 0.53827923
YE 2010 1928860 207880 3213886 0.53548259
YE 2009 1923319 190970 3098477 0.55909694
YE 2008 1991135 167893 3543974 0.51446258
RE TA X2
X2: Retained Earnings/Total AssetsYE 2012 1723 3485181 0.00049438
YE 2011 276 3424403 8.0598E-05
YE 2010 1713 3213886 0.000533
YE 2009 1036 3098477 0.00033436
YE 2008 14,870 3543974 0.00419585
X3: EBIT/Total Assets
OR OE Non-operating income EBIT X3
YE 2012 47685 26,588 0 21,097 0.006053
YE 2011 43377 25987 0 17390 0.005078
YE 2010 46,277 26010 0 20,267 0.006306
YE 2009 59339 28907 0 30432 0.009822
YE 2008 43043 28726 0 14317 0.00404
X4: Book Value Equity/Total liabilities
BVE(TA-TL) TL X4
YE 2012 138234 3,346,947 0.04130152
YE 2011 125,855 3,298,548 0.038154667
YE 2010 104,742 3,109,144 0.033688372
YE 2009 100,659 2,997,818 0.033577422
YE 2008 98,247 3445727 0.028512706
3.25
Z" = 6.56X, + 3.26X2 + 6.72X3 + 1.05x4 Addition 3.25
Z'' YE 2012 3.494825565 6.74482557
Z''YE 2011 3.605562769 6.85556277
Z''YE 2010 3.592252973 6.84225297
Z"YE 2009 3.770023354 7.02002335
Z"YE 2008 3.445638896 6.6956389

57 | P a g e
Deutsche Bank
Deutche Bank 2008-2012
CA CL TA X,
X,: Working Capital/Total AssetsYE 2012 80204 45582 1723459 0.020089
YE 2011 117985 44004 1869074 0.039582
YE 2010 69253 48918 1620164 0.012551
YE 2009 673149 1303710 1,538,623 -0.40982
YE 2008 1349904 30117 2,250,665 0.586399
RE TA X2
X2: Retained Earnings/Total AssetsYE 2012 6114 1723459 0.003548
YE 2011 5434 1869074 0.002907
YE 2010 5144 1620164 0.003175
YE 2009 4420 1538623 0.002873
YE 2008 4080 2250665 0.001813
X3: EBIT/Total Assets
OR OE Non-operating incomeEBIT X3
YE 2012 2553 4,828 -2,275 -0.00132
YE 2011 4544 5102 -558 -0.0003
YE 2010 2344 4804 -2,460 -0.00152
YE 2009 804 2853 -2,049 -0.00133
YE 2008 2,123 1,941 182 8.09E-05
X4: Book Value Equity/Total liabilities
BVE(TA-TL) TL X4
YE 2012 34,752 1,688,707 0.0205791
YE 2011 33,990 1,835,084 0.0185223
YE 2010 33,685 1,586,479 0.0212326
YE 2009 22,764 1,515,859 0.0150172
YE 2008 20,942 2,229,723 0.0093922
3.25
3.25 Z" = 6.56X, + 3.26X2 + 6.72X3 + 1.05x4 Addition 3.25
3.25 Z'' YE 2012 0.156084062 3.4060841
3.25 Z''YE 2011 0.286575594 3.5365756
3.25 Z''YE 2010 0.10477709 3.3547771
3.25 Z"YE 2009 -2.67224596 0.577754
3.25 Z"YE 2008 3.863090325 7.1130903

58 | P a g e
Dexia
DEXIA 2007-2011
CA CL TA X,
X,: Working Capital/Total Assets YE 2011 52,231 65193 412759 -0.0314
YE 2010 61850 99830 566735 -0.06702
YE 2009 54914 103571 577630 -0.08424
YE 2008 70449 123657 645388 -0.08244
YE 2007 69376 79002 604564 -0.01592
RE TA X2
X2: Retained Earnings/Total AssetsYE 2011 965 412759 0.002338
YE 2010 -3,548 566735 -0.00626
YE 2009 -4,194 577630 -0.00726
YE 2008 -870 651,006 -0.00134
YE 2007 -1,951 604564 -0.00323
X3: EBIT/Total Assets
OR OE Non-operating incomeEBIT X3
YE 2011 -4,383 1,114 -161 -5,658 -0.01371
YE 2010 1562 1,136 56 482 0.00085
YE 2009 6163 3607 -314 2,242 0.003881
YE 2008 3556 4119 629 66 0.000101
YE 2007 6896 3834 -256 2,806 0.004641
X4: Book Value Equity/Total liabilities
BVE(TA-TL) TL X4
YE 2011 -320 413,079 -0.00077467
YE 2010 10,728 556,007 0.019294721
YE 2009 11,988 565,642 0.021193617
YE 2008 5,618 645,388 0.008704841
YE 2007 16,394 588170 0.027872894
3.25
Z" = 6.56X, + 3.26X2 + 6.72X3 + 1.05x4 Addition 3.25
Z'' YE 2011 -0.291313623 2.958686377
Z''YE 2010 -0.434055593 2.815944407
Z''YE 2009 -0.527919165 2.722080835
Z"YE 2008 -0.535364171 2.714635829
Z"YE 2007 -0.054513673 3.195486327

59 | P a g e
Proton
Proton 2005-2009
CA CL TA X,
X,: Working Capital/Total AssetsYE 2009 131.086 65.939 2904.402 0.02243
YE 2008 101.016 63.058 1979.807 0.019173
YE 2007 82.497 69.299 2,365.43 0.00558
YE 2006 73.558 68.705 1,586.50 0.003059
YE 2005 60.883 55.24 290.234 0.019443
RE TA X2
X2: Retained Earnings/Total AssetsYE 2009 -40.892 2904.402 -0.01408
YE 2008 -56.2 1979.807 -0.02839
YE 2007 18.579 2365.431 0.007854
YE 2006 16.612 1586.503 0.010471
YE 2005 -6.172 290.234 -0.02127
X3: EBIT/Total Assets
OR OE Non-operating incomeEBIT X3
YE 2009 79.634 -66.743 3.1100 16.0010 0.005509
YE 2008 45.199 -45.262 0.0000 -0.0630 -3.2E-05
YE 2007 94.23 -64.156 0.0000 30.0780 0.012716
YE 2006 65.183 -27.094 0.0000 38.0890 0.024008
YE 2005 21.284 -8.723 0.0000 12.5610 0.043279
X4: Book Value Equity/Total liabilities
BVE(TA-TL) TL X4
YE 2009 316.477 2587.925 0.122289865
YE 2008 268.308 1,711.50 0.156767839
YE 2007 367.565 1997.866 0.183978805
YE 2006 384.744 1201.759 0.320150712
YE 2005 234.897 55.337 4.244845221
3.25 sale of proton in 2009
Z" = 6.56X, + 3.26X2 + 6.72X3 + 1.05x4 Addition 3.25
Z'' YE 2009 0.266671417 3.516671417 CCC
Z''YE 2008 0.197624157 3.447624157 CCC
Z''YE 2007 0.340833957 3.590833957 CCC
Z"YE 2006 0.551694481 3.801694481 CCC+
Z"YE 2005 4.80614128 8.05614128 AA

60 | P a g e
Santander
Santander 2008-2012
CA CL TA X,
X,: Working Capital/Total AssetsYE 2012 131,359 57684 1269628 0.058029
YE 2011 117700 71402 1251526 0.036993
YE 2010 98443 77385 1217501 0.017296
YE 2009 123935 111473 1110529 0.011222
YE 2008 153215 110917 1049632 0.040298
RE TA X2
X2: Retained Earnings/Total AssetsYE 2012 37153 1269628 0.029263
YE 2011 32980 1251526 0.026352
YE 2010 28307 1217501 0.02325
YE 2009 61071 1110529 0.054993
YE 2008 55,707 1049632 0.053073
X3: EBIT/Total Assets
OR OE Non-operating incomeEBIT X3
YE 2012 3,908 -6,585 -575 -3,252 -0.00256
YE 2011 9,719 -8,032 -1,776 -89 -7.1E-05
YE 2010 12,278 -8,089 -2,923 1,266 0.00104
YE 2009 22,960 -16,421 -1,311 5,228 0.004708
YE 2008 18,540 -14,949 -426 3,165 0.003015
X4: Book Value Equity/Total liabilities
BVE(TA-TL) TL X4
YE 2012 84,326 1,185,302 0.071143
YE 2011 82,859 1,168,667 0.0709
YE 2010 80,915 1,136,586 0.071191
YE 2009 73,870 1,036,659 0.071258
YE 2008 60,002 989,630 0.060631
3.25
Z" = 6.56X, + 3.26X2 + 6.72X3 + 1.05x4 Addition 3.25
Z'' YE 2012 0.534706394 3.784706
Z''YE 2011 0.402582189 3.652582
Z''YE 2010 0.270528183 3.520528
Z"YE 2009 0.357228169 3.607228
Z"YE 2008 0.519940526 3.769941

61 | P a g e
Statistics
Data set 1 Data Set 2
Failed Bank Z"Score Banks (not Failed) Z"Score
Anglo Irish Bank -1.67792 AIB 0.581541
Banca Di Italia -0.57559 Danske Bank 3.494826
Dexia -0.29131 Santander 0.534706
Proton 0.266671 Deutche Bank 0.156084
Mean -0.56954 1.191789
Standard Deviation 0.817557 1.547129
Standard Error 0.408778 0.773564