verification of lc-ms method suitability for application
TRANSCRIPT

UNCLASSIFIED
Verification of LC-MS Method Suitability for Application to OPCW Proficiency Testing
Candace Greer
Land Division Defence Science and Technology Group
DST-Group-TR-3554
ABSTRACT Defence Science and Technology (DST) Group is working towards becoming a designated laboratory for the Organisation for the Prohibition of Chemical Weapons (OPCW), and thus participates in its proficiency testing program. DST has typically relied on a combination of data from Gas Chromatography-Mass Spectrometry with Electron Impact (GC-MS[EI]) and Gas Chromatography-Mass Spectrometry with Chemical Ionisation (GC-MS[CI]) for reporting purposes, however it has recently implemented a Liquid Chromatography-Mass Spectrometry (LC-MS) method as a third technique to provide additional information where required. Given that samples received as part of the program may be spiked with compounds at concentrations as low as 1 ppm, this document reports the work undertaken in ascertaining that the limit of detection (LOD) of the LC-MS method is below this threshold, and that the method is overall fit for application in OPCW proficiency tests. The results of the work demonstrate that for all compounds assessed, the LOD is below 1 ppm and the method is acceptably repeatable so that it may be used for reporting in OPCW proficiency tests.
RELEASE LIMITATION Approved for public release.
UNCLASSIFIED
UNCLASSIFIED
Produced by
Land Division Defence Science and Technology Group 506 Lorimer St Fisherman’s Bend, Victoria 3207
Telephone: 1300 333 362
Commonwealth of Australia 2018 November 2018
UNCLASSIFIED
APPROVED FOR PUBLIC RELEASE
UNCLASSIFIED
Verification of LC-MS Method Suitability for Application to OPCW Proficency Testing
Executive Summary
Defence Science and Technology (DST) Group is working towards achieving designated laboratory status with the Organisation for the Prohibition of Chemical Weapons (OPCW). Such laboratories are those which may be used by the OPCW to perform offsite analysis to assist in its investigations pertaining to verification of destruction or alleged use of chemical weapons agents (CWAs). Accordingly, DST regularly participates in the OPCW proficiency testing program to satisfy the OPCW’s condition of at least annual participation in the program, and an A-grade majority maintained across every three tests in which the laboratory has participated.
During a proficiency test, participating laboratories have 15 calendar days in which to analyse the samples and report results. Results reported must have supporting evidence provided by at least two analytical techniques. DST has typically relied on a combination of Gas Chromatography-Mass Spectrometry with Electron Impact (GC-MS[EI]) and Gas Chromatography-Mass Spectrometry with Chemical Ionisation (GC-MS[CI]) data, however it has recently implemented a Liquid Chromatography-Mass Spectrometry (LC-MS) method as a third technique to provide additional information where required. Given that samples received as part of the program may be spiked with compounds at concentrations as low as 1 ppm, this document reports the work undertaken in the verification of the limit of detection (LOD) of the LC-MS method as being below this level, and that the method is overall fit for application in OPCW proficiency tests.
Herein, solutions of nine hydrolysis products of various (eight) CWAs were prepared at six concentrations in the range 0.25 to 10 ppm, and analysed using the aforementioned method. Results showed that eight of the nine compounds demonstrate a high degree of linearity over the concentration range 0.25 to 10 ppm, and all compounds had an LOD below the 1 ppm threshold, with acceptable repeatability, rendering the LC-MS method fit for participation in OPCW proficiency tests.
UNCLASSIFIED

UNCLASSIFIED
This page is intentionally blank.
UNCLASSIFIED

UNCLASSIFIED DST-Group-TR-3554
Contents
1. INTRODUCTION ............................................................................................................... 1
2. METHODS ........................................................................................................................... 3 2.1. Sample Preparation .................................................................................................. 3 2.2. LC-MS Method .......................................................................................................... 3
2.2.1. LC Conditions .......................................................................................... 3 2.2.2. MS Conditions ......................................................................................... 3
3. RESULTS AND DISCUSSION ........................................................................................ 4 3.1. Linearity ...................................................................................................................... 4 3.2. Limit of Detection ..................................................................................................... 5 3.3. Limit of Reporting (based on OPCW criteria) ..................................................... 5 3.4. Repeatability .............................................................................................................. 5
4. CONCLUSION .................................................................................................................... 8
5. REFERENCES ...................................................................................................................... 8
APPENDIX A CHEMICAL STRUCTURES ..................................................................... 9
APPENDIX B CALIBRATION CURVES ....................................................................... 11
UNCLASSIFIED

UNCLASSIFIED DST-Group-TR-3554
This page is intentionally blank.
UNCLASSIFIED
UNCLASSIFIED DST-Group-TR-3554
CAAF CMPA CWA DST Group EDMAP EIC EMPA EPA GA GB
GC-MS(CI)
GC-MS(EI) GD GF HD HN2 IMPA ISO LC LC-MS LOD LOR MPA MS m/z N-Me DEAOPCWPMPAppmR2
RSDSDS/NTDGUPLC
Abbreviations
Chemical Agents Analysis Facility Cyclohexyl Methylphosphonic Acid Chemical Warfare Agent Defence Science and Technology Group O-Ethyl-N,N-dimethylamido Phosphoric AcidExtracted Ion ChromatogramEthyl Methylphosphonic AcidEthylphosphonic AcidTabunSarinGas Chromatography-Mass Spectrometry with ChemicalIonisationGas Chromatography-Mass Spectrometry with Electron ImpactSomanCyclosarinSulfur MustardNitrogen MustardIsopropyl Methylphosphonic AcidInternational Organisation for StandardisationLiquid Chromatograph(y)Liquid Chromatography-Mass SpectrometryLimit of DetectionLimit of ReportingMethylphosphonic AcidMass Spectrometry (or Mass Spectrometer)Mass-to-ChargeN-methyl DiethanolamineOrganisation for the Prohibition of Chemical WeaponsPinacolyl Methylphosphonic AcidParts Per MillionCorrelation CoefficientRelative Standard DeviationStandard DeviationSignal-to-NoiseThiodiglycolUltra-Performance Liquid Chromatography
UNCLASSIFIED
UNCLASSIFIED DST-Group-TR-3554
This page is intentionally blank.
UNCLASSIFIED
UNCLASSIFIED DST-Group-TR-3554
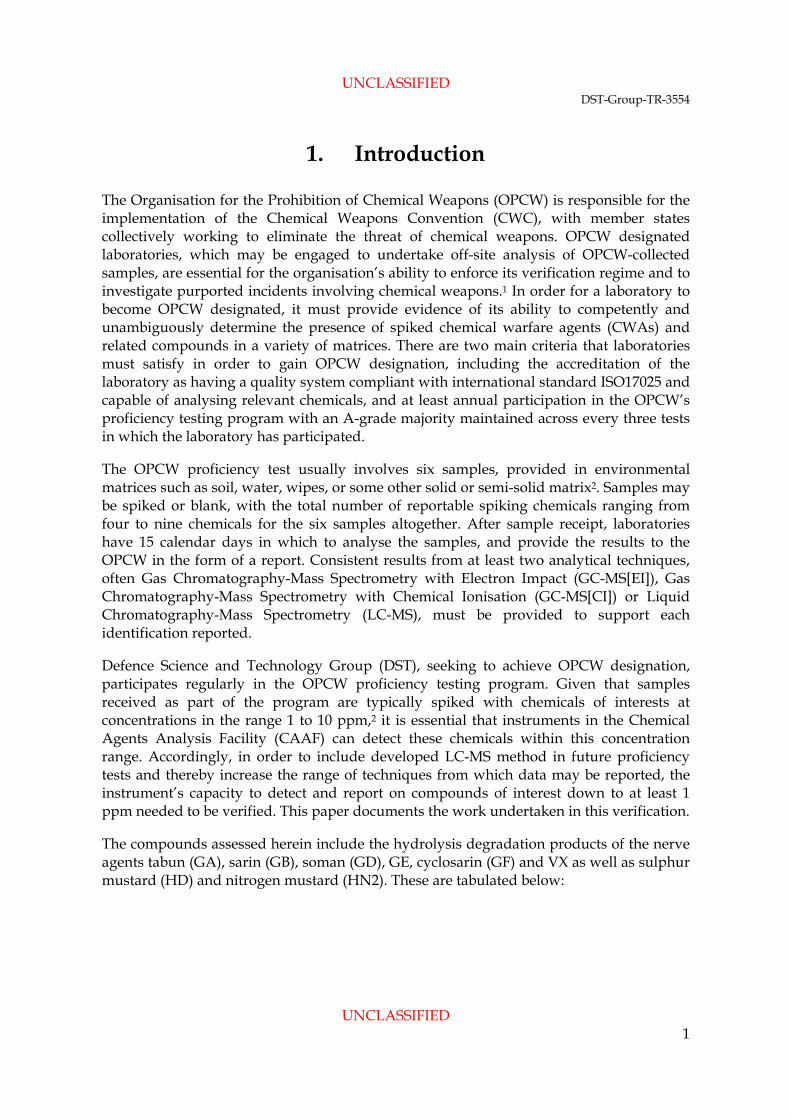
1. Introduction
The Organisation for the Prohibition of Chemical Weapons (OPCW) is responsible for the implementation of the Chemical Weapons Convention (CWC), with member states collectively working to eliminate the threat of chemical weapons. OPCW designated laboratories, which may be engaged to undertake off-site analysis of OPCW-collected samples, are essential for the organisation’s ability to enforce its verification regime and to investigate purported incidents involving chemical weapons.1 In order for a laboratory to become OPCW designated, it must provide evidence of its ability to competently and unambiguously determine the presence of spiked chemical warfare agents (CWAs) and related compounds in a variety of matrices. There are two main criteria that laboratories must satisfy in order to gain OPCW designation, including the accreditation of the laboratory as having a quality system compliant with international standard ISO17025 and capable of analysing relevant chemicals, and at least annual participation in the OPCW’s proficiency testing program with an A-grade majority maintained across every three tests in which the laboratory has participated.
The OPCW proficiency test usually involves six samples, provided in environmental matrices such as soil, water, wipes, or some other solid or semi-solid matrix2. Samples may be spiked or blank, with the total number of reportable spiking chemicals ranging from four to nine chemicals for the six samples altogether. After sample receipt, laboratories have 15 calendar days in which to analyse the samples, and provide the results to the OPCW in the form of a report. Consistent results from at least two analytical techniques, often Gas Chromatography-Mass Spectrometry with Electron Impact (GC-MS[EI]), Gas Chromatography-Mass Spectrometry with Chemical Ionisation (GC-MS[CI]) or Liquid Chromatography-Mass Spectrometry (LC-MS), must be provided to support each identification reported.
Defence Science and Technology Group (DST), seeking to achieve OPCW designation, participates regularly in the OPCW proficiency testing program. Given that samples received as part of the program are typically spiked with chemicals of interests at concentrations in the range 1 to 10 ppm,2 it is essential that instruments in the Chemical Agents Analysis Facility (CAAF) can detect these chemicals within this concentration range. Accordingly, in order to include developed LC-MS method in future proficiency tests and thereby increase the range of techniques from which data may be reported, the instrument’s capacity to detect and report on compounds of interest down to at least 1 ppm needed to be verified. This paper documents the work undertaken in this verification.
The compounds assessed herein include the hydrolysis degradation products of the nerve agents tabun (GA), sarin (GB), soman (GD), GE, cyclosarin (GF) and VX as well as sulphur mustard (HD) and nitrogen mustard (HN2). These are tabulated below:
UNCLASSIFIED 1
UNCLASSIFIED DST-Group-TR-3554
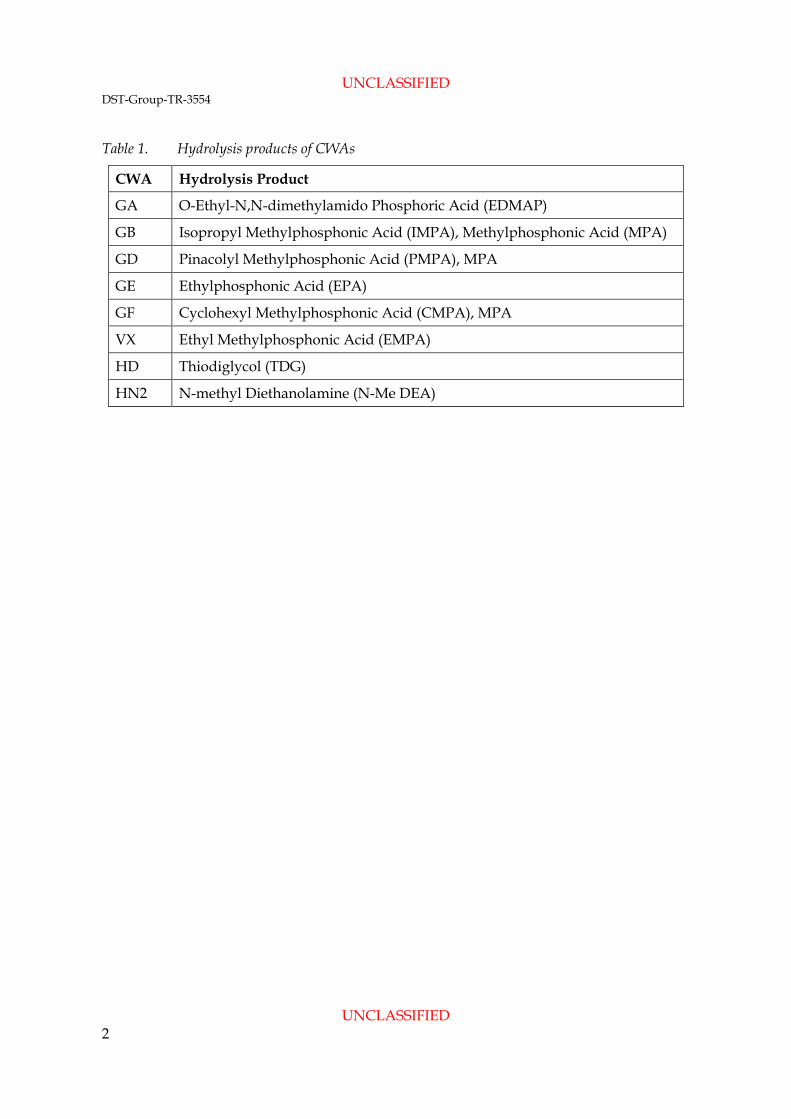
Table 1. Hydrolysis products of CWAs
CWA Hydrolysis Product
GA O-Ethyl-N,N-dimethylamido Phosphoric Acid (EDMAP)
GB Isopropyl Methylphosphonic Acid (IMPA), Methylphosphonic Acid (MPA)
GD Pinacolyl Methylphosphonic Acid (PMPA), MPA
GE Ethylphosphonic Acid (EPA)
GF Cyclohexyl Methylphosphonic Acid (CMPA), MPA
VX Ethyl Methylphosphonic Acid (EMPA)
HD Thiodiglycol (TDG)
HN2 N-methyl Diethanolamine (N-Me DEA)
UNCLASSIFIED 2

UNCLASSIFIED DST-Group-TR-3554
2. Methods
2.1. Sample Preparation
Solutions of the nine hydrolysis products shown in Table 1 were prepared in triplicate for analysis at six concentration levels: 0.25, 0.50, 1, 2.50, 5 and 10 ppm. These solutions were prepared from primary solutions at 1000 ppm, first being diluted 100-fold to 10 ppm. The 10 ppm solution was then used to prepare the 5 ppm and 1 ppm solutions, with each of these then being used in serial dilutions to prepare the remaining concentration levels noted above. Three blanks were also prepared. The series was used for the construction of calibration curves to determine linearity and estimate the limits of detection (LOD) for each compound. It should be noted that the method is intended for qualitative use, and only an indicative LOD was sought.
2.2. LC-MS Method
Analyses were performed using an Agilent Technologies 1290 Infinity Liquid Chromatograph (LC) together with an Agilent Technologies 6460 Triple Quadrupole Mass Spectrometer detector (MS). The method conditions are described below.
2.2.1. LC Conditions
2 µL of each sample was injected onto a Waters Acquity UPLC HSS T3 Column/C-18 (150 mm x 2.1 mm x 1.8 µm), heated to 50 ºC, at a flow rate of 500 µL/min. The following eluents were used: (A) 0.05% formic acid in water, and (B) 0.05% formic acid in acetonitrile. The method used a gradient elution program, holding at 100% A for the first two minutes, before ramping down to 10% A over the following 15 minutes, and being held for 5 minutes at a high organic composition. Subsequently, from 22 to 23 minutes, the gradient returned to starting conditions of 100% A.
2.2.2. MS Conditions
The MS was run in positive electrospray ionisation mode, with a capillary voltage of 4.0 kV. Analyses were performed using full-scan mode, monitoring the mass-to-charge (m/z) range 50-650.
UNCLASSIFIED 3
UNCLASSIFIED DST-Group-TR-3554
3. Results and Discussion
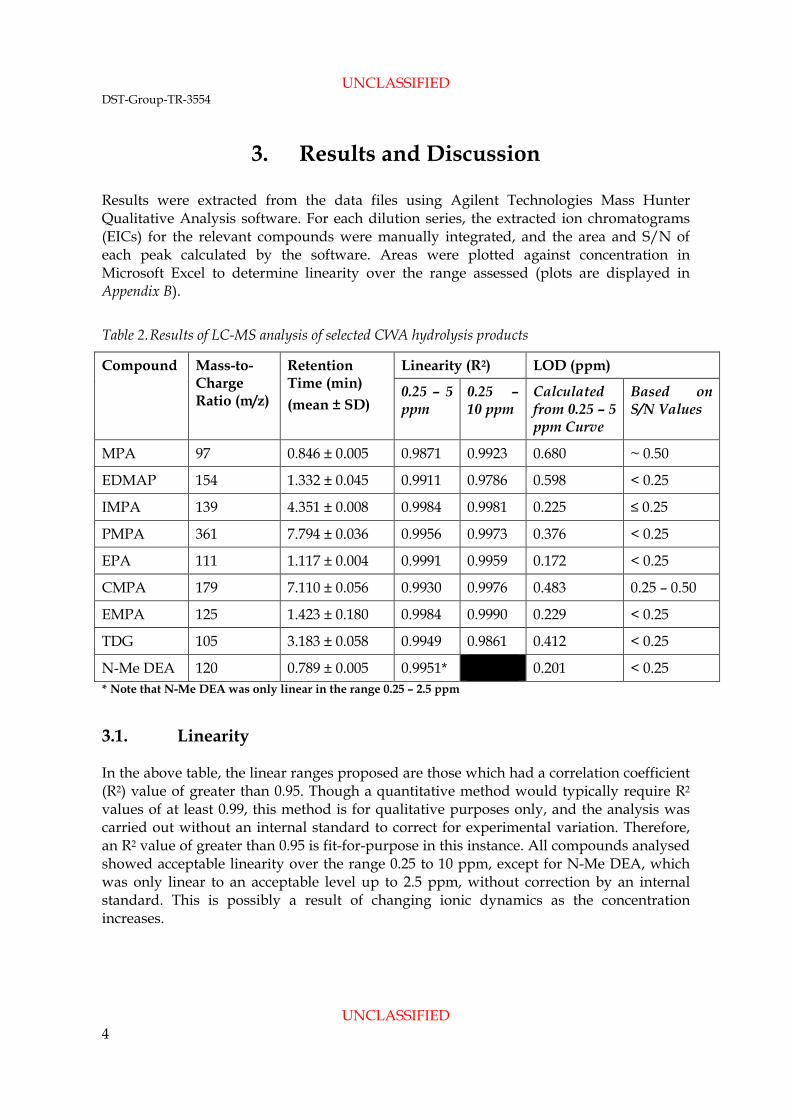
Results were extracted from the data files using Agilent Technologies Mass Hunter Qualitative Analysis software. For each dilution series, the extracted ion chromatograms (EICs) for the relevant compounds were manually integrated, and the area and S/N of each peak calculated by the software. Areas were plotted against concentration in Microsoft Excel to determine linearity over the range assessed (plots are displayed in Appendix B).
Table 2. Results of LC-MS analysis of selected CWA hydrolysis products
Compound Mass-to-Charge Ratio (m/z)
Retention Time (min) (mean ± SD)
Linearity (R2) LOD (ppm)
0.25 – 5 ppm
0.25 – 10 ppm
Calculated from 0.25 – 5 ppm Curve
Based on S/N Values
MPA 97 0.846 ± 0.005 0.9871 0.9923 0.680 ~ 0.50
EDMAP 154 1.332 ± 0.045 0.9911 0.9786 0.598 < 0.25
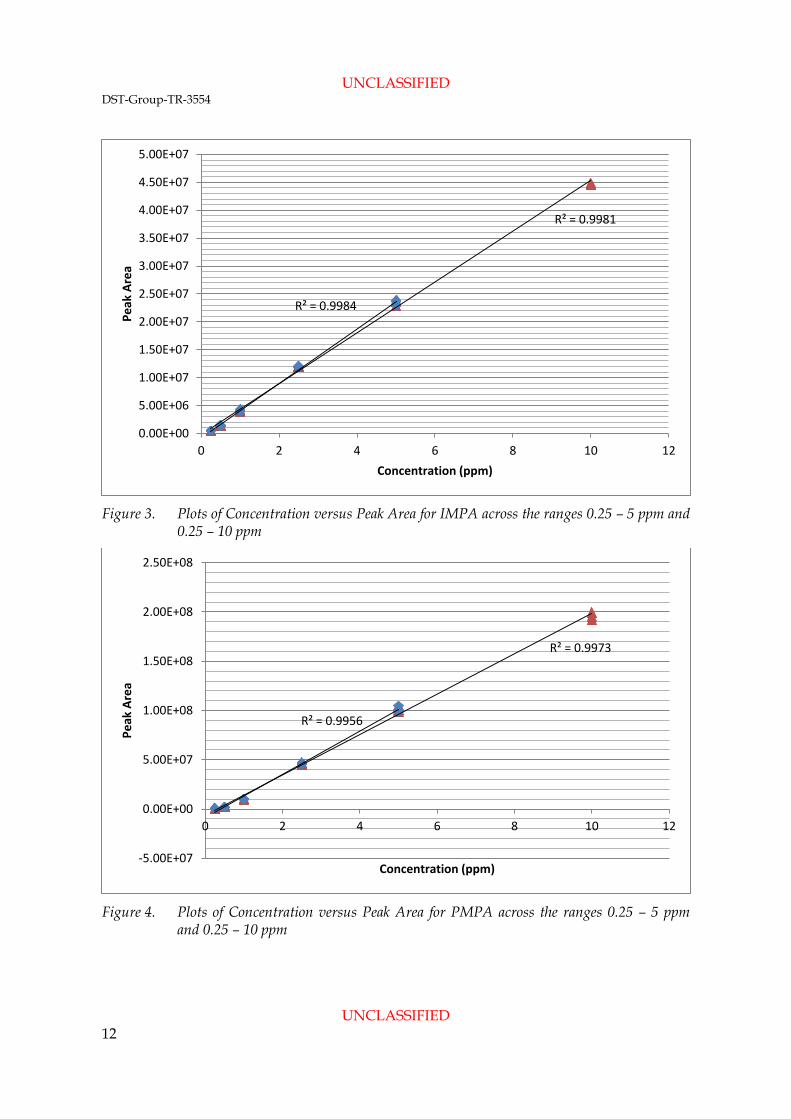
IMPA 139 4.351 ± 0.008 0.9984 0.9981 0.225 ≤ 0.25
PMPA 361 7.794 ± 0.036 0.9956 0.9973 0.376 < 0.25
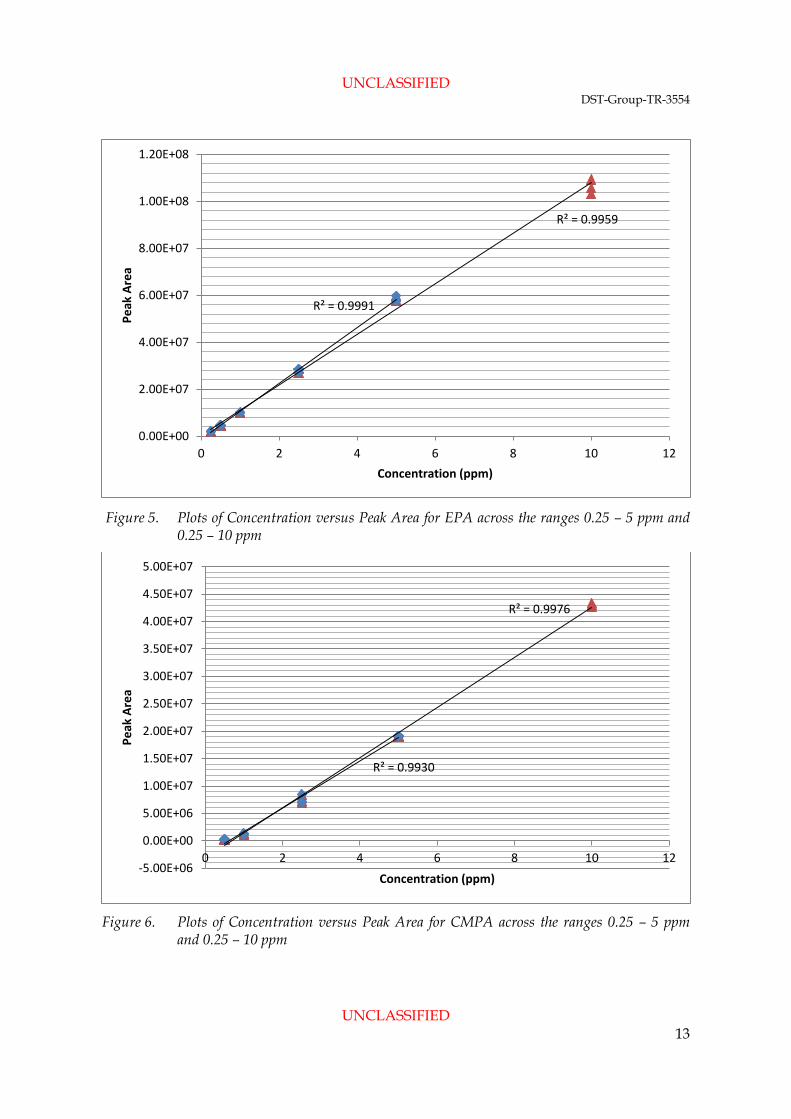
EPA 111 1.117 ± 0.004 0.9991 0.9959 0.172 < 0.25
CMPA 179 7.110 ± 0.056 0.9930 0.9976 0.483 0.25 – 0.50
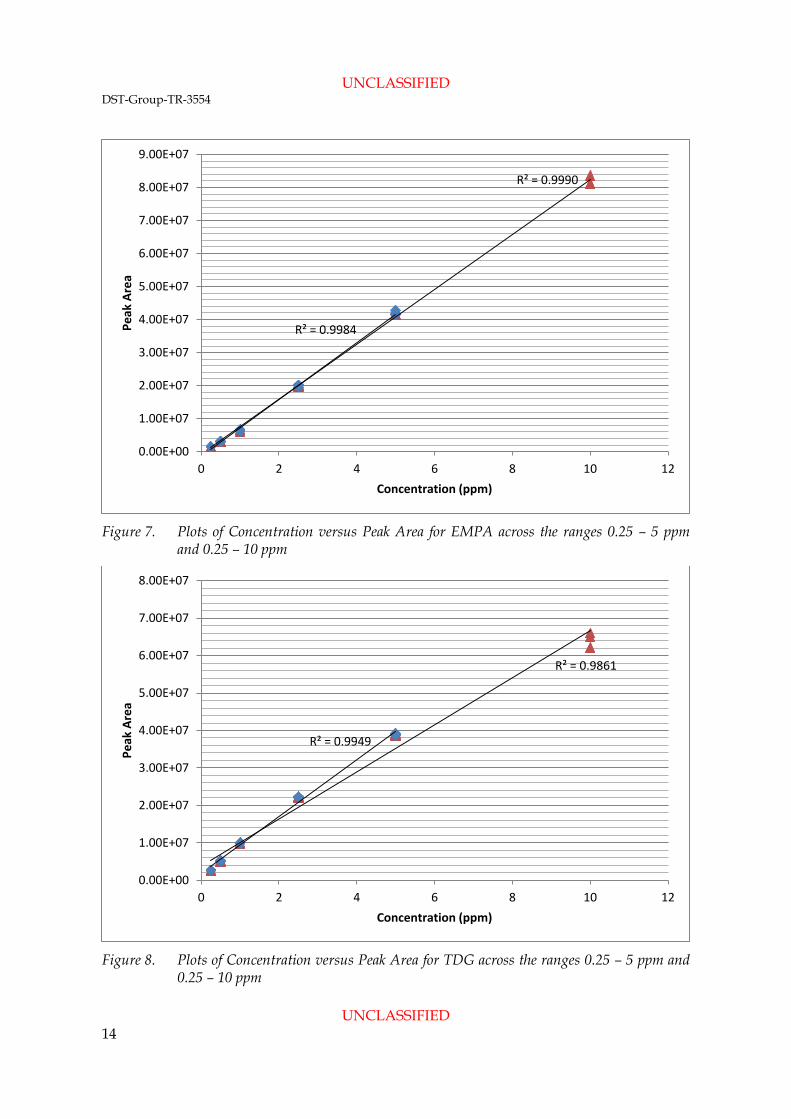
EMPA 125 1.423 ± 0.180 0.9984 0.9990 0.229 < 0.25
TDG 105 3.183 ± 0.058 0.9949 0.9861 0.412 < 0.25
N-Me DEA 120 0.789 ± 0.005 0.9951* 0.201 < 0.25 * Note that N-Me DEA was only linear in the range 0.25 – 2.5 ppm
3.1. Linearity
In the above table, the linear ranges proposed are those which had a correlation coefficient (R2) value of greater than 0.95. Though a quantitative method would typically require R2 values of at least 0.99, this method is for qualitative purposes only, and the analysis was carried out without an internal standard to correct for experimental variation. Therefore, an R2 value of greater than 0.95 is fit-for-purpose in this instance. All compounds analysed showed acceptable linearity over the range 0.25 to 10 ppm, except for N-Me DEA, which was only linear to an acceptable level up to 2.5 ppm, without correction by an internal standard. This is possibly a result of changing ionic dynamics as the concentration increases.
UNCLASSIFIED 4

UNCLASSIFIED DST-Group-TR-3554
3.2. Limit of Detection
Despite most compounds showing acceptable linearity for the whole concentration range assessed, the LOD calculations were only performed on the lower half of the curve, from 0.25 to 5 ppm, as the results obtained focusing on this range were more representative of what the LOD would be based on the S/N values observed. Calculation of the LOD from the calibration curves was performed using LOD = 3 x (standard error of the curve/slope of the curve). Contrastingly, estimation of the LOD from S/N was achieved based on the principle that the LOD is the point where the S/N for a chromatographic peak is equal to three. Average S/N values are displayed in Table 3 below. From the S/N, given an average S/N of 4.0 for MPA at 0.5 ppm, the LOD is approximately equal to 0.5 ppm. Though, a peak was detected in two out of three of the 0.25 ppm samples of MPA, these peaks had a S/N of less than three, and are by definition below the LOD. When calculated from the curve, the LOD for MPA is 0.680 ppm, which is comparable. Similarly, for IMPA, the S/N at 0.25 ppm is only 6.0, indicating that the LOD is close to, but slightly less than, 0.25 ppm, which is in agreement with the calculated LOD of 0.225 ppm based on the curve. CMPA has a S/N of 11.6 at 0.5 ppm, but was not detected at 0.25 ppm, so its LOD would be in the range 0.25 to 0.5 ppm. Again, the LOD calculated from the curve sits in this range at 0.483 ppm. The S/N at 0.25 ppm for EDMAP, PMPA, EPA, EMPA, TDG and N-Me DEA is significantly greater than three, indicating that the LOD for these compounds would be below 0.25 ppm. Although the curve calculated LODs for EPA, EMPA, and N-Me DEA are all in agreement with this, those for EDMAP, PMPA, and TDG are all greater than 0.25 ppm, while remaining under the 1 ppm threshold. The reasons for this could include the inclusion of a higher concentration point at 5 ppm, which may skew the trendline slightly at lower concentrations, whilst the fact that trendlines assume a constant error across the data set could also lead to overestimation of the LOD.
3.3. Limit of Reporting (based on OPCW criteria)
Another important aspect relating to S/N is that for OPCW reporting purposes, chromatographic peaks reported must have a S/N of greater than five. Based on the S/N values in Table 3, this limit of reporting (LOR) is in most cases satisfied for all compounds at the same concentration level examined for which the requirement for LOD is met, except for MPA. In this instance, as the S/N at 0.5 ppm is 4.0, this is approximately at or slightly above the LOD, whilst the LOR, requiring a S/N of greater than five, would be between 0.5 and 1 ppm, with 1 ppm the first concentration level of those assessed to satisfy this criterion. Regardless, MPA remains detectable at reportable levels of at least 1 ppm.
3.4. Repeatability
Variability of the error in instrument response is demonstrated in Table 4, which depicts the average area peak area for each compound at each concentration level, with percent relative standard deviation (%RSD) included. While the %RSD for N-Me DEA across all concentration levels falls in a narrow range of 0.3 to 2.0%, the %RSD for CMPA ranges from 0.8 to 12.2%, showing that there can be significant variation in error across a curve.
UNCLASSIFIED 5

UNCLASSIFIED DST-Group-TR-3554
Despite this, all concentration levels for the majority of compounds were found to have %RSD of less than 10%, except for CMPA, for which all concentration levels had a %RSD below 15%. These results demonstrate a satisfactory level of repeatability.
OPCW reporting also requires that retention time of the chemical peak be with ±0.2 min of the corresponding peak of the reference chemical run under similar conditions. Therefore, the repeatability of the retention time was also assessed, with the average retention time and its standard deviation (SD) shown in Table 2 above. All compounds were found to have retention times with a SD of less than ±0.2 min, and were thus repeatable according to OPCW standards.
Table 3. Average S/N of CWA hydrolysis products at various concentration levels
Compound Average S/N (# /3 with S/N > 3)
0.25 ppm 0.5 ppm 1 ppm 2.5 ppm 5 ppm 10 ppm
MPA 1.6 (0) 4.0 (3)c 8.9 (3) 48.2 (2) b 130.0 (3) 327.3 (3)
EDMAP 54.9 (2)b 95.1 (3) 156.4 (3) 138.1 (2) b 157.6 (3) 108.3 (3)
IMPA 6.0 (3) 17.5 (3) 54.5 (3) 153.8 (3) 305.6 (3) 684.2 (3)
PMPA 34.1 (3) 143.7 (3) 676.9 (3) 4434.1 (3) 9151.6 (3) 16738.7 (3)
EPA 15.3 (3) 27.8 (3) 42.9 (3) 85.0 (3) 135.5 (3) 158.3 (3)
CMPA N/A (0) 11.6 (3) 51.4 (3) 322.1 (3) 883.3 (3) 2242.2 (3)
EMPA 19.3 (3) 35.9 (3) 70.3 (3) 98.4 (3) 119.4 (3) 403.9 (3)
TDG 12.7 (3) 22.2 (2) b 39.9 (3) 82.7 (3) 117.9 (3) 172.0 (3)
N-Me DEA 284.9 (3) 284.9 (3) 282.7 (3) 279.8 (3) 330.3 (3) 284.1 (3) b Note that for these samples, one point was eliminated as irregular, so the maximum number of replicates was two. Hence 2/2 samples exceeded S/N of 3. c Note that though the LOD was satisfied at 0.5 ppm for MPA, the LOR was not satisfied until 1 ppm.
UNCLASSIFIED 6

UNCLASSIFIED DST-Group-TR-3554
Table 4. Average instrument response for CWA hydrolysis products at various concentration levels
Compound Average Peak Area ± %RSD
0.25 ppm 0.5 ppm 1 ppm 2.5 ppm 5 ppm 10 ppm
MPA 2.633x10⁵ ± 6.2%
5.596x10⁵ ± 3.0%
1.455x10⁶ ± 9.5%
6.104x10⁶ ± 6.2%
1.052x10⁷ ± 3.4%
2.450x10⁷
± 5.4%
EDMAP 2.886x10⁶
± 2.3% 5.846x10⁶
± 3.3% 1.096x10⁷
± 3.6% 2.977x10⁷ ± 1.1%
4.928x10⁷ ± 0.9%
7.899x10⁷ ± 3.4%
IMPA 4.615x10⁵
± 5.2% 1.393x10⁶
± 4.5% 4.082x10⁶ ± 4.2%
1.195x10⁷ ± 0.5%
2.346x10⁷ ± 2.2%
4.471x10⁷ ± 0.4%
PMPA 4.944x10⁵ ± 1.5%
1.917x10⁶ ± 3.6%
9.885x10⁶ ± 5.2%
4.605x10⁷ ± 2.0%
1.013x10⁸ ± 3.1%
1.956x10⁸ ± 2.0%
EPA 2.051x10⁶ ± 6.0%
4.606x10⁶ ± 2.8%
1.007x10⁷ ± 1.5%
2.813x10⁷ ± 3.0%
5.845x10⁷ ± 2.1%
1.060x10⁸ ± 3.0%
CMPA N/A 2.728x10⁵ ± 12.2%
1.253x10⁶ ± 8.6%
7.533x10⁶
± 10.8% 1.908x10⁷
± 0.4% 4.301x10⁷
± 0.8%
EMPA 1.487x10⁶ ± 4.2%
3.036x10⁶ ± 0.4%
6.412x10⁶ ± 5.2%
1.992x10⁷ ± 1.8%
4.190x10⁷ ± 1.9%
8.190x10⁷ ± 1.8%
TDG 2.651x10⁶ ± 5.6%
5.134x10⁶ ± 3.3%
9.910x10⁶ ± 1.8%
2.220x10⁷ ± 0.5%
3.891x10⁷ ± 0.7%
6.440x10⁷ ± 3.1%
N-Me DEA 3.751x10⁷ ± 2.0%
5.813x10⁷ ± 0.7%
9.443x10⁷ ± 1.2%
1.811x10⁸ ± 1.4%
2.637x10⁸ ± 1.6%
3.553x10⁸ ± 0.3%
UNCLASSIFIED 7

UNCLASSIFIED DST-Group-TR-3554
4. Conclusion
Overall, it was confirmed that the full-scan method developed on the LC-MS is fit-for-purpose for reporting in OPCW proficiency testing, with all compounds assessed as detectable and reportable below the requisite 1 ppm threshold, and with retention times and instrument response satisfactorily repeatable. Furthermore, eight of the nine compounds also showed a high degree of linearity over the 0 to 10 ppm range, with N-Me DEA the exception, which was only linear to 2.5 ppm. As a result, the method was able to be successfully employed in the reporting of spiked chemicals in the 43rd Official OPCW Proficiency Test.
5. References
1. OPCW Designated Laboratories. https://www.opcw.org/our-work/non-proliferation/designated-laboratories/ (accessed August 2018).
2. Konopski, L.; Liu, P.; Wuryani, W.; Śliwakowski, M., OPCW Proficiency Test: A Practical Approach Also for Interlaboratory Test on Detection and Identification of Pesticides in Environmental Matrices. The Scientific World Journal 2014, 2014, 542357.
UNCLASSIFIED 8
UNCLASSIFIED DST-Group-TR-3554
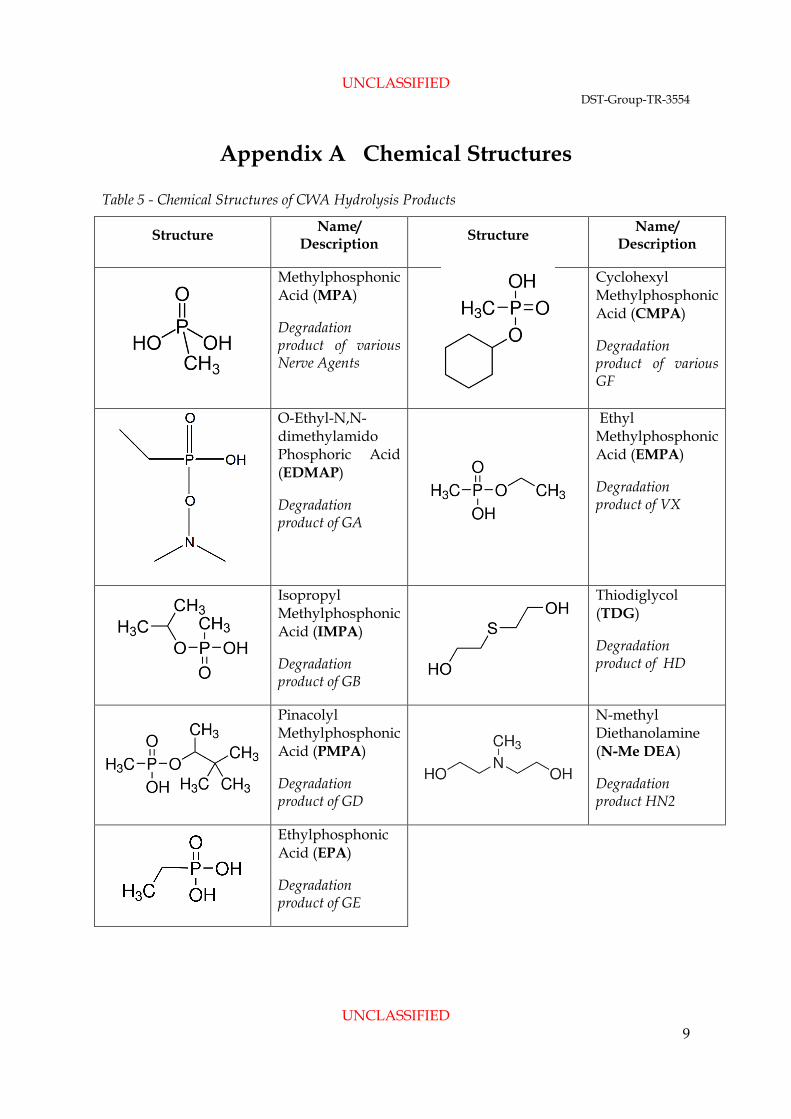
Appendix A Chemical Structures
Table 5 - Chemical Structures of CWA Hydrolysis Products
Structure Name/ Description Structure Name/
Description
Methylphosphonic Acid (MPA)
Degradation product of various Nerve Agents
Cyclohexyl Methylphosphonic Acid (CMPA)
Degradation product of various GF
O-Ethyl-N,N-dimethylamido Phosphoric Acid (EDMAP)
Degradation product of GA
Ethyl Methylphosphonic Acid (EMPA)
Degradation product of VX
Isopropyl Methylphosphonic Acid (IMPA)
Degradation product of GB
Thiodiglycol (TDG)
Degradation product of HD
Pinacolyl Methylphosphonic Acid (PMPA)
Degradation product of GD
N-methyl Diethanolamine (N-Me DEA)
Degradation product HN2
Ethylphosphonic Acid (EPA)
Degradation product of GE
UNCLASSIFIED 9

UNCLASSIFIED DST-Group-TR-3554
This page is intentionally blank.
UNCLASSIFIED 10

UNCLASSIFIED DST-Group-TR-3554
Appendix B Calibration Curves
Figure 1. Plots of Concentration versus Peak Area for MPA across the ranges 0.25 – 5 ppm and
0.25 – 10 ppm
Figure 2. Plots of Concentration versus Peak Area for EDMAP across the ranges 0.25 – 5 ppm
and 0.25 – 10 ppm
R² = 0.9923
R² = 0.9871
-5.00E+06
0.00E+00
5.00E+06
1.00E+07
1.50E+07
2.00E+07
2.50E+07
3.00E+07
0 2 4 6 8 10 12
Peak
Are
a
Concentration (ppm)
R² = 0.9786
R² = 0.9911
0.00E+00
1.00E+07
2.00E+07
3.00E+07
4.00E+07
5.00E+07
6.00E+07
7.00E+07
8.00E+07
9.00E+07
0 2 4 6 8 10 12
Peak
Are
a
Concentration (ppm)
UNCLASSIFIED 11
UNCLASSIFIED DST-Group-TR-3554
Figure 3. Plots of Concentration versus Peak Area for IMPA across the ranges 0.25 – 5 ppm and
0.25 – 10 ppm
Figure 4. Plots of Concentration versus Peak Area for PMPA across the ranges 0.25 – 5 ppm
and 0.25 – 10 ppm
R² = 0.9981
R² = 0.9984
0.00E+00
5.00E+06
1.00E+07
1.50E+07
2.00E+07
2.50E+07
3.00E+07
3.50E+07
4.00E+07
4.50E+07
5.00E+07
0 2 4 6 8 10 12
Peak
Are
a
Concentration (ppm)
R² = 0.9973
R² = 0.9956
-5.00E+07
0.00E+00
5.00E+07
1.00E+08
1.50E+08
2.00E+08
2.50E+08
0 2 4 6 8 10 12
Peak
Are
a
Concentration (ppm)
UNCLASSIFIED 12
UNCLASSIFIED DST-Group-TR-3554
Figure 5. Plots of Concentration versus Peak Area for EPA across the ranges 0.25 – 5 ppm and
0.25 – 10 ppm
Figure 6. Plots of Concentration versus Peak Area for CMPA across the ranges 0.25 – 5 ppm
and 0.25 – 10 ppm
R² = 0.9959
R² = 0.9991
0.00E+00
2.00E+07
4.00E+07
6.00E+07
8.00E+07
1.00E+08
1.20E+08
0 2 4 6 8 10 12
Peak
Are
a
Concentration (ppm)
R² = 0.9976
R² = 0.9930
-5.00E+06
0.00E+00
5.00E+06
1.00E+07
1.50E+07
2.00E+07
2.50E+07
3.00E+07
3.50E+07
4.00E+07
4.50E+07
5.00E+07
0 2 4 6 8 10 12
Peak
Are
a
Concentration (ppm)
UNCLASSIFIED 13
UNCLASSIFIED DST-Group-TR-3554
Figure 7. Plots of Concentration versus Peak Area for EMPA across the ranges 0.25 – 5 ppm
and 0.25 – 10 ppm
Figure 8. Plots of Concentration versus Peak Area for TDG across the ranges 0.25 – 5 ppm and
0.25 – 10 ppm
R² = 0.9990
R² = 0.9984
0.00E+00
1.00E+07
2.00E+07
3.00E+07
4.00E+07
5.00E+07
6.00E+07
7.00E+07
8.00E+07
9.00E+07
0 2 4 6 8 10 12
Peak
Are
a
Concentration (ppm)
R² = 0.9861
R² = 0.9949
0.00E+00
1.00E+07
2.00E+07
3.00E+07
4.00E+07
5.00E+07
6.00E+07
7.00E+07
8.00E+07
0 2 4 6 8 10 12
Peak
Are
a
Concentration (ppm)
UNCLASSIFIED 14

UNCLASSIFIED DST-Group-TR-3554
Figure 9. Plot of Concentration versus Peak Area for N-Me DEA in the range 0 – 2.5 ppm
R² = 0.9951
0.00E+00
2.00E+07
4.00E+07
6.00E+07
8.00E+07
1.00E+08
1.20E+08
1.40E+08
1.60E+08
1.80E+08
2.00E+08
0 0.5 1 1.5 2 2.5 3
Peak
Are
a
Concentration (ppm)
UNCLASSIFIED 15
DEFENCE SCIENCE AND TECHNOLOGY GROUP DOCUMENT CONTROL DATA
1. DLM/CAVEAT (OF DOCUMENT)
2. TITLE
Verification of LC-MS Method Suitability for Application to OPCW Proficiency Testing
3. SECURITY CLASSIFICATION (FOR UNCLASSIFIED LIMITED RELEASE USE (U/L) NEXT TO DOCUMENT CLASSIFICATION)
Document (U) Title (U) Abstract (U)
4. AUTHOR(S)
Candace Greer
5. CORPORATE AUTHOR
Defence Science and Technology Group 506 Lorimer Street Fishermans Bend VIC 3207
6a. DST GROUP NUMBER
DST-Group-TR-3554
6b. TYPE OF REPORT
Technical Note
7. DOCUMENT DATE
November 2018
8.TASK NUMBER
N/A
9.TASK SPONSOR
N/A
10. RESEARCH DIVISION
Land Division
11. MSTC
CB Defence
12. STC
Assessment of Highly Toxic Chemicals
13. SECONDARY RELEASE STATEMENT OF THIS DOCUMENT
Approved for public release. OVERSEAS ENQUIRIES OUTSIDE STATED LIMITATIONS SHOULD BE REFERRED THROUGH DOCUMENT EXCHANGE, PO BOX 1500, EDINBURGH, SA 5111
14. DELIBERATE ANNOUNCEMENT
No limitations 15. CITATION IN OTHER DOCUMENTS
Yes 16. RESEARCH LIBRARY THESAURUS
Verification; Chemical analysis; Chemical agents 17. ABSTRACT
Defence Science and Technology (DST) Group is working towards becoming a designated laboratory for the Organisation for the Prohibition of Chemical Weapons (OPCW), and thus participates in its proficiency testing program. DST has typically relied on a combination of data from Gas Chromatography-Mass Spectrometry with Electron Impact (GC-MS[EI]) and Gas Chromatography-Mass Spectrometry with Chemical Ionisation (GC-MS[CI]) for reporting purposes, however it has recently implemented a Liquid Chromatography-Mass Spectrometry (LC-MS) method as a third technique to provide additional information where required. Given that samples received as part of the program may be spiked with compounds at concentrations as low as 1 ppm, this document reports the work undertaken in ascertaining that the limit of detection (LOD) of the LC-MS method is below this threshold, and that the method is overall fit for application in OPCW proficiency tests. The results of the work demonstrate that for all compounds assessed, the LOD is below 1 ppm and the method is acceptably repeatable so that it may be used for reporting in OPCW proficiency tests.
UNCLASSIFIED
UNCLASSIFIED