verification and validation of the new dynamic mooring ... · simulation results from the...
TRANSCRIPT
NREL is a national laboratory of the U.S. Department of Energy Office of Energy Efficiency & Renewable Energy Operated by the Alliance for Sustainable Energy, LLC
This report is available at no cost from the National Renewable Energy Laboratory (NREL) at www.nrel.gov/publications.
Contract No. DE-AC36-08GO28308
Verification and Validation of the New Dynamic Mooring Modules Available in FAST v8 Preprint
Fabian Wendt, Amy Robertson, and Jason Jonkman National Renewable Energy Laboratory
Morten T. Andersen Aalborg University
Presented at the Twenty-sixth (2016) International Ocean and Polar Engineering Conference (ISOPE) Rhodes, Greece June 26‒July 2, 2016
Conference Paper NREL/CP-5000-65822 August 2016

NOTICE
The submitted manuscript has been offered by an employee of the Alliance for Sustainable Energy, LLC (Alliance), a contractor of the US Government under Contract No. DE-AC36-08GO28308. Accordingly, the US Government and Alliance retain a nonexclusive royalty-free license to publish or reproduce the published form of this contribution, or allow others to do so, for US Government purposes.
This report was prepared as an account of work sponsored by an agency of the United States government. Neither the United States government nor any agency thereof, nor any of their employees, makes any warranty, express or implied, or assumes any legal liability or responsibility for the accuracy, completeness, or usefulness of any information, apparatus, product, or process disclosed, or represents that its use would not infringe privately owned rights. Reference herein to any specific commercial product, process, or service by trade name, trademark, manufacturer, or otherwise does not necessarily constitute or imply its endorsement, recommendation, or favoring by the United States government or any agency thereof. The views and opinions of authors expressed herein do not necessarily state or reflect those of the United States government or any agency thereof.
This report is available at no cost from the National Renewable Energy Laboratory (NREL) at www.nrel.gov/publications.
Available electronically at SciTech Connect http:/www.osti.gov/scitech
Available for a processing fee to U.S. Department of Energy and its contractors, in paper, from:
U.S. Department of Energy Office of Scientific and Technical Information P.O. Box 62 Oak Ridge, TN 37831-0062 OSTI http://www.osti.gov Phone: 865.576.8401 Fax: 865.576.5728 Email: [email protected]
Available for sale to the public, in paper, from:
U.S. Department of Commerce National Technical Information Service 5301 Shawnee Road Alexandria, VA 22312 NTIS http://www.ntis.gov Phone: 800.553.6847 or 703.605.6000 Fax: 703.605.6900 Email: [email protected]
Cover Photos by Dennis Schroeder: (left to right) NREL 26173, NREL 18302, NREL 19758, NREL 29642, NREL 19795.
NREL prints on paper that contains recycled content.
1 This report is available at no cost from the National Renewable Energy Laboratory (NREL) at www.nrel.gov/publications.
Verification and Validation of the New Dynamic Mooring Modules Available in FAST v8 Fabian F. Wendt
National Wind Technology Center, National Renewable Energy Laboratory. Golden, CO, USA
Morten T. Andersen Department of Civil Engineering, Aalborg University.
Aalborg, Denmark Amy N. Robertson, Jason M. Jonkman
National Wind Technology Center, National Renewable Energy Laboratory. Golden, CO, USA
ABSTRACT
The open-source, aero-hydro-servo-elastic wind turbine simulation software FAST v8 (created by the National Renewable Energy Laboratory) was recently coupled to two newly developed mooring dynamics modules: MoorDyn and FEAMooring. MoorDyn is a lumped-mass-based mooring dynamics module developed by the University of Maine, and FEAMooring is a finite-element-based mooring dynamics module developed by Texas A&M University. This paper summarizes the work performed to verify and validate these modules compared to other mooring models and measured test data to assess their reliability and accuracy. The quality of the fairlead load predictions by the open-source mooring modules MoorDyn and FEAMooring appears to be largely equivalent to that predicted by the commercial tool OrcaFlex. Both mooring dynamic model predictions agree well with the experimental data considering the given limitations in the accuracy of the platform hydrodynamic load calculation and the quality of the measurement data.
KEY WORDS: Floating offshore wind turbine; mooring dynamics; modeling; verification; validation; FAST; MoorDyn; FEAMooring
INTRODUCTION
The analysis and design of a mooring system in floating offshore wind turbines requires reliable predictions of mooring line loads during a broad spectrum of environmental and operating conditions. Fatigue damage is often an important design driver for mooring systems, which makes the reliable prediction of load amplitudes even more important. Prior to the release of FAST v8.12.00a-bjj (October 6, 2015), the only mooring line module available in FAST was MAP++ (Masciola, Jonkman, and Robertson, 2013). MAP++ is a quasi-static mooring module that considers the average mooring line loads and nonlinear geometric restoring, but it does not consider any dynamics that are important for capturing the mooring line extreme and fatigue loads. Therefore, to improve the predictive capabilities in FAST for mooring line loads, recent development efforts have focused on coupling FAST v8 to two dynamic mooring line modules: MoorDyn and FEAMooring.
The improved predictive accuracy of these modules should allow FAST v8 to be used for effective mooring system design and analysis and thus enhance its use as a tool for the design and analysis of floating offshore wind systems.
This paper presents the two new dynamic mooring line modules that have been coupled to FAST, and it validates their load predictions against 1:50-scale wave tank test data obtained from the 2013 DeepCwind test campaign (Helder and Pietersma, 2013). This campaign was conducted at the Maritime Research Institute Netherlands (MARIN) under the direction of the University of Maine. Simulation results from the commercial maritime engineering software OrcaFlex, which has recently been interfaced to FAST v8, are added to the validation to verify the agreement of FAST’s new dynamic mooring line modules with an established and widely used commercial design software. Further, the comparison of MoorDyn, FEAMooring, and OrcaFlex modeling results to the results obtained with MAP++ show the improvements that can be obtained with the mooring dynamics modeling capability compared to the quasi-static approach. Only wave cases are considered for the validation and verification conducted in this paper (no cases involved a turbine operating in wind).
MOORING CODE DESCRIPTIONS
The following subsections describe the various mooring codes that will be examined in this paper.
MoorDyn
MoorDyn was developed by Matthew Hall at the University of Maine (Hall, 2015). It is based on a lumped-mass modeling approach that is able to capture mooring stiffness, inertia and damping forces in the axial direction, weight and buoyancy effects, seabed contact forces, and hydrodynamic loads from mooring motion using Morison’s equation. Bending and torsional cable stiffness, as well as seabed friction, are not considered. Though not applied here, MoorDyn also allows for modeling segmented cables with multiline connection points (e.g., bridle configurations). MoorDyn has been successfully validated against wave tank test data from a previous 2011 test campaign of the DeepCwind system (Hall and Goupee, 2015).
2 This report is available at no cost from the National Renewable Energy Laboratory (NREL) at www.nrel.gov/publications.
This validation was conducted with a stand-alone version of MoorDyn as well as with a version that was coupled to a previous release of FAST. Presently, there is no direct coupling between MoorDyn and FAST’s HydroDyn module, which means that all hydrodynamic line loads are computed in still-water conditions.
FEAMooring
FEAMooring is a finite-element-based mooring line code that was developed at Texas A&M University by Yoon Hyeok Bae (National Renewable Energy Laboratory, 2015). The utilized rod elements account for axial elastic stretching; axial structural damping; mass/inertia; seabed contact; geometric nonlinearities from large motion; buoyancy; and hydrodynamic drag, added mass, and inertia loads (the latter from Morison’s equation). FEAMooring does not consider line bending or torsion, seabed friction, multisegmented mooring arrangements with line interconnections, clump weights, or buoyancy tanks. As with MoorDyn, wave kinematics are not considered for the calculation of the hydrodynamic line loads, meaning that the hydrodynamic load calculations assume still water. During its development, FEAMooring went through an internal verification at Texas A&M University, but it has not been validated against wave tank test data prior to the work presented in this paper.
MAP++
MAP++ is the previously available quasi-static mooring model available in FAST v8 that was developed by Marco Masciola while both at the National Renewable Energy Laboratory (NREL) and the American Bureau of Shipping (Masciola, Jonkman, and Robertson 2013). It is a relatively simple model that allows for a robust, first-pass evaluation of a mooring system by considering the average mooring line loads and nonlinear geometric restoring for both catenary and taut mooring systems. MAP++ simultaneously solves the nonlinear analytical catenary equations for individual lines with elastic stretching and the apparent weight of the lines in water as well as the force-balance equations at the line-to-line interconnection points (for two or more lines) where clump weights and buoyancy tanks may also be located. MAP++ also accounts for seabed friction. MAP++ does not consider any dynamic line loads (neither structural inertia nor hydrodynamic drag and inertia loads), nor does it consider line-bending stiffness and the three-dimensional shape of lines (each individual line in MAP++ lies within a vertical two-dimensional plane). MAP++ went through a thorough code-to-code verification, which was carried out at NREL as part of the verification of the new hydrodynamic capabilities available in FAST v8 (Wendt et al., 2015). Considering the given limitations of MAP++, we found that the platform motion itself can be predicted quite accurately by the coupled FAST v8-MAP++ modeling approach. Prior to this paper, MAP++ had been validated against wave tank test data on numerous occasions (Prowell et al., 2013; Coulling et al., 2013a; Colling et al., 2013b).
OrcaFlex
OrcaFlex is a comprehensive commercial maritime engineering tool that is widely used for the design and analysis of floating systems in the offshore industry. It contains a proprietary lumped-mass-based mooring line model that has been extensively verified and validated against real-world systems on multiple occasions (Orcina, 2015b). It is capable of computing wave-kinematics-induced cable loads, which are presently not included in MoorDyn and FEAMooring. The mooring modeling capabilities of OrcaFlex are described in Orcina (2015a). OrcaFlex has recently been interfaced to FAST v8 and is considered the benchmark solution in this paper.
PLATFORM AND TURBINE MODEL
Physical Model Tested in Wave Tank
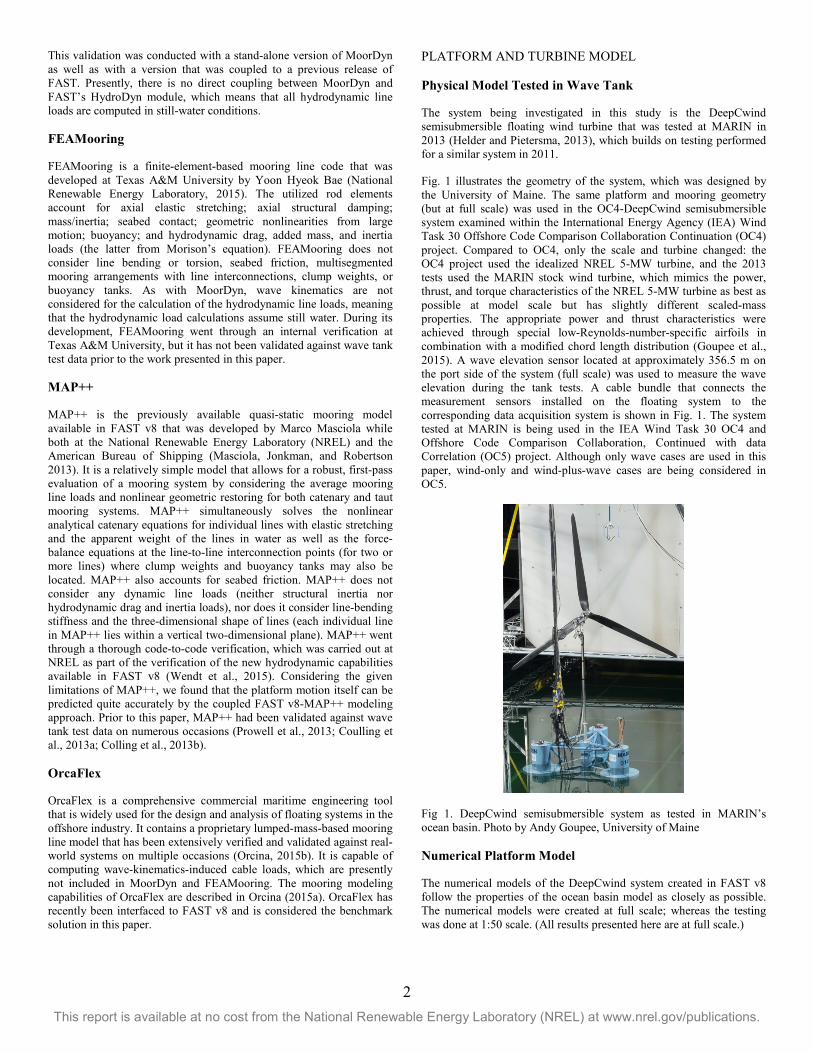
The system being investigated in this study is the DeepCwind semisubmersible floating wind turbine that was tested at MARIN in 2013 (Helder and Pietersma, 2013), which builds on testing performed for a similar system in 2011.
Fig. 1 illustrates the geometry of the system, which was designed by the University of Maine. The same platform and mooring geometry (but at full scale) was used in the OC4-DeepCwind semisubmersible system examined within the International Energy Agency (IEA) Wind Task 30 Offshore Code Comparison Collaboration Continuation (OC4) project. Compared to OC4, only the scale and turbine changed: the OC4 project used the idealized NREL 5-MW turbine, and the 2013 tests used the MARIN stock wind turbine, which mimics the power, thrust, and torque characteristics of the NREL 5-MW turbine as best as possible at model scale but has slightly different scaled-mass properties. The appropriate power and thrust characteristics were achieved through special low-Reynolds-number-specific airfoils in combination with a modified chord length distribution (Goupee et al., 2015). A wave elevation sensor located at approximately 356.5 m on the port side of the system (full scale) was used to measure the wave elevation during the tank tests. A cable bundle that connects the measurement sensors installed on the floating system to the corresponding data acquisition system is shown in Fig. 1. The system tested at MARIN is being used in the IEA Wind Task 30 OC4 and Offshore Code Comparison Collaboration, Continued with data Correlation (OC5) project. Although only wave cases are used in this paper, wind-only and wind-plus-wave cases are being considered in OC5.
Fig 1. DeepCwind semisubmersible system as tested in MARIN’s ocean basin. Photo by Andy Goupee, University of Maine
Numerical Platform Model
The numerical models of the DeepCwind system created in FAST v8 follow the properties of the ocean basin model as closely as possible. The numerical models were created at full scale; whereas the testing was done at 1:50 scale. (All results presented here are at full scale.)

3 This report is available at no cost from the National Renewable Energy Laboratory (NREL) at www.nrel.gov/publications.
The hydrodynamic platform model uses a hybrid combination of a potential-flow-based approach with additional viscous drag computed for all submerged members via FAST’s hydrodynamics module (HydroDyn). The transverse and axial member drag coefficients were tuned using measurements from free-decay tests that were performed and can be found in Table 8 in the mooring section of this paper (the axial drag coefficients were used for the offset base columns). To match the linear damping characteristics of the model during small-amplitude free-decay oscillations, an additional linear damping matrix was included. Two preloads as well as an additional linear stiffness term in the surge direction, acting on the platform reference point (which is the intersection point of the tower-centerline/free surface), were introduced to model the influence of the measurement cable bundle (whose properties were not measured). The preloads were tuned based on the first regular wave test. Further details on the preload tuning for the first regular wave case are given in the validation section of this paper. The additional linear stiffness term was tuned to match the rigid-body surge eigenfrequency. The numerical values for the additional linear damping matrix, the additional stiffness matrix and the additional preloads that have been added to the platform model can be found in the appendix. The potential-flow model is based on frequency-dependent wave diffraction excitation and radiation added mass and damping matrices from WAMIT (2013). The HydroDyn model also considers the second-order sum- and difference-frequency wave-excitation loads derived from quadratic transfer functions, which were also computed via WAMIT. The utilized WAMIT model did not include an evaluation of the free-surface integral, which means that the sum-frequency potential term is only approximated here.
MOORING SYSTEM MODEL
The following section describes the analyzed catenary mooring system and its modeling in the investigated mooring modules.
Mooring System as Implemented in the Wave Tank
The mooring system installed in the 2013 MARIN tests examined here consisted of three equally spaced catenary mooring lines called BOW, PSA, and SBA (Fig. 2). In the ocean basin, waves propagate from the bottom to top of Fig. 2. The same mooring system was also used in the OC4-DeepCwind semisubmersible system (Robertson et al., 2014). Unlike many oil- and gas-related deepwater platform wave tank tests, where catenary mooring systems are modeled through truncated mooring configurations, the mooring system in MARIN’s ocean basin was actually implemented in its full catenary configuration with significant portions of the lines resting on the seabed. Brass chains were used to ensure the correct underwater weight of the mooring lines. The mooring line loads were recorded through small load cells at the fairleads, and a small spring at the anchor point was introduced to ensure the correct axial stiffness of the mooring system during larger displacements (Helder and Pietersma, 2013). According to MARIN and visible in the test results, some level of hysteresis was present in the mooring system during the tests. This means that the displaced system does not necessarily return to its exact initial position. This hysteresis makes it difficult to assess the surge and sway position measurements because there is a certain level of uncertainty related to the corresponding equilibrium position.
The full-scale mooring line properties as described by MARIN are given in the upcoming table and figure. The three fairleads are equally spaced on a 40.87-m radius around the center of the platform and connect to the platform 20 m below the still-water line. The anchor points are based on a 837.6-m radius and are located at a water depth of 200 m.
Table 1. Mooring system properties as described by MARIN (Helder and Pietersma, 2013)
Fig. 2. Mooring system as installed (Helder and Pietersma, 2013)
Mooring System as Implemented in MAP++
The specifics of the mooring system geometry (anchor and fairlead positions and line length) used in MAP++ fall in line with what was described by MARIN in the previous section. The line diameter was calculated from the data given in Table 1, and the average value of all three mooring lines was assigned to each line in the MAP++ model. A similar approach was used for the cross-sectional axial line stiffness. The line properties that were used for all three lines in MAP++ are summarized in Table 2.
Table 2. MAP++-specific mooring system properties
Property Assigned Value Line diameter (m) 0.1389 Mass density per unit length in air (kg/m)
125.5935
Axial cross-sectional line stiffness (N)
748,608,000
Unstretched line length (m)
835.5

4 This report is available at no cost from the National Renewable Energy Laboratory (NREL) at www.nrel.gov/publications.
Mooring System as Implemented in MoorDyn
The MoorDyn model basically follows what was specified for the corresponding MAP++ model, but because of MoorDyn’s lumped-mass-based dynamic modeling approach, several additional parameters needed to be specified. The most important parameters are given in the following table.
Table 3. MoorDyn-specific mooring system properties
Property Assigned Value Internal, structural line damping coefficient (% critical)
5
Transverse added-mass coefficient (-) 0.865 Tangential added-mass coefficient (-) 0.269 Transverse drag coefficient (-) 1.404 Tangential drag coefficient (-) 0.213 Number of line segments (-) 20
The transverse and tangential hydrodynamic coefficients were based on values described for a previous MoorDyn validation project that was also based on the DeepCwind semisubmersible system (Hall and Goupee, 2015). In this previous validation project, the hydrodynamic coefficients were derived from the recommendations given in the corresponding DNV guidelines (DNV, 2013; DNV, 2007; DNV, 2004). The drag coefficients were prescribed considering the 1:50 scale of the model. The transverse drag coefficient has been increased from its initial value of 1.08, as described in Hall and Goupee (2015), to a value of 1.404. This was done to match the fairlead load amplitude predicted by MoorDyn to the corresponding fairlead load amplitude observed in the MARIN test data during the first regular wave test. The chosen line discretization of 20 subsegments for each line was based on a convergence study of the fairlead load signal.
Mooring System as Implemented in FEAMooring
Although the FEAMooring input parameters vary significantly from those used in MAP++ and MoorDyn, the parameters were set to be consistent with the equivalent input parameters in MAP++ and MoorDyn. The FEAMooring-specific parameters that were used are shown in the table below.
Table 4. FEAMooring-specific mooring system properties
Property Assigned Value Displaced mass per unit length (kg/m)
15.484
Inertia force per unit length normalized by acceleration (kg/m)
28.877
Drag force per unit length normalized by velocity squared (kg/m^2)
99.791
Initial fairlead tension (N) 5E+04
The displaced mass per unit length (LD) in FEAMooring is related to the line diameter used in MAP++/MoorDyn:
2 / 4line waterLD dπ r= ⋅ ⋅ (1)
where lined is the diameter of the mooring line, and waterr is the density of the water in the wave tank (1,025 kg/m^3).
The inertia force per unit length normalized by acceleration (LCI) in FEAMooring is related to the line diameter and transverse added-mass coefficient used in MoorDyn:
2 / 4water i lineLCI C dr π= ⋅ ⋅ ⋅ (2)
where iC is the transverse mooring line inertia coefficient, which is
calculated as 1i atC C= + ; and the value for the transverse added-
mass coefficient atC is given in Table 3. The drag force per unit length normalized by velocity squared (LCD) is related to the line diameter and the transverse drag coefficient used in MoorDyn:
/ 2water dt lineLCD C dr= ⋅ ⋅ (3)
The value for the transverse mooring line drag coefficient dtC is given in Table 3.
The initial fairlead tension and the line length affect the axial deformation of the line elements in FEAMooring (especially important for tension-leg platforms). For ease of use with catenary moorings, where it is desirable to set the line length equal to the unstretched length, we found that doing so required setting a small pretension to avoid numerical problems in FEAMooring. The selected pretension equals approximately 4% of the mean fairlead load of the mooring lines. An alternative approach would be to set the initial fairlead tension (in the vertical direction) based on the difference between the platform buoyancy and floating wind system weight and consequently define the line length as the corresponding stretched line length. Both approaches were found to produce similar results.
Following the MoorDyn model, each line has been discretized into 20 subelements. Increasing the number of elements was not found to have a significant impact on the fairlead load signal.
Mooring System as Implemented in OrcaFlex
The OrcaFlex mooring system model is based on the MoorDyn mooring model discussed previously. The hydrodynamic coefficients specified for MoorDyn are also used in the OrcaFlex model, so carrying over the line properties and mooring system properties to OrcaFlex was a straightforward process. Each line has been discretized into 20 subsegments.
VALIDATION OF GLOBAL PROPERTIES
Force-Displacement Curve
The first step to validate the numerical mooring models was a comparison of the simulated versus measured force-displacement curve. This static analysis produced the same fairlead loads for all mooring line modules, which is why only the MAP++ results are shown in the following figure.

5 This report is available at no cost from the National Renewable Energy Laboratory (NREL) at www.nrel.gov/publications.
Fig. 3. Force-displacement curve validation
The simulation results for the static offset analysis shown in Fig. 3 agree well with the corresponding experimental results and capture the nonlinear geometric restoring for large platform surge offsets. The force displacement curve in Fig. 3 shows the total restoring force in the x-direction (sum of all three fairlead load x-components).
In these results and the results to follow, positive surge is defined upward in Fig. 2, positive sway is defined to the left in Fig. 2, and positive heave is defined opposite gravity. Positive roll, pitch, and yaw are rotations about the positive surge, sway, and heave directions, respectively.
Free-Decay-Based Damping and Frequency Analysis
In a second step, the damping and frequency characteristics of the floating platform were analyzed and compared to the corresponding values measured at MARIN (Table 5–Table 7). All frequency and damping values were derived from free-decay tests. The linear and quadratic damping coefficients (p and q) were computed based on the algorithm described in Helder and Pietersma (2013). No significant differences in the free-decay platform response were found between the two dynamic mooring line modules, which is why only one set of simulated free-decay results are shown, labeled NREL.
Table 5. Natural frequencies of platform rigid-body modes
Surge (Hz)
Sway (Hz)
Heave (Hz)
Roll (Hz)
Pitch (Hz)
Yaw (Hz)
MARIN 0.0094 0.0089 0.0571 0.0305 0.0308 0.0124
NREL 0.0092 0.0088 0.0575 0.0306 0.0301 0.0121
Delta (%) -1.4230 -0.1438 0.8157 0.5512 -1.9953 -2.2144
Table 6. Linear damping of rigid-body modes, p coefficients as defined in (Helder and Pietersma 2013)
Surge (-)
Sway (-)
Heave (-)
Roll (-)
Pitch (-)
Yaw (-)
MARIN 0.1095 0.0795 0.0094 0.0648 0.0579 0.1446
NREL 0.1109 0.0757 0.0090 0.0627 0.0578 0.1406
Delta (%) 1.3409 -4.7078 -3.4392 -3.2366 -0.0556 -2.7306
Table 7. Quadratic damping of rigid-body modes, q coefficients as defined in Helder and Pietersma (2013)
Surge (1/m)
Sway (1/m)
Heave (1/m)
Roll (1/deg)
Pitch (1/deg)
Yaw (1/deg)
MARIN 0.1242 0.1265 0.2733 0.0625 0.0686 0.0165
NREL 0.1198 0.1146 0.2729 0.0707 0.0676 0.0433
Delta (%) -3.4709 -9.3670 -0.1326 13.1207 -1.4166 162.653
The frequencies of the platform rigid-body modes agree very well between the experiment and simulation. The linear damping characteristics show good agreement as well because these values were tuned by prescribing a linear damping matrix in HydroDyn (main-diagonal elements of the linear damping matrix only). The quadratic drag was also tuned by adjusting the transverse and axial member drag coefficients of the platform members (values summarized in Table 8). Although it is unclear why, this tuning process yielded a single-sided axial member drag coefficient of 3.9, which is significantly lower than the double-sided drag coefficient of 4.8 that is oftentimes used to model viscous drag effects of heave plates. This single-sided drag coefficient of 3.9 is only applied to the bottom of the main columns. For this particular study, sway, roll, and yaw motion were not of major concern, which is why the resulting large discrepancies for these degrees of freedom in Table 7 were not addressed.
Table 8. Platform member drag coefficients
Property Assigned Value Transverse member drag coefficient (-)
1.2
Axial member drag coefficient, (applied at the bottom of the three offset base columns) (-)
3.9
VALIDATION OF SYSTEM RESPONSE
Two regular wave cases and two irregular wave cases were used to validate the response of the system to wave excitation. The first regular wave case was used to do some tuning of the system properties (preload and mooring drag coefficient), so only the second regular wave case and the irregular wave cases are strictly validation cases.
Regular Wave Case 1 (Height = 7.37 m, Period = 12.07 s)
The wave train used in the two regular wave simulations was based on the wave elevation signal measured during the experiment. The original wave elevation signal was band-pass filtered to its first-order component, and second-order wave terms were then numerically added to the first-order wave. This is a standard technique that was recently verified to produce reasonable results for regular wave cases within Phase Ib of the IEA Wind Task 30 OC5 project (Robertson et al., forthcoming). The simulation considers second-order sum- and difference-frequency excitation through quadratic transfer functions computed by WAMIT. A comparison between the simulated platform motion and the measured platform response during the experiment for the first regular wave case is shown in Fig. 4‒Fig. 6. OrcaFlex results are not shown in the platform motion plots because the platform motion was externally prescribed for the OrcaFlex simulations. This is explained further at the end of this subsection.

6 This report is available at no cost from the National Renewable Energy Laboratory (NREL) at www.nrel.gov/publications.
Fig. 4. Platform heave motion during regular wave case 1
Fig. 5. Platform surge motion during regular wave case 1
Fig. 6. Platform pitch motion during regular wave case 1
For all mooring modules, the platform motion agrees within reasonable limits with the experimental data. The heave motion is slightly underpredicted by the simulations, whereas the surge motion amplitude is slightly overpredicted. The assessment of the experimental surge mean value has proven to be difficult. The experimental surge mean value varies from one load case to another, which is potentially related
to hysteresis effects in the mooring system or due to inconsistencies in the optical surge position measurement. The initial surge position for this particular test case (prior to the influence of any waves) has been subtracted from the MARIN surge signal shown in Fig. 5. At this point, it is not clear whether the difference in the surge mean between simulation and experiment is related to drift effects that are potentially inaccurately captured by the FAST v8 hydrodynamics model or to measurement/hysteresis-related issues in the experimental data.
The corresponding mooring line loads are shown below. To reduce the number of plots shown in this paper, only one of the two lateral fairlead load signals is shown (SBL) in addition to the upstream fairlead (BOW). Because of the symmetry of the system, both lateral fairlead load signals behave relatively similar.
Fig. 7. BOW fairlead load signal during regular wave case 1
Fig. 8. SBA fairlead load signal during regular wave case 1
Very good agreement was found between the fairlead loads predicted by the simulation and the corresponding experimental data. FEAMooring (FEA) and MoorDyn (MD) basically predict the same fairlead loads. MAP++ (MAP) captures the mean load, but the phase and amplitude of the dynamic load components are very different. The fairlead load amplitudes predicted by MAP are significantly underpredicting the actual fairlead load amplitudes recorded during the experiment (MARIN). As previously mentioned, two preloads acting at
time [s]1590 1600 1610 1620 1630 1640 1650 1660 1670
heav
e [m
]
-1
-0.5
0
0.5
1FEAMAPMDMARIN
time [s]1590 1600 1610 1620 1630 1640 1650 1660 1670
surg
e [m
]
-3
-2
-1
0
1
2
3FEAMAPMDMARIN
time [s]1590 1600 1610 1620 1630 1640 1650 1660 1670
pitc
h [d
eg]
-1
-0.5
0
0.5
1 FEAMAPMDMARIN
time [s]1590 1600 1610 1620 1630 1640 1650 1660 1670
BO
W fa
irlea
d lo
ad [k
N]
800
900
1000
1100
1200
1300
1400
1500FEA
MAP
MD
MARIN
OrcaFlex
time [s]1590 1600 1610 1620 1630 1640 1650 1660 1670
SB
A fa
irlea
d lo
ad [k
N]
950
1000
1050
1100
1150
FEA
MAP
MD
MARIN
OrcaFlex

7 This report is available at no cost from the National Renewable Energy Laboratory (NREL) at www.nrel.gov/publications.
the platform reference point were introduced to the FAST platform model. The purpose of these preloads was to mimic the influence of the measurement cable bundle that was attached to the platform in the wave tank (and whose properties were not measured). The magnitude of these preloads was selected so that the fairlead load mean values for regular wave case 1 match the experimental data. Thus, the mean fairlead load level is captured accurately by all three mooring line modules.
In addition to the simulations performed in FAST, results from OrcaFlex are included here as well. To make the comparison consistent between FAST and OrcaFlex, the platform motion from the FAST v8 + MoorDyn simulation was used as input for OrcaFlex to achieve the exact same platform motion independent of the platform hydrodynamics model. (The new interface between FAST v8 and OrcaFlex was not used here.) This route was chosen due to discrepancies that were evident between FAST v8 coupled to OrcaFlex and FAST v8 standalone. The computation of hydrodynamic platform loads in OrcaFlex has several differences when compared to the approach used in HydroDyn. Because this paper is focused on the mooring system, prescribing the platform motion externally for OrcaFlex was the best option to achieve a direct comparison between OrcaFlex and the other mooring modules, without the need to explain and account for the differences that arise from varying approaches in the hydrodynamic platform load calculation. Because the platform motion was prescribed externally, no wave kinematics or platform hydrodynamics were computed within OrcaFlex. However, a capability that is unique to OrcaFlex (relative to MoorDyn and FEAMooring) is the computation of wave-kinematics-induced hydrodynamic loads on the mooring lines. To evaluate the influence of these load components on the global fairlead load signal, one simulation was run with still water, and an additional simulation was conducted that used the prescribed platform motion from FAST v8 + MoorDyn in combination with the OrcaFlex internal wave kinematics. However, no significant influence from the wave-kinematics-induced hydrodynamic line loads on the overall fairlead load signal was found (Fig. 9).
Fig. 9. Influence of the wave-kinematics-induced hydrodynamic line loads on the BOW fairlead load signal during regular wave case 1
The table below compares the averaged minima, the averaged maxima, and the overall mean values computed during the last 1,000 s of the simulation/experiment from the BOW fairlead load signal.
Table 9. BOW fairlead load statistics for regular wave case 1
FEA MD MAP ORCA MARIN Averaged maxima (kN) 1533.10 1531.08 698.21 1568.43 1553.55
Averaged minima (kN) 856.71 838.24 630.83 823.78 811.92
Mean (kN) 1194.69 1192.60 1199.37 1190.26 1182.63
These statistical metrics fall in line with what was discussed earlier for the time series plots and support the very good agreement among the three dynamic mooring line modules and the experimental data from MARIN.
Regular Wave Case 2 (Height = 9.41 m, Period = 14.3 s)
The sea state prescribed for the second regular wave case is significantly more severe than the first. The corresponding platform motions from the experiment and the simulations are shown below.
Fig. 10. Platform heave motion during regular wave case 2
Fig. 11. Platform surge motion during regular wave case 2
time [s]880 890 900 910 920 930 940
BO
W fa
irlea
d lo
ad [k
N]
800
900
1000
1100
1200
1300
1400
1500OrcaFlex
OrcaFlex with wavestime [s]
1590 1600 1610 1620 1630 1640 1650 1660 1670
heav
e [m
]
-1.5
-1
-0.5
0
0.5
1
1.5 FEAMAPMDMARIN
time [s]1590 1600 1610 1620 1630 1640 1650 1660 1670
surg
e [m
]
-6
-4
-2
0
2
4FEAMAPMDMARIN
8 This report is available at no cost from the National Renewable Energy Laboratory (NREL) at www.nrel.gov/publications.
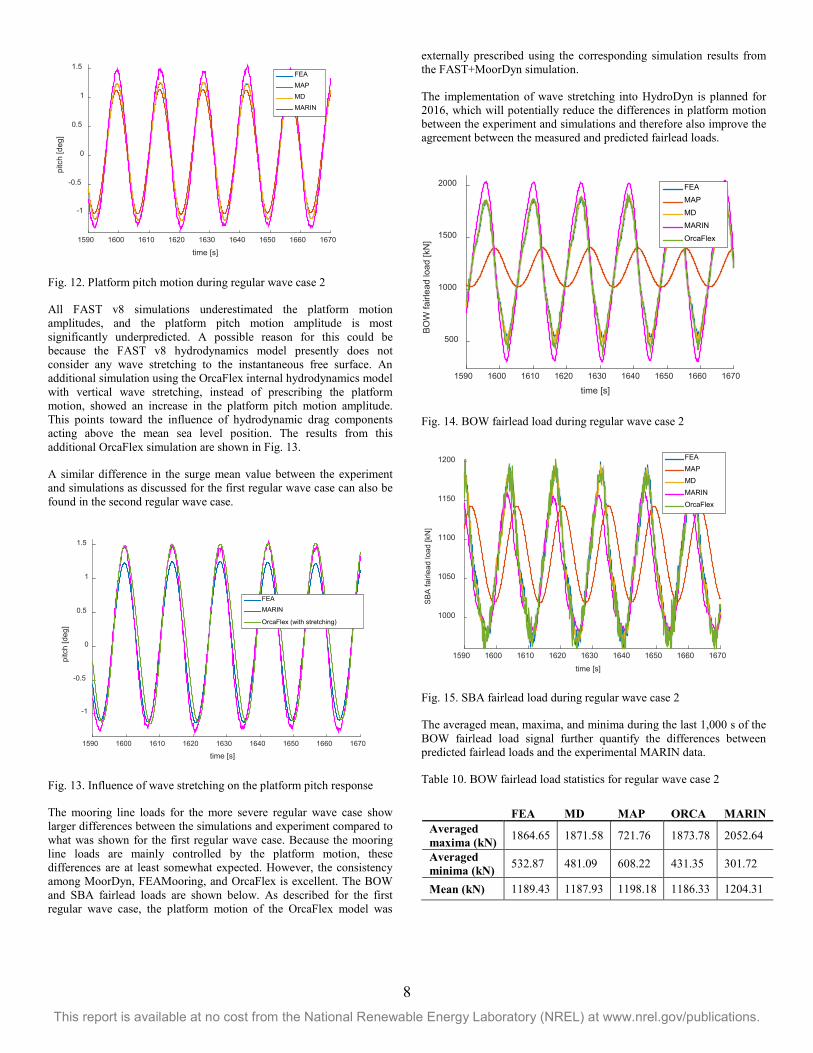
Fig. 12. Platform pitch motion during regular wave case 2
All FAST v8 simulations underestimated the platform motion amplitudes, and the platform pitch motion amplitude is most significantly underpredicted. A possible reason for this could be because the FAST v8 hydrodynamics model presently does not consider any wave stretching to the instantaneous free surface. An additional simulation using the OrcaFlex internal hydrodynamics model with vertical wave stretching, instead of prescribing the platform motion, showed an increase in the platform pitch motion amplitude. This points toward the influence of hydrodynamic drag components acting above the mean sea level position. The results from this additional OrcaFlex simulation are shown in Fig. 13.
A similar difference in the surge mean value between the experiment and simulations as discussed for the first regular wave case can also be found in the second regular wave case.
Fig. 13. Influence of wave stretching on the platform pitch response
The mooring line loads for the more severe regular wave case show larger differences between the simulations and experiment compared to what was shown for the first regular wave case. Because the mooring line loads are mainly controlled by the platform motion, these differences are at least somewhat expected. However, the consistency among MoorDyn, FEAMooring, and OrcaFlex is excellent. The BOW and SBA fairlead loads are shown below. As described for the first regular wave case, the platform motion of the OrcaFlex model was
externally prescribed using the corresponding simulation results from the FAST+MoorDyn simulation.
The implementation of wave stretching into HydroDyn is planned for 2016, which will potentially reduce the differences in platform motion between the experiment and simulations and therefore also improve the agreement between the measured and predicted fairlead loads.
Fig. 14. BOW fairlead load during regular wave case 2
Fig. 15. SBA fairlead load during regular wave case 2
The averaged mean, maxima, and minima during the last 1,000 s of the BOW fairlead load signal further quantify the differences between predicted fairlead loads and the experimental MARIN data.
Table 10. BOW fairlead load statistics for regular wave case 2
FEA MD MAP ORCA MARIN Averaged maxima (kN) 1864.65 1871.58 721.76 1873.78 2052.64
Averaged minima (kN) 532.87 481.09 608.22 431.35 301.72
Mean (kN) 1189.43 1187.93 1198.18 1186.33 1204.31
time [s]1590 1600 1610 1620 1630 1640 1650 1660 1670
pitc
h [d
eg]
-1
-0.5
0
0.5
1
1.5FEAMAPMDMARIN
time [s]1590 1600 1610 1620 1630 1640 1650 1660 1670
pitc
h [d
eg]
-1
-0.5
0
0.5
1
1.5
FEAMARIN
OrcaFlex (with stretching)
time [s]1590 1600 1610 1620 1630 1640 1650 1660 1670
BO
W fa
irlea
d lo
ad [k
N]
500
1000
1500
2000 FEA
MAP
MD
MARIN
OrcaFlex
time [s]
1590 1600 1610 1620 1630 1640 1650 1660 1670
SB
A fa
irlea
d lo
ad [k
N]
1000
1050
1100
1150
1200 FEAMAPMDMARIN
OrcaFlex

9 This report is available at no cost from the National Renewable Energy Laboratory (NREL) at www.nrel.gov/publications.
Irregular Wave Analysis
For the irregular wave case, the wave elevation signal from the experiment was directly used as input for HydroDyn, and no filtering was applied. This approach was found to be favorable for irregular wave cases because it is difficult to adequately reduce an irregular wave elevation to its first-order component. The second-order WAMIT sum- and difference frequency quadratic transfer functions were not used for this case to avoid potentially double-booking the second-order components that are already present in the unfiltered wave elevation signal.
Two irregular wave load cases were simulated. Based on the results shown for the regular wave simulations, the analysis and discussion of the irregular wave results focuses on the load case with the more severe sea state: significant wave height = 10.5 m, peak-spectral wave period = 14.3 s, and peak-shape parameter = 3.0 based on a JONSWAP spectrum. The platform motion for the relevant degrees of freedom is shown in the figures below.
Fig. 16. Platform heave motion during severe irregular waves
Fig. 17. Platform surge motion during severe irregular waves
Fig. 18. Platform pitch motion during severe irregular waves
The predicted platform motions from the simulations follow the overall trend of the actual platform motion that was recorded during the measurement campaign. The differences between the simulations and experiment in the surge and pitch responses are assumed to be mainly related to the platform hydrodynamic load calculation. The FAST v8 simulation uses linear airy wave theory without any wave stretching. Especially for larger waves, nonlinear components in the wave kinematics become more important. These components are not captured by the utilized modeling approach. The same uncertainty regarding the mean value of the surge signal discussed for the regular wave load cases also applies to the irregular wave load cases, which means that the accuracy of the experimental surge mean value is potentially affected by hysteresis effects and artifacts in the optical surge position measurement.
The corresponding fairlead load signals for this severe sea state are shown below. As previously discussed for the regular wave cases, the platform motion in OrcaFlex was externally prescribed, using the results from the FAST+MoorDyn simulation.
Fig. 19. BOW fairlead load during severe irregular waves
time [s]1500 1550 1600 1650 1700 1750 1800
heav
e [m
]
-3
-2
-1
0
1
2
3 FEA
MAP
MD
MARIN
time [s]1500 1550 1600 1650 1700 1750 1800
surg
e [m
]
-8
-6
-4
-2
0
2
4FEAMAPMDMARIN
time [s]1500 1550 1600 1650 1700 1750 1800
pitc
h [d
eg]
-3
-2
-1
0
1
2
3FEAMAPMDMARIN
time [s]1500 1550 1600 1650 1700 1750 1800
BO
W fa
irlea
d lo
ad [k
N]
0
500
1000
1500
2000
2500
3000
FEA
MAP
MD
MARIN
OrcaFlex

10 This report is available at no cost from the National Renewable Energy Laboratory (NREL) at www.nrel.gov/publications.
Fig. 20. SBA fairlead load during severe irregular waves
Considering the differences between the simulations and experiment in the pitch and surge motion, the mooring line loads are captured relatively well for all results, except for MAP, which captures only the means well. The differences between MAP and the dynamic mooring modules do not have a large influence on the resulting platform motions. MoorDyn, FEAMooring, and OrcaFlex also agree very well. Fig. 21 shows an extreme event during which the fairlead load drops to near zero (a slack line event). The successive load recovery predicted by MoorDyn, FEAMooring, and OrcaFlex agrees very well with the experimental data.
Fig. 21. BOW fairlead load during slack line tension events
Applying a rainflow-counting scheme over the BOW fairlead load time series yields the following load cycle mean value and amplitude histograms (Fig. 22–Fig. 23).
Fig. 22. Histogram of BOW fairlead rainflow cycle means
Fig. 23. Histogram of BOW fairlead load rainflow amplitudes
These histograms are useful to assess the capability of the mooring line modules to accurately predict the fatigue load spectra of the fairlead load signals. The two histograms were generated from the last 1,000 s of the BOW fairlead load signal. Because all mooring modules have a certain level of noise in their fairlead load time series output, a low-pass frequency-domain filter with a linearly ramped cutoff from 2.5–3 Hz was applied to all simulation results to reduce the impact of these high-frequency oscillations on the results of the rainflow count.
Based on Fig. 22, the dominant mean value of the fairlead load oscillations is accurately captured by all mooring line modules. The actual number of load cycles per mean value is slightly overpredicted by the OrcaFlex solution and slightly underpredicted by the MoorDyn and FEAMooring solution. The OrcaFlex solution contains the largest amount of high-frequency content around 1 Hz (Fig. 24). In the time domain, this manifests as small amplitude, high-frequency oscillations. These oscillations are responsible for the high number of OrcaFlex low-amplitude rainflow cycles shown in Fig. 23. The increased overall number of oscillations due to this small amplitude/high-frequency content is also clearly evident in Fig. 22, and it is probably related to the prescribed platform motion. OrcaFlex simulations that do not rely on a prescribed platform motion did not show this high-frequency content.
time [s]1180 1190 1200 1210 1220
BO
W fa
irlea
d lo
ad [k
N]
0
500
1000
1500
2000
2500FEA
MAP
MD
MARIN
OrcaFlex
Histogram of "rainflow" cycles mean value [kN]
0 500 1000 1500 2000 2500
Num
ber o
f cyc
les
0
50
100
150
200
250
300
350 FEA
MD
MAP
MARIN
OrcaFlex
Histogram of "rainflow" amplitudes [kN]
0 500 1000 1500
Num
ber o
f cyc
les
10 0
10 1
10 2
10 3 MAP
FEA
MD
MARIN
OrcaFlex

11 This report is available at no cost from the National Renewable Energy Laboratory (NREL) at www.nrel.gov/publications.
Fig. 24. PSD plot of BOW fairlead load signal (log-log scale)
The most extreme load amplitudes measured are not captured by any mooring line module. Though not presented here, the applied low-pass filter was investigated as a potential source for this issue, but it was not shown to have an effect on the number of high-amplitude fatigue cycles. Instead, very nonlinear steep waves were found to produce large surge motion amplitudes in the MARIN data that are not captured in the FAST simulations. One of these events is depicted in Fig. 17 (1,650–1,700 s). These steep waves extend far above the still-water line and introduce significant loads on the substructure. By modeling only the hydrodynamics up to the still-water line, these extreme loads are not accurately captured, which causes an underprediction of the mooring line extreme fatigue load amplitudes. Regardless, the general trend of the number of cycles per load amplitude curve is successfully predicted by all dynamic mooring line modules for the remainder of the load amplitude spectrum, which demonstrates their general usability as tools for the assessment of mooring line fatigue loads.
CONCLUSIONS
Three dynamic mooring line modules and one quasi-static module have been validated against wave tank measurement data (without the turbine operating in wind). The quality of the fairlead load predictions by the open-source mooring modules MoorDyn and FEAMooring appear to be largely equivalent to what is predicted by the commercial tool OrcaFlex. All three mooring dynamic model predictions agree well with the experimental data considering the given limitations in the accuracy of the platform hydrodynamic load calculation and the quality of the measurement data. Although the mean loads and resulting platform motion are satisfactory, the quasi-static mooring module MAP++ was not able to adequately predict the fairlead load amplitudes during the investigated regular and irregular wave cases, as expected.
For the two regular wave cases, especially for the one with the smaller wave height, very good agreement was found between the simulations and the measured fairlead loads. The regular wave case with increased wave height showed modest differences between the simulations and experiment in the platform-surge and -pitch motion amplitudes, which led to differences in the corresponding fairlead load signals. These differences most likely originate from nonlinearities that are not accurately captured by the platform hydrodynamics model.
The analysis of an irregular wave case with severe waves also showed similar differences between the simulations and the experiment. Treating wave kinematics and hydrodynamic loads above the still-water level could potentially improve the simulation results. Besides the fact that a small number of rainflow cycles with large load amplitudes were not captured by the simulations, the fatigue spectrum of the fairlead load signal is sufficiently reproduced by all mooring dynamic modules. Extreme events with near-zero line tension and the following fairlead load recovery were also accurately predicted by all mooring dynamic modules.
The coupling of MoorDyn and FEAMooring to FAST v8 extends the capability of FAST for detailed mooring system design and analysis. Further, all mooring modules are very similar in terms of the required computational expenses, and they are not a major contributor to the required simulation time of FAST v8 floating offshore wind turbine simulations.
ACKNOWLEDGMENTS
This work was supported by the U.S. Department of Energy under Contract No. DE-AC36-08GO28308 with the National Renewable Energy Laboratory. Funding for the work was provided by the DOE Office of Energy Efficiency and Renewable Energy, Wind and Water Power Technologies Office. The authors thank the University of Maine for supplying the MARIN data.
APPENDIX
The tables below state the additional linear damping matrix, platform stiffness matrix, and preloads that have been added to the platform model to mimic the behavior of the model that was tested in the wave tank. For further comments on these parameters, please refer to the numerical platform model section.
Table 11. Additional linear platform damping matrix (N/(m/s), N/(rad/s), N-m/(m/s), N-m/(rad/s))
3.6665E+04 0 0 0 0 0 0 1.6017E+04 0 0 0 0 0 0 1.1802E+04 0 0 0 0 0 0 7.6802E+07 0 0 0 0 0 0 7.1399E+07 0 0 0 0 0 0 6.3425E+07
Table12. Additional platform stiffness matrix (N/m, N/rad, N-m/m, N-m/rad)
5000 0 0 0 0 0 0 7000 0 0 0 0 0 0 0 0 0 0 0 0 0 0 0 0 0 0 0 0 0 0 0 0 0 0 0 0
Table 13. Additional preloads, acting on the platform (N, N-m)
Surge Sway Heave Roll Pitch Yaw 14E4 1E4 0 0 0 0

12 This report is available at no cost from the National Renewable Energy Laboratory (NREL) at www.nrel.gov/publications.
REFERENCES
Coulling, A, Goupee, A, Robertson, A, Jonkman, J, and Dagher, H (2013a). "Validation of a FAST Floating Wind Turbine Model Using Data from the DeepCwind Semi-Submersible Model Tests," Proc. WINDPOWER 2013 Conf and Exhib, Chicago, IL.
Coulling, A, Goupee, A, Robertson, A, Jonkman, J, and Dagher, H (2013b). "Validation of a FAST Semi-Submersible Floating Wind Turbine Numerical Model with DeepCwind Test Data," J Renewable and Sustainable Energy 5, 29-37.
DNV (2013).DNV-OS-E301:Position Moorings, Høvik Norway: DNV. DNV (2007). DNV-RP-C205: Environmental Conditions and
Environmental Loads, Høvik, Norway: Det Norske Veritas. DNV (2004). DNV-RP-F205: Global Performance Analysis of
Deepwater Floating Structures, Høvik, Norway: V. Goupee, A, Kimball, R, Ridder, E, Helder, J, Robertson, A, and
Jonkman, J (2015). "A Calibrated Blade-Element/Momentum Theory Aerodynamic Model of the MARIN Stock Wind Turbine," presented at ISOPE, Kona, HI. NREL/CP-5000-63568. Golden, CO: National Renewable Energy Laboratory.
Hall, M (2015). MoodDyn User's Guide. Orono, ME: Department of Mechanical Engineering, University of Maine.
Hall, M, and Goupee, A (2015). "Validation of a Lumped-Mass Mooring Line Model with DeepCwind Semisubmersible Model Test Data," Ocean Engineering 104: 590-603.
Helder, J, and M Pietersma (2013). UMAINE—DEEPCWIND/OC4 SEMI FLOATING WIND TURBINE, 27005-1-OB. Wageningen, Netherlands: MARIN.
Masciola, M, Jonkman, J, and Robertson, A (2013). "Implementation of a Multisegmented, Quasi-Static Cable Model," Proc Twenty-Third International Offshore and Polar Engineering, Anchorage, AK.
National Renewable Energy Laboratory (2015). NWTC Information Portal (FEAMooring), October 12. https://nwtc.nrel.gov/FEAMooring (accessed Jan. 19, 2016).
Orcina (2015a). OrcaFlex Features. October 22. http://www.orcina.com/SoftwareProducts/OrcaFlex/Features/index.php (accessed January 19, 2016).
Orcina (2015b). OrcaFlex Validation. October 22. http://www.orcina.com/SoftwareProducts/OrcaFlex/Validation/ (accessed Jan. 19, 2016).
Prowell, I, Robertson, A, Jonkman, J, Stewart, G, and Goupee, A (2013). "Numerical Prediction of Experimentally Observed Scale-Model Behavior of an Offshore Wind Turbine Supported by a Tension-Leg Platform," presented at Offshore Technology Conference, Houston, TX. NREL/CP-5000-57615. Golden, CO: National Renewable Energy Laboratory.
Robertson, A, et al. (2014). Definition of the Semisubmersible Floating System for Phase II of OC4. NREL/TP-5000-60601. Golden, CO: National Renewable Energy Laboratory
Robertson, A, et al. (forthcoming). "OC5 Project Phase Ib: Validation of Hydrodynamic Loading on a Fixed, Flexible Cylinder for Offshore Wind Applications," Proc 13th Deep Sea Offshore Wind R&D Conference, Trondheim, Norway.
WAMIT, Inc. (2013). WAMIT User Manual Version 7.0. Chestnut Hill, MA.
Wendt, F, Robertson, A, Jonkman, J, and Hayman, G (2015). "Verification of New Floating Capabilites in FAST v8," Proc AIAA SciTech 2015. Kissimmee, FL: AIAA