veresen announces strong third quarter financial results ...veresen announces strong third quarter...
TRANSCRIPT

Veresen Announces Strong Third Quarter Financial Results and Increased 2016 Guidance CALGARY, Alberta, November 1, 2016 – Veresen Inc. (“Veresen”) (TSX: VSN) today announced its third quarter operating and financial results. “Veresen’s operational and financial performance in each of the first three quarters has continued to exceed expectations and has enabled us to raise guidance for the second time this year,” said Don Althoff, President and CEO of Veresen. “Our underlying business remains strong, and we believe that Veresen Midstream will continue to provide meaningful growth. Importantly, through the expected sale of our power assets and the additional credit facilities secured within Veresen Midstream, our $1.3 billion of growth projects under construction is fully funded and will drive per share growth.” Third Quarter Financial and Operational Highlights
Distributable cash for the quarter of $101 million or $0.33 per Common Share compared to $94 million or $0.30 per Common Share in the second quarter, with Alliance releasing an additional $8 million in distributable cash previously held in trust
Throughput volumes on Alliance remained particularly strong in the third quarter, driven by continuing shipper uptake of seasonal firm and interruptible transportation in response to stronger relative pricing in U.S. Mid-West markets
Total of $271 million ($128 million net to Veresen) in growth capital was invested by Veresen Midstream during the third quarter, including $244 million ($116 million net) for the construction of the Sunrise, Tower and Saturn Phase II processing facilities
Full year 2016 distributable cash guidance increased approximately 6% to a range of $1.12 per Common Share to $1.16 per Common Share to reflect the continued strong performance in the underlying businesses and management’s confidence in sustained momentum through the fourth quarter
Update on Key Strategic Initiatives
In August, Veresen announced its intention to pursue the sale of its power generation business and the suspension of its Premium Dividend™ and Dividend Reinvestment Plan. Proceeds from the divestiture will initially be used to reduce debt outstanding and subsequently used to fund the remaining equity component of projects currently under construction through 2018
In early September, Veresen Midstream secured an additional $650 million of new credit facilities comprised of a new US$150 million Senior Secured Term Loan B, a $405 million increase in the Expansion Facility and an incremental $50 million of capacity within the Revolving Facility. With the expansion of Veresen Midstream’s credit facilities, the balance of the capital requirements within Veresen Midstream are now fully funded
Subsequent to the end of the third quarter, Cutbank Ridge Partnership (“CRP”) and Encana sanctioned approximately $22 million ($11 million net to Veresen) of incremental capital projects, with the continued expectation that additional capital projects will be sanctioned within Veresen Midstream by the end of this year

Financial Overview Three Months Ended
September 30
($ Millions, except per Common Share amounts) 2016 2015
Adjusted net income attributable to Common Shares 21 12
Per Common Share ($) 0.07 0.04
Net income attributable to Common Shares 19 8
Per Common Share ($) 0.06 0.03
Distributable Cash(1)
Pipeline 96 79
Midstream 18 12
Power 10 10
Veresen – Corporate (17) (10)
Taxes - (13)
Preferred Share dividends (6) (6)
Total Distributable Cash 101 72
Per Common Share ($) 0.33 0.25
(1) See the reconciliation of distributable cash to cash from operating activities in tables attached to this news release.
During the third quarter, Veresen generated adjusted net income attributable to Common Shares of $21 million or $0.07 per Common Share, reflecting the strength of the pipeline business and increased contribution from the midstream segment, tempered by higher project development spending to continue the advancement of the Jordan Cove LNG project. Distributable cash for the third quarter was $101 million or $0.33 per Common Share, compared to $72 million or $0.25 per Common Share for the same period last year. This was driven by increases from the pipeline and midstream segments and lower cash taxes. Proportionate Consolidation(1) Three Months Pipelines Midstream Ended September 30 Veresen Aux ($ millions) Alliance(2) Ruby(3) AEGS Midstream Sable Power Corporate Total
EBITDA(4) 74 48 7 17 6 24 (11) 165
Interest (12) (14) (1) (5) (8) (6) (46) Principal Repayment (16) (12) (1) (1) (4) (34) Maintenance Capex (2) (1) (1) (4) Other(5) 15 8 7 (3) (1) (6) 20 Distributable Cash 61 30 5 16 2 10 (23) 101
Long-term Debt 707 715 78 646 6 414 1,068 3,634
Growth Capital(4) 128 6 28 162
(1) This table contains non-GAAP measures. Balances for Veresen’s jointly controlled businesses represent Veresen’s proportional share based on Veresen’s ownership interest, and includes consolidation adjustments. See the reconciliation of distributable cash to cash from operating activities tables attached to this news release.
(2) Approximately 54% of Alliance EBITDA was earned in C$. (3) Ruby EBITDA presented as a 50% proportionate share with benefit of preferred distribution structure reflected in “other”. (4) Presented on incurred basis. Corporate EBITDA and growth capital do not include $26 million of Jordan Cove project
development spending expensed during the quarter. Corporate growth capital includes $26 million of Burstall investment. (5) Alliance “other” includes $8 million of cash previously held in trust. Corporate “other” relates to preferred share dividends.
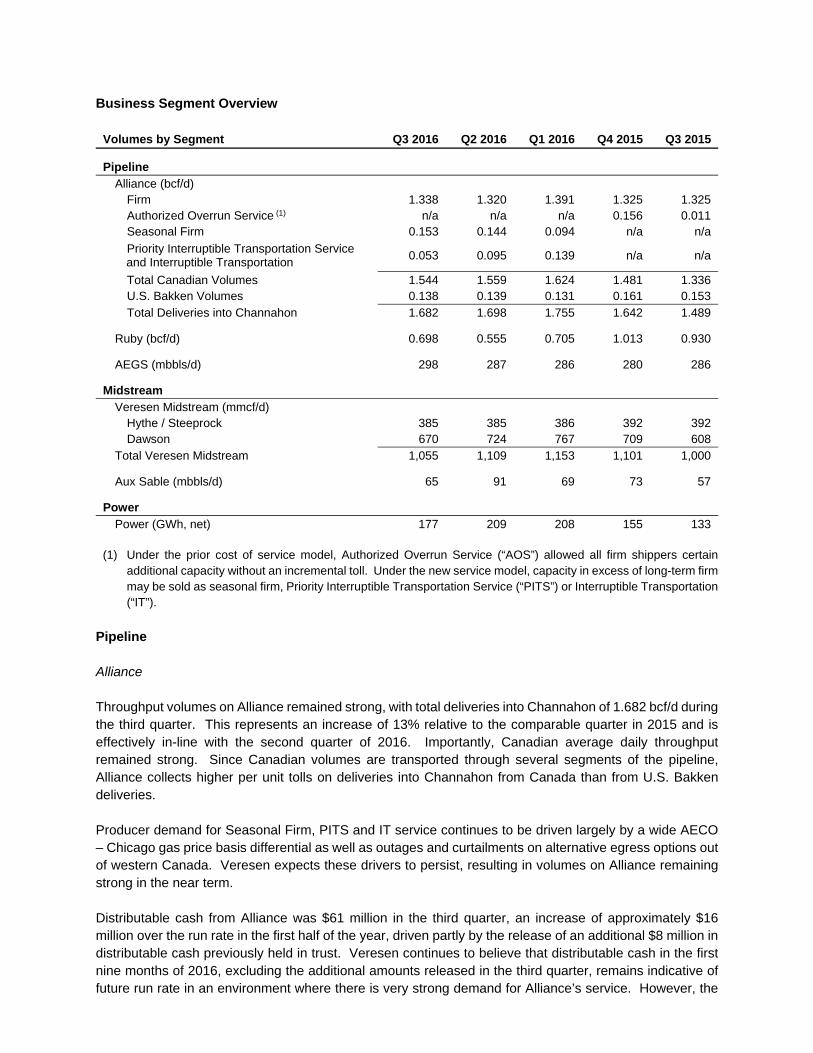
Business Segment Overview
Volumes by Segment Q3 2016 Q2 2016 Q1 2016 Q4 2015 Q3 2015
Pipeline Alliance (bcf/d)
Firm 1.338 1.320 1.391 1.325 1.325 Authorized Overrun Service (1) n/a n/a n/a 0.156 0.011 Seasonal Firm 0.153 0.144 0.094 n/a n/a
Priority Interruptible Transportation Service and Interruptible Transportation
0.053 0.095 0.139 n/a n/a
Total Canadian Volumes 1.544 1.559 1.624 1.481 1.336 U.S. Bakken Volumes 0.138 0.139 0.131 0.161 0.153 Total Deliveries into Channahon 1.682 1.698 1.755 1.642 1.489
Ruby (bcf/d) 0.698 0.555 0.705 1.013 0.930
AEGS (mbbls/d) 298 287 286 280 286
Midstream
Veresen Midstream (mmcf/d)
Hythe / Steeprock 385 385 386 392 392 Dawson 670 724 767 709 608
Total Veresen Midstream 1,055 1,109 1,153 1,101 1,000
Aux Sable (mbbls/d) 65 91 69 73 57
Power Power (GWh, net) 177 209 208 155 133
(1) Under the prior cost of service model, Authorized Overrun Service (“AOS”) allowed all firm shippers certain
additional capacity without an incremental toll. Under the new service model, capacity in excess of long-term firm may be sold as seasonal firm, Priority Interruptible Transportation Service (“PITS”) or Interruptible Transportation (“IT”).
Pipeline Alliance Throughput volumes on Alliance remained strong, with total deliveries into Channahon of 1.682 bcf/d during the third quarter. This represents an increase of 13% relative to the comparable quarter in 2015 and is effectively in-line with the second quarter of 2016. Importantly, Canadian average daily throughput remained strong. Since Canadian volumes are transported through several segments of the pipeline, Alliance collects higher per unit tolls on deliveries into Channahon from Canada than from U.S. Bakken deliveries. Producer demand for Seasonal Firm, PITS and IT service continues to be driven largely by a wide AECO – Chicago gas price basis differential as well as outages and curtailments on alternative egress options out of western Canada. Veresen expects these drivers to persist, resulting in volumes on Alliance remaining strong in the near term. Distributable cash from Alliance was $61 million in the third quarter, an increase of approximately $16 million over the run rate in the first half of the year, driven partly by the release of an additional $8 million in distributable cash previously held in trust. Veresen continues to believe that distributable cash in the first nine months of 2016, excluding the additional amounts released in the third quarter, remains indicative of future run rate in an environment where there is very strong demand for Alliance’s service. However, the

company expects that there will continue to be some degree of variability in quarterly distributable cash due to operational seasonality and cash flow timing. Subsequent to the end of the third quarter, Alliance undertook a planned shut-down to perform certain pipe replacement work to accommodate the construction of a highway near Regina, Saskatchewan. There is no significant financial impact as Alliance will be reimbursed for the costs incurred and revenues forgone as a result of the planned shut-down. Ruby Volumes on Ruby during the third quarter continued to be impacted by low western Canadian natural gas pricing and a weak Canadian dollar, improving AECO’s competitiveness into Malin Hub relative to sourcing from Opal Hub. Volumes of 0.698 bcf/d in the third quarter, represented an increase from the 0.555 bcf/d in the second quarter, but were only about three-quarters of the volumes in the third quarter of 2015. The additional throughput volumes relative to the second quarter were a result of increased seasonal power demand and widening of basis between Opal Hub and Malin Hub. Veresen’s preferred distribution from Ruby provides the company with US$91 million per year, with variance in Veresen’s distributable cash only as a result of fluctuating foreign exchange rates. The company remains confident that Ruby can continue to support its preferred distribution to Veresen. Investment grade shippers on Ruby represent sufficient volumes to meet Veresen’s preferred distribution, with continued debt amortization reducing volumes required for distribution coverage. Weighted average contract length on Ruby is approximately seven years. AEGS Both volumes and distributable cash from AEGS remain very stable. AEGS is a critical part of the infrastructure supporting the petrochemical industry in Alberta, with distributable cash underpinned by long-term take-or-pay contracts. Midstream Veresen Midstream Veresen Midstream’s strong operational performance continued in the third quarter with Veresen Midstream’s facilities running at nearly 100% plant reliability. Volumes at Dawson continued to be impacted by third-party downstream curtailments, including a 16 day planned turnaround in September. Volumes at Hythe / Steeprock were in-line with expectations and included some volumes from third party producers. The 50 mmcf/d refrigeration expansion of the Hythe gas processing facility that was placed into service in June operated at full capacity during the third quarter. The refrigeration expansion was Veresen Midstream’s first brownfield expansion and was designed, constructed and placed into service by Veresen Midstream. Importantly, it is indicative of opportunities Veresen Midstream expects to capitalize on in the future. The expansion, as part of the Hythe / Steeprock assets, is operated by Veresen Midstream and is governed by the existing take-or-pay Midstream Services Agreement with Encana. Veresen Midstream currently provides Veresen with approximately $16 million of distributable cash each quarter. Veresen’s share of EBITDA for the quarter of $17 million was slightly below each of the first two quarters of 2016 largely as a result of the third-party downstream curtailments. Costs remained in-line with the prior quarter. EBITDA from Dawson is expected to continue to grow as additional gathering lines, compression and gas plants are brought into service.

During the third quarter, a total of $271 million ($128 million net to Veresen) in capital was invested by Veresen Midstream, including $244 million ($116 million net) for the construction of the Sunrise, Tower and Saturn Phase II processing facilities. Construction of the three processing facilities remains on budget and on schedule, with more than 45% of capital incurred to date. The company continues to expect the combined cost of the processing facilities currently under construction to be approximately $2.5 billion (approximately $1.2 billion net to Veresen), with the Sunrise and Tower plants expected to be in-service by the end of 2017 and the Saturn Phase II plant in-service by mid-2018. When all three of these facilities are operational, Veresen Midstream will have 1.5 bcf/d of processing capacity in operation and will be a dominant player in the core of the Montney, one of North America’s most prolific and competitive resource plays. Once commissioned, these facilities are expected to generate incremental run-rate EBITDA of between $250 million to $300 million (approximately $120 million to $140 million net to Veresen), based on target volumes. Subsequent to the end of the third quarter, CRP and Encana sanctioned two incremental capital projects as a result of the need for increased liquids-rich gas processing capacity. The CRP has sanctioned modifications to an existing compressor station to process richer gas at a cost of approximately $12 million ($6 million net to Veresen). Encana has further sanctioned approximately $10 million ($5 million net to Veresen) of capital projects to increase liquids handling capabilities at the Hythe gas processing plant. Both the compressor station modifications and the improvements at the Hythe gas processing plant will be made under existing 15 year, take-or-pay agreements. Since Veresen Midstream was formed in early 2015, a total of $3.3 billion (approximately $1.6 billion net to Veresen) in capital projects have been sanctioned under the agreement with Cutbank Ridge Partnership (“CRP”) and Encana to fund up to $5 billion of new infrastructure. At the end of the third quarter, approximately $680 million of these capital projects were in service. Aux Sable Distributable cash from Aux Sable of $2 million in the third quarter was a slight decrease relative to the second quarter and reflects NGL margins remaining near cyclical lows. While a recovery in ethane margins during the second quarter had led to the resumption of ethane extraction, weaker margins in the third quarter resulted in a return to the periodic rejection of ethane at the Channahon Facility. Aux Sable’s NGL Sales Agreement with BP continued to provide downside protection during the third quarter, with the need for NGL margins to increase somewhat meaningfully before Aux Sable’s profitability reflects a more fulsome NGL margin recovery. During the third quarter, Aux Sable commissioned the Fractionation Expansion at the Channahon Facility with commercial deliveries beginning in mid-September. With approximately US$5 million of expenditures incurred in the third quarter and total spend of US$49 million, the project came in below the original budget of US$56 million. The expansion adds 24,500 bbl/d of largely propane plus liquids handling capacity, and will allow for increased liquids to flow on the Alliance pipeline. Burstall Ethane Storage Facility Veresen continues to advance the construction of a one million barrel ethane storage facility located near Burstall, Saskatchewan, underpinned by a 20-year contract with NOVA Chemicals. The total cost of construction is expected to be approximately $140 million, with $26 million spent during the third quarter. Veresen has incurred approximately 45% of the cost of construction to date and anticipates spending an additional $10 million to $15 million in the remainder of the year. Veresen expects that the construction of

Burstall will be completed in late 2018. Power Distributable cash of $10 million from the power segment was slightly lower than the first two quarters of the year as a result of lower contribution from the run-of-river assets. Jordan Cove LNG Project and Pacific Connector The company continues to pursue the Jordan Cove LNG Project and related Pacific Connector natural gas pipeline with a current focus of securing additional agreements for the long-term sale of natural gas liquefaction capacity at the export terminal as well as securing the requisite regulatory permits for both the terminal and the pipeline. Approximately $26 million of project development spend was incurred in the third quarter. More than half of the costs incurred at Jordan Cove in 2016 were related to the competitive bid process for the lump-sum turn-key contract for the construction of the terminal, with the bid process expected to be completed in the fourth quarter. Veresen expects the project development spend run rate to decrease once the competitive bid process is completed. While the company has continued to advance both regulatory and commercial work streams, the delay in the Federal Energy Regulatory Commission (“FERC”) providing a substantive ruling on the project’s request for rehearing has created a lack of immediacy, delaying further commercial progress and is beginning to slow the process for securing approvals from other agencies. Increased 2016 Guidance Veresen has increased its 2016 distributable cash guidance by approximately 6% to a the range of $1.12 per Common Share to $1.16 per Common Share, reflecting continuing strong performance of the underlying business and the incremental cash flow received from Alliance in the third quarter relating to cash previously held in trust. The increased guidance range reflects a payout ratio of approximately 86% to 89% of distributable cash. Further details concerning 2016 guidance can be found on the home page of Veresen's web site at www.vereseninc.com. Balance Sheet and Funding Strategy During the third quarter, Veresen announced its intention to sell its power generation business. The divestiture process was formally launched in October and Veresen anticipates entering into binding sale agreements in the first quarter of 2017, with closing in the first half of the year. Proceeds of the sale will be initially directed to reduce debt outstanding and subsequently used to fully fund the remaining equity component of the approximately $1.3 billion of projects currently under construction. At the end of the third quarter, approximately $610 million of the aggregate cost of these projects had been incurred, with a remaining equity component of approximately $300 to $375 million to be funded over the next two years. Until the proceeds of the power business are realized, Veresen expects to primarily use its $750 million revolving credit facility on an interim basis to fund its equity contributions into Veresen Midstream and the equity component of Burstall. During this period, distributable cash is expected to fully cover the dividend but is only expected to provide limited retained cash for reinvestment into the business. As at September 30, 2016, Veresen had approximately $379 million of available, undrawn capacity on its $750 million revolving credit facility. Subsequent to the end of the quarter, the maturity of Veresen’s

revolving credit facility was extended by one year to May 31, 2020. During the third quarter, Veresen made an equity contribution of $155 million into Veresen Midstream, with the next contribution expected in the first quarter of 2017. Veresen Midstream intends to fund its capital investment using 55% to 60% debt. To complete the construction of sanctioned projects at Veresen Midstream, an additional $225 to $275 million in equity contributions by Veresen are anticipated over the next two years. In early September, Veresen Midstream secured an additional $650 million of new credit facilities comprised of a new US$150 million Senior Secured Term Loan B, a $405 million increase in the Expansion Facility and an incremental $50 million of capacity within the Revolving Facility. With the expansion of Veresen Midstream’s credit facilities, the balance of the capital requirements within Veresen Midstream are now fully funded. In aggregate, the credit facilities in place within Veresen Midstream had $1,310 million (approximately $620 million net to Veresen) of available capacity as at September 30, 2016. Debt at the partnership level is non-recourse to Veresen. Proportionate Consolidation of Debt – Amortization Schedule(1)
($ millions) Q4
2016 2017 2018 2019 2020 2021+ Total
Fixed Term Pipeline Alliance 16 65 64 125 65 328 663
Ruby 12 145 57 57 57 340 668 AEGS 1 4 4 4 65 79
Total 29 214 125 186 187 668 1,409
Veresen Midstream(2) 1 4 22 30 196 393 646
Power 5 18 37 124 16 198 398
Corporate 300 150 200 50 700
Total Fixed Term 35 536 334 540 399 1,309 3,153
Revolving (Floating Rate) Alliance 44 44
Ruby 47 47
Veresen Midstream -
Aux Sable 6 6
Power 16 16
Corporate 368 368
Total Floating Rate - 53 44 16 368 - 481
Total 35 589 378 556 767 1,309 3,634 (1) This table contains non-GAAP measures. Balances for Veresen’s jointly controlled businesses represent Veresen’s
proportional share based on Veresen’s ownership interest, and includes consolidation adjustments. (2) Once the Sunrise, Tower and Saturn Phase II facilities currently under construction are in operation, Veresen intends to
refinance the Veresen Midstream expansion facility with non-amortizing debt. The company’s debt on a proportionate consolidation basis as at September 30, 2016 was $3.6 billion or approximately 5.2x proportionately consolidated EBITDA on a trailing 12 month basis of $693 million. Veresen expects that debt to EBITDA will be in the range of approximately 4.0x – 4.5x once the projects under construction are on-line. The company also believes that it is prudent to look at distributable cash after the amortization of debt within each of the business, even where significant value will remain in the

assets after the debt is fully amortized. Veresen is committed to maintaining strong investment grade credit ratings. Conference Call & Webcast Details A conference call and webcast presentation will be held to discuss third quarter 2016 financial and operating results at 7:00am Mountain Time (9:00am Eastern Time) on Wednesday, November 2, 2016. To listen to the conference call, please dial 647-788-4919 or 1-877-291-4570 (toll-free). This call will also be broadcast live on the Internet and may be accessed directly at the following URL: http://www.gowebcasting.com/8078 A presentation will accompany the conference call and will be available via the webcast. Alternatively, the presentation will be made available immediately prior to the conference call start time of 7:00am Mountain Time on Veresen's website at: http://www.vereseninc.com/invest/events-presentations. A digital recording will be available for replay two hours after the call's completion, and will remain available until November 16, 2016 21:59 Mountain Time (23:59 Eastern Time). To listen to the replay, please dial 416-621-4642 or 1-800-585-8367 (toll-free) and enter Conference ID 94202117. A digital recording will also be available for replay on the company’s website. About Veresen Inc. Veresen is a publicly-traded dividend paying corporation based in Calgary, Alberta that owns and operates energy infrastructure assets across North America. Veresen is engaged in three principal businesses: a pipeline transportation business comprised of interests in the Alliance Pipeline, the Ruby Pipeline and the Alberta Ethane Gathering System; a midstream business which includes a partnership interest in Veresen Midstream Limited Partnership which assets owns in western Canada, and an ownership interest in Aux Sable, which owns a world-class natural gas liquids (NGL) extraction facility near Chicago, and other natural gas and NGL processing energy infrastructure; and a power business comprised of a portfolio of assets in Canada. Veresen is also developing Jordan Cove LNG, a six million tonne per annum natural gas liquefaction facility proposed to be constructed in Coos Bay, Oregon, and the associated Pacific Connector Gas Pipeline. In the normal course of business, Veresen regularly evaluates and pursues acquisition and development opportunities. Veresen's Common Shares, Cumulative Redeemable Preferred Shares, Series A, Cumulative Redeemable Preferred Shares, Series C, and Cumulative Redeemable Preferred Shares, Series E trade on the Toronto Stock Exchange under the symbols "VSN", "VSN.PR.A", "VSN.PR.C" and "VSN.PR.E", respectively. For further information, please visit www.vereseninc.com. Forward-looking Information Certain information contained herein relating to, but not limited to, Veresen and its businesses and the offering of the notes, constitutes forward-looking information under applicable securities laws. All statements, other than statements of historical fact, which address activities, events or developments that Veresen expects or anticipates may or will occur in the future, are forward-looking information. Forward-looking information typically contains statements with words such as "may", "estimate", "anticipate", "believe", "expect", "plan", "intend", "target", "project", "forecast" or similar words suggesting future outcomes or outlook. Forward-looking statements in this news release include, but are not limited to, statements with respect to: growth to be contributed by Veresen Midstream; the use of proceeds from the sale of Veresen’s power business; the funding plan of Veresen; capital projects to be sanctioned by Veresen Midstream in 2016; demand for services on Alliance; the amount of distributable cash to be generated by Veresen in 2016; the amount of EBITDA to be contributed by Dawson; in service dates and cost of construction of, and amount of EBITDA to be generated by, the Sunrise and Tower gas plants, and the Saturn Phase II processing facility; the in service date and cost of construction of the Burstall ethane storage facility; timing of the bid process for a construction contract for Jordan Cove LNG; project development spending for Jordan Cove LNG and Pacific Connector; the timing of the sale of Veresen’s
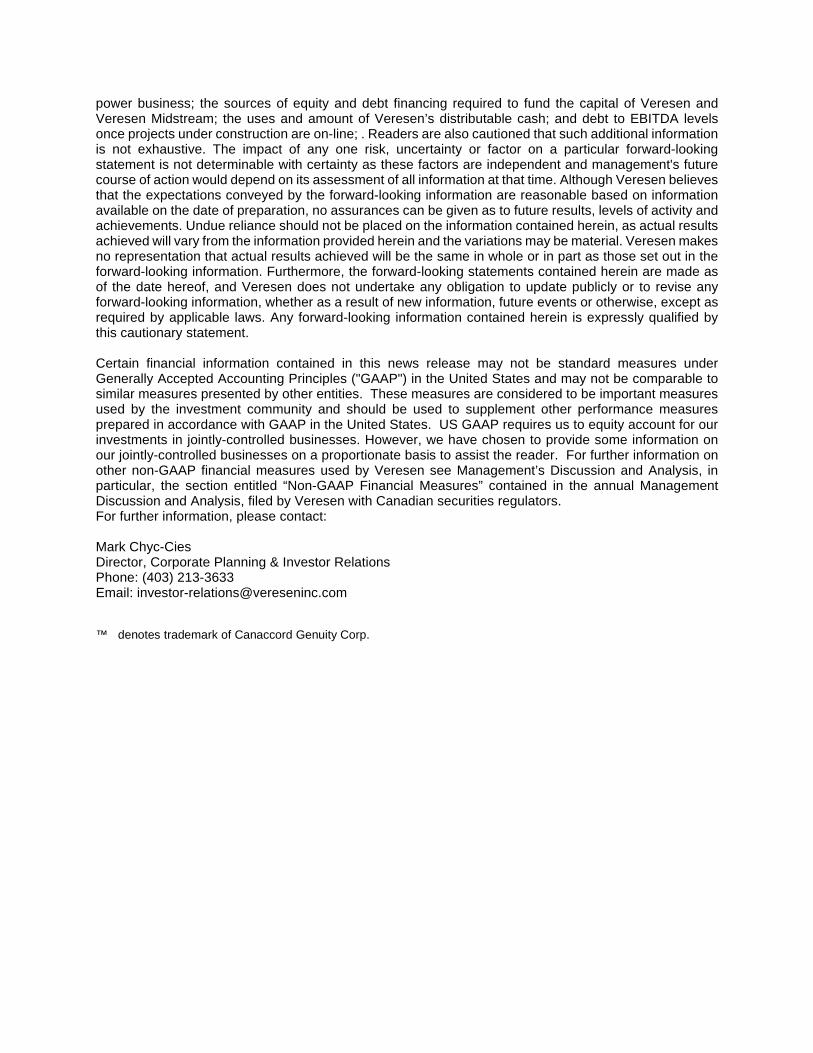
power business; the sources of equity and debt financing required to fund the capital of Veresen and Veresen Midstream; the uses and amount of Veresen’s distributable cash; and debt to EBITDA levels once projects under construction are on-line; . Readers are also cautioned that such additional information is not exhaustive. The impact of any one risk, uncertainty or factor on a particular forward-looking statement is not determinable with certainty as these factors are independent and management's future course of action would depend on its assessment of all information at that time. Although Veresen believes that the expectations conveyed by the forward-looking information are reasonable based on information available on the date of preparation, no assurances can be given as to future results, levels of activity and achievements. Undue reliance should not be placed on the information contained herein, as actual results achieved will vary from the information provided herein and the variations may be material. Veresen makes no representation that actual results achieved will be the same in whole or in part as those set out in the forward-looking information. Furthermore, the forward-looking statements contained herein are made as of the date hereof, and Veresen does not undertake any obligation to update publicly or to revise any forward-looking information, whether as a result of new information, future events or otherwise, except as required by applicable laws. Any forward-looking information contained herein is expressly qualified by this cautionary statement. Certain financial information contained in this news release may not be standard measures under Generally Accepted Accounting Principles ("GAAP") in the United States and may not be comparable to similar measures presented by other entities. These measures are considered to be important measures used by the investment community and should be used to supplement other performance measures prepared in accordance with GAAP in the United States. US GAAP requires us to equity account for our investments in jointly-controlled businesses. However, we have chosen to provide some information on our jointly-controlled businesses on a proportionate basis to assist the reader. For further information on other non-GAAP financial measures used by Veresen see Management’s Discussion and Analysis, in particular, the section entitled “Non-GAAP Financial Measures” contained in the annual Management Discussion and Analysis, filed by Veresen with Canadian securities regulators. For further information, please contact: Mark Chyc-Cies Director, Corporate Planning & Investor Relations Phone: (403) 213-3633 Email: [email protected] ™ denotes trademark of Canaccord Genuity Corp.

VERESEN INC.Management’s Discussion and Analysis
Three and nine months ended September 30, 2016
FINANCIAL AND OPERATING HIGHLIGHTS
Three months endedSeptember 30
Nine months endedSeptember 30
($ Millions, except where noted) 2016 2015 2016 2015Operating Highlights (100%)Pipeline
Alliance – billion cubic feet per day (1) 1.544 1.336 1.570 1.490Ruby – billion cubic feet per day 0.698 0.930 0.653 0.736AEGS – thousand barrels per day (2) 298 286 290 288
MidstreamHythe/Steeprock – million cubic feet per day (3) 385 392 386 393Dawson – million cubic feet per day 670 608 720 596Aux Sable – thousand barrels per day 65 58 76 65
Power – gigawatt hours (net) 177 133 594 448Financial ResultsEquity income and dividend income 74 45 222 142Operating revenues 39 37 114 147Adjusted net income attributable to CommonShares (4)(5) 21 12 52 50
Per Common Share ($) – basic 0.07 0.04 0.17 0.17Net income attributable to Common Shares 19 8 35 46
Per Common Share ($) – basic 0.06 0.03 0.11 0.16Cash from operating activities 78 77 192 211Distributable cash (4)(6) 101 72 276 217
Per Common Share ($) – basic 0.33 0.25 0.90 0.75Dividends paid/payable (7) 78 74 230 218
Per Common Share ($) 0.25 0.25 0.75 0.75Capital expenditures (8) 23 17 65 49
September 30, 2016As at
Dec. 31, 2015Financial PositionCash and short-term investments 106 58Total assets 4,631 4,560Senior debt 1,310 1,089Shareholders’ equity 2,907 3,087
Common SharesOutstanding – as at period end (9) 313,628,856 298,979,989Average daily volume 1,057,839 854,092Price per Common Share – close ($) 13.40 8.86
1. Average daily volume for Alliance is based on the Canadian leg of the pipeline.2. Average daily volume for AEGS is based on toll volumes.3. Average daily volume for Hythe/Steeprock is based on fee volumes.4. This item is not a standard measure under US GAAP and may not be comparable to similar measures presented by other entities. See
section entitled “Non-GAAP Financial Measures” in this MD&A.5. We have provided a reconciliation of adjusted net income attributable to Common Shares to net income attributable to Common
Shares in the “Non-GAAP Financial Measures” section of this MD&A.6. We have provided a reconciliation of distributable cash to cash from operating activities in the “Non-GAAP Financial Measures” section
of this MD&A.
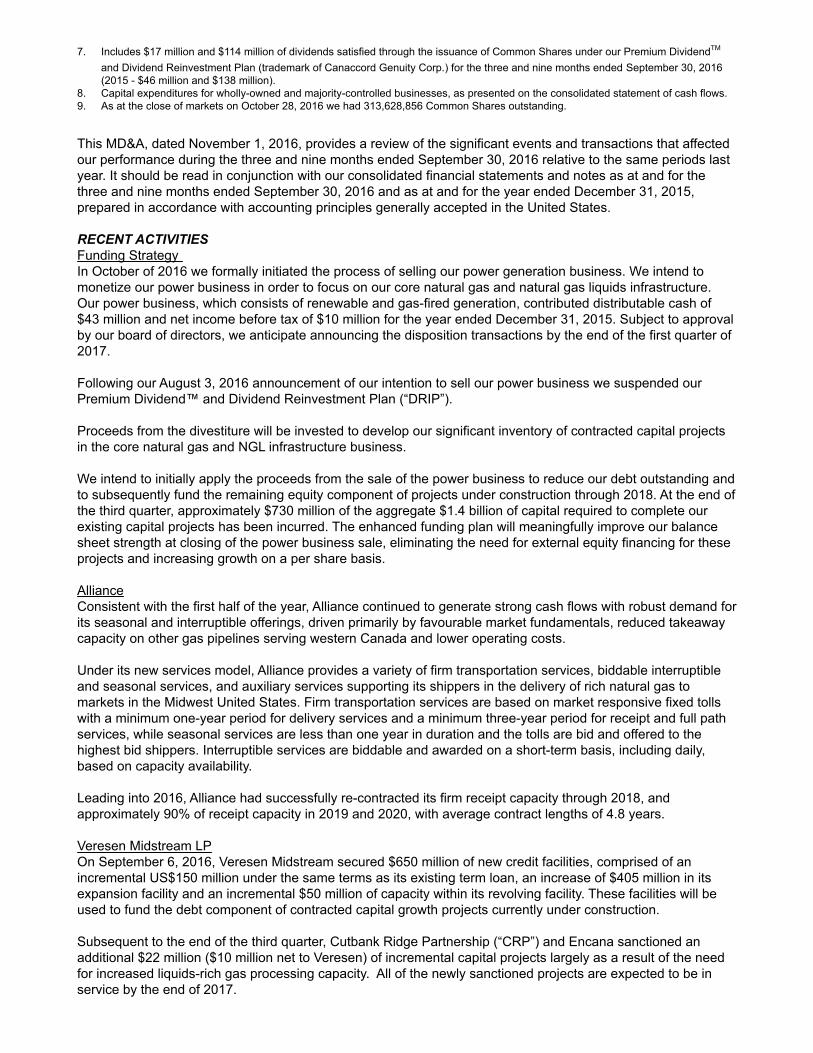
7. Includes $17 million and $114 million of dividends satisfied through the issuance of Common Shares under our Premium DividendTM and Dividend Reinvestment Plan (trademark of Canaccord Genuity Corp.) for the three and nine months ended September 30, 2016 (2015 - $46 million and $138 million).
8. Capital expenditures for wholly-owned and majority-controlled businesses, as presented on the consolidated statement of cash flows.9. As at the close of markets on October 28, 2016 we had 313,628,856 Common Shares outstanding.
This MD&A, dated November 1, 2016, provides a review of the significant events and transactions that affected our performance during the three and nine months ended September 30, 2016 relative to the same periods last year. It should be read in conjunction with our consolidated financial statements and notes as at and for the three and nine months ended September 30, 2016 and as at and for the year ended December 31, 2015, prepared in accordance with accounting principles generally accepted in the United States.
RECENT ACTIVITIESFunding Strategy In October of 2016 we formally initiated the process of selling our power generation business. We intend to monetize our power business in order to focus on our core natural gas and natural gas liquids infrastructure. Our power business, which consists of renewable and gas-fired generation, contributed distributable cash of $43 million and net income before tax of $10 million for the year ended December 31, 2015. Subject to approval by our board of directors, we anticipate announcing the disposition transactions by the end of the first quarter of 2017.
Following our August 3, 2016 announcement of our intention to sell our power business we suspended our Premium Dividend™ and Dividend Reinvestment Plan (“DRIP”).
Proceeds from the divestiture will be invested to develop our significant inventory of contracted capital projects in the core natural gas and NGL infrastructure business.
We intend to initially apply the proceeds from the sale of the power business to reduce our debt outstanding and to subsequently fund the remaining equity component of projects under construction through 2018. At the end of the third quarter, approximately $730 million of the aggregate $1.4 billion of capital required to complete our existing capital projects has been incurred. The enhanced funding plan will meaningfully improve our balance sheet strength at closing of the power business sale, eliminating the need for external equity financing for these projects and increasing growth on a per share basis.
AllianceConsistent with the first half of the year, Alliance continued to generate strong cash flows with robust demand for its seasonal and interruptible offerings, driven primarily by favourable market fundamentals, reduced takeaway capacity on other gas pipelines serving western Canada and lower operating costs.
Under its new services model, Alliance provides a variety of firm transportation services, biddable interruptibleand seasonal services, and auxiliary services supporting its shippers in the delivery of rich natural gas tomarkets in the Midwest United States. Firm transportation services are based on market responsive fixed tollswith a minimum one-year period for delivery services and a minimum three-year period for receipt and full pathservices, while seasonal services are less than one year in duration and the tolls are bid and offered to thehighest bid shippers. Interruptible services are biddable and awarded on a short-term basis, including daily,based on capacity availability.
Leading into 2016, Alliance had successfully re-contracted its firm receipt capacity through 2018, and approximately 90% of receipt capacity in 2019 and 2020, with average contract lengths of 4.8 years.
Veresen Midstream LPOn September 6, 2016, Veresen Midstream secured $650 million of new credit facilities, comprised of an incremental US$150 million under the same terms as its existing term loan, an increase of $405 million in its expansion facility and an incremental $50 million of capacity within its revolving facility. These facilities will be used to fund the debt component of contracted capital growth projects currently under construction.
Subsequent to the end of the third quarter, Cutbank Ridge Partnership (“CRP”) and Encana sanctioned an additional $22 million ($10 million net to Veresen) of incremental capital projects largely as a result of the need for increased liquids-rich gas processing capacity. All of the newly sanctioned projects are expected to be in service by the end of 2017.

Veresen Midstream currently has over $2.5 billion (100%) of projects under construction. During the quarter, a total of $271 million (100%) of growth capital expenditures were incurred. Over $1.3 billion (100%) of capital expenditures have been incurred since the formation of Veresen Midstream. We continue to expect the Sunrise and Tower gas plants to be in service by the end of 2017 and the Saturn Phase II gas plant to be in service by mid-2018.
When these three facilities are operational, Veresen Midstream will have 1.5 bcf/d of processing capacity in operation within the Montney, one of North America's most prolific and competitive resource plays. Veresen Midstream will fund approximately 55% to 60% of the construction costs of Sunrise, Tower and Saturn gas plants with its existing $1.680 billion credit facilities at the partnership level, with the balance to be contributed by us and KKR over time. At the end of the third quarter, Veresen Midstream received $316 million of net equity contributions, of which our share was $151 million, to support funding of these capital projects.
Capital fees from the gas plants under construction will be generated from fee-for-service agreements where unit capital fees are set to achieve a target rate of return based on invested capital and expected throughput, and are adjusted after 12 months of commercial operations based on updated throughput expectations. The facilities under construction, when placed into service, will address growing production volumes and current infrastructure constraints in the region and allow us to take advantage of opportunities to bring in additional volumes from regional producers. As fallback protection, if Veresen Midstream has not recovered its invested capital after the eighth year of a facility's service period, the Dawson MSA provides for CRP to make a lump sum payment to Veresen Midstream for capital invested.
Aux SableThe US$130 million (100%) expansion of the Channahon Facility was completed on time and on budget during the third quarter of 2016. The expansion allows for approximately 24,500 barrels per day of additional fractionation capacity over and above the plant's current nameplate capacity of 107,000 barrels per day. Commercial operations, commencing September 2016, will continue to ramp up to full commercial production through the first half of 2017.
Burstall Ethane Storage FacilityConstruction continues on our $140 million wholly-owned 1 million barrel ethane storage facility located near Burstall, Saskatchewan, of which $62 million has been incurred as of the end of the third quarter.
Jordan Cove LNG and Pacific Connector Gas Pipeline Development ProjectsWe continue to pursue the Jordan Cove LNG Project and related Pacific Connector with an ongoing focus of securing additional agreements for the long-term sale of natural gas liquefaction capacity at the export terminal as well as securing the requisite regulatory permits for both the terminal and the pipeline.
Sale of Glen Park Run-of-River Hydro FacilityOn August 1, 2016, we closed the sale of our 33 megawatt Glen Park run-of-river hydro power generation facility, located near Watertown in upstate New York, for $81 million which approximated the carrying value of the assets sold.

OVERALL FINANCIAL PERFORMANCE
Adjusted Net Income attributable to Common Shares
Three months endedSeptember 30
Nine months endedSeptember 30
($ Millions, except per Common Share amounts) 2016 2015 2016 2015Adjusted net income (loss) before tax (1)
Pipeline 76 65 235 189 Midstream 3 (9) 7 7 Power 2 - 10 3 Veresen - Corporate (46) (35) (163) (113)Tax expense (8) (3) (18) (19)Adjusted net income 27 18 71 67Preferred Share dividends (6) (6) (19) (17)
Adjusted net income attributable to Common Shares 21 12 52 50 Per Common Share ($) 0.07 0.04 0.17 0.17
(1) See the reconciliation of adjusted net income attributable to Common Shares to net income attributed to Common Shares in the “Non-GAAP Financial Measures” section of this MD&A.
Adjusted net income attributable to Common Shares represents net income adjusted for specific items that are significant, but are not reflective of our underlying operations. We have presented adjusted net income attributable to Common Shares in order to enhance the comparability of our earnings. See the Non-GAAP Financial Measures section of this MD&A for the full definition of this term and the reconciliation to net income attributable to Common Shares.
For the three and nine months ended September 30, 2016, we generated adjusted net income attributable to Common Shares of $21 million or $0.07 per Common Share and $52 million or $0.17 per Common Share compared to $12 million or $0.04 per Common Share and $50 million or $0.17 per Common Share for the same periods in 2015.
During the third quarter of 2016, each our businesses delivered financial results that were in line with or better than expectations. Increased earnings were primarily driven by excellent results from Alliance.
Adjusted earnings from our Pipeline business increased significantly in the third quarter of 2016 relative to the same period last year due to Alliance's continued strong financial performance under its new services model. Favourable market fundamentals fueled demand for Alliance transportation, providing solid revenues from seasonal and interruptible services which, in conjunction with reduced operating costs and depreciation, drove higher adjusted net income than was generated during the same period last year. These factors offset the effect of lower firm transportation rates under the new services model. Ruby adjusted net income in the third quarter of 2016 was consistent with the same period in prior year. Year-to-date Ruby adjusted net income benefited from the effect of the weaker Canadian dollar throughout the first half of the year.
Midstream adjusted net income in the third quarter of 2016 reflects increased earnings from both Veresen Midstream and Aux Sable. Veresen Midstream earnings rose in the third quarter of 2016 compared to the same period last year on higher throughput at Dawson. Aux Sable continues to face challenging market fundamentals, generating minimal earnings, but improving relative to losses incurred in the same period last year.
Adjusted earnings from our Power business during the third quarter of 2016 was consistent with the same period last year.
Corporate costs were higher this quarter primarily due to higher Jordan Cove and Pacific Connector project spending and general and administrative costs. Tax expense was higher as a result of higher taxable earnings and fewer available foreign tax credits.
Adjusted earnings during the first nine months of the year reflect the same underlying factors discussed above for the third quarter, as well as the impact of incremental earnings from our St.Columban and Grand Valley Phase III wind power facilities which commenced operations in the second half of 2015.

Net Income attributable to Common Shares
Three months endedSeptember 30
Nine months endedSeptember 30
($ Millions, except per Common Share amounts) 2016 2015 2016 2015Net income (loss) before tax Pipeline 76 65 235 189 Midstream 3 (9) 5 (15) Power - (6) (2) (3) Veresen – Corporate (46) (35) (163) (113)Gain on sale of assets - - - 37Tax expense (8) (1) (21) (22)Net income, before extraordinary loss 25 14 54 73Extraordinary loss, net of tax - - - (10)Net income 25 14 54 63Preferred Share dividends (6) (6) (19) (17)Net income attributable to Common Shares 19 8 35 46 Per Common Share ($) 0.06 0.03 0.11 0.16
For the three and nine months ended September 30, 2016, we generated net income attributable to Common Shares of $19 million or $0.06 per Common Share and $35 million or $0.11 per Common Share. For the same periods last year, we generated a net loss of $8 million or $0.03 per Common Share and net income of $46 million or $0.16 per Common Share.
In addition to factors impacting adjusted net income, as previously discussed, the following items are reflected in net income.
Power results in the third quarter include the impact of the revaluation of interest rate hedges resulting in an aggregate pre-tax $2 million loss compared to a pre-tax $6 million loss during the same period last year.
Results for the nine months ending September 30, 2016 include the impact of the revaluation of the power interest rate hedges resulting in an aggregate pre-tax $12 million loss compared to a pre-tax $6 million loss during the same period last year. Results for the nine months ending September 30, 2015 include a $37 million pre-tax gain relating to the sale of our Hythe/Steeprock assets to Veresen Midstream during the first quarter of 2015.
Distributable CashThree months ended
September 30Nine months ended
September 30($ Millions, except per Common Share amounts) 2016 2015 2016 2015Pipeline 96 79 255 219Midstream 18 12 55 57Power 10 10 34 29Veresen – Corporate (17) (10) (49) (44)Current tax - (13) - (27)Preferred Share dividends (6) (6) (19) (17)Distributable Cash (1) 101 72 276 217 Per Common Share ($) 0.33 0.25 0.90 0.75
(1) See the reconciliation of distributable cash to cash from operating activities in the “Non-GAAP Financial Measures” section of this MD&A.
For the three and nine months ended September 30, 2016, we generated distributable cash of $101 million or $0.33 per Common Share and $276 million or $0.90 per Common Share, compared to $72 million or $0.25 per Common Share and $217 million or $0.75 per Common Share for the same periods last year.

The increase in distributable cash reflects higher cash flow generation from our Pipeline and Midstream businesses and lower cash taxes.
Distributions from Alliance for the third quarter of 2016 increased $17 million compared to the same period last year. Strong year-to-date performance under the new services model combined with the effects of scheduled reductions in debt amortization, the effects of a weaker Canadian dollar and Alliance's ability to release cash previously held in trust more than offset lower firm transportation rates and the absence of the non-renewal charge which had been collected and distributed by Alliance U.S. in the years 2010 to 2015.
Third quarter distributions from Aux Sable increased by $6 million compared to the same period in 2015 due to a slight improvement in NGL frac margins at its North Dakota operations and the absence of pipeline capacity margins during the third quarter of 2015.
Fixed distributions from Veresen Midstream continue to be supported by growing EBITDA. See the Non-GAAP Financial Measures section of this MD&A for the full definition of this term.
Our Power business distributable cash during the third quarter of 2016 was consistent with the same period last year. Corporate costs in the third quarter of 2016 increased by $7 million compared to the same period in 2015 reflecting higher general and administrative costs, primarily driven by the upward revaluation of our long-term incentive plans in 2016 due to an increase in our share price compared to the downward revaluation recognized in the third quarter of 2015. This was partially offset by lower interest costs due to an interest make-whole payment received upon early settlement of a loan to a jointly-controlled business.
Effective January 1, 2016, we implemented a U.S.-based organizational restructuring which defers cash taxes, with the exception of Part VI.1 taxes on our Preferred Share dividends, for approximately the next five years.
Distributions in the first nine months of the year generally reflect the same factors discussed for the third quarter.
Cash from Operating ActivitiesThree months ended September 30 Nine months ended September 30
($ Millions) 2016 2015 2016 2015Pipeline 91 76 255 222Midstream 18 26 59 75Power 18 12 43 50Veresen - Corporate (49) (37) (165) (136)
78 77 192 211
For the three and nine months ended September 30, 2016, we generated $78 million and $192 million of cash from operating activities compared to $77 million and $211 million for the same periods last year. Higher year-to-date cash flows from our Pipeline business, partly offset by an increase in corporate costs, generally reflect the same factors impacting distributable cash. The decrease in cash flows from our power business is due to changes in non-cash working capital. The increase in Corporate costs reflect the increase in Jordan Cove spending relative to the same period last year.
ACCOUNTING STANDARDS AND BASIS OF PRESENTATION
Our consolidated financial statements as at and for the three and nine months ended September 30, 2016 have been prepared by management in accordance with US GAAP. All financial information is in Canadian dollars unless otherwise noted and, as it relates to our financial results, has been derived from information used to prepare our US GAAP consolidated financial statements. Capitalized terms used in this MD&A that have not been defined have the same meanings attributed to them in our 2015 consolidated financial statements. Additional information concerning our business is available on SEDAR at www.sedar.com or on our website at www.vereseninc.com.

FORWARD-LOOKING AND NON-GAAP INFORMATION
Some of the information contained in this MD&A is forward-looking information under Canadian securities laws. All information that addresses activities, events or developments which may or will occur in the future is forward-looking information. Forward-looking information typically contains statements with words such as may, estimate, anticipate, believe, expect, plan, intend, target, project, forecast or similar words suggesting future outcomes or outlook. Forward-looking statements in this MD&A include statements about:
• the impact of Alliance's new services framework on Alliance's future earnings;• Aux Sable’s ability to realize upon the extraction agreements with producers;• the outcome of the Statement of Claim relating to Aux Sable's NGL Sales Agreement;• the 2016 pricing environment for ethane and propane;• execution of our plan to sell the power business and the timing thereof;• the timing of the completion of construction and in-service date of the Sunrise and Tower gas plants, the Saturn compression station
expansion and the Hythe liquids recovery project;• the level of volume demand at the Sunrise, Tower and Saturn facilities and our ability to secure third party volumes;• the projected date for a final investment decision on Jordan Cove LNG and Pacific Connector Gas Pipeline;• the effective elimination of cash taxes for approximately the next five years, excluding Part VI.1 taxes on Preferred Share dividends,
as a result of our U.S.-based organizational restructuring• the projected date for commencing LNG production from Jordan Cove LNG;• the sufficiency of our liquidity;• the sufficiency of our available committed credit facilities to fund working capital, dividends and capital expenditures; • the ability of each of our businesses to generate distributable cash and the timing under which distributable cash will be generated;
and• our ability to pay dividends.
The risks and uncertainties that may affect our operations, performance, development and the results of our businesses include, but are not limited to, the following factors:
• our ability to successfully implement our strategic initiatives and achieve expected benefits; • levels of oil and gas exploration and development activity; • status, credit risk and continued existence of contracted customers; • availability and price of capital; • availability and price of energy commodities; • availability of construction services and materials; • fluctuations in foreign exchange and interest rates; • our ability to successfully obtain regulatory approvals; • changes in tax, regulatory, environmental, and other laws and regulations; • competitive factors in the pipeline, midstream and power industries; • operational breakdowns, failures, or other disruptions; and • prevailing economic conditions in North America.
Additional information on these and other risks, uncertainties and factors that could affect our operations or financial results are included in our filings with the securities commissions or similar authorities in each of the provinces of Canada, as may be updated from time to time. We caution readers that the foregoing list of factors and risks is not exhaustive. The impact of any one risk, uncertainty or factor on a particular forward-looking statement is not determinable with certainty as these factors are independent and management’s future course of action would depend on its assessment of all information at that time. Although we believe the expectations conveyed by the forward-looking information are reasonable based on information available to us on the date of preparation, we can give no assurances as to future results, levels of activity and achievements. Readers should not place undue reliance on the information contained in this MD&A, as actual results achieved will vary from the information provided herein and the variations may be material. We make no representation that actual results achieved will be the same in whole or in part as those set out in the forward-looking information. Furthermore, the forward-looking statements contained herein are made as of the date hereof, and, except as required by law, we do not undertake any obligation to update publicly or to revise any forward-looking information, whether as a result of new information, future events or otherwise. We expressly qualify any forward-looking information contained in this MD&A by this cautionary statement.
Certain financial information contained in this MD&A may not be standard measures under GAAP in the United States and may not be comparable to similar measures presented by other entities. These measures are considered to be important measures used by the investment community and should be used to supplement other performance measures prepared in accordance with GAAP in the United States. For further information on non-GAAP financial measures used by us see the section entitled “Non-GAAP Financial Measures” contained in this MD&A.

RESULTS OF OPERATIONS – BY BUSINESS SEGMENT
Pipeline Business2016 2015
Net IncomeBefore Tax
DistributableCash
Net IncomeBefore Tax
DistributableCash
Three months ended September 30Alliance 44 61 33 44
Ruby 30 30 30 30
AEGS 2 5 2 5
76 96 65 79
2016 2015Net IncomeBefore Tax
DistributableCash
Net IncomeBefore Tax
DistributableCash
Nine months ended September 30Alliance 139 151 97 120
Ruby 90 90 85 85
AEGS 6 14 7 14
235 255 189 219
Alliance Pipeline
Operational Highlights
Three months ended September 30 Nine months ended September 30
Volumes (100%; bcf/d) 2016 2015 2016 2015Transportation deliveries under cost of servicemodel (pre-December 1, 2015) - 1.336 - 1.490
Firm transportation volumes 1.338 - 1.357 -Seasonal 0.153 - 0.138 -Priority Interruptible Transportation Service(PITS) and Interruptible Transportation (IT)volumes 0.053 - 0.075 -
Total Canadian volumes 1.544 1.336 1.570 1.490
Incremental U.S. volumes (incl. Bakken) 0.138 0.153 0.139 0.156
Total U.S. volumes 1.682 1.489 1.709 1.646
Blended average toll rates ($/mcf):Firm 1.30 - 1.32 -
Seasonal, PITS and IT 1.56 - 1.49 -
U.S. only 0.59 - 0.60 -
All of Alliance's firm capacity has been contracted for 2016. Strong market demand continued in the third quarter, due to Chicago gas prices trading at higher premiums to AECO gas prices and reduced takeaway capacity on other gas pipelines serving western Canada, which resulted in Alliance selling its remaining available capacity through seasonal and interruptible transportation offerings.
Firm volumes under the cost of service model for the three and nine months ended September 30, 2015 were 1.325 bcf/d, with the additional 0.011 bcf/d and 0.165 bcf/d, respectively, of utilized capacity representing Alliance's Authorized Overrun Service, which was provided to shippers at no extra cost. Under its new services model, Alliance now charges toll rates for all utilized capacity.
Subsequent to the end of the third quarter, Alliance undertook a planned shut-down to perform certain pipe replacement work to accommodate the construction of a highway near Regina, Saskatchewan. There is no

significant financial impact as Alliance will be reimbursed for the costs incurred and foregone revenues as a result of the planned shut-down.
Financial Highlights
Components of Alliance Equity Income:
Three months ended September 30 Nine months ended September 30
(Veresen's share; $ Millions) 2016 2015 2016 2015
Transportation revenue under cost of servicemodel (pre December 1, 2015) - 117 - 343
Transportation revenue under new servicesoffering 97 - 300 -
Other revenue 3 - 10 -
100 117 310 343General, administrative, operating andmaintenance (26) (37) (80) (113)
Interest and other finance (12) (13) (37) (40)
Depreciation and amortization (18) (31) (54) (91)
Disposition of property, plant and equipment - (3) - (3)
Net income before tax / equity income 44 33 139 96
Distributable cash 61 44 151 120
Distributable cash for the three and nine months ended September 30, 2016 was $61 million and $151 million compared to $44 million and $120 million for the same periods last year. The increases were due to reduced debt amortization, strong demand for new service offerings, the effects of a weaker Canadian dollar and Alliance's ability to release cash previously held in trust.
Alliance EBITDA for the three and nine months ended September 30, 2016 reflects continued strong demand for its new service offerings and a lower cost structure associated with the new business model. EBITDA is lower compared to the same period in prior year. Under the cost of service model revenues included the recovery of all costs, including depreciation and interest, as well as the non-renewal charge which had been collected and distributed by Alliance US in the years 2010 to 2015. Year-to-date EBITDA reflects the same factors as the third quarter in conjunction with a weaker Canadian dollar in the first half of 2016 which allowed Alliance to generate comparable EBITDA under its new service model.
Net income before tax for the three and nine months ended September 30, 2016 was $44 million and $139 million compared to $33 million and $96 million for the same periods last year. The increases reflect lower depreciation due to an extension in the estimated useful life of the pipeline assets and the impact of a weaker Canadian dollar during the first half of 2016.
Ruby Pipeline
Operational HighlightsLong-term ship-or-pay contracts are in place for approximately 1.1 bcf/d, or 69%, of the pipeline's capacity, 90% of which are held by investment grade shippers. The average remaining length of the contracts is approximately seven years. Transportation deliveries for the three and nine months ended September 30, 2016 averaged 0.698 bcf/d and 0.653 bcf/d compared to 0.930 bcf/d and 0.736 bcf/d in the same periods last year. Volumes are lower than the contracted levels as a result of market economics making Canadian gas more competitive than Rockies gas and minor outages on downstream pipelines.
Financial HighlightsDistributable cash and net income for the three and nine months ended September 30, 2016 was $30 million and $90 million, representing the three and nine month portions of the US$91 million annual distributions we are entitled to as holders of the convertible preferred shares. The $5 million increase in distributable cash and net income for the nine months ended September 30, 2016 compared to the same period last year is a result of the weaker Canadian dollar.

AEGS
Three months ended September 30 Nine months ended September 30
(Veresen's share; $ Millions) 2016 2015 2016 2015Earnings before interest, tax depreciation
and amortization (“EBITDA”) (1) 7 8 20 22
Depreciation and amortization (4) (5) (11) (11)
Interest and other finance (1) (1) (3) (4)
Net income before tax 2 2 6 7Distributable cash 5 5 14 14
Volumes (mbbls/d (2)) 298 286 290 288(1) This item is not a standard measure under US GAAP and may not be comparable to similar measures presented by other entities. See
section entitled “Non-GAAP Financial Measures” in this MD&A.(2) Average daily volumes are based on toll volumes.
Operational HighlightsToll volumes for the three and nine months ended September 30, 2016 were 298 mbbls/d and 290 mbbls/d, consistent with volumes of 286 mbbls/d and 288 mbbls/d for the same periods last year.
Financial Highlights For the three and nine months ended September 30, 2016, AEGS generated $5 million and $14 million in distributable cash and $2 million and $6 million in net income before tax, compared to $5 million and $14 million in distributable cash and $2 million and $7 million in net income before tax for the same periods last year. Current year results were consistent with the same periods last year.
Midstream Business2016 2015
Net Income(Loss)
Before TaxDistributable
Cash
Net Income(Loss)
Before TaxDistributable
CashThree months ended September 30
Veresen Midstream 2 16 1 15
Hythe/Steeprock - - - -
Aux Sable 1 2 (10) (3)
3 18 (9) 12
2016 2015Net Income
(Loss)Before Tax
DistributableCash
Net Income(Loss)
Before TaxDistributable
CashNine months ended September 30
Veresen Midstream 7 47 (3) 30
Hythe/Steeprock - - 11 20
Aux Sable (2) 8 (23) 7
5 55 (15) 57
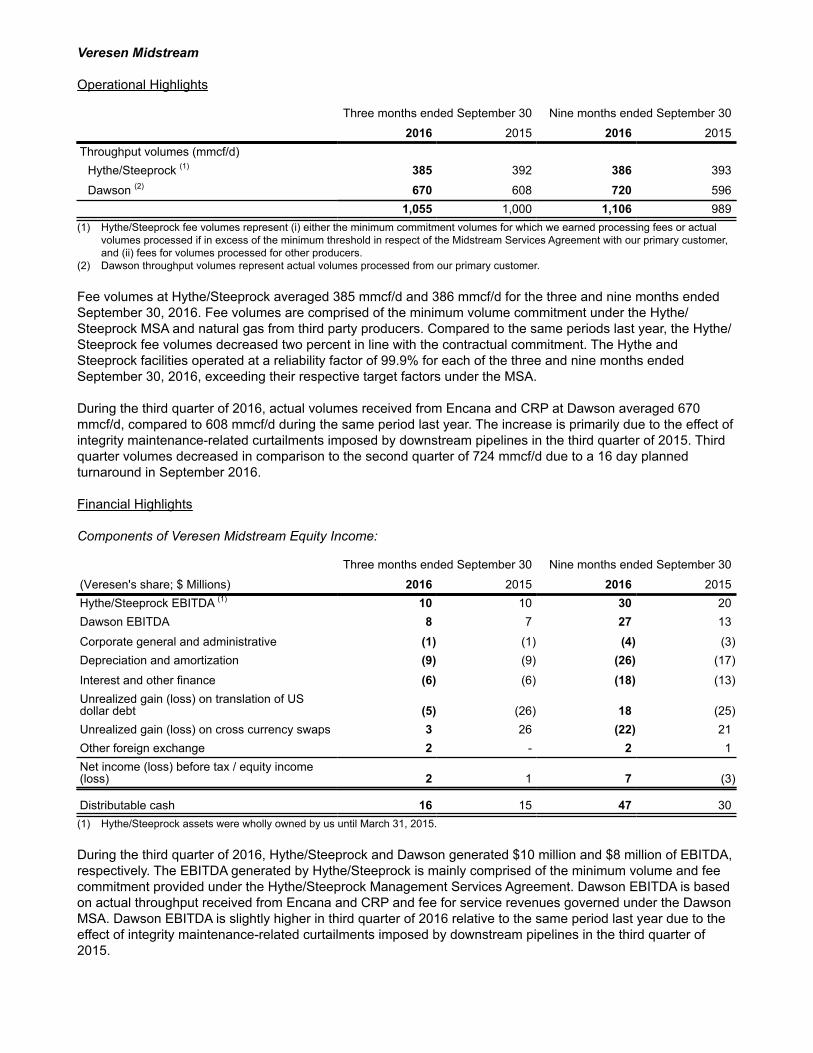
Veresen Midstream
Operational Highlights
Three months ended September 30 Nine months ended September 30
2016 2015 2016 2015Throughput volumes (mmcf/d)
Hythe/Steeprock (1) 385 392 386 393
Dawson (2) 670 608 720 5961,055 1,000 1,106 989
(1) Hythe/Steeprock fee volumes represent (i) either the minimum commitment volumes for which we earned processing fees or actual volumes processed if in excess of the minimum threshold in respect of the Midstream Services Agreement with our primary customer, and (ii) fees for volumes processed for other producers.
(2) Dawson throughput volumes represent actual volumes processed from our primary customer.
Fee volumes at Hythe/Steeprock averaged 385 mmcf/d and 386 mmcf/d for the three and nine months ended September 30, 2016. Fee volumes are comprised of the minimum volume commitment under the Hythe/Steeprock MSA and natural gas from third party producers. Compared to the same periods last year, the Hythe/Steeprock fee volumes decreased two percent in line with the contractual commitment. The Hythe and Steeprock facilities operated at a reliability factor of 99.9% for each of the three and nine months ended September 30, 2016, exceeding their respective target factors under the MSA.
During the third quarter of 2016, actual volumes received from Encana and CRP at Dawson averaged 670 mmcf/d, compared to 608 mmcf/d during the same period last year. The increase is primarily due to the effect of integrity maintenance-related curtailments imposed by downstream pipelines in the third quarter of 2015. Third quarter volumes decreased in comparison to the second quarter of 724 mmcf/d due to a 16 day planned turnaround in September 2016.
Financial Highlights
Components of Veresen Midstream Equity Income:
Three months ended September 30 Nine months ended September 30
(Veresen's share; $ Millions) 2016 2015 2016 2015Hythe/Steeprock EBITDA (1) 10 10 30 20Dawson EBITDA 8 7 27 13
Corporate general and administrative (1) (1) (4) (3)Depreciation and amortization (9) (9) (26) (17)
Interest and other finance (6) (6) (18) (13)Unrealized gain (loss) on translation of USdollar debt (5) (26) 18 (25)Unrealized gain (loss) on cross currency swaps 3 26 (22) 21Other foreign exchange 2 - 2 1Net income (loss) before tax / equity income(loss) 2 1 7 (3)
Distributable cash 16 15 47 30(1) Hythe/Steeprock assets were wholly owned by us until March 31, 2015.
During the third quarter of 2016, Hythe/Steeprock and Dawson generated $10 million and $8 million of EBITDA, respectively. The EBITDA generated by Hythe/Steeprock is mainly comprised of the minimum volume and fee commitment provided under the Hythe/Steeprock Management Services Agreement. Dawson EBITDA is based on actual throughput received from Encana and CRP and fee for service revenues governed under the Dawson MSA. Dawson EBITDA is slightly higher in third quarter of 2016 relative to the same period last year due to the effect of integrity maintenance-related curtailments imposed by downstream pipelines in the third quarter of 2015.

On September 30, 2016, Veresen Midstream paid a distribution of $26 million, of which our share is $16 million. The payment-in-kind structure provides for us to receive close to two-thirds of the cash distributions while we were entitled to approximately 47.4% of the net income during the third quarter of 2016.
Net income before tax for the three and nine months ended September 30, 2016 include a $3 million fair value gain and a $22 million fair value loss on Veresen Midstream's cross currency swap, offset by a $5 million foreign exchange loss and an $18 million foreign exchange gain on the revaluation of Veresen Midstream's US dollar denominated Term Loan. During the same periods last year, results included a $26 million and $21 million fair value loss on the cross currency swap, offset by a $26 million and $25 million foreign exchange gain on the revaluation of the Term Loan. There were no operating earnings or distributions from Veresen Midstream during the first quarter of 2015 as its operating assets, including Hythe/Steeprock, were not acquired until March 31, 2015.
As at September 30, 2016, Veresen Midstream had fully drawn its US$725 Term Loan B and $495 million from its $1,680 million (100%) expansion credit facility, using the proceeds to fund both the initial acquisition of assets from Encana and CRP and ongoing construction. By the end of the third quarter of 2016, Veresen Midstream had invested $1,157 million (100%) in the Sunrise, Tower and Saturn Phase II facilities.
Hythe/SteeprockIn the first quarter of 2015, the Hythe/Steeprock assets, while wholly owned by us, generated $20 million of distributable cash and $11 million of net income prior to the Veresen Midstream transaction closing on March 31, 2015. Fee volumes at Hythe/Steeprock averaged 392 mmcf/d for the three months ending March 31, 2015. During the first quarter of 2015, the Hythe/Steeprock facilities operated at reliability factors near 100%.
Aux SableNGL Market Overview
Three months endedSeptember 30
Nine months endedSeptember 30
2016 2015 2016 2015
Average USGC ethane margin (US$/gallon) (0.02) 0.02 0.02 0.03
Average USGC propane plus margin (US$/gallon) 0.29 0.23 0.30 0.29
Average USGC propane (US$/gallon) 0.47 0.41 0.45 0.47
Average Henry Hub natural gas (US$/mmbtu) 2.79 2.74 2.34 2.77
Average Chicago Citygate natural gas (US$/mmbtu) 2.78 2.79 2.30 2.93
Average WTI crude oil (US$/bbl) 44.94 46.44 41.33 51.01
Average Chicago - AECO differential ($/mmbtu) 1.29 0.75 1.21 0.90
U.S. Gulf Coast ("USGC") ethane margins were negatively impacted by record high inventory levels and several ethylene plant outages during the third quarter of 2016 with 14% of the U.S. ethylene capacity offline at the end of the quarter due to scheduled turnarounds and unplanned maintenance. Ethane is currently the most preferred feedstock for ethylene production, generating more favourable net margins over normal butane and propane. Ethane prices are expected to recover in the fourth quarter and into 2017 with the completion of plant turnarounds and five new ethylene units commencing operations in 2017.
Propane prices continued to strengthen and followed the overall trend set by crude despite inventory levels remaining high. U.S. propane stocks ended the quarter at 101 million barrels, five million barrels higher than the same period last year and 29 million barrels above the five-year average. Strong crop-drying demand, full export utilization and a cold winter are needed to provide relief for the persistent inventory overhang. Higher propane prices drove improving propane plus margins during the quarter relative to the same period last year, increasing propane margins US$0.06 per gallon. USGC propane prices averaged US$0.47 per gallon in the third quarter of 2016 compared to US$0.41 per gallon during the same period in 2015.
Consistently warmer than normal temperatures, which drove demand for power generation, along with a declining storage surplus, kept upward pressure on natural gas prices. The Chicago Citygate gas price averaged US$2.78 per mmbtu in the third quarter of 2016, decreasing $0.01 per mmbtu compared to the same

period last year. In contrast, the AECO gas market did not see any significant weather related increase in demand, resulting in a widening AECO - Chicago gas price differential in the third quarter of 2016.
Following the end of the third quarter and concurrent with Alliance's planned shut-down to accommodate the construction of a highway near Regina, Saskatchewan, Aux Sable's Channahon facility underwent a scheduled eight day turnaround.
Operational Highlights
Three months ended September 30 Nine months ended September 30
2016 2015 2016 2015
Average volume receipts (mmcf/d)
Prairie Rose Pipeline 111 94 105 98
Average sales (mmcf/d)
Ethane 16 17 27 20
Propane plus 49 41 49 45
Total NGLs 65 58 76 65
During the three and nine months ended September 30, 2016, Aux Sable processed nearly 95% and 96% of the natural gas delivered by Alliance compared to 95% and 93% for the same periods last year. The increase is primarily attributed to lower processing in 2015 due to bypassing volumes resulting from uneconomic margins, as well as planned and unplanned downtime.
Receipts into the Prairie Rose Pipeline in North Dakota averaged 111 mmcf/d and 105 mmcf/d during the three and nine months ended September 30, 2016, consistent with the 94 mmcf/d and 98 mmcf/d realized during the same periods last year.
Propane plus sales volumes increased to 49 mbbls/d during the third quarter of 2016 from 41 million during the same period last year resulting from reinjection due to oversupply in the market in 2015 and a six day shutdown of the Alliance Pipeline in the third quarter of 2015. Aux Sable produced 16 mbbls/d and 27 mbbls/d of ethane during the third quarter, increasing from the same period last year due to higher local demand.
Financial Highlights
Components of Aux Sable Equity Income:
Three months ended September 30 Nine months ended September 30
(Veresen's share; $ Millions) 2016 2015 2016 2015
Margin based lease revenues recognized 1 - 1 2
Pipeline capacity margin 1 (8) (2) (8)
Other margin based activities 1 (2) 2 (3)
Fixed fee activities 11 10 33 29General, administrative, operating andmaintenance (8) (6) (21) (16)
Provision for potential customer settlement - - - (16)
Depreciation, amortization and other (5) (4) (15) (11)Net income (loss) before tax / equity income(loss) 1 (10) (2) (23)
Distributable cash 2 (3) 8 7
For the three and nine months ended September 30, 2016, Aux Sable generated $2 million and $8 million of distributable cash and $1 million net income and $2 million net loss before tax, compared to $3 million and $7 million of distributable cash and net losses before tax of $10 million and $23 million during the same periods last year.

During the third quarter of 2016, Aux Sable's NGL Sales Agreement continued to provide downside protection against the weak NGL market environment, delivering the fixed fee and covering the Channahon facility's operating costs with no margin based lease revenues being generated.
Losses incurred in Aux Sable's pipeline capacity business during the third quarter of 2015 related to temporary disruptions in pipeline takeaway capacity creating gas market supply and demand imbalances.
Aux Sable's other margin-based activities increased this quarter relative to the same period last year due to higher NGL fractionation margins realized at its Palermo Conditioning Plant in North Dakota.
Year-to-date distributable cash and net loss before tax reflect the same factors discussed above. A $16 million provision was recognized in the second quarter of 2015 in respect of potential adjustments relating to Aux Sable customer obligations.
Power Business
Three months ended September 30 Nine months ended September 30
($ Millions, except where noted) 2016 2015 2016 2015
Loss on interest rate hedges (2) (6) (12) (6)Other equity income (1) - 5 2Equity loss (3) (6) (7) (4)EBITDA from wholly and majority-ownedbusinesses 13 11 39 31Depreciation and amortization (8) (9) (27) (23)Interest and other finance (3) (2) (8) (7)Net loss before tax (1) (6) (3) (3)Distributable cash 10 10 34 29Volumes (GWh)Gross 217 154 729 527Net 177 133 594 448
Operational HighlightsFor the three and nine months ended September 30, 2016, our power facilities operated in line with our expectations, providing consistent earnings compared to the same periods last year. Our BC run-of-river hydro facilities continue to benefit from higher water flows in 2016, and all of our facilities, including the St. Columban and Grand Valley Phase III wind facilities which commenced operations in the second half of 2015, have performed reliably.
Financial HighlightsFor the three and nine months ended September 30, 2016, distributable cash was $10 million and $34 million compared to $10 million and $29 million generated during the same periods last year.
Third quarter distributable cash in 2016 was comparable to the same period last year. Year-to-date, incremental earnings from our St.Columban and Grand Valley Phase III wind facilities and higher water flows at our BC run-of-river hydro facilities provided higher distributable cash compared to the same period last year.
Net loss before tax in the third quarter and on a year-to-date basis in both 2016 and 2015 reflect losses on interest rate hedges. Year-to-date results also reflect incremental depreciation on our new facilities in 2016 relative to the same periods last year.

Veresen-CorporateThree months ended
September 30Nine months ended September
30($ Millions) 2016 2015 2016 2015Equity loss - 3 5 10General & administrative 11 3 27 20Project development 26 19 104 56Depreciation and amortization 1 1 3 2Interest and other finance 8 11 24 31Foreign exchange and other - (2) - (6)Net expenses before tax 46 35 163 113Distributable cash (17) (10) (49) (44)
For the three and nine months ended September 30, 2016, we incurred $46 million and $163 million of net corporate expenses before taxes, an $11 million and $50 million increase compared to the same periods last year. The increase in the third quarter reflects higher project development spending related to our Jordan Cove LNG project, and higher general and administrative costs which were primarily driven by the upward revaluation of our long-term incentive plans in 2016 due to an increase in our share price compared to the downward revaluation recognized in the third quarter of 2015. This was partially offset by lower interest costs due to an interest make-whole payment received upon early settlement of a loan to a jointly-controlled business.
The increase in corporate costs during the nine months ending September 30, 2016 reflect the same factors impacting the third quarter, partially offset by higher interest costs in the first quarter of 2015 driven by higher debt levels relating to the acquisition of Ruby at the end of 2014.
Taxes
Three months ended September 30 Nine months ended September 30($ Millions) 2016 2015 2016 2015Net income from continuing operations
before tax 33 15 75 95Current tax (3) (9) (8) (30)Deferred tax (5) 8 (13) 8Total tax (8) (1) (21) (22)Effective rate 24% 7% 28% 23%
Our effective tax rate for the three and nine months ended September 30, 2016 is comparatively higher to the same periods in 2015 as a result of the mix of income between the U.S. and Canada, fewer available foreign tax credits and the U.S.-based organizational restructuring we implemented on January 1, 2016 which, while deferring cash taxes with the exception of Part VI.1 taxes on our Preferred Share dividends for approximately the next five years, resulted in a taxable capital gain with no corresponding accounting income.
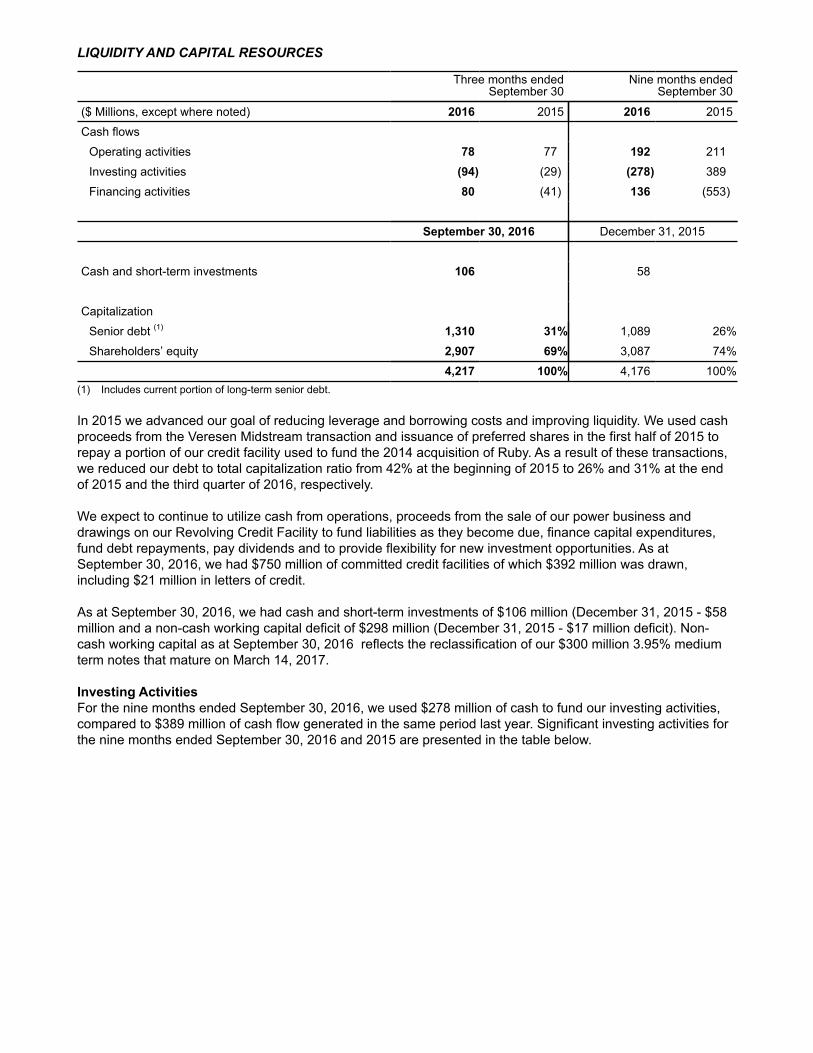
LIQUIDITY AND CAPITAL RESOURCES
Three months endedSeptember 30
Nine months endedSeptember 30
($ Millions, except where noted) 2016 2015 2016 2015
Cash flows
Operating activities 78 77 192 211
Investing activities (94) (29) (278) 389
Financing activities 80 (41) 136 (553)
September 30, 2016 December 31, 2015
Cash and short-term investments 106 58
Capitalization
Senior debt (1) 1,310 31% 1,089 26%
Shareholders’ equity 2,907 69% 3,087 74%
4,217 100% 4,176 100%(1) Includes current portion of long-term senior debt.
In 2015 we advanced our goal of reducing leverage and borrowing costs and improving liquidity. We used cash proceeds from the Veresen Midstream transaction and issuance of preferred shares in the first half of 2015 to repay a portion of our credit facility used to fund the 2014 acquisition of Ruby. As a result of these transactions, we reduced our debt to total capitalization ratio from 42% at the beginning of 2015 to 26% and 31% at the end of 2015 and the third quarter of 2016, respectively.
We expect to continue to utilize cash from operations, proceeds from the sale of our power business and drawings on our Revolving Credit Facility to fund liabilities as they become due, finance capital expenditures, fund debt repayments, pay dividends and to provide flexibility for new investment opportunities. As at September 30, 2016, we had $750 million of committed credit facilities of which $392 million was drawn, including $21 million in letters of credit.
As at September 30, 2016, we had cash and short-term investments of $106 million (December 31, 2015 - $58 million and a non-cash working capital deficit of $298 million (December 31, 2015 - $17 million deficit). Non-cash working capital as at September 30, 2016 reflects the reclassification of our $300 million 3.95% medium term notes that mature on March 14, 2017.
Investing Activities For the nine months ended September 30, 2016, we used $278 million of cash to fund our investing activities, compared to $389 million of cash flow generated in the same period last year. Significant investing activities for the nine months ended September 30, 2016 and 2015 are presented in the table below.

Nine months ended September 30
($ Millions) 2016 2015
Acquisitions and dispositions
Proceeds from sale of assets 81 420
Investments in jointly-controlled businesses
Equity contributions (308) (41)
Return of capital 11 26
(297) (15)
Capital expenditures
Burstall (46) (7)
Dasque-Middle run-of-river hydro facility - (4)
St. Columban wind project (11) (29)
Other capital expenditures (8) (9)
(65) (49)
Other 3 (1)
Cash provided by in discontinued operations - 34
Investing (278) 389
Financing Activities For the nine months ended September 30, 2016, we had a net cash inflow of $136 million from our financing activities, compared to a net outflow of $553 million for the same period last year. Financing activities for the nine months ended September 30, 2016 and 2015 included:
Nine months ended September 30
($ Millions) 2016 2015
Common Share dividend payments (101) (79)
Net draws on Revolving Credit Facility 224 83
Senior debt repayments (8) (734)
Preferred Shares issued, net of issue costs - 194
Preferred Share dividend payments (19) (17)
Repayment from jointly-controlled businesses 41 -
Other (1) -
Financing 136 (553)
Equity Financing Activities Following our August 3, 2016 announcement of our intention to sell our power business we suspended our Premium Dividend™ and Dividend Reinvestment Plan (“DRIP”) commencing with the August 2016 dividend.
Prior to this announcement eligible shareholders participated in the Premium Dividend™ component of the Dividend Reinvestment Plan ("DRIP") which entitled such shareholders to reinvest their dividends in Common Shares issued from treasury and to have such Common Shares exchanged for a premium cash payment equal to 102% of the cash dividend that such shareholders would otherwise be entitled to receive on the applicable dividend payment date.
Debt Financing Activities On March 31, 2015 we used the $420 million in cash we received from Veresen Midstream to partially repay our Acquisition Credit Facility related to the Ruby acquisition in the fourth quarter of 2014. Proceeds from our April1, 2015 issuance of the Series E Preferred Shares were further used to repay a portion of the Acquisition CreditFacility.
On July 31, 2015, our Revolving Credit Facility was increased from $550 million to $750 million. In October 2016, the term was extended such that it now matures on May 31, 2020.
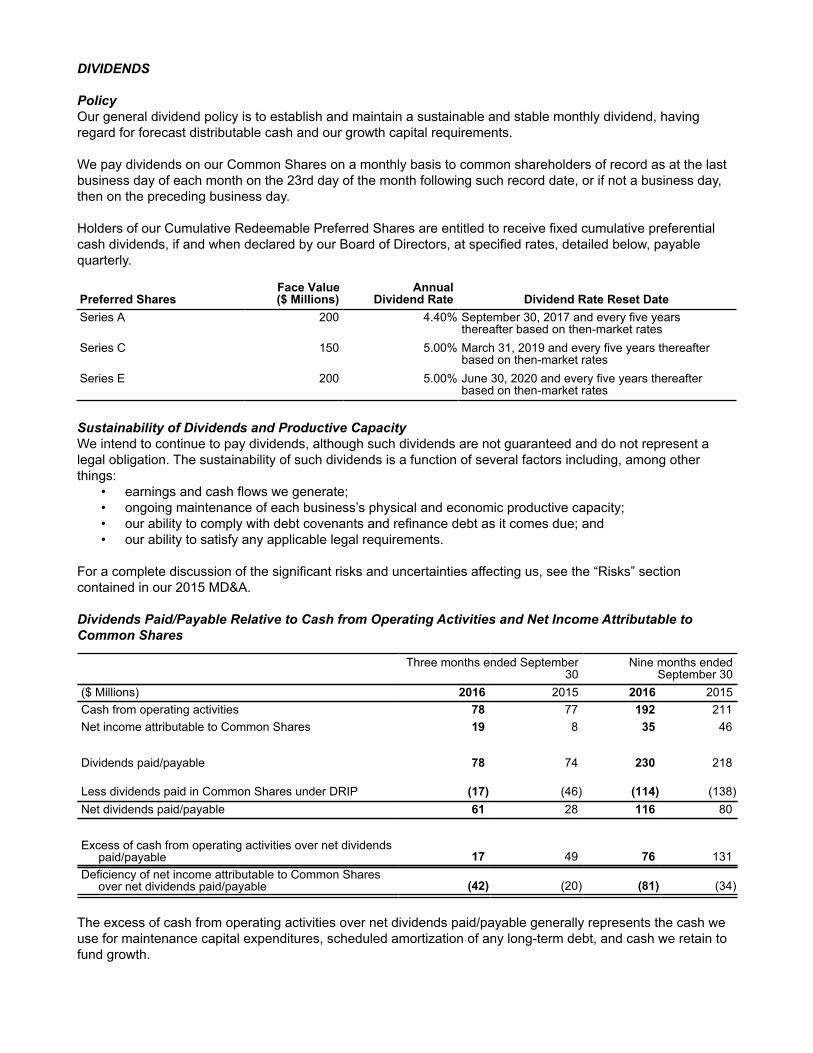
DIVIDENDS
PolicyOur general dividend policy is to establish and maintain a sustainable and stable monthly dividend, having regard for forecast distributable cash and our growth capital requirements.
We pay dividends on our Common Shares on a monthly basis to common shareholders of record as at the last business day of each month on the 23rd day of the month following such record date, or if not a business day, then on the preceding business day.
Holders of our Cumulative Redeemable Preferred Shares are entitled to receive fixed cumulative preferential cash dividends, if and when declared by our Board of Directors, at specified rates, detailed below, payable quarterly.
Preferred SharesFace Value($ Millions)
AnnualDividend Rate Dividend Rate Reset Date
Series A 200 4.40% September 30, 2017 and every five yearsthereafter based on then-market rates
Series C 150 5.00% March 31, 2019 and every five years thereafterbased on then-market rates
Series E 200 5.00% June 30, 2020 and every five years thereafterbased on then-market rates
Sustainability of Dividends and Productive CapacityWe intend to continue to pay dividends, although such dividends are not guaranteed and do not represent a legal obligation. The sustainability of such dividends is a function of several factors including, among other things:
• earnings and cash flows we generate;• ongoing maintenance of each business’s physical and economic productive capacity;• our ability to comply with debt covenants and refinance debt as it comes due; and• our ability to satisfy any applicable legal requirements.
For a complete discussion of the significant risks and uncertainties affecting us, see the “Risks” section contained in our 2015 MD&A.
Dividends Paid/Payable Relative to Cash from Operating Activities and Net Income Attributable to Common Shares
Three months ended September30
Nine months endedSeptember 30
($ Millions) 2016 2015 2016 2015Cash from operating activities 78 77 192 211Net income attributable to Common Shares 19 8 35 46
Dividends paid/payable 78 74 230 218
Less dividends paid in Common Shares under DRIP (17) (46) (114) (138)Net dividends paid/payable 61 28 116 80
Excess of cash from operating activities over net dividendspaid/payable 17 49 76 131
Deficiency of net income attributable to Common Shares over net dividends paid/payable (42) (20) (81) (34)
The excess of cash from operating activities over net dividends paid/payable generally represents the cash we use for maintenance capital expenditures, scheduled amortization of any long-term debt, and cash we retain to fund growth.

Net income attributable to Common Shares is generally less than dividends paid/payable as our net income includes certain non-cash expenses such as depreciation and deferred tax, and can include unrealized foreign exchange and fair value gains and losses which are not reflected in calculating the amount of cash available for the payment of dividends. In the first quarter of 2015, net income attributable to Common Shares exceeded dividends paid/payable due to the $37 million gain relating to the sale of our Hythe/Steeprock assets to Veresen Midstream.
FINANCIAL INSTRUMENTS
We and our jointly-controlled businesses periodically enter into interest rate hedges to manage interest rate exposures. For the three and nine months ended September 30, 2016, equity income and loss from our Power business includes a $2 million and $12 million unrealized mark-to-market loss ($1 million and $9 million after tax), associated with interest rate hedges. For the same periods last year, equity income from our Power business includes a $6 million and $6 million unrealized mark-to-market gain ($4 million and $5 million after tax).
During the first quarter of 2015, Veresen Midstream entered into a cross currency swap to manage both interest rate and foreign exchange rate exposures on its US$575 million drawn Term Loan B. During the third quarter of 2016, Veresen Midstream entered into an additional cross currency swap following the incremental US$150 million Term Loan B issued in the period. For the three and nine months ended September 30, 2016, equity income from Veresen Midstream includes a $3 million unrealized mark-to-market gain and $22 million unrealized mark-to-market loss ($2 million gain and $16 million loss after tax) associated with the cross currency swaps. For the same periods last year, equity income and loss from Veresen Midstream includes a $26 million and $21 million unrealized mark-to-market loss ($19 million and $16 million after tax).
CONTRACTUAL OBLIGATIONS AND COMMITMENTS
On March 30, 2012, a Statement of Claim was filed against the Company’s equity-accounted investees, Aux Sable Liquid Products, L.P., Aux Sable Canada L.P., Aux Sable Extraction LP and Aux Sable Canada Ltd., relating to differences in interpretation of certain terms of the NGL Sales Agreement. On October 14, 2016, an Amended Statement of Claim was filed, disputing the application by Aux Sable of certain additional elements of the NGL Sales Agreement. Aux Sable will fully defend its position in this matter and at this time, is unable to predict the likely outcome. Management believes the amount of estimated loss accrued in the financial statements is consistent with requirements under US GAAP. We will continue to assess the matter and the amount of loss accrued may change in the future.
On April 15, 2015, Aux Sable received a Notice and Finding of Violation from the United States Environmental Protection Agency ("EPA") for exceedances of permitted limits for Volatile Organic Compounds at Aux Sable's Channahon, Illinois Facility. Aux Sable is engaged in discussions with the EPA to resolve the matter. The initial EPA proposal confirms the settlement amount will not be material.
NEW ACCOUNTING STANDARDS
Adoption of New StandardsEffective January 1, 2016, the we adopted Accounting Standards Update (“ASU”) 2014-10, "Development Stage Entities: Elimination of Certain Financial Reporting Requirements, Including an Amendment to Variable Interest Entities Guidance in Topic 810, Consolidation". This ASU eliminates the concept of a development-stage entity from US GAAP along with the associated presentation and disclosure requirements for development-stage entities. The consolidation guidance was also amended to eliminate the development stage entity relief when applying the variable interest entity model and evaluating the sufficiency of equity at risk. This guidance was applied retrospectively and did not have a material impact to us.
Effective January 1, 2016, we adopted ASU 2014-16, “Derivatives and Hedging.” This ASU provides guidance to clarify the criteria in evaluating the economic characteristics and risks of a host contract in a hybrid financial instrument that is issued in the form of a share. This guidance was applied retrospectively and did not have a material impact to us.
Effective January 1, 2016, we adopted ASU 2015-01, "Income Statement - Extraordinary and Unusual Items". This ASU simplifies income statement classification by removing the concept of extraordinary items from US GAAP. This guidance was applied retrospectively and did not have a material impact to us.

Effective January 1, 2016, we adopted ASU 2015-02, “Consolidation: Amendments to the Consolidation Analysis". This ASU amends the current consolidation guidance, specifically the guidance in determining whether or not an entity is a variable interest entity. We have various limited partnerships which are now considered to be Variable Interest Entities (“VIE”). The only impact of this guidance is to add further note disclosure around the limited partnerships that now are considered VIEs.
Effective January 1, 2016, we adopted ASU 2015-03, "Interest - Simplifying the Presentation of Debt Issuance Costs". This ASU changes the presentation of debt issue costs in financial statements. Under the ASU, an entity presents such costs in the balance sheet as a direct reduction from the related debt liability rather than as an asset. Amortization of the costs is reported as interest expense. This guidance was applied retrospectively. As a result, certain comparative figures were restated. For the comparative period ending December 31, 2015, $11 million of debt issuance costs formerly held as other assets are classified with long-term senior debt on the Consolidated Statement of Financial Position.
Effective January 1, 2016, we adopted ASU 2015-10, "Technical Corrections and Improvements". This ASU represents changes to clarify the Codification, correct unintended application of guidance, or make minor improvements to the Codification that are not expected to have a significant effect on current accounting practice. This guidance was applied prospectively and did not have a material impact to us.
Future accounting policy changesIn May 2014, the FASB issued ASU 2014-09, "Revenue from Contracts with Customers". This ASU provides guidance for changes in criteria for revenue recognition from contracts with customers. Additionally, in April 2016, the FASB issued ASU 2016-10, "Revenue from Contracts with Customers: Identifying Performance Obligations and Licensing" which provides guidance on identifying performance obligations and licensing. Further in May 2016, the FASB issued ASU 2016-12, "Revenue from Contracts with Customers: Narrow-Scope Improvements and Practical Expedients" which provides guidance to address certain issues assessing collectibility, presentation of sales taxes, non cash consideration and completed contracts and contract modifications at transition. All guidance is effective for annual and interim periods beginning after December 15, 2016, and is to be applied retrospectively. In August 2015, the FASB issued ASU 2015-14, "Revenue from Contracts with Customers - Deferral of the effective date". This ASU defers the effective date of ASU 2014-09 for all entities by one year. This guidance is therefore effective for annual and interim periods beginning after December 15, 2017. We are currently evaluating the impact of the standard.
In November 2015, the Financial Accounting Standards Board ("FASB") issued ASU 2015-017, "Income Taxes: Balance Sheet Classification of Deferred Taxes". This ASU changes the classification of deferred tax liabilities and assets. Under the ASU, an entity classifies deferred tax liabilities and assets as non-current in the statement of financial position. This guidance is effective for annual and interim periods beginning after December 15, 2016 and is to be applied on a retrospective or prospective basis. We do not expect the standard to have a material impact.
In January 2016, the FASB issued ASU 2016-01, "Financial Instruments - Overall: Recognition and Measurement of Financial Assets and Liabilities". This ASU addresses certain aspects of the guidance regarding recognition, measurement, presentation and disclosure of financial instruments, specifically the guidance for measuring the fair value of equity investments. This guidance is effective for annual and interim periods beginning after December 15, 2017, and is to be applied by means of a cumulative-effect adjustment to the Statement of Financial Position as of the beginning of the fiscal year of adoption, with amendments related to equity securities without readily determinable fair values to be applied prospectively. We do not expect the standard to have a material impact.
In February 2016, the FASB issued ASU 2016-02, "Leases". This ASU addresses the recognition, measurement, presentation and disclosure in the financial statements of the assets and liabilities related to operating leases. This guidance is effective for annual and interim periods beginning after December 15, 2018. We are currently evaluating the impact of the standard.
In March 2016, the FASB issued ASU 2016-07, "Investments - Equity Method and Joint Ventures: Simplifying the Transition to the Equity Method of Accounting". This ASU eliminates the requirement for an investor to adjust the investment, results of operations, and retained earnings retroactively on a step-by-step basis as if the equity method had been in effect during all previous periods that the investment had been held, in the event that an investment qualifies for use of the equity method as a result of an increase in the level of ownership interest or
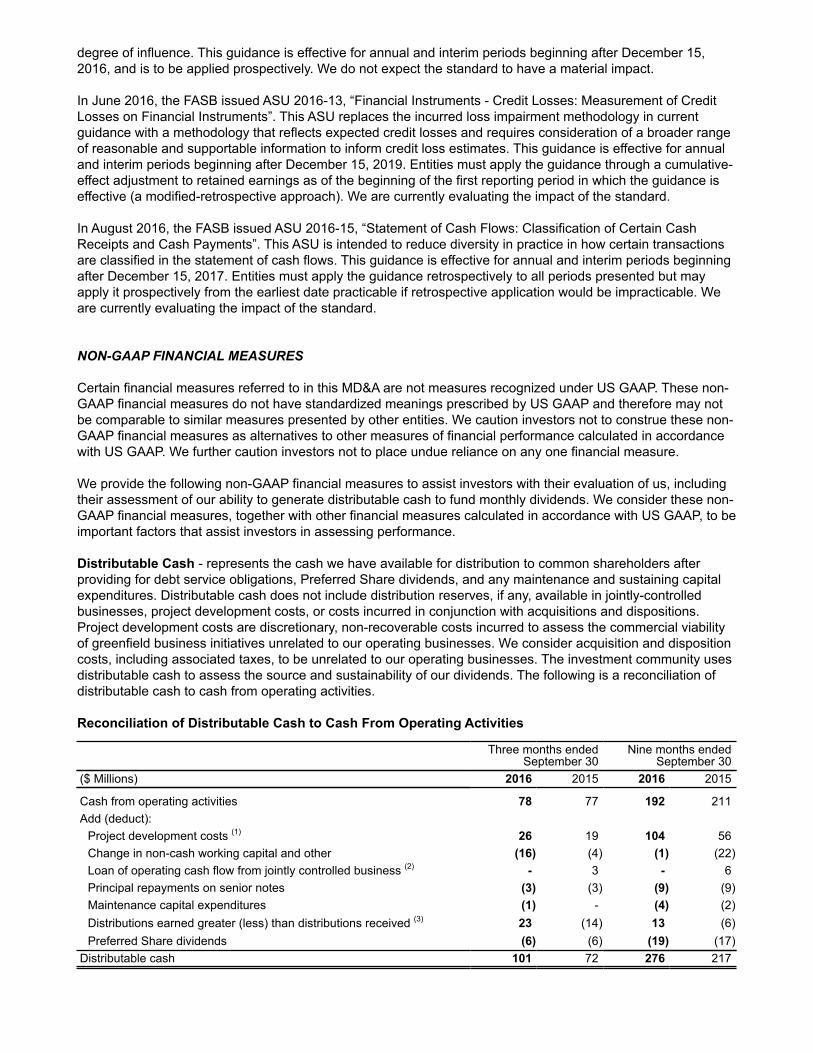
degree of influence. This guidance is effective for annual and interim periods beginning after December 15, 2016, and is to be applied prospectively. We do not expect the standard to have a material impact.
In June 2016, the FASB issued ASU 2016-13, “Financial Instruments - Credit Losses: Measurement of Credit Losses on Financial Instruments”. This ASU replaces the incurred loss impairment methodology in current guidance with a methodology that reflects expected credit losses and requires consideration of a broader range of reasonable and supportable information to inform credit loss estimates. This guidance is effective for annual and interim periods beginning after December 15, 2019. Entities must apply the guidance through a cumulative-effect adjustment to retained earnings as of the beginning of the first reporting period in which the guidance is effective (a modified-retrospective approach). We are currently evaluating the impact of the standard.
In August 2016, the FASB issued ASU 2016-15, “Statement of Cash Flows: Classification of Certain Cash Receipts and Cash Payments”. This ASU is intended to reduce diversity in practice in how certain transactions are classified in the statement of cash flows. This guidance is effective for annual and interim periods beginning after December 15, 2017. Entities must apply the guidance retrospectively to all periods presented but may apply it prospectively from the earliest date practicable if retrospective application would be impracticable. We are currently evaluating the impact of the standard.
NON-GAAP FINANCIAL MEASURES
Certain financial measures referred to in this MD&A are not measures recognized under US GAAP. These non-GAAP financial measures do not have standardized meanings prescribed by US GAAP and therefore may not be comparable to similar measures presented by other entities. We caution investors not to construe these non-GAAP financial measures as alternatives to other measures of financial performance calculated in accordance with US GAAP. We further caution investors not to place undue reliance on any one financial measure.
We provide the following non-GAAP financial measures to assist investors with their evaluation of us, including their assessment of our ability to generate distributable cash to fund monthly dividends. We consider these non-GAAP financial measures, together with other financial measures calculated in accordance with US GAAP, to be important factors that assist investors in assessing performance.
Distributable Cash - represents the cash we have available for distribution to common shareholders after providing for debt service obligations, Preferred Share dividends, and any maintenance and sustaining capital expenditures. Distributable cash does not include distribution reserves, if any, available in jointly-controlled businesses, project development costs, or costs incurred in conjunction with acquisitions and dispositions. Project development costs are discretionary, non-recoverable costs incurred to assess the commercial viability of greenfield business initiatives unrelated to our operating businesses. We consider acquisition and disposition costs, including associated taxes, to be unrelated to our operating businesses. The investment community uses distributable cash to assess the source and sustainability of our dividends. The following is a reconciliation of distributable cash to cash from operating activities.
Reconciliation of Distributable Cash to Cash From Operating Activities
Three months endedSeptember 30
Nine months endedSeptember 30
($ Millions) 2016 2015 2016 2015
Cash from operating activities 78 77 192 211Add (deduct):
Project development costs (1) 26 19 104 56Change in non-cash working capital and other (16) (4) (1) (22)Loan of operating cash flow from jointly controlled business (2) - 3 - 6Principal repayments on senior notes (3) (3) (9) (9)Maintenance capital expenditures (1) - (4) (2)Distributions earned greater (less) than distributions received (3) 23 (14) 13 (6)Preferred Share dividends (6) (6) (19) (17)
Distributable cash 101 72 276 217
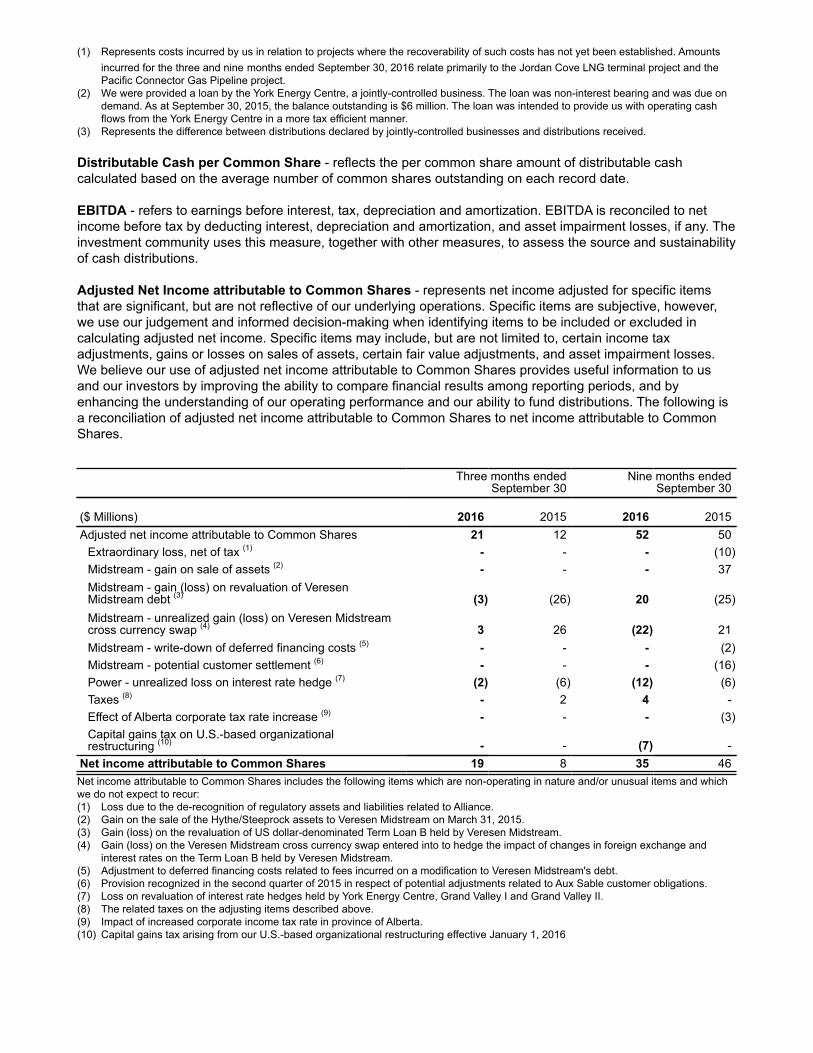
(1) Represents costs incurred by us in relation to projects where the recoverability of such costs has not yet been established. Amounts incurred for the three and nine months ended September 30, 2016 relate primarily to the Jordan Cove LNG terminal project and the Pacific Connector Gas Pipeline project.
(2) We were provided a loan by the York Energy Centre, a jointly-controlled business. The loan was non-interest bearing and was due on demand. As at September 30, 2015, the balance outstanding is $6 million. The loan was intended to provide us with operating cash flows from the York Energy Centre in a more tax efficient manner.
(3) Represents the difference between distributions declared by jointly-controlled businesses and distributions received.
Distributable Cash per Common Share - reflects the per common share amount of distributable cash calculated based on the average number of common shares outstanding on each record date.
EBITDA - refers to earnings before interest, tax, depreciation and amortization. EBITDA is reconciled to net income before tax by deducting interest, depreciation and amortization, and asset impairment losses, if any. The investment community uses this measure, together with other measures, to assess the source and sustainability of cash distributions.
Adjusted Net Income attributable to Common Shares - represents net income adjusted for specific items that are significant, but are not reflective of our underlying operations. Specific items are subjective, however, we use our judgement and informed decision-making when identifying items to be included or excluded in calculating adjusted net income. Specific items may include, but are not limited to, certain income tax adjustments, gains or losses on sales of assets, certain fair value adjustments, and asset impairment losses. We believe our use of adjusted net income attributable to Common Shares provides useful information to us and our investors by improving the ability to compare financial results among reporting periods, and by enhancing the understanding of our operating performance and our ability to fund distributions. The following is a reconciliation of adjusted net income attributable to Common Shares to net income attributable to Common Shares.
Three months endedSeptember 30
Nine months endedSeptember 30
($ Millions) 2016 2015 2016 2015Adjusted net income attributable to Common Shares 21 12 52 50
Extraordinary loss, net of tax (1) - - - (10)Midstream - gain on sale of assets (2) - - - 37Midstream - gain (loss) on revaluation of Veresen Midstream debt (3) (3) (26) 20 (25)Midstream - unrealized gain (loss) on Veresen Midstream cross currency swap (4) 3 26 (22) 21Midstream - write-down of deferred financing costs (5) - - - (2)Midstream - potential customer settlement (6) - - - (16)Power - unrealized loss on interest rate hedge (7) (2) (6) (12) (6)Taxes (8) - 2 4 -Effect of Alberta corporate tax rate increase (9) - - - (3)Capital gains tax on U.S.-based organizational restructuring (10) - - (7) -
Net income attributable to Common Shares 19 8 35 46Net income attributable to Common Shares includes the following items which are non-operating in nature and/or unusual items and which we do not expect to recur:(1) Loss due to the de-recognition of regulatory assets and liabilities related to Alliance.(2) Gain on the sale of the Hythe/Steeprock assets to Veresen Midstream on March 31, 2015.(3) Gain (loss) on the revaluation of US dollar-denominated Term Loan B held by Veresen Midstream.(4) Gain (loss) on the Veresen Midstream cross currency swap entered into to hedge the impact of changes in foreign exchange and
interest rates on the Term Loan B held by Veresen Midstream.(5) Adjustment to deferred financing costs related to fees incurred on a modification to Veresen Midstream's debt.(6) Provision recognized in the second quarter of 2015 in respect of potential adjustments related to Aux Sable customer obligations.(7) Loss on revaluation of interest rate hedges held by York Energy Centre, Grand Valley I and Grand Valley II.(8) The related taxes on the adjusting items described above.(9) Impact of increased corporate income tax rate in province of Alberta.(10) Capital gains tax arising from our U.S.-based organizational restructuring effective January 1, 2016
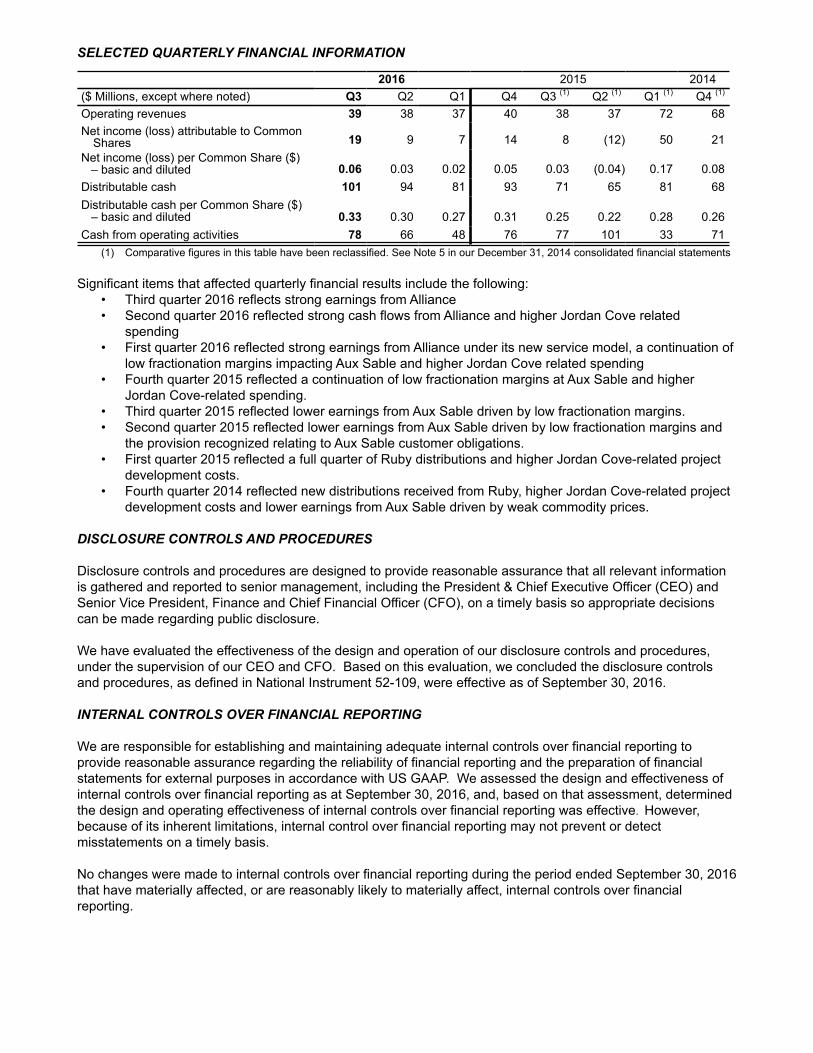
SELECTED QUARTERLY FINANCIAL INFORMATION
2016 2015 2014($ Millions, except where noted) Q3 Q2 Q1 Q4 Q3 (1) Q2 (1) Q1 (1) Q4 (1)
Operating revenues 39 38 37 40 38 37 72 68Net income (loss) attributable to Common
Shares 19 9 7 14 8 (12) 50 21Net income (loss) per Common Share ($) – basic and diluted 0.06 0.03 0.02 0.05 0.03 (0.04) 0.17 0.08Distributable cash 101 94 81 93 71 65 81 68Distributable cash per Common Share ($) – basic and diluted 0.33 0.30 0.27 0.31 0.25 0.22 0.28 0.26Cash from operating activities 78 66 48 76 77 101 33 71
(1) Comparative figures in this table have been reclassified. See Note 5 in our December 31, 2014 consolidated financial statements
Significant items that affected quarterly financial results include the following:• Third quarter 2016 reflects strong earnings from Alliance• Second quarter 2016 reflected strong cash flows from Alliance and higher Jordan Cove related
spending• First quarter 2016 reflected strong earnings from Alliance under its new service model, a continuation of
low fractionation margins impacting Aux Sable and higher Jordan Cove related spending• Fourth quarter 2015 reflected a continuation of low fractionation margins at Aux Sable and higher
Jordan Cove-related spending.• Third quarter 2015 reflected lower earnings from Aux Sable driven by low fractionation margins.• Second quarter 2015 reflected lower earnings from Aux Sable driven by low fractionation margins and
the provision recognized relating to Aux Sable customer obligations.• First quarter 2015 reflected a full quarter of Ruby distributions and higher Jordan Cove-related project
development costs.• Fourth quarter 2014 reflected new distributions received from Ruby, higher Jordan Cove-related project
development costs and lower earnings from Aux Sable driven by weak commodity prices.
DISCLOSURE CONTROLS AND PROCEDURES
Disclosure controls and procedures are designed to provide reasonable assurance that all relevant information is gathered and reported to senior management, including the President & Chief Executive Officer (CEO) and Senior Vice President, Finance and Chief Financial Officer (CFO), on a timely basis so appropriate decisions can be made regarding public disclosure.
We have evaluated the effectiveness of the design and operation of our disclosure controls and procedures, under the supervision of our CEO and CFO. Based on this evaluation, we concluded the disclosure controls and procedures, as defined in National Instrument 52-109, were effective as of September 30, 2016.
INTERNAL CONTROLS OVER FINANCIAL REPORTING
We are responsible for establishing and maintaining adequate internal controls over financial reporting to provide reasonable assurance regarding the reliability of financial reporting and the preparation of financial statements for external purposes in accordance with US GAAP. We assessed the design and effectiveness of internal controls over financial reporting as at September 30, 2016, and, based on that assessment, determined the design and operating effectiveness of internal controls over financial reporting was effective. However, because of its inherent limitations, internal control over financial reporting may not prevent or detect misstatements on a timely basis.
No changes were made to internal controls over financial reporting during the period ended September 30, 2016 that have materially affected, or are reasonably likely to materially affect, internal controls over financial reporting.

Veresen Inc.
Consolidated Statement of Financial Position
(Canadian $ Millions; number of shares in Millions; unaudited) September 30, 2016 December 31, 2015
AssetsCurrent assets
Cash and short-term investments 106 58Restricted cash 3 7Distributions receivable 66 52Accounts receivable and other 42 36
217 153
Investments in jointly-controlled businesses (note 4) 1,486 1,312Investments held at cost (note 7) 1,878 1,981Pipeline, plant and other capital assets (note 3) 890 919Intangible assets (note 3) 150 151Due from jointly-controlled businesses (note 14) 3 42Other assets 7 2
4,631 4,560
LiabilitiesCurrent liabilities
Payables 65 65Deferred revenue 2 2Dividends payable 26 25Current portion of long-term senior debt (note 5) 313 13
406 105
Long-term senior debt (note 5) 997 1,076Deferred tax liabilities 278 256Other long-term liabilities 43 36
1,724 1,473
Shareholders’ EquityShare capital (note 6) Preferred Shares 536 536 Common Shares (314 and 299 outstanding at September
30, 2016 and December 31, 2015, respectively) 3,482 3,354Additional paid-in capital (note 4) 28 4Cumulative other comprehensive income 224 359Accumulated deficit (1,363) (1,166)
2,907 3,0874,631 4,560
Commitments and Contingencies (note 11)Variable Interest Entities (note 13)See accompanying Notes to the Consolidated Financial Statements

Veresen Inc.
Consolidated Statement of Income
(Canadian $ Millions, except per Common ShareThree months ended
September 30Nine months ended
September 30amounts (note 6); unaudited) 2016 2015 2016 2015
Equity income (note 4) 44 15 132 57Dividend income 30 30 90 85Operating revenues 39 37 114 147Operations and maintenance (15) (15) (44) (60)General and administrative (14) (6) (37) (33)Project development (26) (19) (104) (56)Depreciation and amortization (13) (15) (41) (46)Interest and other finance (12) (14) (35) (42)Foreign exchange and other (note 7) - 2 - 6Gain on sale of assets (note 3) - - - 37Net income before tax 33 15 75 95Current tax (3) (9) (8) (30)Deferred tax (5) 8 (13) 8Net income, before extraordinary loss 25 14 54 73Extraordinary loss, net of tax (note 12) - - - (10)Net income 25 14 54 63Preferred Share dividends (6) (6) (19) (17)Net income attributable to Common Shares 19 8 35 46
Continuing operations 0.06 0.03 0.11 0.20 Extraordinary loss - - - (0.04)Net income per Common Share 0.06 0.03 0.11 0.16
Consolidated Statement of Comprehensive Income (Loss)
Three months endedSeptember 30
Nine months endedSeptember 30
(Canadian $ Millions; unaudited) 2016 2015 2016 2015
Net income 25 14 54 63Other comprehensive income (loss) Unrealized foreign exchange gain (loss) on translation 21 176 (135) 338Other comprehensive income (loss) 21 176 (135) 338Comprehensive income (loss) 46 190 (81) 401Preferred Share dividends (6) (6) (19) (17)Comprehensive income (loss) attributable to Common Shares 40 184 (100) 384
See accompanying Notes to the Consolidated Financial Statements

Veresen Inc.
Consolidated Statement of Cash FlowsThree months ended
September 30Nine months ended
September 30(Canadian $ Millions; unaudited) 2016 2015 2016 2015Operating
Net income 25 14 54 63Equity income (44) (15) (132) (57)Distributions from jointly-controlled businesses 75 67 208 168Depreciation and amortization 13 15 41 46Foreign exchange and other non-cash items 2 3 3 13Deferred tax 5 (9) 13 (9)Gain on sale of assets (note 3) - - - (37)Extraordinary loss, net of tax (note 12) - - - 10Changes in non-cash working capital (note 9) 2 2 5 14
78 77 192 211Investing
Proceeds from sale of assets (note 10) 81 - 81 420Proceeds from sale of discontinued operations - - - 34Investments in jointly-controlled businesses (157) (14) (308) (41)Return of capital from jointly-controlled businesses 5 1 11 26Pipeline, plant and other capital assets (23) (17) (65) (49)Other - 1 3 (1)
(94) (29) (278) 389Financing
Long-term debt repaid (2) (114) (8) (734)Net change in credit facilities 92 84 224 83Preferred Shares issued, net of issue costs - - - 194Common Share dividends paid (44) (28) (101) (79)Preferred Share dividends paid (6) (6) (19) (17)Repayments from jointly-controlled businesses 41 25 41 -Other (1) (2) (1) -
80 (41) 136 (553)Increase in cash and short-term investments 64 7 50 47Effect of foreign exchange rate changes on cash and
short-term investments - 7 (2) 10Cash and short-term investments at the beginning of the
period 42 94 58 51Cash and short-term investments at the end of the period 106 108 106 108
See accompanying Notes to the Consolidated Financial Statements

Veresen Inc.
Consolidated Statement of Shareholders' EquityNine months ended September 30
(Canadian $ Millions; unaudited) 2016 2015Preferred SharesJanuary 1 536 342Series E Preferred Shares issued, net of issue costs - 194Balance at the end of the period 536 536
Common SharesJanuary 1 3,354 3,186Common Shares issued under Premium Dividend and Dividend Reinvestment Plan
("DRIP") 128 122Balance at the end of the period 3,482 3,308
Additional paid-in capitalJanuary 1 4 4Additional paid-in capital (note 4) 24 -Balance at the end of the period 28 4
Cumulative other comprehensive incomeJanuary 1 359 (65)Other comprehensive income (loss) (135) 338Balance at the end of the period 224 273
Accumulated deficitJanuary 1 (1,166) (935)Net income 54 63Preferred Share dividends (19) (17)Common Share dividends (232) (217)Balance at the end of the period (1,363) (1,106)
Shareholders' Equity 2,907 3,015
See accompanying Notes to the Consolidated Financial Statements

Notes to the Consolidated Financial Statements
Three and nine months ended September 30, 2016 and 2015 (Canadian $ Millions, except where noted; unaudited)
1. Basis of Presentation
These unaudited interim consolidated financial statements of Veresen Inc. (“Veresen” or the “Company”) have been prepared by management in accordance with accounting principles generally accepted in the United States of America (“US GAAP”).
Amounts are stated in millions of Canadian dollars unless otherwise indicated.
The preparation of financial statements in accordance with US GAAP requires management to make estimates and assumptions that affect the reported amounts of assets, liabilities, revenues, expenses, financial instruments and taxes. Actual amounts could differ from these estimates. Significant estimates used in the preparation of these consolidated financial statements relate to the determination of any impairment in the carrying value of long-term assets, the estimated useful lives over which certain assets are depreciated or amortized, and the measurement of asset retirement obligations, and contingencies.
These consolidated financial statements include the accounts of the Company and its subsidiaries. The Company consolidates its interest in entities over which it is able to exercise control. To the extent there are interests owned by other parties, the other parties’ interests are included in Non-Controlling Interest. Veresen accounts for its jointly-controlled businesses using the equity method, and its investment in Ruby Pipeline Holding Company LLC ("Ruby") using the cost method.
Other than as described in note 2, the accounting policies applied are consistent with those outlined in Veresen’s annual audited consolidated financial statements for the year ended December 31, 2015. The year-end balance sheet data was derived from audited financial statements but these interim financial statements do not include all disclosures required by US GAAP and should be read in conjunction with the December 31, 2015 audited consolidated financial statements. Operating results for the three and nine months ended September 30, 2016 and September 30, 2015 are not necessarily indicative of the results for the full year.
In management’s opinion the interim consolidated financial statements contain all adjustments, consisting only of normal recurring adjustments, which management considers necessary to present fairly the Company’s financial position as at September 30, 2016 and results of operations and cash flows for the three and nine months ended September 30, 2016 and 2015.
2. New Accounting Pronouncements
Adoption of New StandardsEffective January 1, 2016, the Company adopted Accounting Standards Update (“ASU”) 2014-10, "Development Stage Entities: Elimination of Certain Financial Reporting Requirements, Including an Amendment to Variable Interest Entities Guidance in Topic 810, Consolidation". This ASU eliminates the concept of a development-stage entity from US GAAP along with the associated presentation and disclosure requirements for development-stage entities. The consolidation guidance was also amended to eliminate the development stage entity relief when applying the variable interest entity model and evaluating the sufficiency of equity at risk. This guidance was applied retrospectively and did not have a material impact to the Company.
Effective January 1, 2016, the Company adopted ASU 2014-16, “Derivatives and Hedging.” This ASU provides guidance to clarify the criteria in evaluating the economic characteristics and risks of a host contract in a hybrid financial instrument that is issued in the form of a share. This guidance was applied retrospectively and did not have a material impact to the Company.

Effective January 1, 2016, the Company adopted ASU 2015-01, "Income Statement - Extraordinary and Unusual Items". This ASU simplifies income statement classification by removing the concept of extraordinary items from US GAAP. This guidance was applied prospectively and did not have a material impact to the Company.
Effective January 1, 2016, the Company adopted ASU 2015-02, “Consolidation: Amendments to the Consolidation Analysis". This ASU amends the current consolidation guidance, specifically the guidance in determining whether or not an entity is a variable interest entity. The Company has various limited partnerships which are now considered to be Variable Interest Entities (“VIE”). The only impact of this guidance is to add further disclosure around the limited partnerships that now are considered VIEs (note 13).
Effective January 1, 2016, the Company adopted ASU 2015-03, "Interest - Simplifying the Presentation of Debt Issuance Costs". This ASU changes the presentation of debt issue costs in financial statements. Under the ASU, an entity presents such costs in the balance sheet as a direct reduction from the related debt liability rather than as an asset. Amortization of the costs is reported as interest expense. This guidance was applied retrospectively. As a result, certain comparative figures were restated. For the comparative period ending December 31, 2015, $11 million of debt issuance costs formerly held as other assets are classified with long-term senior debt on the Consolidated Statement of Financial Position.
Effective January 1, 2016, the Company adopted ASU 2015-10, "Technical Corrections and Improvements". This ASU represents changes to clarify the Codification, correct unintended application of guidance, or make minor improvements to the Codification that are not expected to have a significant effect on current accounting practice. This guidance was applied prospectively and did not have a material impact to the Company.
Future accounting policy changesIn May 2014, the FASB issued ASU 2014-09, "Revenue from Contracts with Customers". This ASU provides guidance for changes in criteria for revenue recognition from contracts with customers. Additionally, in April 2016, the FASB issued ASU 2016-10, "Revenue from Contracts with Customers: Identifying Performance Obligations and Licensing" which provides guidance on identifying performance obligations and licensing. Further in May 2016, the FASB issued ASU 2016-12, "Revenue from Contracts with Customers: Narrow-Scope Improvements and Practical Expedients" which provides guidance to address certain issues assessing collectibility, presentation of sales taxes, non cash consideration and completed contracts and contract modifications at transition. All guidance is effective for annual and interim periods beginning after December 15, 2016, and is to be applied retrospectively. In August 2015, the FASB issued ASU 2015-14, "Revenue from Contracts with Customers - Deferral of the effective date". This ASU defers the effective date of ASU 2014-09 for all entities by one year. This guidance is therefore effective for annual and interim periods beginning after December 15, 2017. The Company is currently evaluating the impact of the standard.
In November 2015, the Financial Accounting Standards Board ("FASB") issued ASU 2015-017, "Income Taxes: Balance Sheet Classification of Deferred Taxes". This ASU changes the classification of deferred tax liabilities and assets. Under the ASU, an entity classifies deferred tax liabilities and assets as non-current in the statement of financial position. This guidance is effective for annual and interim periods beginning after December 15, 2016 and is to be applied on a retrospective or prospective basis. The Company does not expect the standard to have a material impact.
In January 2016, the FASB issued ASU 2016-01, "Financial Instruments - Overall: Recognition and Measurement of Financial Assets and Liabilities". This ASU addresses certain aspects of the guidance regarding recognition, measurement, presentation and disclosure of financial instruments, specifically the guidance for measuring the fair value of equity investments. This guidance is effective for annual and interim periods beginning after December 15, 2017, and is to be applied by means of a cumulative-effect adjustment to the Statement of Financial Position as of the beginning of the fiscal year of adoption, with amendments related to equity securities without readily determinable fair values to be applied prospectively. The Company does not expect the standard to have a material impact.
In February 2016, the FASB issued ASU 2016-02, "Leases". This ASU addresses the recognition, measurement, presentation and disclosure in the financial statements of the assets and liabilities related to operating leases. This guidance is effective for annual and interim periods beginning after December 15, 2018. The Company is currently evaluating the impact of the standard.

In March 2016, the FASB issued ASU 2016-07, "Investments - Equity Method and Joint Ventures: Simplifying the Transition to the Equity Method of Accounting". This ASU eliminates the requirement for an investor to adjust the investment, results of operations, and retained earnings retroactively on a step-by-step basis as if the equity method had been in effect during all previous periods that the investment had been held, in the event that an investment qualifies for use of the equity method as a result of an increase in the level of ownership interest or degree of influence. This guidance is effective for annual and interim periods beginning after December 15, 2016, and is to be applied prospectively. The Company does not expect the standard to have a material impact.
In June 2016, the FASB issued ASU 2016-13, “Financial Instruments - Credit Losses: Measurement of Credit Losses on Financial Instruments”. This ASU replaces the incurred loss impairment methodology in current guidance with a methodology that reflects expected credit losses and requires consideration of a broader range of reasonable and supportable information to inform credit loss estimates. This guidance is effective for annual and interim periods beginning after December 15, 2019. Entities must apply the guidance through a cumulative-effect adjustment to retained earnings as of the beginning of the first reporting period in which the guidance is effective (a modified-retrospective approach). The Company is currently evaluating the impact of the standard.
In August 2016, the FASB issued ASU 2016-15, “Statement of Cash Flows: Classification of Certain Cash Receipts and Cash Payments”. This ASU is intended to reduce diversity in practice in how certain transactions are classified in the statement of cash flows. This guidance is effective for annual and interim periods beginning after December 15, 2017. Entities must apply the guidance retrospectively to all periods presented but may apply it prospectively from the earliest date practicable if retrospective application would be impracticable. The Company is currently evaluating the impact of the standard.
3. Veresen Midstream Transaction
On December 22, 2014, a new entity, Veresen Midstream L.P. ("Veresen Midstream") was formed, which is jointly-controlled by the Company and affiliates of Kohlberg Kravis Roberts & Co L.P. ("KKR"), a global investment firm. On March 31, 2015, the Company funded its interest in Veresen Midstream by contributing its Hythe/Steeprock gathering and processing assets valued at $920 million, and in exchange received from Veresen Midstream $420 million in cash, resulting in a 50% equity position valued at $500 million. As at March 31, 2015, the net book value of the Hythe/Steeprock assets contributed was $839 million, resulting in a pre-tax gain on sale to the Company of $37 million attributable to the monetary portion of the transaction. KKR funded its 50% interest in Veresen Midstream by contributing $500 million in cash. All of the Company's and half of KKR's Veresen Midstream equity are held in partnership units that are eligible to receive cash distributions. The remaining half of KKR's initial equity investment is in the form of payment-in-kind ("PIK") units which do not receive cash distributions and instead accrete at a rate equal to the cash yield on the remaining equity plus 4% per year. The PIK units are convertible to cash-paying units after four years at either KKR's or the Company's option. Such conversion of the PIK units will cause dilution in the Company's ownership interest in Veresen Midstream. As a result of cash distributions paid by Veresen Midstream, the Company's ownership decreased from 50% as at March 31, 2015 to 47.4% as at September 30, 2016. The Company and KKR will have equal governance rights in Veresen Midstream so long as either partner's equity interest remains above 35%.

4. Investments in Jointly-Controlled Businesses
Condensed financial information (100%) for the Company’s jointly-controlled businesses:
As at September 30, 2016Nine months endedSeptember 30, 2016
As atSeptember
30, 2016
Ninemonths
endedSeptember
30, 2016
100%CurrentAssets
Non-CurrentAssets
Current Liabilities(1)
Non-Current
Liabilities(1)Senior
Debt Revenues Expenses
Profit(Loss)before
TaxOwner-
ship (%)Equity
Investment
EquityIncome(Loss)
Alliance Canada (2) 211 1,123 54 37 910 390 240 150 50 179 71
Alliance U.S. (3) (7) 85 1,129 56 15 552 315 180 135 50 243 68
Aux Sable Canada 49 121 51 27 4 323 323 - 50 44 -
ASLP (4) (7) 39 635 51 96 8 101 121 (20) 43 188 (6)
ASM (7) 26 295 19 1 - 187 170 17 43 127 7
ACM 8 1 14 - - 71 77 (6) 43 (2) (3)
York Energy Centre (5) 16 251 11 57 237 46 47 (1) 50 16 (2)
Grand Valley 10 165 3 11 156 18 24 (6) 75 4 (5)
Veresen Midstream (6) 243 2,850 285 18 1,362 218 205 13 47 639 7
Other (7) (8) 7 127 1 6 31 9 20 (11) 50 48 (5)
1,486 132
As at December 31, 2015Nine months endedSeptember 30, 2015
As atDecember
31, 2015
Ninemonths
endedSeptember
30, 2015
100%CurrentAssets
Non-CurrentAssets
Current Liabilities (1)
Non-Current
Liabilities (1)Senior
Debt Revenues Expenses
Profit(Loss)before
taxOwner-
ship (%)Equity
Investment
EquityIncome(Loss)
Alliance Canada (2) 132 1,177 33 24 954 355 259 96 50 178 42
Alliance U.S. (3) (7) 73 1,247 53 19 600 331 199 132 50 271 55
Aux Sable Canada 42 107 55 8 - 325 333 (8) 50 44 (4)
ASLP (4) (7) 48 620 168 6 - 50 86 (36) 43 171 (13)
ASM (7) 26 315 22 1 - 179 179 - 43 136 (1)
ACM 5 - 3 - - 95 111 (16) 43 1 (5)
York Energy Centre (5) 15 265 10 44 247 50 45 5 50 27 1
Grand Valley 22 179 16 4 149 5 7 (2) 75 24 (2)
Veresen Midstream (6) 77 2,145 57 20 1,215 107 113 (6) 49 410 (3)
Other (7) 9 133 2 6 33 8 35 (27) 50 50 (13)
1,312 57
Upon acquisition of investments accounted for under the equity method, the Company prepared purchase price allocations of the purchase price to the assets and liabilities of the underlying investee and adjusts equity method earnings for the amortization of purchase price adjustments allocated to depreciable assets.
(1) Current liabilities and non-current liabilities exclude senior debt.(2) At September 30, 2016, the Company had a $45 million (December 31, 2015 - $48 million) increase in the carrying value of Alliance
Canada compared to the underlying equity in the net assets primarily resulting from the purchase price discrepancy as part of the acquisitions in 1997, 2002, and 2003 resulting in 50% ownership.
(3) At September 30, 2016, the Company had a US$13 million (December 31, 2015 - US$ 14 million) decrease in the carrying value of Alliance U.S. compared to the underlying equity in the net assets primarily resulting from the purchase price discrepancy as part of the acquisitions in 1997, 2002, and 2003 resulting in 50% ownership.
(4) At September 30, 2016, the Company had a US$26 million (December 31, 2015 - US$ 28 million) decrease in the carrying value of ASLP compared to the underlying equity in the net assets primarily resulting from the purchase price discrepancy as part of the acquisitions in 1997, 2002, and 2003 resulting in 42.7% ownership. During the year ended December 31, 2015 a $32 million provision was recognized in respect of potential adjustments relating to customer obligations and a US$3 million provision was recognized related to an alleged violation of the United States Environmental Protection Agency's ("EPA") Clean Air Act.
(5) At September 30, 2016, the Company had a $39 million (December 31, 2015 - $41 million) increase in the carrying value of York Energy Centre compared to the underlying equity in the net assets primarily resulting from the purchase price discrepancy as part of the acquisition in 2010 resulting in 50% ownership. Expenses include unrealized gains or losses on the interest rate hedge (note 7).

(6) At September 30, 2016, the Company had a $38 million (December 31, 2015 - $42 million) decrease in the carrying value of Veresen Midstream compared to the underlying equity in the net assets primarily resulting from the unrecognized gain on sale relating to the non-monetary portion of the Veresen Midstream transaction, which, on the date of acquisition, March 31, 2015, resulted in 50% ownership.
(7) Assets and liabilities of these investments have been translated into Canadian dollars using the exchange rate in effect at the balance sheet date and revenues and expenses have been translated into Canadian dollars at average exchange rates during the period.
(8) On June 16, 2016, the Company reached an agreement with Williams Partners Operating, LLC (“Williams”), the joint owner of Pacific Connector Gas Pipeline L.P. (“PCGP”), whereby Williams exchanged its interest in common shares for an interest in preferred shares. The restructuring of PCGP provided the Company with a controlling interest in PCGP, resulting in the Company consolidating the financial results of PCGP on a prospective basis. The non-cash transaction was accounted for as a business combination, which gave rise to an intangible asset ($38 million), deferred income tax liability ($15 million) and a non-controlling interest balance ($24 million), which was subsequently reclassified to paid in capital. Fair values were based on discounted probable future cash flows.
5. Long-term Debt
On October 31, 2016 the $750 million Revolving Credit Facility was extended so that it now matures on May 31, 2020. Outstanding advances bear interest based on various quoted floating rates plus a margin. At September 30, 2016, the Facility was drawn by $371 million (December 31, 2015 - $148 million).
The Company's $300 million 3.95% medium term notes mature on March 14, 2017. Consequently, these notes have been classified as a current liability on the statement of financial position.
6. Share Capital
Common SharesThe weighted average number of Common Shares outstanding used to determine net income per Common Share on a basic basis for the three and nine months ended September 30, 2016 was 312,382,263 and 307,145,622 respectively (three and nine months ended September 30, 2015 – 292,313,045 and 289,351,842).
Preferred SharesOn April 1, 2015, the Company issued 8 million Cumulative Redeemable Preferred Shares, Series E ("Series E Preferred Shares") at a price of $25 per Series E Preferred Share. The holders of Series E Preferred Shares are entitled to receive fixed cumulative preferential cash dividends at an annual rate of 5.00%, payable quarterly for an initial period up to but excluding June 30, 2020, if and when declared by the Board of Directors. The dividend rate will reset on June 30, 2020 and every five years thereafter at a rate equal to the sum of the then five-year Government of Canada bond yield plus 4.27%. The Series E Preferred Shares are redeemable by the Company, at the Company's option, on June 30, 2020 and on June 30 of every fifth year thereafter.
Holders of Series E Preferred Shares have the right to convert all or any part of their shares into Cumulative Redeemable Preferred Shares, Series F ("Series F Preferred Shares") subject to certain conditions, on June 30, 2020 and on June 30 of every fifth year thereafter. The holders of Series F Preferred Shares are entitled to receive quarterly floating rate cumulative dividends at a rate equal to the sum of the then 90-day Government of Canada treasury bill rate plus 4.27%.
7. Fair Value Measurement and Derivative Financial Instruments
Fair value is the amount of consideration that would be agreed upon in an arm's length transaction between knowledgeable, willing parties who are under no compulsion to act.
The fair values of financial instruments included in cash and short-term investments, restricted cash, distributions receivable, accounts receivable, due from jointly-controlled businesses, other assets, payables, dividends payable, and other long-term liabilities approximate their carrying amounts due to the nature of the item and/or the short time to maturity. The fair value of the investment held at cost is based on a number of factors, including the present value of anticipated distributable cash flows to be produced from the underlying operations of the Ruby investment. Assessing these cash flows required the use of assumptions related to the future demand for Ruby's operations, forecasted commodity prices and interest rates, anticipated economic conditions, timing of conversion of the preferred interest into a common equity interest, and other inputs, many of which are not available as observable

market data. The fair values of senior debt are calculated by discounting future cash flows using discount rates estimated based on government bond rates plus expected spreads for similarly-rated instruments with comparable risk profiles.
The carrying value of investments held at cost are accounted for under the cost method. As part of the Company'simpairment review, the Company performs a fair value assessment of the Company's investments held at cost onan annual basis using the most currently available information.
US GAAP establishes a fair value hierarchy that distinguishes between fair values developed based on market data obtained from sources independent of the reporting entity, and fair values developed using the reporting entity’s own assumptions based on the best information available in the circumstances. The levels of the fair value hierarchy are:
Level 1: Inputs are quoted prices (unadjusted) in active markets for identical assets or liabilities.Level 2: Inputs are other than the quoted prices included in Level 1 that are observable for the asset or liability,
either directly or indirectly.Level 3: Inputs are not based on observable market data.
Veresen has categorized senior debt as Level 2. At September 30, 2016 senior debt had a carrying value of $1,310 million (December 31, 2015 – $1,089 million) and fair value of $1,363 million (December 31, 2015 – $1,143 million). The investment held at cost is categorized as Level 3. At September 30, 2016 the investment held at cost had a carrying value of $1,878 million (December 31, 2015 - $1,981 million) and a fair value of $1,992 million (December 31, 2015 - $2,010 million). The investment held at cost is denominated in US dollars and fluctuations in exchange rates will result in changes to its carrying value.
Financial instruments measured at fair value as at September 30, 2016 were:
Level 1 Level 2 Level 3 Total
Cash and short-term investments 106 106
Restricted cash 3 3
Interest Rate HedgesVeresen and its jointly-controlled businesses periodically enter into interest rate hedges to manage interest rate exposures. As at September 30, 2016, York Energy Centre Limited Partnership ("York Energy Centre"), Grand Valley I Limited Partnership ("Grand Valley I") and Grand Valley II Limited Partnership ("Grand Valley II"), all being jointly-controlled businesses, had interest rate hedges. Future changes in interest rates will affect the fair value of the hedges, impacting the amount of unrealized gains or losses included in equity income from jointly-controlled businesses recognized in the period.
The following is a summary of the interest rate hedges in place as at September 30, 2016:
Jointly-ControlledBusiness Variable Debt Interest Rate Fixed Rate
Notional Amount (1)
FairValue (1) Term
York EnergyCentre
CAD-BA-CDOR4.36% $119 $(28)
April 30, 2012 to June 30, 2032
Grand Valley I CAD-BA-CDOR1.52% $37 $(1)
July 28, 2016 to September 30, 2031
Grand Valley II CAD-BA-CDOR2.31% $84 $(7)
December 31, 2015 to December 31, 2033
The following is a summary of the interest rate hedge in place as at December 31, 2015:
Jointly-ControlledBusiness Variable Debt Interest Rate Fixed Rate
Notional Amount (1)
FairValue (1) Term
York EnergyCentre
CAD-BA-CDOR4.36% $122 $(22)
April 30, 2012 to June 30, 2032
Grand Valley II CAD-BA-CDOR2.31% $86 $(2)
December 31, 2015 to December 31, 2033

The fair values approximate the amount that York Energy Centre and Grand Valley II would have either paid or received to settle the contract, and are included in the Company’s investments in York Energy Centre and Grand Valley II.
Cross Currency SwapsAs at September 30, 2016, Veresen Midstream, a jointly-controlled business, had two cross currency swaps ("Swaps"). These Swaps were entered into to manage the exposure to changes in interest rates and foreign exchange whereby Veresen Midstream receives variable interest rates denominated in US dollars and pays fixed interest rates denominated in Canadian dollars. The first Swap, obtained on March 31, 2015, had an initial notional amount of US$575 million which declines over the 4-year swap facility, ending March 31, 2019. On May 28, 2015, resulting from the re-pricing of Veresen Midstream's US dollar denominated Term Loan, the Swap was amended and made effective March 31, 2015, resulting in a reduction of 75 basis points. The second Swap, obtained on September 6, 2016, had an initial notional amount of US$150 million which declines over the remaining term of the swap facility, ending March 31, 2019. Future changes in interest rates and exchange rates will affect the fair value of the Swap, impacting the amount of unrealized gains or losses included in equity income from jointly-controlled businesses recognized in the period.
The following is a summary of the cross currency swaps in place as at September 30, 2016:
Jointly-ControlledBusiness Variable Debt Interest Rate
FixedRate
Notional Amount (2)
FairValue (2) Term
VeresenMidstream
USD-BA-LIBOR5.81% $353 $11
March 31, 2015 to March 31, 2019
VeresenMidstream
USD-BA-LIBOR5.49% $93 $(1)
September 6, 2016 to March 31, 2019
The following is a summary of the cross currency swap in place as at December 31, 2015:
Jointly-ControlledBusiness Variable Debt Interest Rate
FixedRate
Notional Amount (2)
FairValue (2) Term
VeresenMidstream
USD-BA-LIBOR5.81% $383 $32
March 31, 2015 to March 31, 2019
The fair values approximate the amount that Veresen Midstream would have either paid or received to settle the contract, and are included in the Company's investment in Veresen Midstream.
(1) Veresen's interest in the York Energy Centre, Grand Valley I and II jointly-controlled businesses is 50% and 75% respectively.(2) Veresen's interest in Veresen Midstream varies for items recognized within the consolidated statement of financial position and the
consolidated statement of income. For the purposes of recognizing items in the consolidated statement of financial position, Veresen's ownership interest is based on Veresen's holdings on a fully diluted basis, as at the date of the statement of financial position. As at September 30, 2016, this ownership interest is 47.4%. For the purposes of recognizing items in the consolidated statement of income, Veresen's ownership interest is based on the weighted average of Veresen's holdings on a fully diluted basis during the financial statement period. For the three and nine month periods ended September 30, 2016 this ownership interest is 47.7% and 48.1%, respectively.

8. Segmented Information
Pipelines Midstream Power Corporate(1) TotalThree months endedSeptember 30 2016 2015 2016 2015 2016 2015 2016 2015 2016 2015Equity income (loss) 44 33 3 (9) (3) (6) - (3) 44 15
Dividend income 30 30 - - - - - - 30 30
Operating revenues 13 14 - - 26 23 - - 39 37
Operations and maintenance (5) (6) - - (10) (9) - - (15) (15)
General and administrative (1) - - - (2) (3) (11) (3) (14) (6)
Project development - - - - - - (26) (19) (26) (19)
Depreciation and amortization (4) (5) - - (8) (9) (1) (1) (13) (15)
Interest and other finance (1) (1) - - (3) (2) (8) (11) (12) (14)
Foreign exchange and other - - - - - - - 2 - 2
Gain on sale of assets - - - - - - - - - -
Net income (loss) before taxfrom continuing operations 76 65 3 (9) - (6) (46) (35) 33 15
Tax expense(2) - - - - - - (8) (1) (8) (1)
Net income (loss) 76 65 3 (9) - (6) (54) (36) 25 14
Preferred Share dividends - - - - - - (6) (6) (6) (6)
Net income (loss) attributable toCommon Shares 76 65 3 (9) - (6) (60) (42) 19 8
Total assets(3) 2,547 2,617 910 791 1,001 1,033 173 141 4,631 4,582
Capital expenditures(4) - - 20 3 1 13 2 1 23 17
(1) Reflects unallocated amounts applicable to Veresen’s head office activities. (2) The Company holds its ownership interests in multiple business lines through partnerships, which are consolidated into various corporate
entities. Consequently, the tax provision is determined on a consolidated basis and, as such, the Company is not able to present income tax by segment.
(3) After giving effect to intersegment eliminations and allocations to businesses.(4) Reflects capital expenditures related only to wholly-owned and majority-controlled businesses as per the Consolidated Statement of
Cash Flows.

Pipelines Midstream Power Corporate(1) TotalNine months ended September30 2016 2015 2016 2015 2016 2015 2016 2015 2016 2015Equity income (loss) 139 97 5 (26) (7) (4) (5) (10) 132 57
Dividend income 90 85 - - - - - - 90 85
Operating revenues 37 44 - 33 77 70 - - 114 147
Operations and maintenance (15) (21) - (11) (29) (28) - - (44) (60)
General and administrative (2) (1) - (1) (8) (11) (27) (20) (37) (33)
Project development - - - - - - (104) (56) (104) (56)
Depreciation and amortization (11) (11) - (10) (27) (23) (3) (2) (41) (46)
Interest and other finance (3) (4) - - (8) (7) (24) (31) (35) (42)
Foreign exchange and other - - - - - - - 6 - 6
Gain on sale of assets - - - 37 - - - - - 37
Net income (loss) before taxfrom continuing operations 235 189 5 22 (2) (3) (163) (113) 75 95
Tax expense(2) - - - - - - (21) (22) (21) (22)
Net income (loss), beforeextraordinary loss 235 189 5 22 (2) (3) (184) (135) 54 73
Extraordinary loss, net of tax - (10) - - - - - - - (10)
Net income (loss) 235 179 5 22 (2) (3) (184) (135) 54 63
Preferred Share dividends - - - - - - (19) (17) (19) (17)
Net income (loss) attributable toCommon Shares 235 179 5 22 (2) (3) (203) (152) 35 46
Total assets(3) 2,547 2,617 910 791 1,001 1,033 173 141 4,631 4,582
Capital expenditures(4) - - 46 7 14 36 5 6 65 49
(1) Reflects unallocated amounts applicable to Veresen’s head office activities. (2) The Company holds its ownership interests in multiple business lines through partnerships, which are consolidated into various corporate
entities. Consequently, the tax provision is determined on a consolidated basis and, as such, the Company is not able to present income tax by segment.
(3) After giving effect to intersegment eliminations and allocations to businesses.(4) Reflects capital expenditures related only to wholly-owned and majority-controlled businesses as per the Consolidated Statement of
Cash Flows.
9. Supplemental Cash Flow Information
Three months endedSeptember 30
Nine months endedSeptember 30
2016 2015 2016 2015Receivables - (2) (8) 29Other assets 1 1 (2) 5Payables 1 3 15 (20)Changes in non-cash operating working capital 2 2 5 14
10. Sale of Assets
On August 1, 2016, the Company closed the sale of its 33 megawatt Glen Park run-of-river hydro power generation facility to an unrelated third party for proceeds of $81 million which approximated the carrying value of the assets sold.
11. Commitments and Contingencies
On April 15, 2015, Aux Sable received a Notice and Finding of Violation from the United States Environmental Protection Agency ("EPA") for exceedances of permitted limits for Volatile Organic Compounds at Aux Sable's

Channahon, Illinois Facility. Aux Sable is engaged in discussions with the EPA to resolve the matter. The EPA proposal confirms the settlement will not be material to earnings.
On March 30, 2012, a Statement of Claim was filed against the Company’s equity-accounted investees, Aux Sable Liquid Products, L.P., Aux Sable Canada L.P., Aux Sable Extraction LP and Aux Sable Canada Ltd., claiming various relief including damages of US$13 million, relating to differences in interpretation of certain terms of the NGL Sales Agreement. On October 14, 2016 an Amended Statement of Claim was filed disputing the application by Aux Sable of certain additional elements of the NGL Sales Agreement and increasing the damages claim to US$150 million. The 42.7% calculations reflect the Company's interest in Aux Sable. Aux Sable will fully defend its position in this matter and at this time is unable to predict the likely outcome. Management believes the amount of estimated loss accrued in the financial statements is consistent with requirements under US GAAP. It is reasonably possible that amounts accrued in relation to the matter may change in the future.
12. Extraordinary Loss
The extraordinary after-tax loss of $10 million for the nine months ended September 30, 2015 represents the one-time non-cash net effect of the de-recognition of Alliance's regulatory assets and liabilities.
As Alliance received regulatory approval from the National Energy Board ("NEB") and the Federal Energy Regulatory Commission to advance its new services offering effective December 1, 2015, it will be exposed to potential variability in certain future costs and throughput volumes. As such, the majority of Alliance's operations no longer met all of the criteria required for the continued application of rate regulated accounting under US GAAP, thereby requiring the de-recognition of its regulatory balances as at June 30, 2015. Certain expenditures in Alliance, as approved by the NEB, will continue to be accounted for in accordance with Accounting Standards Codification 980 – Regulated Operations.
13. Variable Interest Entities
As a result of adopting ASU 2015-02, a number of entities controlled by the Company are now considered to be VIEs. The Company consolidates VIEs in which it has a variable interest and for which it is considered to be the primary beneficiary. VIEs in which the Company has a variable interest but is not the primary beneficiary are accounted for as equity investments.
Consolidated VIEsUnder the new consolidation standard, a certain number of the Company’s wholly-owned and controlled limited partnerships will continue to be consolidated, but are now deemed to be VIEs. For these limited partnerships, the Company has the power to direct activities that most significantly impact its economic performance and the obligation to absorb losses or the right to receive benefits. On an aggregate basis, as at September 30, 2016 these VIEs have total assets of $379 million (December 31, 2015 - $387 million) and total liabilities of $277 million (December 31, 2015 - $273 million), of which $233 million (December 31, 2015 - $241 million) relates to non-recourse debt. The assets of these VIEs must first be used for the settlement of the VIEs’ obligations.
Non-consolidated VIEsThe company’s non-consolidated VIE consist of one legal entity, Veresen Midstream, where the Company does not have the power to direct activities that most significantly impact the economic performance of this VIE. The Company is not the primary beneficiary and, consequently, this entity is accounted for as an equity investment (note 4). The maximum exposure to loss as a result of the Company’s involvement with this VIE is limited to the carrying value of the investment (note 4). None of the Company’s other jointly-controlled businesses are classified as VIEs.
14. Due from Jointly-Controlled Business
On July 29, 2016, Grand Valley, a jointly-controlled business, refinanced its long-term debt, obtaining a term loan from a third party which was used to repay its existing term loan with the Company.

15. Subsequent Events
DividendsOn October 20, 2016, the Company declared its October dividend of $0.0833 per Common Share, payable on November 23, 2016 to shareholders of record on October 31, 2016.