venturi aeration of bioreactors - university of cape town
TRANSCRIPT

Univers
ity of
Cap
e Tow
n
Venturi Aeration of Bioreactors
Fadzai Kadzinga
Thesis submitted in fulfilment of the academic requirements for the degree of Master of Science in Engineering in the Department of Chemical Engineering
University of Cape Town
February 2015

The copyright of this thesis vests in the author. No quotation from it or information derived from it is to be published without full acknowledgement of the source. The thesis is to be used for private study or non-commercial research purposes only.
Published by the University of Cape Town (UCT) in terms of the non-exclusive license granted to UCT by the author.
Univers
ity of
Cap
e Tow
n

i
Abstract
Low solubility of oxygen has resulted in high bioreactor energy requirements in order to supply
sufficient oxygen to aerobic bioprocesses. It is desirable to reduce energy consumption in bioreactors
to benefit environmental sustainability as well as economic feasibility. This is particularly important
with the resurgence of interest in bio-based commodity products.
Some research has suggested that venturi aeration of bioreactors will reduce energy consumption by
eliminating the need for air compression, while at the same time maintaining or improving oxygen
transfer rates. On the other hand, there are findings that suggest venturi aeration has lower energy
efficiency than conventional sparging and oxygen transfer rates achieved are too low sustain aerobic
biological processes.
A comparison of the aeration of geometrically-similar reactors using the same analytical methods to
determine kLa is not available in the literature. This comparison should also address analysis of
energy input including energy used for compressing gas sparged into a stirred tank reactor; the
investigation of mass transfer rates at higher flow rates (vvm) in venturi-aerated reactors and resulting
cell response to these higher flow rates. This is the topic of the dissertation presented.
In this laboratory scale study, venturi aerators were characterised and energy consumption as a
function of oxygen mass transfer rates compared with a geometrically identical aerated stirred tank
reactor by evaluating the volumetric mass transfer coefficients (kLa). The kLa was investigated in
varying reactor setups using the dynamic gassing-in method.
The mass transfer coefficient in a venturi-aerated reactor was found to depend on liquid flow rate
through the venturi aerator and bulk liquid movement in the tank. Liquid flow rates investigated were
between 1.3 vvm and 2.6 vvm. The kLa increased with liquid flow rate and was affected by the change
in bulk mixing in the tank that resulted from changing the venturi outlet height in the tank. At higher
liquid flow rates, kLa as much as doubled by changing the venturi outlet height. Liquid mass balance
models suggest that a considerable portion of the oxygen mass transfer occurred in the tank.
Comparison of total power input to the reactor showed that venturi aeration achieved mass transfer
rates as high as those in an aerated stirred tank for the same power input. For total power up to 6
kWm-3, the kLa in the venturi system was similar to that in the stirred tank at an equivalent power
input; while the stirred tank gave better mass transfer at higher power input.
The growth of brewer’s yeast in the venturi aerated reactor was the same as that in the aerated stirred
tank with maximum growth rates of 0.115 h-1and 0.138 h-1respectively.
Venturi aeration did not show significantly better energy efficiency than sparged stirred tanks, but can
be made more competitive by reducing energy lost when circulating the liquid and optimising fluid
hydrodynamics in the tank.
ii
Acknowledgements
To Prof Sue Harrison for her supervision and guidance.
To Dr Tobi Louw for helping me make sense of it.
To all of CeBER for the help, support and input.
To my friends and family for their support.
To the Department of Chemical Engineering for financial assistance.

iii
Table of Contents
1 Introduction ................................................................................................................................. 1-1
2 Literature review ......................................................................................................................... 2-1
2.1 Oxygen mass transfer in bioreactors .................................................................................... 2-1
2.2 Determination of the mass transfer coefficient (kLa) in a stirred tank ................................. 2-3
2.2.1 Sulphite oxidation method ........................................................................................... 2-4
2.2.2 Dynamic gassing in method ......................................................................................... 2-4
2.2.3 Hydrogen peroxide method .......................................................................................... 2-6
2.2.4 Oxygen balance method ............................................................................................... 2-7
2.2.5 Dynamic pressure method ............................................................................................ 2-7
2.3 Factors affecting oxygen transfer and kLa in stirred tank reactors ....................................... 2-8
2.3.1 Agitation ...................................................................................................................... 2-8
2.3.2 Gas flow rate ................................................................................................................ 2-9
2.3.3 Broth composition ........................................................................................................ 2-9
2.4 Correlation of kLa in stirred tank reactors .......................................................................... 2-10
2.5 Principles of Venturi aeration ............................................................................................ 2-13
2.5.1 Liquid flow rate .......................................................................................................... 2-15
2.5.2 Venturi geometry ....................................................................................................... 2-15
2.5.3 Venturi-reactor configuration .................................................................................... 2-16
2.6 Application of venturi aeration to bioreactors ................................................................... 2-17
2.7 Cell damage in venturi aerators ......................................................................................... 2-19
2.8 Measuring kLa in venturi aerated reactors .......................................................................... 2-19
2.9 Energy consumption in bioreactors .................................................................................... 2-21
3 Hypothesis and key questions ..................................................................................................... 3-1
3.1 Hypothesis............................................................................................................................ 3-2
3.2 Key questions ....................................................................................................................... 3-2
4 Materials and Methods ................................................................................................................ 4-1
4.1 Experimental set-up ............................................................................................................. 4-1
4.1.1 Stirred tank reactor ....................................................................................................... 4-1
4.1.2 Venturi system ............................................................................................................. 4-2

iv
4.1.3 Oxygen measurement equipment ................................................................................. 4-4
4.2 Dynamic method for measurement of oxygen transfer ........................................................ 4-5
4.2.1 Dynamic method in the stirred tank reactor ................................................................. 4-5
4.2.2 Dynamic method in the venturi-aerated reactor ........................................................... 4-5
4.2.3 Analytical method for kLa determination in the stirred tank ........................................ 4-5
4.2.4 Accounting for lag in electrode response ..................................................................... 4-7
4.2.5 Analysis of venturi aerated reactor .............................................................................. 4-8
4.3 Mixing studies in venturi aerated reactor ........................................................................... 4-11
4.4 Calculation of power .......................................................................................................... 4-11
4.5 Aerobic cultivation of Baker’s yeast .................................................................................. 4-12
4.5.1 Microorganism and culture maintenance ................................................................... 4-13
4.5.2 Operating conditions .................................................................................................. 4-13
4.5.3 Cell growth analysis ................................................................................................... 4-13
4.5.4 Glucose analysis ......................................................................................................... 4-14
4.6 Research approach ............................................................................................................. 4-15
5 Results and discussion ................................................................................................................. 5-1
5.1 Oxygen Mass Transfer in the Stirred Tank System ............................................................. 5-1
5.1.1 OTR and kLa as a function of agitation rate and gas flow rate ..................................... 5-1
5.2 Oxygen mass transfer in the venturi system ........................................................................ 5-4
5.2.1 Mixing in the tank ........................................................................................................ 5-7
5.2.2 OTR and kLa as a function of liquid flow rate and depth of inlet (tank hydrodynamics)
5-8
5.2.3 OTR and kLa as a function of venturi configuration .................................................. 5-11
5.2.4 Modelling oxygen mass transfer using the Venturi system ....................................... 5-12
5.2.5 Comparison of power input between stirred tank and venturi aerated tank ............... 5-14
5.3 Yeast growth and survival in the Venturi aerated system .................................................. 5-15
6 Conclusions and Recommendations ............................................................................................ 6-1
6.1 Conclusions .......................................................................................................................... 6-1
6.2 Recommendations ................................................................................................................ 6-2
7 Bibliography ................................................................................................................................ 7-1
v
Table of Figures
Figure 2.1: Schematic of two-film theory by Whitman ....................................................................... 2-2
Figure 2.2: Variation of kLa with agitation power for different studies ............................................. 2-11
Figure 2.3: Schematic of a venturi device .......................................................................................... 2-14
Figure 2.4: Setup of a venturi aerator in a semi-batch process .......................................................... 2-18
Figure 4.1: Schematic of reactor used in stirred tank experiments ...................................................... 4-1
Figure 4.2:Schematic of experimental set-up for venturi aeration experiments (a) shows arrangement
of apparatus and (b) shows top-down view of components in the tank ............................................... 4-3
Figure 4.3: Results obtained in the determination of 𝜏𝑟. ..................................................................... 4-5
Figure 4.4: Change of DO concentration in the tank with time at agitation power of 5.36 kW m-3 and
aeration rate of 12 L min-1 .................................................................................................................... 4-6
Figure 4.5: Change of DO concentration in the tank with time at agitation power of 0.509 kW m-3 and
25 L min-1 ............................................................................................................................................ 4-6
Figure 4.6: The difference between kLa calculated with electrode response accounted for (kLa lag) and
kLa measured (no correction) in the stirred tank.. ................................................................................ 4-7
Figure 4.7: Change of DO concentration in the tank with time at liquid flow rate of 42 L min-1 and
outlet height of 8 cm ............................................................................................................................ 4-8
Figure 4.8: Change of DO in the tank with time for a venturi aerated reactor at liquid flow rate of 22.2
L min-1 and 4 cm outlet height. .......................................................................................................... 4-10
Figure 4.9: Change of conductivity with time after injecting salt for two repeats at a liquid circulation
rate of 22.2 L min-1 at an outlet height of 4 cm .................................................................................. 4-11
Figure 5.1: Variation of kLa with agitation rate at different air flow rates .......................................... 5-2
Figure 5.2: Correlation of kLa with aeration rate and agitation power input ....................................... 5-3
Figure 5.3: Variation of kLa in a stirred tank with total power input ................................................... 5-3
Figure 5.4: Prediction of the variation of pressure drop in the throat of the venturi aerator and air flow
rate into the venturi with liquid flow rate through the venturi ............................................................. 5-5
Figure 5.5: DO concentration in liquid stream immediately out of the venturi aerator compared to DO
concentration in the tank corrected for electrode response time at liquid flow rate of 36.6 L/min and 4
cm outlet height.................................................................................................................................... 5-6
Figure 5.6: Change in DO concentration in the tank with time when the air hole is closed compared to
when the air hole is open. Liquid flow rate through the venturi aerator was 42 L min-1at a venturi
outlet height of 8 cm ............................................................................................................................ 5-7
Figure 5.7: Mixing times in venturi aerated tank for a single venturi (Setup 1) at different venturi
outlet heights as a function of liquid flow rate ..................................................................................... 5-7
Figure 5.8: Effect of water flow rate and venturi outlet height on kLa .............................................. 5-99

vi
Figure 5.9: Comparison of gas holdup at (a) 22.2 L/min and (b) 36.6L/min for a venturi outlet height
of 12 cm ......................................................................................................................................... 5-1010
Figure 5.10: Comparison of kLa between a single venturi at venturi outlet heights of 4 cm, 8 cm and
12 cm, and two venturis connected in parallel at an outlet height of 8 cm ..................................... 5-122
Figure 5.11: Difference between measured DO concentration and that predicted by assuming no mass
transfer happens in the tank. ............................................................................................................ 5-133
Figure 5.12: Effect of liquid flow rate and outlet height on kLAV at different venturi outlet heights and
kLaT at different venturi outlet heights ............................................................................................. 5-133
Figure 5.13: Variation of kLa with total power input for all conditions in the stirred tank reactor,
Single venturi and two venturis in parallel ...................................................................................... 5-155
Figure 5.14: Comparison of growth of S. cerevisiae in the venturi aerated reactor to that in the stirred
tank, and glucose consumption in the venturi aerated reactor and in the stirred tank. ................... 5-166
Figure 5.15: Growth of S. cerevisiae shake flask inoculated with cells from the aerated stirred tank
and cells that had been in the venturi aerated reactor for 15 minutes and 90 minutes compared to
growth of S.cerevisiae in the aerated stirred tank ............................................................................ 5-166

vii
List of Tables
Table 2.1: Reactor specifications for kLa studies shown in Figure 2.2 .............................................. 2-12
Table 2.2: Typical values for constants in Equation (2.23) for an air- water system in a stirred tank
reactor ................................................................................................................................................ 2-13
Table 2.3: Comparison of oxygen transfer in venturi-aerated reactors to sparged reactors ............... 2-18
Table 2.4: kLa values for venturi-aerated systems under various operating conditions ..................... 2-21
Table 4.1: Dimensions of reactor used in stirred tank experiments ..................................................... 4-2
Table 4.2: Agitation rates and corresponding power consumption ...................................................... 4-2
Table 4.3: Research approach ............................................................................................................ 4-15
Table 5.1: Coefficients for the correlation kLa = C(P/V)^α u^β....................................................... 5-2
Table 5.2: Rate of air suction into the venturi for varying water flow rates. The air suction rate was not
affected by the venturi outlet height. ................................................................................................... 5-9
Table 5.3: Results for the cultivation of yeast in different reactor setups .......................................... 5-17
viii
Nomenclature
Symbol Definition Units
𝐴𝑇 Total interfacial surface area m2
𝑎 Interfacial surface area per unit reactor volume m2m-3
𝐶 Discharge coefficient of venturi air hole
𝐶∗ Saturation concentration of oxygen in the liquid phase corresponding
to the bulk gas phase mol m-3
𝐶0 Initial concentration of oxygen in the liquid phase mol m-3
𝐶𝐴 Concentration of oxygen in the bulk liquid phase mol m-3
𝐶𝐴𝑖 Concentration of oxygen at the gas- liquid interface mol m-3
𝐶𝐺𝑒 Concentration of oxygen in the exit gas mol m-3
𝐶𝐺𝑓 Concentration of oxygen in the inlet gas mol m-3
𝐶𝐻2𝑂2𝑓 feed concentration of H2O2 mol m-3
𝐶𝐿 Concentration of oxygen in the bulk liquid phase mol m-3
𝐶𝑚 Dissolved oxygen concentration displayed on the DO meter mol m-3
𝐶𝑉 Concentration of oxygen in the liquid at the venturi outlet mol m-3
𝐷 Impeller diameter m
𝐷𝐴𝐵 Diffusivity of oxygen in water m2 s-1
𝐷𝑏 Bubble diameter m
𝜀𝐺 Gas holdup
𝐸 Specific power input Wm-3
𝐹 Liquid volumetric flow rate m3s-1
𝑔 Acceleration due to gravity ms-2
𝑔𝑐 Dimensional constant Pa
𝛾 Ratio of specific heat for gas=1.395 for air with adiabatic compression
𝐻 Height of liquid in the reactor m
𝐻𝐴 Henry’s law coefficient kPa m-3 mol-1
𝐽𝐴 Molar flux of oxygen from the gas phase to the liquid phase mol m-2 s-1
𝐾 (-1)/ = 0.283 for air
𝑘𝐿𝑎 Volumetric mass transfer coefficient s-1
𝑘𝐿𝑎𝑇 Volumetric mass transfer coefficient in the tank s-1
𝑘𝐿𝐴𝑉 Mass transfer coefficient in the venturi aerator m3s-1
𝜇 Specific growth rate h-1

ix
𝑛 Impeller agitation rate rps
𝑁𝐴 Rate of oxygen transfer from gas phase to liquid phase mol s-1
𝑁𝑃𝐺 Gassed power number
𝑂𝑇𝑅 Rate of oxygen transfer from gas phase to liquid phase mol m-3 s-1
𝑂𝑈𝑅 Oxygen uptake rate mol m-3 s-1
𝑃 Power input kW
𝜋 Pressure Pa or kPa
𝜋1 Initial pressure Pa or kPa
𝜋2 Final pressure Pa or kPa
𝑝𝐴 Partial pressure of oxygen in the bulk gas phase kPa
𝑝𝐴𝑖 Partial pressure of oxygen at the gas-liquid interface kPa
𝑄𝐺 Volumetric gas flow rate m3s-1
𝑄𝐿 Volumetric liquid flow rate m3s-1
𝑅 Gas constant J mol-1 K-1
𝜌 Density of fluid kg m-3
𝑇 Tank diameter m
𝑇1 Gas temperature K
𝑇𝐷𝐻 Total dynamic head m
𝜏𝑟 Response time of DO electrode s
𝑢𝐺 Gas velocity ms-1
𝑢𝐿 Liquid velocity ms-1
𝑉 Reactor volume m3
𝑤 Gas mass flow rate kg s-1
𝑊 Specific weight of water N m-3
𝑧 Distance over which diffusion occurs m

1-1
1 Introduction Recently, it has become increasingly important for industrial processes to be environmentally
sustainable. There is a push towards bio-based, environmentally responsible products which has led to
a resurgence of interest in large scale commodity bioprocesses in which both operating costs are key
and environmental impact of the large scale process significant (Yang, 2007).
In a bioreactor, energy is used for temperature control, agitation, and for compressing and pumping
gases into the reactor. Thus optimisation of these processes can be targeted to improve energy
efficiency of bioreactors. Most aerobic bioprocesses are limited by the availability of oxygen in the
reactor, therefore it is crucial to ensure sufficient oxygen supply and transfer in the reactors, even at
higher energy costs (Jackson, 1964; Garcia-Ochoa & Gomez, 2009). Oxygen mass transfer is
enhanced by creating high surface area, in the form of bubbles, and by ensuring maximum oxygen
concentration gradient. The cost and environmental burden of operating bioreactors may consequently
be reduced by changing the aeration method to provide high surface area at lower energy
consumption.
Venturi aerators have been reported to consume less energy than conventional airlift reactors, bubble
columns and stirred tanks (Jackson, 1964; Rodriguez et al., 2012) mostly because no compressor is
needed for the gas. They have also been reported to provide high interfacial areas for mass transfer
(Gourich et al., 2007). Venturi aerators are less expensive to install and maintain as they have no
moving parts that may break or fail and there is no clogging of gas spargers as with bubble columns
(Baylar & Ozkan, 2006).
While it appears that venturi aerators are an easy and obvious solution, there is limited information on
their application on an industrial scale. This may be because there are concerns that venturi aerators
do not provide enough air in order to avoid oxygen-limiting conditions in reactors. For the operating
conditions investigated, oxygen transfer rates in venturi-aerated reactors have been reported to be less
than oxygen uptake or utilisation rates required in some biological process such as mineral leaching
and aerobic bacterial processes (Bauer, 1963; Rossi, 2001).
In this study energy consumption and oxygen transfer rates in venturi aerated reactors were compared
to those in a geometrically similar aerated stirred tank. Oxygen transfer and energy consumption in
the venturi-aerated vessel were improved by altering operating conditions and the venturi aerator
setup. Applicability of venturi aeration to actual bioprocesses was then tested on an aerobic
cultivation of brewer’s yeast. Two aeration systems were compared. It is appreciated that oxygen
transfer rates obtained in aqueous solutions will most likely differ from those obtained with microbial
cultures present.

1-2
In presenting the study, the theory and current knowledge governing gas-liquid mass transfer and
venturi aeration is provided in Chapter 2. In Section 2.2, measurement of kLa is reviewed. Sections 2.3
and 2.4 address factors affecting oxygen mass transfer in the stirred tank reactor (STR). Venturi and
venture aeration is reviewed in Sections 2.5 to 2.8. Section 2.9 introduces energy considerations of
gas-liquid mass transfer. In Chapter 3, the objectives, hypotheses and key questions addressed in the
study are put forward. Chapter 4 details the materials and methods used for experiments and the
analysis of data gathered from these experiments. The results for both the aerated stirred tank and
venturi system are then presented and discussed in Chapter 5, in Sections 5.1 to 5.2 and 5.3 to 5.4
respectively. The study is concluded in Chapter 6 with recommendations on optimisation of a venturi-
aerated system also given in the same chapter.

2-1
2 Literature review
2.1 Oxygen mass transfer in bioreactors
Due to the low solubility of oxygen in water (7.5 mg/L at 1 atm and 30 °C) (Liley et al., 1999: 2-127)
transfer of oxygen from the gas phase to the liquid phase is often the limiting step in aerobic
bioprocesses. In order to analyse this step, Fick’s first law can be applied to the diffusion of oxygen
from the gas phase to the liquid phase.
The molar flux (𝐽𝐴) of oxygen, denoted by A, into water, B, can be described by Fick’s first law for
dilute systems given as Equation (2.1). The rate of oxygen transfer 𝑁𝐴 can be found by multiplying
the flux by the total surface area, 𝐴𝑇 over which the transfer happens (Equation 2.2).
𝐽𝐴 = −𝐷𝐴𝐵𝑑𝐶𝐴
𝑑𝑧 (2.1)
𝑁𝐴 = −𝐷𝐴𝐵 𝐴𝑇 𝑑𝐶𝐴
𝑑𝑧 (2.2)
Equation (2.2) can be adapted and applied to the two-film model by Whitman which is applicable to
oxygen mass transfer in bioreactors (Villadsen et al., 2011; Noorman, 2006; Kargi & Moo-Young,
1985). Figure 2.1 illustrates the assumptions made in applying two-film theory to oxygen transfer in
bioreactors. It is assumed that each bubble in the liquid is surrounded by a very thin gaseous film
adjacent to another thin liquid film as shown in Figure 2.1. The bulk air and liquid phases next to
these films are well mixed (no concentration gradient) (Wesselingh & Krishna, 2000) and transport in
the films only occurs by molecular diffusion.

2-2
Figure 2.1: Schematic of two-film theory by Whitman
Concentrations on either side of the interface are in equilibrium with each other (Treybal, 1955) and
can be related to each other using Henry’s law. The rate of oxygen transfer across the interface (𝑁𝐴) is
written in terms of the liquid phase and the gas phase in Equation (2.3) and Equation (2.4)
respectively. Equations (2.5) - (2.9) show the development of Equation (2.10) which is mostly used to
define gas-liquid mass transfer without consumption of the gas.
𝑁𝐴 = −𝑘𝐿 𝐴𝑇 (𝐶𝐴𝐿 − 𝐶𝐴𝑖) (2.3)
𝑁𝐴 = −𝑘𝐺 𝐴𝑇 (𝑝𝐴𝑖 − 𝑝𝐴) (2.4)
Using Henry’s law: 𝑝𝐴𝑖 = 𝐻𝐴𝐶𝐴𝑖 (2.5)
Combining (2.3) and (2.5) 𝑝𝐴𝑖 = 𝐻𝐴 (𝑁𝐴𝑘𝐿𝐴𝑇
+ 𝐶𝐴𝐿) (2.6)
From (2.4) 𝑁𝐴 = −𝑘𝐺𝐴𝑇 [𝐻𝐴 (𝑁𝐴
𝑘𝐿 𝐴𝑇+ 𝐶𝐴𝐿) − 𝑝𝐴] (2.7)

2-3
Solving for 𝑁𝐴: 𝑁𝐴 = ( 𝐶𝐴∗ − 𝐶𝐴𝐿
1 𝑘𝐿 +
1 𝐻𝐴𝑘𝐺
)𝐴𝑇 (2.8)
𝑁𝐴 = 𝐾𝐿 𝐴𝑇 (𝐶𝐴∗ − 𝐶𝐴𝐿) (2.9)
Where 1
𝐾𝐿= 1
𝑘𝐿+
1
𝐻𝐴𝑘𝐺, and 𝐶𝐴
∗ =𝑝𝐴𝐻𝐴
𝑵𝑨𝑽= 𝒌𝑳 𝒂 (𝑪𝑨
∗ − 𝑪𝑨𝑳) (2.10)
Resistance to mass transfer in the gas film is much lower than that in the liquid film so 1𝐾𝐿
is
approximated to 1𝑘𝐿
, giving Equation (2.10). The overall mass transfer coefficient is approximated as
the liquid phase kLa which is often used to quantify oxygen transfer in mass transfer studies. 𝐶𝐴∗ is the
saturation concentration of oxygen in the liquid phase if the liquid phase is in equilibrium with the
bulk gas phase at the operating conditions.
2.2 Determination of the mass transfer coefficient (kLa) in a stirred tank
The value of kLa obtained can depend strongly on the method of measurement used (Gourich et al.,
2007; Atkins & Mavituna, 1983). Different methods are used to calculate kLa from measurable
quantities such as dissolved oxygen concentration and reaction rates. Most of these methods are based
on an oxygen mass balance on the liquid phase:
𝑑𝐶𝐿𝑑𝑡
= 𝑘𝐿𝑎(𝐶∗ − 𝐶𝐿) − 𝑂𝑈𝑅 (2.11)
where 𝐶∗ is determined from the partial pressure of oxygen in the gas phase using Henry’s law.
Various models are applied to the gas phase in order to determine this partial pressure. The gas phase
can be assumed to be a plug or perfectly mixed, with the change in concentration in this gas phase
depending on the model (Villadsen et al, 2011; Linek et al., 1987: Ruchti et al, 1981).

2-4
2.2.1 Sulphite oxidation method
Sulphite is oxidised by oxygen to give sulphate in the reaction:
𝑆𝑂3
2− + 1
2 𝑂2
→ 𝑆𝑂4
2− (2.12)
The rate of sodium sulphite oxidation is measured by titrating samples from the reactor with standard
iodide-iodate solution at different times and the amount of sodium sulphite remaining can be
determined subsequently. It is accepted that in the presence of a catalyst, the rate of sulphite oxidation
is high enough such that the dissolved oxygen (DO) concentration in the reactor remains negligible. If
the reaction is fast enough that the reaction is mass transfer limited and oxygen is consumed at the
rate at which it is transferred into the liquid phase (Garcia-Ochoa & Gomez, 2009; Villadsen, Nielsen
& Liden, 2011) Equation (2.11) becomes Equation 2.13
𝑂𝑇𝑅 = 𝑘𝐿𝑎 (𝐶∗ − 𝐶𝐿) = 𝑘𝐿𝑎 𝐶∗ =
1
2 𝑑𝐶𝑆𝑂32−
𝑑𝑡 (2.13)
The sulphite method is useful where a dissolved oxygen (DO) electrode may be too slow to record
fast changes in concentration, or may influence hydrodynamic properties of some small reactors such
as microwells. However, it is not widely recommended because adding a salt can alter the
hydrodynamic properties of the liquid and affect the kLa value (Garcia-Ochoa & Gomez, 2009;
Bandaiphet & Prasertsan, 2006; Gogate & Pandit, 1999). Linek & Vacek (1981) reported that
increasing the concentration of sulphite resulted in a reduction in the absorption rate of oxygen into
the solution due to the reduced solubility and diffusivity of oxygen in sulphite solutions. Literature on
the sulphite oxidation method also varies on the correct sulphite and catalyst concentrations to be used
in order to maintain a diffusion-limited reaction without enhancing mass transfer by a reaction. If the
reaction is too fast, it will occur in the liquid film, resulting in enhanced mass transfer, thus a higher
value for observed kLa (van’t Riet, 1979). Puskeiler & Weuster- Botz (2005) suggest a Co2+
concentration of 10-3 M. The Hatta number (Ha) is a measure of kLa enhancement due to chemical
reaction and can be used to determine the region in which the reaction is zero order in sulphite
concentration (Ruchti et al., 1985). This region can also be found experimentally.
2.2.2 Dynamic gassing in method
In the dynamic gassing in method, nitrogen is sparged into the liquid until the DO concentration is
zero. Air or oxygen is then sparged into the liquid and the change of DO concentration with time is

2-5
measured using an oxygen electrode. If water is used and there are no microorganisms (𝑂𝑈𝑅 = 0),
integrating the mass balance on the liquid phase, Equation ((2.11)), gives Equation (2.14) where 𝐶0 is
the initial DO concentration at time 𝑡0. The kLa is the slope of a plot of ln 𝐶∗−𝐶𝐿
𝐶∗−𝐶0 against (𝑡 − 𝑡0).
Only the linear portion of this graph is taken into consideration because initially, residual bubbles of
nitrogen are still present in the liquid and a change in gas supply may result in a different bubble
regime. There is therefore a transition period before a steady surface area is established (Robinson &
Wilke, 1973; Ruchti et al., 1981). This method is well documented, widely used and gives accurate
values of kLa (Garcia-Ochoa & Gomez, 2009; Gourich et al., 2007).
𝑙𝑛𝐶∗ − 𝐶𝐿𝐶∗ − 𝐶0
= −𝑘𝐿𝑎(𝑡 − 𝑡0) (2.14)
In the presence of microorganisms, OUR can be determined using Equation (2.15) by switching off
the oxygen supply and measuring the change in oxygen concentration with time.
𝑂𝑈𝑅 =
𝑑𝐶𝐿𝑑𝑡
(2.15)
Drawbacks to the dynamic method are that a delay in the response of the DO electrode to changes in
oxygen concentrations, if not accounted for, will give inaccurate values of the mass transfer
coefficient. This delay is caused by a resistance to oxygen transfer around or inside the electrode
(Ruchti et al., 1981). The response time constant of an oxygen electrode is the time it takes for the
electrode to reach 63% of the final value after a step change (Garcia- Ochoa & Gomez, 2009; Tribe et
al., 1995; Van’t Riet, 1979). This time should be less than kLa−1 by a factor greater than ten in order
to obtain accurate values (Garcia-Ochoa & Gomez, 2009; Gourich et al., 2008). A DO electrode with
response time constant of the same order as kLa-1can still be used but the values of kLa obtained have
to be corrected (Gourich et al. 2008).
Response of a DO electrode can be modelled as first order according to Equation (2.16), in which 𝐶𝑚
is the concentration displayed on the DO meter, while 𝐶𝐿 is the actual concentration of oxygen in the
liquid phase and 𝜏𝑟 is the response time constant of the electrode (Tribe et al., 1995). Solving
Equations (2.16) and (2.11) simultaneously gives Equation (2.17) which accounts for the delay in the
DO electrode response and gives more accurate values for kLa.
𝑑𝐶𝑚𝑑𝑡
=𝐶𝐿 − 𝐶𝑚𝜏𝑟
(2.16)

2-6
𝐶𝑚 = 𝐶𝑠𝑎𝑡 +
𝐶𝑠𝑎𝑡 − 𝐶01 − 𝜏𝑟𝑘𝐿𝑎
[𝜏𝑟𝑘𝐿𝑎 exp (−(𝑡 − 𝑡0)
𝜏𝑟) − exp(−𝑘𝐿𝑎 (𝑡 − 𝑡0))] (2.17)
Tribe et al. (1995) used an electrode with a response time of 15 s and found that the error obtained
when electrode response was neglected ranged between 10% and 60% for values of kLa between 1.8
and 9 min-1. Error increased with increasing kLa.
In bubble column studies with an electrode with a response time of 7 seconds, Gourich et al. (2008)
found kLa without accounting for electrode response to be in agreement with the corrected kLa at low
gas velocities. At higher gas velocities, which correspond to higher values of kLa of about 4.5 min-1,
there was up to 40% difference in the values. It can be noted that the discrepancy is still high even
though 𝜏𝑟−1 is greater than kLa at these conditions.
Correia & Clarke (2009) found no significant difference in the values of kLa obtained with or without
accounting for response time of the electrode. The response time of the electrode used in their studies
is not reported, but it may have been negligibly small.
2.2.3 Hydrogen peroxide method
In this method, the rate at which oxygen is transferred from the liquid phase to the gas phase is
measured. Hydrogen peroxide decomposes in the presence of catalase according to Equation (2.18)
(Villadsen et al, 2011). The rate of reaction is first order in both peroxide and catalase concentration.
Hydrogen peroxide is fed continuously into the reactor at a known rate and concentration of 𝑄𝐻2𝑂2𝑓
and 𝐶𝐻2𝑂2𝑓 respectively, and oxygen concentration in the liquid phase (𝐶𝐿) is measured after steady
state is reached. The kLa can then be calculated using Equation (2.19). Aeration and agitation are kept
constant as in the other methods.
2𝐻2𝑂2
𝑐𝑎𝑡𝑎𝑙𝑎𝑠𝑒→ 2𝐻2𝑂 + 𝑂2 (2.18)
𝑘𝐿𝑎 (𝐶∗ − 𝐶𝐿) = −
1
2 𝑄𝐻2𝑂2𝑓
𝐶𝐻2𝑂2𝑓
𝑉 (2.19)
As with the sulphate oxidation method, this method works where a DO electrode response is too slow.
However, unlike with the sulphite method, physical properties of water are only altered slightly, and

2-7
the product of the reaction is water which may be reused over and over again. The concentration of
oxygen in the gas phase has to be known in order to estimate C*.
Instead of catalase, Muller & Davidson (1992), Pinelli et al. (2010) and Vasconcelos et al (1997) used
MnO2 as the catalyst and obtained similar results, suggesting that the solid particles did not reduce
mass transfer area at the low concentration it was used. Of concern when using this method is that the
additional oxygen bubbles generated may result in overstating of kLa (Muller & Davidson, 1992).
2.2.4 Oxygen balance method
The amount of oxygen transferred to the liquid phase can be determined by measuring amount of
oxygen in the inlet and outlet gas streams and in the liquid, and then carrying out a mass balance at
steady state as shown in Equation 2.20 (Garcia-Ochoa & Gomez, 2008). The gas volumetric flow rate
and concentration are denoted by QG and CG respectively. This method requires very sensitive
equipment to detect small and fast changes in oxygen concentration.
𝑄𝐺𝑓𝐶𝐺𝑓− 𝑄𝐺
𝑒𝐶𝐺𝑒 = 𝑘𝐿𝑎 (𝐶∗ − 𝐶𝐿) (2.20)
2.2.5 Dynamic pressure method
Gogate & Pandit (1999) and Correia & Clarke (2009) propose that kLa values reported from the
dynamic method may be lower than the actual kLa values and that dynamic pressure method (pressure
step procedure), which is relatively new, is more accurate. This method may be used for aqueous and
electrolyte solutions (Correia & Clarke, 2009; Linek et al., 1993). To find kLa using this method, the
pressure of the system is subjected to an upward step change. This increases partial pressure of
oxygen in the gas phase. Dynamic pressure method still involves measuring oxygen concentration in
the liquid phase after each pressure step change; therefore response time of the oxygen electrode has
to be accounted for. The kLa from dynamic gassing out has been found to be close to the more
accurate value obtained from the pressure step when the lag response of the oxygen electrode is taken
into account.
The dynamic gassing in method was chosen for the present study because it is simple and easy to
conduct, and the delay in the probe response was small enough to give accurate values when corrected
for.
2-8
2.3 Factors affecting oxygen transfer and kLa in stirred tank reactors
The rate and extent of mass transfer of oxygen in bioreactors is affected by physical properties of the
system under consideration and by operating conditions in the reactor. Oxygen transfer rate can be
improved by increasing the concentration gradient (𝐶∗ − 𝐶𝐿) across the distance over which transport
occurs (z). 𝐶∗ is affected by changing the pressure and temperature of the system because the
solubility of oxygen in water changes with temperature and pressure (Dhanasekharan et al., 2005;
Welty et al, 2001; Tromans, 1998; Atkinson & Mavituna, 1983). These conditions are generally kept
constant when comparing mass transfer rates between reactor systems.
When Equations (2.2) and (2.3) are considered, it can be seen that kLa is affected by the diffusivity of
oxygen in the liquid (DAB), thickness of the fictitious liquid film through which oxygen diffuses (z)
and the volumetric surface area across which oxygen is diffusing (𝑎). Improving DAB and 𝑎 will result
in higher kLa, while increasing the film thickness will give a lower kLa. The diffusivity and
concentration gradient of oxygen in the bioreactor are often limited by operating temperature and
pressure (Garcia- Ochoa & Gomez, 2009), therefore improving oxygen mass transfer in bioreactors is
largely done through maximising mass transfer area and oxygen concentration gradient. The surface
area and film thickness cannot be directly measured or controlled in stirred tank reactors; however
some operating conditions which are known to affect these variables can be controlled and used to
improve kLa.
2.3.1 Agitation
The liquid phase can be agitated by mechanical agitators or by air sparging. Impeller agitation
significantly increases the volumetric interfacial surface area by creating small bubbles and breaking
up large bubbles (Dhanasekharan et al, 2005; McCabe et al., 2001). Reduced bubble size also results
in greater gas holdup (Clarke & Correia, 2008; Joshi et al., 1981). Surface area increases with gas
holdup according to Equation (2.21) (Villadsen et al., 2011; Gogate et al., 2000).
𝑎 = 6
𝜀𝐺(1 − 𝜀𝐺)𝐷𝑏
(2.21)
Mixing also facilitates a uniform concentration gradient between the liquid and gas phases, thus
enhancing oxygen mass transfer rate.
In stirred tank reactors, increasing the agitation rate generally results in increased kLa up to a
maximum (Kapic & Heindel, 2006; Peskelier & Weuster-Botz, 2005; Stenberg & Andersson, 1988;

2-9
Robinson & Wilke, 1973) and agitation is often limited by the need for energy efficiency as the
enhancement of kLa with agitation is not linearly proportional to the increased energy requirement
(Galaction et al., 2004). For comparison purposes, aeration efficiency can be described by Equation
(2.22) (Garcia-Ochoa & Gomez, 2008; Rodriguez et al., 2012). Agitation rate is expressed in terms of
power input per unit volume of reactor (𝑃/𝑉 ).
𝐴𝑒𝑟𝑎𝑡𝑖𝑜𝑛 𝑒𝑓𝑓𝑖𝑐𝑖𝑒𝑛𝑐𝑦 =
𝑘𝐿𝑎
𝐸 (2.22)
2.3.2 Gas flow rate
If the residence time of the gas in the reactor is high, oxygen transfer into the liquid will result in a
reduction in the partial pressure of oxygen in the gas phase. This reduces the driving force (𝐶∗ −
𝐶𝐿) (Villadsen et al., 2011; van’t Riet, 1979), resulting in slower mass transfer rates.
At low stirring speeds, an increase in the gas flow rate improves agitation of the liquid phase as well
as kLa. Increased agitation from air flow results in the same benefits as with increased mechanical
agitation, though not necessarily to the same degree. Robinson & Wilke (1973) found that doubling
the gas flow (0.5 vvm to 1 vvm) in distilled water did not have an effect on kLa at high agitation rates
(600 – 1200 rpm), while Clarke et al. (2006) report that even at high agitation rates, changing the
aeration rate impacts kLa for air flow rates less than 0.7 vvm.
The primary effects of increasing gas flow rate in a stirred tank are therefore improved agitation,
volumetric mass transfer area and concentration gradient.
2.3.3 Broth composition
Solubility and diffusivity of oxygen in the liquid phase varies depending on the physical properties of
the liquid. Some solutes affect the formation and size of bubbles, which in turn determines the
interfacial surface area in the reactor (Correia & Clarke, 2009; Gourich et al., 2008; Ratledge &
Kristiansen, 2006; Gauthier et al., 1990; Ruchti et al., 1985; Atkinson & Mavituna, 1983). Galaction
et al. (2004) compared oxygen mass transfer in a stirred tank for microbial suspensions containing
non-respiring cells (Propionibacterium shermanii, S. cerevisiae, Penicillium chrysogenum, mycelial pellets
and free mycelia) to simulated broths of the same viscosity with no cells present. They found that
biomass accumulation in the reactor caused increased viscosity of the broth and reduction in oxygen
solubility, and that reduction in the mass transfer rate was mainly a result of cells blocking the

2-10
surfaces of the bubbles, thus reducing mass transfer area. In yeast fermentation, doubling cell
concentration from 60 g/l dry weight to 120 g/l dry weight reduced kLa by 25 %. Carboxymethyl
cellulose was used to increase viscosity of the broths without cells. Germain et al. (2007) and
Bandaiphet & Prasertsan (2006) also found that increased viscosity from biomass concentration gave
lower oxygen transfer rates. Furthermore, Galaction et al. (2004) related kLa to power consumption by
the impeller. They found that energy efficiency decreased with increased power consumption.
Dissolved components in the reactor also impact oxygen transfer rates. The kLa was 0.3 min-1 in tap
water, and 0.12 min-1 with 10 wt% molasses. (Deckwer et al., 1974). Similar data are reported by
Stieger (1999), relating to the lysine bioprocess by Clarke et al. (2006) and Clarke & Correia (2008)
who found that aqueous solutions of hydrocarbons with oxygen in their molecular structure increased
kLa. Wilke & Robinson (1973) report that ionic solutions gave higher kLa values than distilled water
using the dynamic method, and that the difference was greater at higher agitation rates up to a certain
limiting ionic concentration.
Comparison of kLa between systems should therefore take into account these effects. In addition,
where mass transfer studies are conducted in media different to that used in a bioreactor, it is valuable
to consider how results would be affected by changes in the broth.
2.4 Correlation of kLa in stirred tank reactors
Because the variables have an indeterminate collective effect on gas-liquid mass transfer, one has to be cautious when comparing kLa values obtained in different systems. Figure 2.2 shows results obtained for reactors of different volumes and aeration rates, but similar geometries. Reactor specifications (working volume (V), reactor diameter (T) and impeller type and diameter (D)) for these studies are given in

2-11
Table 2.1. The studies were conducted with water in stirred tanks. In the Robinson & Wilke (1973)
and Stenberg & Anderson (1988) studies, aeration rate was varied for the different agitation rates.
Figure 2.2: Variation of kLa with agitation power for different studies (Stenberg & Anderson,1988 ; Robinson
& Wilke, 1973 ■; Shukla et al., 1999 ▲; Williams., 2005 ×; Chandrasekharan & Calderbank, 1981 )
0.1
1
10
0 2 4 6 8 10
k La
(min
-1)
Eagitation (kW m-3)

2-12
Table 2.1: Reactor specifications for kLa studies shown in Figure 2.2
Reference Reactor specifications Air flow rate
(vvm)
Williams (2005) V = 0.0045 m3, T= 0.18 m, H/T =1
2 Rushton turbine impellers, D = 0.06 m
Dynamic gassing in method
1, 1.25, 1.5
Shukla et al. (1999) V = 0.00512 m3, H/T = 1.19
Rushton turbine & Pitched blade downflow
impellers, D = 0.074 m
Dynamic gassing in method
0.56
Stenberg & Andersson
(1988)
V= 0.12 m3, T = 0.54 m, H/T = 1
Single Rushton turbine impeller, D = 0.178 m
Dynamic gassing in method
25, 48
V= 0.6 m3, T = 0.95 m, H/T = 1
Single Rushton turbine impeller, D = 0.305 m
Dynamic gassing in method
5, 10
V = 3 m3, T = 1.56 m, H/T = 1
Single Rushton turbine impeller, D = 0.521 m
Dynamic gassing in method
1, 2, 4
Chandrasekharan &
Calderbank (1980)
V= 1.43 m3, T=1.22 m
Pressure step method 0.17, 0.36, 0.56
Robinson & Wilke
(1973)
V= 0.0025 m3, T = 0.154 m, H/T = 1
Single Rushton turbine, D = 0.0508 m
Dynamic gassing in method
0.5, 15
The results illustrate how widely kLa varies (0.6–3 min-1 at 0.5 kW m-3) even with seemingly similar
operating conditions. Although it has been found that the effects of agitation power input on kLa are
not affected by stirrer type or number of stirrers for vessels with H/D close to or less than one (Van’t
Riet, 1979); dissimilarities among various studies remain.
Despite the variations, it has been agreed that kLa in a laboratory scale stirred tank reactor is related to
the gassed power input into the reactor and superficial gas velocity (𝑢𝐺) by Equation (2.23), where C1,
α and β are constants dependent on the reactor under investigation, and P is the power supplied to the

2-13
impeller and V is the operating volume of the reactor (Garcia-Ochoa & Gomez, 2009; Kapic &
Heindel, 2006; Van’t Riet, 1979). Schlüter & Deckwer (1992) found that kLa was better correlated
with aeration rate in units of vvm for comparison of reactors at different scales (72 L to 3000 L).
Typical values of the constant and exponents for Equation (2.23) in an air- water system are given in
Table 2.2. Gogate et al. (2000) report the same ranges as Van’t Riet (1979) and suggest that the value
of β depends on superficial gas velocity (𝑢𝐺). At high enough 𝑢𝐺, β could be as low as 0.2. The
correlation only provides loose bounds on variation of kLa with agitation power input and aeration rate
as indicated by the range of values in Table 2.2.
Table 2.2: Typical values for constants in Equation (2.23) for an air- water system in a stirred tank reactor
α β C1 Reference
0.47
0.59
0.59
0.35- 0.5
0.6
0.55
0.4
0.3- 0.6
0.04
0.04
0.00495
0.015
Kapic & Heindel (2006)
Nocentini et al. (1993)
Linek et al. (1987)
Van’t Riet (1979)
2.5 Principles of Venturi aeration
Venturi aerators are based on the first law of thermodynamics and, for incompressible fluids, can be
defined by the Bernoulli equation given by Equation (2.24).
Fluid flow is assumed to be steady and heat transfer is negligible (Welty et al., 2001). The narrow
throat of the venturi results in increased fluid velocity which corresponds to lower pressure in the
throat section. If the pressure drop results in pressure that is lower than atmospheric pressure, air is
forced from the atmosphere through the holes in the wall of the neck into the pipe without the need for
pumping (Jackson & Collins, 1964; Baylar & Ozkan, 2006). Gas entrained in the liquid is in the form
𝑘𝐿𝑎 = 𝐶1 (
𝑃
𝑉)𝛼
𝑢𝐺𝛽 (2.23)
𝜋 +
1
2𝜌𝐿𝑣
2 + 𝜌𝐿𝑔ℎ = 𝑐𝑜𝑛𝑠𝑡𝑎𝑛𝑡 (2.24)

2-14
of finely dispersed bubbles (Bauer, 1963; Cramers, 1992). When the liquid flows through the
divergent part of the tube, it reduces speed and regains most of its pressure energy (Bauer et al.,
1963).
Figure 2.3: Schematic of a venturi device
The amount of gas discharged through a small opening across a pressure drop can be calculated from
Equation (2.25), where 𝜋1 and 𝜋2 are the upstream and downstream pressures of the gas respectively.
In the case of the venturi aerator, 𝜋1 is atmospheric pressure and 𝜋2 is the pressure in the throat of the
venturi because air is drawn from the atmosphere into the aerator. The symbols C and A the discharge
coefficient and cross sectional area of the air hole respectively, 𝛾 is the ratio of specific heat of air,
𝜌𝑎𝑖𝑟 is the density of air at atmospheric pressure and 𝑔𝑐 is a dimensional constant (Federal Emergency
Management Agency, 1989: B-4). Equation (2.25) can be used to estimate the flow rate of air through
the venturi air hole from the atmosphere into the venturi throat.
𝑄𝐺 = 𝐶𝐴√2 𝑔𝑐𝜌𝑎𝑖𝑟 𝜋1 (𝛾
𝛾 − 1) [(𝜋1𝜋2)
2𝛾− (𝜋1𝜋2)
𝛾+1𝛾] (2.25)
Friction in the throat section of the venturi results in an overall pressure drop in the liquid (Baylar &
Ozkan, 2006; Jackson 1964; Bauer, 1963). Bauer (1963) reported that the pressure drop tripled from
1.3 kPa to 4 kPa when the liquid flow rate was doubled from 20 L min-1 to 40 L min-1. A higher
pressure drop requires a pump with higher capacity to drive liquid through the venturi loop.
Most, if not all, of the gas mass transfer is expected to occur in the divergent outlet and the liquid
exiting the venturi is nearly saturated with oxygen (Jackson & Collins, 1964). Bauer et al. (1963)

2-15
found that 80% of oxygen transferred to the liquid stream in a venturi aerator was transferred at a
distance less than 25 cm away from the air hole in a 80 cm divergent outlet.
2.5.1 Liquid flow rate
The rate at which liquid is pumped through a venturi device has a considerable effect on oxygen
transfer in a water-air system because it determines the amount of air flowing into the venturi (Dong
et al., 2012; Baylar & Ozkan, 2006). Dong et al. (2012) found that while increasing liquid flow rate
through the venturi increased kLa by 1.5 times, the rate of increase of kLa was lower for higher liquid
flow rates. This was attributed to reduced residence time of bubbles in the tank at higher liquid flow
rates. Bauer (1963) proposed that the increased turbulence that came with higher flow rates resulted in
greater shear stress which disperses the gas into fine bubbles that in turn result in greater mass transfer
area.
Increasing liquid flow rate means increasing pressure drop across the venturi (Bauer, 1963) and
consequently energy consumption of the pump. This implies that there is a maximum flow rate at
which the reactor’s energy efficiency is optimal. Excessive velocities could also result in cavitation at
the throat of the venturi (Bauer et al., 1963; Jackson, 1964). In addition, an undesirable “annular flow
regime”, in which a ring of water flows around air core, was observed by Gourich et al. (2008). They
found that the annular regime occurred at the lower range of liquid flow rates of up to 480 L/min at an
unspecified velocity. On the other hand, Baylar & Ozkan report that the ratio of gas flow to liquid
flow (QG/QL) decreases with increasing liquid flow rate after reaching a maximum. Baylar & Ozkan
(2006) show that QG/QL is higher at smaller pipe diameter for the same liquid volumetric flow rate
(higher liquid velocity). They were measuring flow rate of air out of the tank instead of at the inlet of
the venturi therefore smaller gas flow rates could mean that more gas was absorbed into the liquid.
These findings suggest that a high volumetric liquid flow rate would result in high oxygen mass
transfer rates. However, as shown in
Table 2.4, kLa investigations in venturi aeration have mostly been with liquid flow rates less than 1
vvm.
2.5.2 Venturi geometry
Hydrodynamic studies in venturi aerators have been done to show the effects of liquid flow rate
(Briens et al., 1992; Baylar & Ozkan 2006; Gourich et al. 2007; Gourich et al. 2008) and venturi
configuration (Thalasso et al., 1995; Gourich et al. 2007; Dong et al. 2011) on oxygen mass transfer.
Other studies show that oxygen mass transfer in venturi-aerated systems may be improved by
changing the design of the aerator. Properties such as the area of throat (Baylar & Ozkan, 2006;

2-16
Jackson & Collins, 1964), the shape of the throat (Batterham et al., 1994) and the size of the divergent
and convergent angles (Baylar & Ozkan, 2006) were found to affect mass transfer. The aerator design
affects the amount of air drawn into the pipe and consequently mass transfer rate.
If significant oxygen mass transfer happens only in the venturi aerator, optimisation of the aerator
design would improve mass transfer considerably. However, kLa seems to still be strongly influenced
by other parameters such as liquid flow rate and hydrodynamics in the tank, as discussed in Sections
2.5.1 and 2.5.3.
2.5.3 Venturi-reactor configuration
Jackson (1964) and Rodriguez et al. (2012) assumed that most, if not all, of significant mass transfer
occurs between the venturi throat and outlet into the tank, suggesting that changes made downstream
of the venturi aerator would not affect oxygen mass transfer rates. On the other hand Briens et al
(1992) measured kLa separately in the venturi and in the tank, which they called the bubbling zone,
and found that mass transfer occurs in both with kLa obtained being roughly similar.
Gourich et al. (2008) and Briens et al. (1992) report that liquid flowing down from a venturi into the
reactor (downflow) gave higher kLa than liquid flowing up into the reactor (upflow). In the case of
Gourich et al. (2008), kLa was doubled by changing the direction of flow into the reactor. This could
be attributed to the increased residence time of bubbles in the reactor when a downflow configuration
is used (Briens et al., 1992). At low liquid flow rates (less than 1 L s-1) kLa also doubled when the
liquid level in the tank was doubled (Gourich et al. 2007). In a study carried out with an upflow
aeration system, Dong et al. (2011) found that for outlet depths between 20 and 50 cm, the highest kLa
was achieved when the outlet of the venturi was at a depth of 40 cm below the liquid surface. These
results could also be due to increased residence time of bubbles in the tank.
Jackson (1964) found that venturi aerators in series with another did not significantly improve mass
transfer rates because the liquid became saturated in the first venturi. For a venturi of 7/8 inch internal
diameter, Bauer et al. (1963) found not much difference in CO2 absorbed 16.7 and 28.8 inches from
the throat, owing to this saturation. A second venturi increased pressure loss across the line, which
would result in greater power requirement for the pump. Dong et al (2011) confirmed this when no
improvement in kLa was shown for aerators connected in series, but they did find that connecting
venturis in parallel improved kLa. Investigations were at the same total flow, rate, but different venturi
aerators were used for the different set-ups and the variations resulting from these differences were
not taken into account.
2-17
In summary, studies on the connection of the ventui aerator to the reactor indicate that oxygen transfer
is not limited to the venturi outlet, but that significant oxygen mass transfer occurs in the tank
downstream of the reactor. Oxygen mass transfer in venturi aerated reactors can therefore be
improved by optimising mass transfer in the tank.
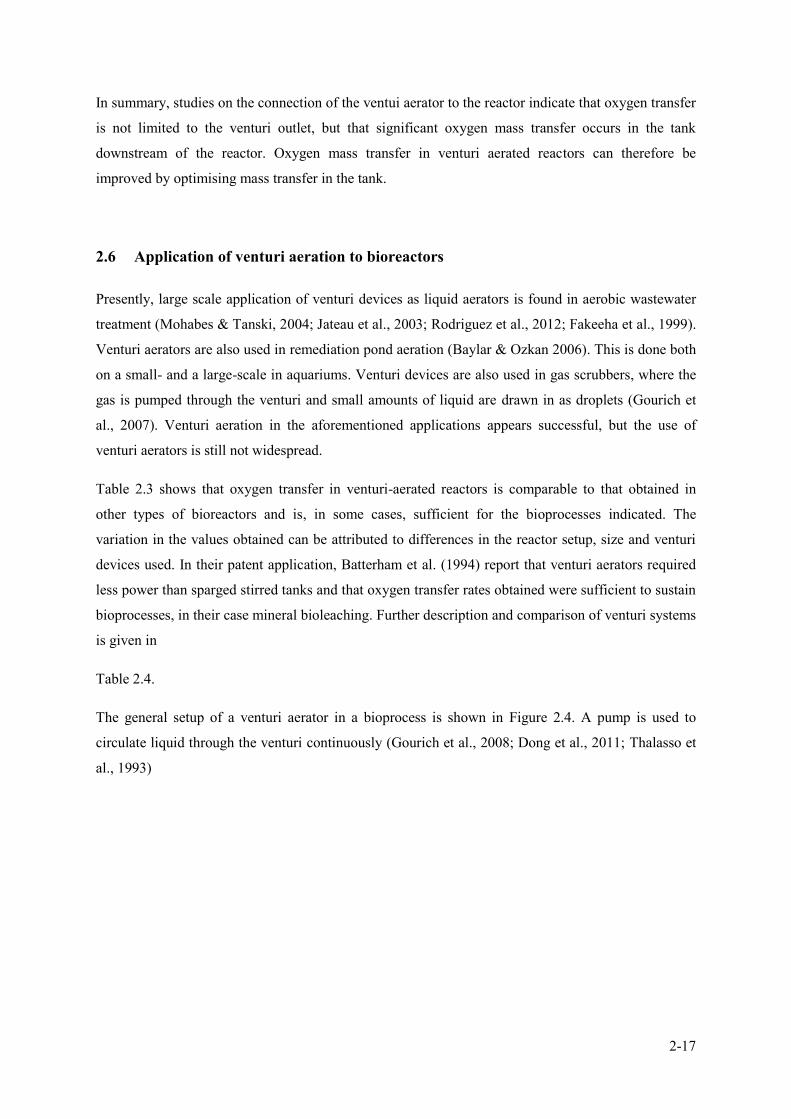
2.6 Application of venturi aeration to bioreactors
Presently, large scale application of venturi devices as liquid aerators is found in aerobic wastewater
treatment (Mohabes & Tanski, 2004; Jateau et al., 2003; Rodriguez et al., 2012; Fakeeha et al., 1999).
Venturi aerators are also used in remediation pond aeration (Baylar & Ozkan 2006). This is done both
on a small- and a large-scale in aquariums. Venturi devices are also used in gas scrubbers, where the
gas is pumped through the venturi and small amounts of liquid are drawn in as droplets (Gourich et
al., 2007). Venturi aeration in the aforementioned applications appears successful, but the use of
venturi aerators is still not widespread.
Table 2.3 shows that oxygen transfer in venturi-aerated reactors is comparable to that obtained in
other types of bioreactors and is, in some cases, sufficient for the bioprocesses indicated. The
variation in the values obtained can be attributed to differences in the reactor setup, size and venturi
devices used. In their patent application, Batterham et al. (1994) report that venturi aerators required
less power than sparged stirred tanks and that oxygen transfer rates obtained were sufficient to sustain
bioprocesses, in their case mineral bioleaching. Further description and comparison of venturi systems
is given in
Table 2.4.
The general setup of a venturi aerator in a bioprocess is shown in Figure 2.4. A pump is used to
circulate liquid through the venturi continuously (Gourich et al., 2008; Dong et al., 2011; Thalasso et
al., 1993)

2-18
Figure 2.4: Setup of a venturi aerator in a semi-batch process
Table 2.3: Comparison of oxygen transfer in venturi-aerated reactors to sparged reactors
Reference Aerator type System kLa
(min-1)
SOTR
(mg O2 l-1h-1)
Rodriguez et al.
(2012)
bubble column water 0.35-0.66 133-190
Dong et al. (2011) venturi water 0.14-0.21 76-115
Gourich et al (2007) venturi water 2.7 1458
Jackson (1964) venturi water 0.1-0.28 47-133
Deckwer (1974) bubble column water 9
Ugwanyi (2008) Stirred tank Bacillus in Tanner
glucose medium
224-512
Kocabas et al. (2006) Stirred tank Bacillus in fructose
based medium
260
d'Hugues (1997) Stirred tank Chalcopyrite
bioleach suspension
1440

2-19
2.7 Cell damage in venturi aerators
Sparging has been associated with cultured animal cell damage in bioreactors (Chisti, 2000). In some
cases, high agitation rates coupled with sparging in stirred bioreactors have resulted in high shear
rates close to the impeller, which will damage cells or inhibit cell activity (Bandaiphet & Prasertsan,
2006; Sanchez Perez et al., 2006). Thalasso et al. (1993) report that A. wieringae maintained its
capacity to metabolize the gaseous mixture of hydrogen and carbon dioxide to acetate for a number of
hours even after circulation through a venturi aerator. So far, there have been no reports on studies
investigating cell damage due to shear stresses in the venturi. Nevertheless, it is important to consider
the possibility.
2.8 Measuring kLa in venturi aerated reactors
As in most studies with stirred tanks, kLa with venturi operation has been determined by performing a
mass balance on the concentration of oxygen in the liquid phase, although there are inconsistencies on
the models used to describe the system. Results obtained from the various studies are given in
Table 2.4.
Baylar & Ozkan (2006), Fakeeha et al. (1999), and Dong et al. (2011) used the dynamic gassing in
method and applied the same equation used for a stirred tank (Equation 2.14).
ln (𝐶∗ − 𝐶𝐿𝐶∗ − 𝐶0
) = −(𝑘𝐿𝑎) 𝑡 (2.14)
Jackson (1964), however, points out that kLa obtained this way does not have any physical meaning
because mass transfer area and concentration change from the tank, through the piping and across the
venturi aerator, and can therefore not be represented by one value.
Other investigations considered the mass transfer coefficient across the venturi only, assuming that
the significant oxygen mass transfer happens in the venturi (Jackson, 1964; Rodriguez, 2012). Jackson
(1964) used Equation (2.26) to find kLa which was not per unit volume as usually expressed, since
they reasoned that area per unit volume is not evenly distributed across the venturi.
𝑉𝑑𝐶𝐿𝑑𝑡
= 𝑘𝐿𝐴𝑉 (𝐶𝑉∗ − 𝐶𝑉,𝑚𝑒𝑎𝑛) (2.26)

2-20
Instead of a venturi aerator, Pandit et al (1990) aerated liquid in a centrifugal pump that also worked
as an air aspirator. They considered mass transfer in both the tank and across the aspirator as
described by Equations (2.27) and (2.28). The pump was taken to be a well-mixed CSTR. The
concentration of oxygen was measured in the tank and in the stream exiting the pump. Briens et al.
(1992) also separated mass transfer in the venturi from that in the tank. The kLa was measured from
passing of deoxygenated liquid through the venturi and into the tank in a steady-state process.
𝑑𝐶𝑉𝑑𝑡𝑉𝑉 = 𝐹(𝐶𝐿 − 𝐶𝑉) + 𝑘𝐿𝐴𝑉(𝐶𝑉
∗ − 𝐶𝑉) (2.27)
𝑑𝐶𝐿𝑑𝑡
=𝐹
𝑉𝑇 (𝐶𝑉 − 𝐶𝐿) + 𝑘𝐿𝑎𝑇(𝐶𝐿
∗ − 𝐶𝐿) (2.28)
Rodriguez et al (2012) measured DO concentration in the venturi outlet stream (CV) and in the stirred
tank (CL). To find kLa, they solved Equations Error! Reference source not found. and Error!
Reference source not found. simultaneously, assuming no mass transfer occurring in the stirred tank
and neglecting the contribution of the flow terms. Measurement of CV showed that DO concentration
in liquid coming out of the venturi aerator was close to saturation after ten seconds, whereas CL only
reached saturation after more than 500 seconds.
Gourich et al. (2007) modelled the venturi aerator and the tank as a single stirred tank reactor, and the
piping section before the aerator to have plug flow with contents having a residence time 𝜏𝑝𝑙𝑢𝑔. The
mass balance is shown in Equation (2.29). The flow rate and DO concentration of liquid flowing into
the reactor was taken to be the same as the one leaving the reactor time (𝑡 − 𝜏𝑝𝑙𝑢𝑔). Again kLa does
not have a strict physical meaning because volumetric mass transfer area is not spread evenly across
the venturi and the tank. The kLa and C* values were estimated from non-linear regression.
𝑑𝐶𝐿𝑑𝑡
=𝐹
𝑉𝑆𝑇
(𝐶𝐿(𝑡 − 𝜏𝑝𝑙𝑢𝑔) − 𝐶𝐿(𝑡)) + 𝑘𝐿𝑎𝑇 (𝐶𝐿∗ − 𝐶𝐿) (2.29)
The results for the different systems reported are shown in
Table 2.4. These kLa values can be compared with literature values of kLa for conventional sparged
and stirred reactors, but there has been no comparison of kLa in a venturi aerated reactor to that in a
stirred geometrically identical tank reactor in the same study. Therefore differences in kLa arising

2-21
from variations in reactor geometry and setup, and dissimilarities in kLa measurement are not taken
into account.
Table 2.4: kLa values for venturi-aerated systems under various operating conditions
Reference Operating volume (m3)
Liquid flow rate (vvm)
kLa (min-1)
Rodriguez et al (2012) 0.2 0.17 0.463
Dong , Zhu, Wu & Miller (2011)
2.8 0.0621 0.136
0.0664 0.168
0.0771 0.213
Gourich (2007) 0.35 ≈1.4 2.7
Fakeeha et al (1999) 0.0589 0.301 0.72
0.354 0.87
0.563 1.45
0.698 1.97
0.861 2.17
Jackson & Collins (1964) 66.2 0.0074 0.00356
Jackson (1964) 0.137 - 0.149 0.190 0.28
0.156 0.20
0.129 0.17
0.089 0.10
2.9 Energy consumption in bioreactors
Power correlations for stirred tank reactors discussed in (2.4) 2.4 only consider power used to agitate
the liquid phase by measuring power input to the impeller (Kapic & Heindel, 2006; Garcia-Ochoa &
Gomez, 2009; Van’t Riet, 1979) which can be calculated using Equation (2.30), where 𝑁𝑃𝐺 and 𝐷 are
the gassed impeller power number and impeller diameter respectively, 𝑛 is the stirrer speed and 𝜌𝐿 is
the liquid density. It has been found that agitation power input in a stirred tank is lower when gas is
present in the system due to the reduced apparent density of the gas-liquid suspension (Garcia-Ochoa
& Gomez, 2008). Bouaifi et al. (2001) included energy dissipated to the liquid by expanding gas
calculated using Equation (2.31) in their energy calculations. In bubble columns, liquid is agitated by
the expansion of sparged gas using Equation (2.31) and this is the power considered in comparisons
and correlations (Chisti, 1989). The power input to bubble columns calculated using this equation is in
some cases as little as a tenth of agitation power input into a stirred tank (Chisti & Jauregui-Haz,
2002). In both cases, the energy used to compress the gas sparged to the reactors is not typically
considered.

2-22
𝑃 = 𝑁𝑃𝐺𝑛3𝐷5𝜌𝐿 (2.30)
𝑃
𝑉= 𝜌𝐿𝑔𝑢𝐺 (2.31)
These calculations are sufficient to characterise mass transfer properties of reactors, but neglect the
overall cost and environmental impact of operating a bioreactor. In some cases, energy input for gas
compression is as much as four times higher than that for stirring (Atkinson & Mavituna, 1983).
Harding (2009) and Harding and Harrison (2008, under review) have demonstrated gas compression
to be the most significant contribution to energy input into the bioprocess across a range of processes:
bioplastic, penicillin and enzyme. It is therefore essential to include this energy when considering
total operating cost of the reactor.
Gourich et al. (2007), in studies with reactor volumes of 105-350 L, showed that for the same power
input, kLa in a venturi aerated reactor was half or less than that obtained by other researchers in bubble
columns and rectangular airlifts for energy consumption less than 5000 Wm-3. Equation (2.32) was
used to calculate energy supplied to the system. The first term on the right hand side is the work done
on the flowing water by the pump. 𝜋1 is the pressure of the water in the venturi throat and 𝜋2 is
atmospheric pressure. The water has a density of 𝜌𝐿 and travels a vertical distance ∆𝑧 at a velocity 𝑢
at the throat. The second term on the right had hand side is energy dissipated to the liquid phase in the
tank by gas expanding from a pressure of 𝜋1𝑔𝑎𝑠 to 𝜋2𝑔𝑎𝑠. By measuring the pressure of the water at
the throat of the venturi, any frictional losses upstream of the throat are neglected.
𝐸 =
𝑄𝐿𝑉[𝜋1 − 𝜋2 +
1
2𝜌𝐿𝑢
2 + 𝜌𝐿𝑔∆𝑧] +𝑄𝐺𝑉[𝜋1𝑔𝑎𝑠 − 𝜋2𝑔𝑎𝑠] (2.32)
Rodriguez et al. (2012) attained three times more oxygen transfer per unit energy expended in a
venturi-aerated reactor than that in a tank with a membrane diffuser. Their experiments were
conducted in the same reactor to eliminate variations introduced by differences in reactor geometry
and other experimental procedures. Power input to the pump and compressor were calculated using
Equations (2.33) and (2.34) respectively. This is the only mass transfer study found so far to account
for energy used to compress gas from atmospheric pressure to a higher pressure in the gas supply line.
This may also contribute to the results in favour of venturi. Equation (2.34) is also given by Boyce
(1999) for calculating energy needed to compress a gas adiabatically.
𝑃𝑤𝑎𝑡𝑒𝑟 𝑝𝑢𝑚𝑝 = 𝑄𝐿(𝑇𝐷𝐻)𝑊 (2.33)

2-23
𝑃𝑔𝑎𝑠 𝑐𝑜𝑚𝑝𝑟𝑒𝑠𝑠𝑜𝑟 =
𝑤 ∙ 𝑅 ∙ 𝑇
𝐾[(𝜋2𝜋1)𝐾
− 1] (2.34)
Correlating the kLa with power supplied to agitate the liquid in a reactor is useful to quantify the
energy efficiency of a reactor, but the total energy input is an essential parameter to consider when
focusing on the cost and environmental impact of bioreactors.

3-1
3 Hypothesis and key questions
Aerated stirred tank reactors have been used successfully in most aerobic bioprocessing operations,
but have high energy input for agitating and aerating the culture, with compression of air requiring a
significant portion of the total energy input. Venturi aerators are potentially a less energy-intensive
alternative to the mechanical agitation and air compression required in aerated stirred tanks. This is
because agitation and air bubbles are supplied by liquid being circulated in the bioreactor. In the
reviewed literature, venturi aerators have been shown to require much less energy input than aerated
stirred tanks for the same kLa values for the conditions investigated, although investigations have been
at low kLa.
The flow rate of the liquid circulated through the venturi and bulk fluid movement in the tank
influence the rate of mass transfer in a venturi-aerated bioreactor, with kLa increasing with liquid flow
rate. Most studies have only investigated flow rates less than 1 vvm (volume of liquid circulated per
total liquid volume per minute) which could explain why mass most transfer rates reported for
venturi-aerated reactors have been lower than those in aerated stirred tanks. Furthermore, the
comparisons in energy input in the STR and venturi systems have been across different systems and
neglected energy used for compression of air in stirred tanks, not required in the venturi. Differences
in kLa resulting from varying reactor geometries as well as measurement methods and data analysis
have not been considered across the comparisons.
Consequently, it would be useful to use identical tanks and the same analytical methods to compare
mass transfer between the STR and venturi systems, and to account for the full energy input,
including gas compression, in that comparison. Investigation of kLa in a venturi-aerated reactor at
liquid flow rates higher than 1 vvm would show whether mass transfer in these systems has
previously been limited by the liquid flow rate.
Oxygen mass transfer rates in microbial cultures with active cells are likely to deviate from those
obtained in water; therefore the adequacy of venturi aerators in an aerobic bioprocess should be
investigated. Additionally, the higher liquid flow rates result in additional shear stresses in the venturi
aerator. For that reason, the viability of cells that have been passed through a venturi aerator must be
explored.

3-2
3.1 Hypothesis
The venturi-aerated reactor is a promising energy efficient alternative to the conventional sparged
stirred tank bioreactor since the required energy consumption is lower in a venturi-aerated reactor
than that in a conventional sparged stirred tank reactor for the same volumetric mass transfer
coefficient.
3.2 Key questions
How does kLa and the associated gas-liquid transfer rates obtained by venturi aeration
compare with those in a sparged stirred tank?
What are the effects of different venturi-reactor configurations?
How is gas-liquid mass transfer affected by liquid flow rate through the venturi?
Does all gas-liquid mass transfer in the venturi aerated reactor occur in the venturi recycle
loop or is some attributed to fluid dynamics in the tank?
Is venturi aeration at high liquid flow rates more energy-efficient than conventional aeration?
Can a venturi aerator be used to obtain adequate OTRs to support processes in bioreactors?
How do shear rates in the venturi device affect cell activity?

4-1
4 Materials and Methods
4.1 Experimental set-up
4.1.1 Stirred tank reactor
All experiments were carried out for an air-water system at room temperature and atmospheric
pressure of 101.3 ± 1 kPa in an open cylindrical plastic vessel as shown in Figure 4.1, with
dimensions shown in Table 4.1. The vessel was fitted with a ring sparger (not shown) of the same
diameter as the impeller, placed at the bottom of the vessel, below the impeller. The sparger had 6
evenly distributed 1 mm holes facing up and was sealed at one end. Room temperature was 20 °C ±2
°C and did not vary significantly during a single run.
Figure 4.1: Schematic of reactor used in stirred tank experiments
To ensure that the ratio of the vessel diameter: liquid height was equal to 1, 16.3 L of Millipore
deionised water was used in the experiments. The kLa was measured for this tank at different agitation
rates and aeration rates. Agitation rates used and corresponding power input are listed in Table 4.2 .
For each of these agitation rates, air was sparged at rates of 0, 12, 16.5 and 25 L min-1.The power
input to the agitator was calculated from correlations based on the impeller type and Reynolds number
in the reactor. The details for power calculations are given in Section 4.4. A Rushton turbine attached

4-2
to a Rexon 14’’ drill press was used to agitate the liquid. The agitation rate was varied by changing
the arrangement of fan belts on the motor of the press and measured optically by a Veeder-root
tachometer, model 611. At each setting, the agitation rate varied by less than 5% at the different air
flow rates. There were three repeats for each agitation and aeration rate.
Table 4.1: Dimensions of reactor used in stirred tank experiments
Diameter, T (m) 0.275
Height of reactor (m) 0.405
H/T 1
Height of liquid in reactor, H (m) 0.275
Operating volume, V (L) 16.3
D/T 0.33
Impeller diameter, D (m) 0.122
Impeller clearance (m) 0.0917
Number of baffles 4
Baffle spacing (m) 0.216
Baffle width (m) (T/12) 0.0229
Sparger diameter (m) 0.275
Table 4.2: Agitation rates and corresponding power consumption
Agitation rate (rpm) Corresponding calculated
agitation power (Wm-3)
364 509
460 1027
550 1755
688 3435
836 6163
4.1.2 Venturi system
The same vessel used in stirred tank experiments was used in the venturi aeration studies with the set-
up shown in Figure 4.2. Two venturi aerators, a Mazzei model 684 injector (Aerator 1) and a Mazzei

4-3
model 384 injector (Aerator 2), were used in these experiments. Water was pumped around the circuit
using a KM-160 centrifugal pump connected to a Delta Electronics invertor (Model VFD007EL23A),
allowing for variable flow rate. Components were connected with reinforced rubber tubing of 20 mm
ID. The total liquid volume was maintained at 16.3 L, with liquid in the tank making up about 75% of
the total volume. The temperature was maintained at 20 °C ± 2 °C by pumping the solution from the
vessel through a 20 mm ID copper coil immersed in a cooling bath as shown in Figure 4.2.
The kLa was measured for an air-water system for the following setups:
Setup 1: Aerator 1
Setup 2: Aerators 1 and 2 in parallel. The two venturi outlet streams were not combined
before entering the tank.
In each case, dissolved oxygen concentration as a function of time was determined in the vessel for
varied flow rates of liquid pumped through the venturi. For Setup 1, DO concentration was also
determined 15 cm downstream of the venturi throat. For each flow rate, venturi outlet heights of 4 cm,
8 cm and 12 cm were used, except in the setup with venturi aerators in parallel, where only the 8 cm
height was investigated. The outlet height was measured from the bottom. Positions of the DO
electrodes, suction pipe and outlet pipe were kept as much in the same position as possible. The DO
electrode in the tank was kept at a third of the liquid depth. The air flow rate through the air hole in
Setup 1 was measured by a flowmeter connected to the air hole.
(a)
(b)
Figure 4.2: Schematic of experimental set-up for venturi aeration experiments (a) shows arrangement of
apparatus and (b) shows top-down view of components in the tank

4-4
4.1.3 Oxygen measurement equipment
DO in the vessel was measured and logged using an optical Thermo Scientific Orion Star RDO
electrode connected to a Thermo Scientific Orion Star A323 RDO/ DO meter. The electrode was
calibrated daily. The response time constant of the electrode (𝜏𝑟) was 18 seconds, measured by
zeroing the electrode in a saturated solution of Na2SO3, then immediately transferring the electrode
into an oxygen saturated solution and recording the change in DO concentration with time. Using
Equation (2.16) to model the electrode response, 𝜏𝑟 was determined from measured DO:
𝑑𝐶𝑚𝑑𝑡
=𝐶𝐿 − 𝐶𝑚𝜏𝑟
(2.16)
This value was also confirmed by directly measuring the time it took for the reading on the DO meter
to be 63 % of the saturated water value after a step change as indicated in literature (Van’t Riet, 1979;
Garcia- Ochoa & Gomez, 2009; Tribe et al., 1995). Measurements were carried out at different
agitation and air flow rates, and it was found that the electrode response was constant for different
operating conditions, indicating that the major resistance to mass transfer was internal to the
electrode.
The General Electric DOOPT20 instrument was used to measure DO at the venturi outlet, 15 cm
downstream of the throat. The instrument has a DOOPT microelectrode with a response time of 4
seconds
y = 3.33x - 0.16R² = 0.99
0.0
0.5
1.0
1.5
2.0
2.5
3.0
3.5
0.0 0.2 0.4 0.6 0.8 1.0
-ln(1
-(C
m/C
*))
Time (min)

4-5
Figure 4.3: Results obtained in the determination of 𝜏𝑟. The reciprocal of the slope of the trend line gives
electrode response time in minutes.
4.2 Dynamic method for measurement of oxygen transfer
The dynamic gassing in method, described in Section 2.2.2, was used to determine kLa in both the
stirred tank and venturi aerated tank due to its speed and simplicity. The greatest source of error was
the delayed electrode response. This was accounted for using a first order response model, discussed
in detail in Section 4.2.3.
4.2.1 Dynamic method in the stirred tank reactor
Liquid in the reactor was deoxygenated by sparging nitrogen into the reactor until the reading on the
DO meter was close to zero. The nitrogen flow was then switched off and air flow immediately
switched on at a set flow rate and change of DO concentration in the liquid phase was measured and
logged using the DO meter.
4.2.2 Dynamic method in the venturi-aerated reactor
As in the stirred tank, the liquid phase was deoxygenated using nitrogen gas. Nitrogen was fed
through the venturi air hole until DO concentration was close to zero. The nitrogen feed pipe was then
removed from the air hole, and air was allowed to flow freely through it. Increase in DO concentration
in the liquid was then measured and recorded by the meter.
4.2.3 Analytical method for kLa determination in the stirred tank
Equation (2.14) is the solution to the mass balance shown in Equation (2.11) with no oxygen
consumption. Using the least squares method, the error between 𝐶𝐿 measured by the electrode and
𝐶𝐿 predicted by the mass balance is minimised by solving for kLa in the mass balance. 𝐶∗ was
calculated from Henry’s Law with Henry’s constant (1.3 x 10⁻³ mol L-1 atm-1) obtained from Liley et
al. (1999). For each set of operating conditions, three runs were conducted and standard deviation
from the mean evaluated.
𝑑𝐶𝐿𝑑𝑡
= 𝑘𝐿𝑎𝑇(𝐶∗ − 𝐶𝐿) (2.11)

4-6
ln𝐶∗ − 𝐶𝐿𝐶∗ − 𝐶0
= −𝑘𝐿𝑎(𝑡 − 𝑡0) (2.14)
Figure 4.4 and Figure 4.5 are examples of how the measured DO changed with time when sparging air
into the reactor for each repeat at low agitation and high agitation rates respectively. Also shown is
the DO concentration when the lag in probe response is accounted for as given by Equation (4.1), and
how the mass balance model used to solve for kLa (Equation (2.14) fits the data. Experiments at other
experimental conditions show similar results.
Figure 4.4: Change of DO concentration in the tank with time at agitation power of 0.509 kW m-3 and 25 L min-
for: three repeats as measured by the electrode (); measurements corrected for delay in probe response for one repeat (○) and DO concentration as predicted by the mass balance in Equation 2.14 for one repeat (▬)
Figure 4.5: Change of DO concentration in the tank with time at agitation power of 15.36 kW m-3 and aeration rate of 12 L min-1 aeration for: three repeats as measured by the electrode (); measurements corrected for
0
1
2
3
4
5
6
7
8
9
10
0 1 2 3 4 5
DO
con
cent
ratio
n (m
g L
-1)
Time (min)
0123456789
10
0.0 0.5 1.0 1.5 2.0
DO
con
cent
ratio
n (m
g L
-1)
Time (min)

4-7
delay in probe response for one repeat (○) and DO concentration as predicted by the mass balance in Equation 2.14 for one repeat (▬)
4.2.4 Accounting for lag in electrode response
The DO electrode response time was measured to be 0.3 minutes. It was therefore expected that kLa
measurements of 3 min-1 or greater would be inaccurate. Lag in electrode response is corrected for
using Equation (2.16). Figure 4.6 confirms the need to account for electrode response at the values of
kLa. Solving Equation (2.16) for 𝐶𝐿 and using recorded DO concentration data (𝐶𝑚) gives an
approximation of the actual DO concentration in the liquid (𝐶𝐿) given in Equation (4.1).
𝑑𝐶𝑚𝑑𝑡
=𝐶𝐿 − 𝐶𝑚𝜏𝑟
(2.16)
𝐶𝐿 = 𝐶𝑚 + 𝜏𝑟
𝑑𝐶𝑚𝑑𝑡
(2.16)
𝐶𝐿,𝑛 = 𝐶𝑚,𝑛 + 𝜏𝑟 (
𝐶𝑚,𝑛+1 − 𝐶𝑚,𝑛−12 ∆𝑡
) (4.1)
Figure 4.6: The difference between kLa calculated with electrode response accounted for (kLa lag) and kLa
measured (no correction) in the stirred tank. The straight line represents the parity line where y=x.
0
1
2
3
4
5
6
7
8
9
10
0 2 4 6 8 10
k La
(min
-1)
kLa lag (min-1)

4-8
4.2.5 Analysis of venturi aerated reactor
For comparison between the stirred tank and venturi system, Equation (2.14) from the dynamic
method was also used to calculate kLa in the venturi-aerated system. Figure 4.7 shows how the model
from Equation (2.14) fits DO concentration corrected for the delay in electrode response for one
repeat.
Figure 4.7: Change of DO concentration in the tank for the venturi system with time as: measured by the electrode (); corrected for delay in probe response (○) and predicted by Equation 2.14 (▬) at liquid flow rate of 42 L min-1 and 8 cm outlet height. The measured values show the average of 3 repeats.
The mass balance used in the dynamic method, however does not strictly apply to venturi aeration
because aeration starts in the venturi, which does not have the same mass transfer coefficient as the
rest of the tank. Other researchers (Rodriguez et al., 2012 & Jackson, 1964) have applied this equation
to just the venturi device and assumed that all mass transfer happens in the venturi. This is inaccurate
for this system because many small bubbles formed in the venturi and were observed to be transferred
to the tank. Mass transfer equations should therefore take into account the different conditions in the
tank and in the venturi aerator.
A mass balance on oxygen in the liquid phase across venturi aerator and across the tank resulted in
Equations (2.27) and (2.28):
0
1
2
3
4
5
6
7
8
9
10
0.0 0.5 1.0 1.5 2.0
DO
con
cent
ratio
n (m
g L
-1)
Time (min)
𝑑𝐶𝑉𝑑𝑡𝑉𝑉 = 𝐹(𝐶𝐿 − 𝐶𝑉) + (𝑘𝐿𝐴)𝑉(𝐶𝑉
∗ − 𝐶𝑉) (2.27)

4-9
𝑑𝐶𝐿𝑑𝑡
=𝐹
𝑉𝑇 (𝐶𝑉 − 𝐶𝐿) + (𝑘𝐿𝑎)𝑇(𝐶𝐿
∗ − 𝐶𝐿) (2.28)
𝑑𝐶𝑉𝑑𝑡𝜏𝑉 = (𝐶𝐿 − 𝐶𝑉) +
𝑘𝐿𝐴𝑉𝐹
(𝐶𝑉∗ − 𝐶𝑉)
If the volume of the venturi aerator is much smaller than that of the tank and the liquid flow rate is
high enough such that 𝜏𝑉 ≪ 1 then:
(𝐶𝑉 − 𝐶𝐿) =
𝑘𝐿𝐴𝑉𝐹
(𝐶𝑉∗ − 𝐶𝑉)
𝐶𝑉 =
𝑘𝐿𝐴𝑉𝐶𝑉∗ + 𝐹𝐶𝐿
𝐹 + 𝑘𝐿𝐴𝑉 (4.2)
Substituting Equation (4.2) into the stirred tank mass balance, given in Equation (2.28)
𝑑𝐶𝐿𝑑𝑡
=𝐹
𝑉𝑇 (𝑘𝐿𝐴𝑉𝐶𝑉
∗ + 𝐹𝐶𝐿𝐹 + 𝑘𝐿𝐴𝑉
− 𝐶𝐿) + 𝑘𝐿𝑎𝑇(𝐶𝐿∗ − 𝐶𝐿)
Solving this equation with initial condition 𝐶𝐿 = 𝐶0 at 𝑡 = 0
where 𝛼 = 𝐹
𝑉𝑇(𝑘𝐿𝐴𝑉𝐶𝑉
∗
𝐹+𝑘𝐿𝐴𝑉) + 𝑘𝐿𝑎𝑇𝐶
∗ and 𝛽 = 𝑘𝐿𝑎𝑇 −𝐹
𝑉𝑇(
𝐹
𝐹+𝑘𝐿𝐴𝑉− 1)
Results were analysed using Equation (4.3) in order to evaluate mass transfer in the venturi aerator
and the tank and better understand the mass transfer characteristics of either separately.
𝐶𝐿 = (𝐶𝐿,0 −
𝛼
𝛽)𝑒−𝛽𝑡 +
𝛼
𝛽 (4.3)
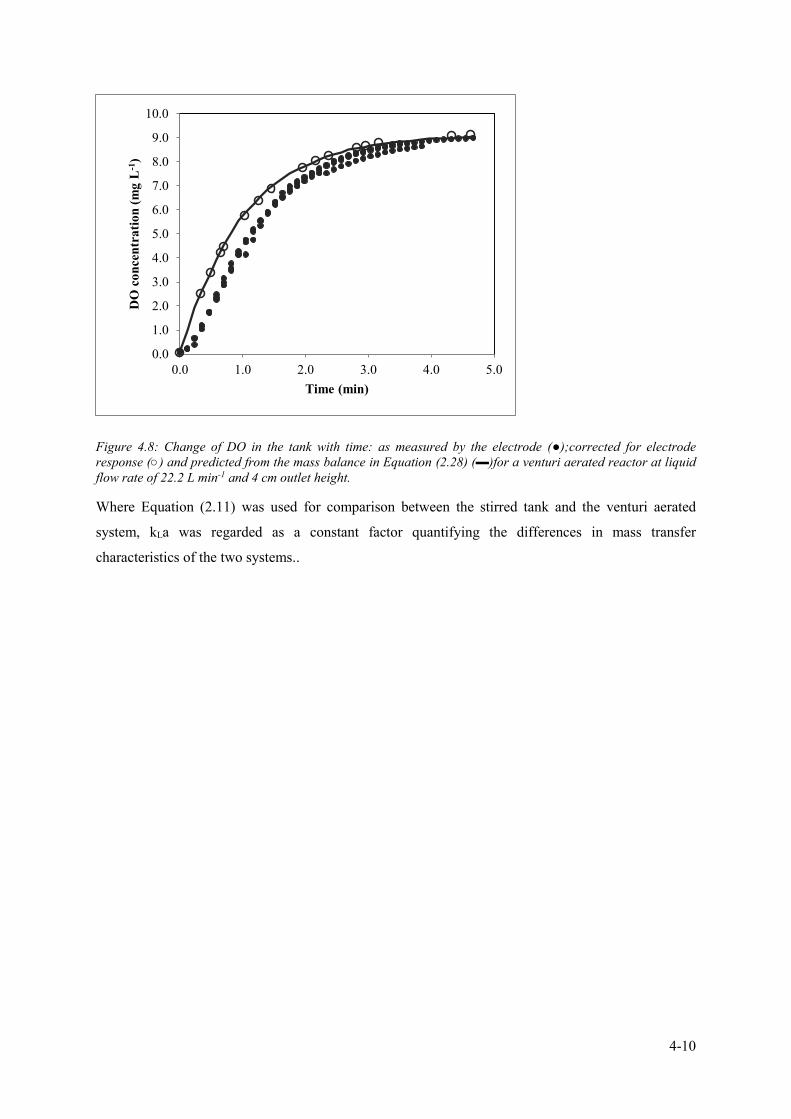
4-10
Figure 4.8: Change of DO in the tank with time: as measured by the electrode (●);corrected for electrode response (○) and predicted from the mass balance in Equation (2.28) (▬)for a venturi aerated reactor at liquid flow rate of 22.2 L min-1 and 4 cm outlet height.
Where Equation (2.11) was used for comparison between the stirred tank and the venturi aerated
system, kLa was regarded as a constant factor quantifying the differences in mass transfer
characteristics of the two systems..
0.0
1.0
2.0
3.0
4.0
5.0
6.0
7.0
8.0
9.0
10.0
0.0 1.0 2.0 3.0 4.0 5.0
DO
con
cent
ratio
n (m
g L
-1)
Time (min)

4-11
4.3 Mixing studies in venturi aerated reactor
Mixing studies were carried out in the venturi aerated system. An aliquot of 5 mL of 10.8 M NaCl
was injected through the venturi air hole while the pump was running, then the change of conductivity
of the solution in the bucket with time was measured. Mixing time was recorded as the time it took
from injection to establishing a steady conductivity reading. A steady reading was taken as that when
conductivity varied by less than 5% of final values, and these steady values were achieved at most 10
seconds after injection of the salt solution for all experimental setups. An AZ benchtop meter (model
86555) was used to measure conductivity. Measurements were recorded every second by a data
logger.
Figure 4.9: Change of conductivity with time after injecting salt for two repeats at a liquid circulation rate of 22.2 L min-1 at an outlet height of 4 cm
4.4 Calculation of power
As discussed in Section 2.9, evaluation of power input to stirred tanks is often limited to power
supplied for liquid agitation which can be determined using Equation (2.30) (Sinnott, 2005:473).
Correlation of impeller type to power number and Reynolds number is also provided by Sinnott
(2005:475) and is used to find the power number.
A substantial motive for introducing venturi aeration is the potential reduction of energy input to the
bioreactor by eliminating the need for gas compression prior to sparging the reactor (Jackson,
1964).Therefore, in addition to agitation power, energy used to compress air fed to the reactor
0
200
400
600
800
1000
0 5 10 15 20 25 30 35
con
du
ctiv
ity
(μS)
Time (s)

4-12
adiabatically was considered to determine the total power supply to the stirred tank. Equation (2.34)
was used to calculate power used in compressing the gas, assuming 100% efficiency of the
compressor. The pressure of the gas before and after compression is 𝜋1 and 𝜋2 respectively, 𝑤 is the
mass flow rate of air, 𝛾 is the ration of specific heat capacity of air, 𝑅 is the universal gas constant
and 𝑇 is the temperature of the gas at the compressor outlet, which was taken to be the average
atmospheric temperature.
𝑃𝑎𝑔𝑖𝑡𝑎𝑡𝑖𝑜𝑛 = 𝑁𝑃𝐺𝑛
3𝐷5𝜌 (2.30)
𝑃𝑔𝑎𝑠 𝑐𝑜𝑚𝑝𝑟𝑒𝑠𝑠𝑜𝑟 =
𝛾 ∙ 𝑤 ∙ 𝑅 ∙ 𝑇
𝐾(𝛾 − 1)[(𝜋2𝜋)
𝛾−1
𝛾− 1] (2.34)
Energy supplied to the venturi aerated system was taken to be energy supplied to flowing water by the
pump. The total dynamic head (TDH) was taken as the discharge pressure of the pump. Therefore
energy lost to friction was still included in power supply to the reactor.
The specific power input (P/V) was obtained by dividing the value of the power input calculated (P)
by the operating volume of the reactor (V). These calculations are sensitive to operating conditions,
and improving operating conditions, for example reducing friction in piping, could significantly affect
results. Both sparged stirred tank and venturi aeration energy calculations depend heavily on
assumptions made. If air was compressed to 3 bar, power input would increase significantly. The
assumptions made for power calculations in this study were:
Air is compressed adiabatically from atmospheric pressure to 2 bar
The compressor works at 100 % efficiency
4.5 Aerobic cultivation of Baker’s yeast
To test the potential for the venturi- aerated reactor to support rapid yeast growth, the aerobic growth
of biomass in a venturi aerated reactor inoculated with S. cerevisiae was compared to that in an
aerated stirred tank at a similar oxygen transfer rate and time period. Brewer’s yeast was grown in the
reactors according to the experimental method described by van Hille et al. (2014). The reactors were
not sterile, therefore other faster-growing microorganisms may have ended up present in the reactors.
𝑃𝑤𝑎𝑡𝑒𝑟 𝑝𝑢𝑚𝑝 = 𝑄𝐿(𝑇𝐷𝐻)𝑊 (2.33)

4-13
At the end of the aerated stirred tank growth experiments, the cells were circulated through the
venture for differing lengths of time, prior to inoculation (10 % volume) into shake flasks to
investigate viability and metabolic activity (vitality) of cells that have passed through a venturi aerator
several times. One shake flask was inoculated with cells that had been circulated through the venturi-
aerated reactor for fifteen minutes, and another with cells that had been in the venturi-aerated reactor
for ninety minutes. The control was inoculated with cells that had not been through the venturi.
4.5.1 Microorganism and culture maintenance
The stock culture of S. cerevisiae was on a YPD agar slant. The original culture was a Brewers’ yeast
obtained from South African Breweries. A pre-inoculum culture was prepared from this stock culture
in 160 mL of medium containing 10 g/L glucose, 5 g/L peptone, 3 g/L yeast extract and 3 g/L malt
extract. This culture was cultivated in a 500 mL shake flask at 30 °C and 125 rpm on an orbital
shaker. After 24 hours it was transferred to a 5 L shake flask to make the inoculum. The inoculum had
20 g/L glucose, 20 g/L peptone and 10 g/L yeast extract. It was cultivated for 14 hours at 30 °C and
125 rpm on an orbital shaker. The same nutrient concentrations were used in the reactors.
4.5.2 Operating conditions
The venturi- aerated reactor was inoculated with the culture described above and operated at a liquid
flow rate of 28.2 L/min. The venturi outlet height was 8 cm and kLa in water was 3.98 min-1. At these
conditions, OTR would be sufficient for yeast growth and shear rates in the venturi aerator were
expected to be low enough not to cause damage to the yeast cells. The air drawn into the venturi
aerator was not filtered therefore the operation was not sterile. All the experiments were done in
duplicate.
The aerated stirred tank was operated at a stirrer speed of 688 rpm (3435 W m-3) and aeration rate of
16. 5 L min-1, which gave a kLa of 5.37 min-1. The air sparged to the reactor was unfiltered.
For the shake flask experiments, 16 mL culture was inoculated into 144 mL of media in a 500 mL
shake flask. The flasks were placed on an orbital shaker at 125 rpm
4.5.3 Cell growth analysis
To determine dry weight concentration, 2 mL of the cell culture were pipetted into pre-weighed 2 mL
Eppendorf tubes. Each tube was centrifuged and the supernatant decanted into different Eppendorf
tubes for glucose analysis. Distilled water was added to the remaining cell pellets, the cells re-
suspended and then centrifuged again. The supernatant was decanted and the cells in the Eppendorf
tubes dried in an 80 °C oven for 48 hours and then weighed again. The maximum specific growth rate

4-14
was calculated from the average growth rate during the exponential phase using Equation (4.4) where
𝑥1and 𝑥2 are the biomass dry weight concentrations at time 𝑡1and 𝑡2 respectively.
𝜇𝑚𝑎𝑥 =
𝑙𝑛 𝑥2 − 𝑙𝑛 𝑥1𝑡2 − 𝑡1
(4.4)
4.5.4 Glucose analysis
Supernatant from centrifuged samples was analysed for glucose. The glucose concentration was
measured colorimetrically using the DNS method. The DNS solution contained 10 g/L dinitrosalicylic
acid, 0.5 g/L sodium sulphite and 10 g/L sodium hydroxide in deionised water. This solution was
added in equal proportions, 0.5 mL in this instance, to the sample. The mixture was then heated for 10
minutes at 90 °C. Under a fume hood, 0.17 mL of 40% potassium sodium tartrate solution was added
to the sample. When the samples were cool, absorbance at 575 nm was measured with a
spectrophotometer. The glucose concentration was determined by comparing absorbance with a
standard curve.

4-15
4.6 Research approach
A summary of the experiments conducted is given in Table 4.3
Table 4.3: Research approach
Experiments conducted Purpose of experiment
Determination of kLa at different
agitation rates and air flow rates in
aerated stirred tank reactor
Characterisation of vessel and comparison
with literature
Basis for comparison with venturi aeration
Determination of mixing time at
different liquid flow rates and outlet
heights in the venturi-aerated reactor
Establish if there were any mixing limitations in
the tank and to determine the effect of mixing
time on kLa
Measuring of kLa at varying liquid flow
rates in the venturi-aerated reactor
Determination of the effect of liquid flow rate in
the venturi aerated reactor
Measuring of kLa at varying venturi
outlet height in the venturi-aerated
reactor
Investigate any impact of bulk fluid movement
in the tank on the kLa
Cultivation of S. cerevisiae in stirred
tank reactor and venturi aerated reactor
Comparison of growth of cells in venturi system
to that in stirred tank to establish any negative
effect of the venturi aerator on the growth of
yeast cells
Cultivation of S. cerevisiae in shake
flasks with inoculum from venturi
aerated reactor
Investigate viability of cells that have been
through the venturi aerator

5-1
5 Results and discussion
5.1 Oxygen Mass Transfer in the Stirred Tank System
5.1.1 OTR and kLa as a function of agitation rate and gas flow rate
The change in DO concentration with time in the stirred tank was measured at different agitation and
aeration rates. The explanation of the analysis of data for the calculation of kLa is given in Sections
4.2.3 and 4.2.4. The power supplied to the reactor for agitation was calculated from correlations given
by Sinnott (2005:473) as described in Section 4.4.
The effect of agitation power and aeration rate on kLa in the stirred tank reactor are shown in Figure
5.1, across the operating ranges of aeration at 0 to 1.5 vvm and agitation power up to 7000 W m-3. The
presence of air bubbles in the tank caused the agitation rate to vary because of the density change of
the liquid –gas in the presence of an increasing fraction of air bubbles; this variation was less than 5%,
i.e.:
√(𝑛𝑔𝑎𝑠𝑠𝑒𝑑 − 𝑛𝑢𝑛𝑔𝑎𝑠𝑠𝑒𝑑)2
𝑛𝑢𝑛𝑔𝑎𝑠𝑠𝑒𝑑< 0.05
Surface aeration (kLa values up to 25% of maximum obtained at the same agitation rate), increased
with agitation rate because of significantly greater surface disturbance. As expected, kLa increased
with agitation rate. The error bars show standard deviation about the mean.
0
1
2
3
4
5
6
7
8
9
10
0 1000 2000 3000 4000 5000 6000 7000
k La
(min
-1)
Pagitation/V (Wm-3)

5-2
Figure 5.1: Variation of kLa with agitation rate at different air flow rates (0 L/min ◊; 12 L/min (0.7 vvm) ○; 16.5 L/min (1 vvm) ∆; 25 L/ min (1.5 vvm) □). Error bars show standard deviation of three repeats.
Provision of air at 0.7 vvm resulted in a large increase in kLa relative to the un-aerated tank; however,
improvement in kLa was small on further increasing the air flow rate. Doubling air flow rate from 0.7
vvm to 1.5 vvm resulted in an increase in kLa of about 1.5 times for the agitation between 1000 Wm-3
and 6200 Wm-3, and 1.8 times at agitation at 509 Wm-3. This confirms the literature findings that at
the lower agitation rate, increased air flow resulted in increased mass transfer area, while the effect is
dampened at high agitation rates where kLa approaches a maximum (Gourich et al., 2008; Clarke et
al., 2006; Atkinson & Mavituna, 1983). The low effect of aeration on kLa also implies that the air flow
rates are high enough to neglect any changes in the oxygen concentration in the gas phase.
When kLa is correlated with Equation (2.23), the coefficients obtained, shown in Table 5.1, agree with
those reported in literature, referenced in Table 2.2. This correlation fits the results obtained
qualitatively, as can be seen from the solid lines in Figure 5.2. To obtain the kLa value excluding
surface aeration, the value of kLa from surface aeration at that agitation rate was subtracted from the
value of kLa for an aerated system. The resulting kLa was then correlated to power input and air
velocity. In both cases, the coefficients obtained agreed with what is reported in literature.
Table 5.1: Coefficients for the correlation 𝑘𝐿𝑎 = 𝐶 (𝑃
𝑉)𝛼
𝑢𝛽
Including surface aeration Excluding surface aeration
𝛼 0.629 0.614
𝛽 0.462 0.557
C 0.0058 0.008

5-3
Figure 5.2: Solid lines show the correlation of kLa with aeration rate and agitation power input according to 𝑘𝐿𝑎 = 𝐶 (
𝑃
𝑉)𝛼
𝑢𝛽 at different air flow rates (12 L/min ○; 16.5 L/min Δ and 25 L/min □) kLa values include surface aeration
The maximum calculated contribution of power input by the expanding gas in the reactor (Equation
(2.31) was found to be 12 % of the total agitation power. This was at an agitation rate of 509 W m-3
and aeration of 25 L min-1. The correlation of kLa with Pagitation calculated this was expected to
therefore yield similar results to Figure 5.2.
Figure 5.3: Variation of kLa in a stirred tank with total power input ( experimental values from this study at different aeration rates with error bars showing standard deviation about the mean from three repeats; experimental values at no aeration; ▬ kLa =0.00488 (P/V)1.49 (Eqn 5.1); × Chandrasekharan & Calderbank, 1981; ■ Robinson & Wilke, 1973)
0
1
2
3
4
5
6
7
8
9
10
0 1000 2000 3000 4000 5000 6000 7000
k La
(min
-1)
Pagitation/V (Wm-3)
0
0
1
10
0 2 4 6 8 10 12
k La
(min
-1)
Total power (kW m-3)

5-4
The correlation between kLa and total power is investigated in Figure 5.3, where total power is the
combination of agitation and compression power input. Using the sum of least squares and Microsoft
Excel Solver, experimental kLa data from this study was fitted to give Equation (5.1):
𝑘𝐿𝑎 = 0.00488(
𝑃𝑡𝑜𝑡𝑎𝑙𝑉)1.49
(5.1)
The values used in the correlation includes mass transfer from both sparging and surface aeration, but
kLa values from surface aeration only were omitted from the analysis because they showed an offset
from the trend displayed by the rest of the experiments.
Based on air flow rates and agitation power consumption reported, the total power input in studies by
Chandrasekharan & Calderbank (1981) and Robinson & Wilke (1973) was calculated and compared
to the results from this study, also shown in Figure 5.3. Chandrasekharan & Calderbank (1981)
operated at air flow rates between 0.16 vvm and 1 vvm in a 1.43 m3 tank, while Robinson & Wilke
(1973) used aeration rates between 0.5 and 1.5 vvm in a 2.5 L tank, both using the Rushton turbine
and standard geometry in water. As with comparisons in agitation power input, the form of the
equation holds but the equation constants differ for the different studies as shown in Table 2.2, further
illustrating the variation of kLa even with similar operating conditions.
5.2 Oxygen mass transfer in the venturi system
When liquid flows through the venturi throat, air is drawn into the liquid stream and dispersed in the
form of small bubbles (Cramers, 1992; Bauer, 1963). The liquid stream containing air bubbles then
mixes with the rest of the fluid in the tank where the bubbles rise out of the liquid as the gas
disengages from the liquid. Oxygen transfer into the liquid phase has been shown to happen in the
outlet of the venturi (Rodriguez et al., 2012; Jackson, 1964) as well as in the tank (Gourich et al.,
2007). Figure 5.4 prediction of variation of liquid pressure drop across the venturi throat and air flow
rate into the venturi with liquid flow rate as predicted by Equations (2.24) and (2.25) respectively
which are explained in Section (2.5). The kLa is expected to increase with liquid flow rate because
more air is entrained into the liquid and also because more liquid is aerated with each pass through the
venturi. The increased pressure drop is associated with high shear rates (Son, 2007) which could result
in better bubble formation and improved mass transfer area.

5-5
Figure 5.4: Prediction of the variation of liquid pressure drop in the throat of the venturi aerator (♦) and air flow rate into the venturi (▲) with liquid flow rate through the venturi
𝑄𝐺 = 𝐶𝐴√2 𝑔𝑐𝜌 𝜋1 (𝛾
𝛾 − 1) [(𝜋1𝜋2)
2𝛾− (𝜋1𝜋2)
𝛾+1𝛾] (2.25)
The change in DO concentration with time of deoxygenated water was measured 15 cm downstream
of the venturi throat as the water was passed through the venturi. DO concentration was also measured
in the tank. Further details of the experimental setup and procedure have been given in Section 4.1.2.
In Figure 5.5, dissolved oxygen concentration is presented as a function of time at both the outlet from
the venturi loop and in the bulk fluid in the tank. These trends show that the water exiting the venturi
became oxygen saturated more quickly than that in the tank, but did not become immediately
saturated, as expected based on literature (Rodriguez, 2012). The liquid leaving the venturi is
expected to be saturated with oxygen because there is good air flow rate and area for mass transfer to
occur in the venturi and the outlet. The results thus imply that the aerator and outlet volume are too
small to allow sufficient contact time for the liquid to be saturated with oxygen. The saturation
concentration in the divergent outlet was the same as in the tank therefore it was assumed that the
fluid at this point is at atmospheric pressure.
0
20
40
60
80
100
120
140
160
180
200
10
12
14
16
18
20
22
24
0.0 10.0 20.0 30.0 40.0 50.0
Pres
sure
dro
p (k
Pa)
Air
flow
rat
e in
to v
entu
ri th
roat
(L m
in-1
)
Liquid flow rate (L min-1)
𝑃 +
1
2𝜌𝑣2 + 𝜌𝑔ℎ = 𝑐𝑜𝑛𝑠𝑡𝑎𝑛𝑡 (2.24)

5-6
Figure 5.5: DO concentration in liquid stream immediately out of the venturi aerator (●) compared to DO
concentration in the tank () corrected for electrode response time at liquid flow rate of 36.6 L/min and 4 cm
outlet height
The degree of surface aeration, determined by pumping liquid through the aerator with the air hole
closed, was found to be minimal. Figure 5.6 shows how when the air hole is closed, DO concentration
initially rises and then levels off without reaching saturation. The initial rise happens over about 10
minutes, almost ten times longer than it takes to reach DO saturation concentration when the air hole
is open, as illustrated in Figure 5.5. The increase in DO concentration at the start may be attributed to
a small amount of air that is accidentally drawn into the aerator and continually recycled until all the
oxygen in the trapped gas bubbles has all dissolved into the water. Based on this, surface aeration was
assumed to play a negligible role in oxygen mass transfer for the venturi-aerated reactor.
0
1
2
3
4
5
6
7
8
9
10
0.0 0.5 1.0 1.5 2.0
DO
con
cent
ratio
n (m
g L
-1)
Time (minutes)
0
0.2
0.4
0.6
0.8
1
1.2
0 10 20 30 40 50
CL
/C*
Time (minutes)

5-7
Figure 5.6: Change in DO concentration in the tank with time when the air hole is closed(■) compared to when the air hole is open (×). Liquid flow rate through the venturi aerator was 42 L min-1at a venturi outlet height of 8 cm
The kLa was calculated using Equation (2.11) and was found to be as much as ten times higher than in
other venturi literature studies (Jackson, 1964; Gourich, 2007; Dong et al., 2011). Besides differences
in reactor geometries and methods for determination of kLa, this difference could be a result of the
much higher circulation of liquid through the venturi (𝑄𝐿𝑉) (between 1.4 and 2.6 vvm in this study,
compared to an average of 0.5 vvm in other studies). To address these postulations, the effects of
liquid flow rate and venturi configuration are investigated in Sections 5.3.2 and 5.3.3 respectively.
5.2.1 Mixing in the tank
The mixing times for Setup 1, described in Section 4.1.2, at different outlet heights were investigated
by measuring the change in conductivity in the solution. The results are shown in Figure 5.7. For the
various operating conditions, steady state was established within 10 seconds (a quarter of the
residence time of the tank), supporting the assumption that the agitation from the flow of water is
enough to result in a well-mixed regime in the tank. These mixing studies do not provide an estimate
for the residence time of gas bubbles, but give an indication of how quickly aerated water is
distributed around the vessel.
Figure 5.7: Mixing times in venturi aerated tank for a single venturi (Setup 1) at different venturi outlet heights
from the bottom (4 cm; 8 cm and 12 cm ▲) as a function of liquid flow rate. The values shown are average
values with the standard deviation too small for the error bars to be visible.
As expected, the mixing time decreased with higher water flow rates for each height. Higher water
flow rates imply that the water stream entering the tank has a higher velocity and greater momentum,
0
1
2
3
4
5
6
20 25 30 35 40 45
Mix
ing
time
(s)
Liquid flow rate (L min-1)

5-8
causing more bulk liquid movement and turbulence in the tank (Bauer, 1963). These are observed
visually and lead to faster elimination of concentration gradients. Mixing time also decreased with
increasing outlet height for the three outlet heights investigated. This may be attributed to differing
flow regimes in the vessel for the different outlet heights.
Faster mixing times translate to quicker distribution of air bubbles which corresponds to higher
observed kLa. If air bubbles are immediately spread around the tank, C* is kept at the maximum
value, while OTR is maximised. On the other hand, if there is slow circulation of fresh air bubbles, C*
in Equation (2.11) is overestimated, while the oxygen transfer rate is low. This would result in kLa
calculated being lower than the actual kLa. Slow mixing is therefore expected to correspond to low
apparent kLa values.
𝑂𝑇𝑅 = 𝑘𝐿𝑎𝑇(𝐶𝐿
∗ − 𝐶𝐿) (2.11)
5.2.2 OTR and kLa as a function of liquid flow rate and depth of inlet (tank hydrodynamics)
The kLa in a venturi-aerated system was evaluated using Equation (2.11) from DO concentration–time
profiles illustrated in Figure 4.7. As explained in Section 4.2.5 this mass balance does not describe the
venturi system accurately. However, the single value of kLa obtained using this method is
representative of the average overall mass transfer and can be compared to the aerated stirred tank.
Figure 5.8 shows kLa obtained for Setup 1 at different venturi outlet heights and water flow rates. For
each outlet height, higher flow rates resulted in higher kLa. In the range investigated, kLa continued to
increase with flow rate and did not reach a critical flow rate where any further rise would have
resulted in reduced kLa because of cavitation of the venturi or unfavourable flow regimes as in the
studies of Briens et al. (1992) and Jackson (1964).

5-9
Figure 5.8: Effect of water flow rate and venturi outlet height from the bottom (4 cm; 8 cm; 12 cm ▲) on
kLa. Error bars show standard deviation from three repeats.
Higher flow rates of water gave greater air suction (
Table 5.2) as expected from Equations (2.24) and (2.25), with the predicted flow rates being slightly
higher than those measured. The rate of air suction did not vary with outlet height. The ratio QG/QL
was independent of outlet height and liquid flow rate in these ranges. As more water per unit time is
exposed to air; higher kLa is expected. The increase in kLa with water flow rate may also be a result of
the formation of smaller additional air bubbles, shown in Figure 5.9, resulting from higher turbulence
and shear forces in the venturi as proposed by Bauer (1963). Furthermore, as discussed in the mixing
results, improved distribution of air bubbles could also result in better oxygen mass transfer.
Table 5.2: Rate of air suction into the venturi for varying water flow rates. The air suction rate was not affected by the venturi outlet height.
Water flow rate (L min-1)
Air flow rate (L min-1) QG/QL
22.2 13 0.59 28.4 19 0.67 33.2 20 0.60 36.6 22 0.60 41.4 23 0.56
0.0
1.0
2.0
3.0
4.0
5.0
6.0
7.0
8.0
9.0
20 25 30 35 40 45
k La
(min
-1)
water flow rate (L min-1)

5-10
(a) (b)
Figure 5.9: Comparison of gas holdup at (a) 22.2 L/min and (b) 36.6L/min for a venturi outlet height of 12 cm
Increasing the venturi outlet height from 4 cm to 8 cm resulted in kLa values about 2.5 times higher,
whereas a further increase from 8 cm to 12 cm made little difference. This agrees with the results
obtained by Gourich et al. (2008) where the effect on kLa of changing the height of liquid in the tank
was reduced with increasing flow rate at liquid heights of 1.12 m and 0.75 m. Gourich et al. (2008)
also found that kLa was much lower when the liquid height was 0.37 m compared to greater heights.
Their experiments were done at constant liquid volume.
As indicated in the mixing study, changing the outlet height had an effect on bulk movement of liquid
in the vessel. A reason for the improvement in kLa could be that at 4 cm outlet height, there was short
circuiting because of the proximity of the venturi outlet to the pump suction. A considerable fraction
of the freshly aerated liquid could be sucked back into the pump immediately; thus reducing the
residence time of bubbles in the tank, as well as minimising mixing of oxygen-rich water with
oxygen-poor water. The corresponding improvement of kLa with reduced mixing time also suggests
better distribution of air bubbles in the tank at the higher outlet heights due to the different flow
patterns in the tank. The difference in kLa between 4 cm and the other outlet heights could mean that
bulk liquid movement at 4 cm outlet height depressed mass transfer, supporting the suggestion of
short-circuiting happening at this height. It could also imply that as long as the tank was perfectly
mixed, bulk liquid movement did not have an effect on gas-liquid mass transfer.
Based on the mixing study, kLa is expected to vary more for different outlet heights at lower water
flow rates. On the other hand Figure 5.8 shows kLa varying less with outlet height at flow rates of 22
L min-1 and 28 L min-1. This means that at these flow rates, kLa cannot be improved by changing
hydrodynamics in the tank, implying that the amount of air drawn into the aerator at low liquid flow
rates is insufficient for good mass transfer to occur, even with favourable hydrodynamics in the
vessel.

5-11
Variation in the lumped kLa term with tank hydrodynamics implies that oxygen mass transfer was not
limited to the venturi aerator. Optimising fluid flow inside the tank had a considerable effect on the
rate of mass transfer. The liquid flow rate through the venturi aerator should be high enough to entrain
sufficient air and form sufficient bubbles. In addition, the bulk liquid movement in the tank should
facilitate good mixing and long residence time of bubbles in the reactor.
5.2.3 OTR and kLa as a function of venturi configuration
Two venturis were connected in parallel as described in Section 4.1.2 and the kLa was calculated from
the change in DO concentration in the tank. Figure 5.10 shows the comparison of the kLa with liquid
flow rate for the venturis in parallel to that for a single venturi (previously presented in Figure 5.8).
The flow rate shown for the aerators in parallel is the total flow rate of the recirculated liquid,
therefore the flow through individual aerators is less than when a single aerator was used. At the
highest total flow rate of 37 L min-1, the flow through either individual aerator is less than 25 L min-1.
The rate air drawn through each aerator roughly corresponds to that drawn in a single aerator at the
same liquid flow rate (15 L min-1), meaning the total amount of air supplied to the tank for two
aerators in parallel was more than that supplied to the tank by a single aerator for the same total flow
rate, although this higher air supply was not matched by improved kLa values for two venturis. This
suggests that high liquid flow rates in the aerator are necessary for good mass transfer rates. A
possible explanation for this is that high liquid flow rates in the venturi are associated with high shear
rates that result in numerous small bubbles, causing improved mass transfer area and, subsequently,
high kLa.

5-12
Figure 5.10: Comparison of kLa between a single venturi at venturi outlet heights of 4 cm (), 8 cm () and 12 cm (▲), and two venturis connected in parallel at an outlet height of 8 cm (■). Error bars show standard deviation from the mean for three repeats.
5.2.4 Modelling oxygen mass transfer using the Venturi system
The kLa reported in Sections 5.2.2 and 5.2.3 gives overall performance of the venturi aeration system
for the different operating conditions. However, to better understand oxygen mass transfer in the tank
and aerator separately, mass balances on oxygen in the liquid phase were derived, shown in Equations
(4.2) and (4.3) and their development given in Section 4.2.5.
To evaluate mass transfer coefficients in the venturi aerator (𝑘𝐿𝐴𝑉) and the stirred tank (𝑘𝐿𝑎𝑇)
separately, theoretical CV and CL were fitted to the measured concentrations.
𝐶𝑉 =
𝑘𝐿𝐴𝑉𝐶𝑉∗ + 𝐹𝐶𝐿
𝐹 + 𝑘𝐿𝐴𝑉 (5.2)
where 𝛼 = 𝐹
𝑉𝑇(𝑘𝐿𝐴𝑉𝐶𝑉
∗
𝐹+𝑘𝐿𝐴𝑉) + 𝑘𝐿𝑎𝑇𝐶𝐿
∗ and 𝛽 = 𝑘𝐿𝑎𝑇 −𝐹
𝑉𝑇(
𝐹
𝐹+𝑘𝐿𝐴𝑉− 1)
If it is assumed that there is no mass transfer occurring in the tank, that liquid gets oxygenated only by
passing through the venturi; then kLaT can be set to zero. Figure 5.11 shows that CL predicted this way
0
1
2
3
4
5
6
7
8
9
10
20 25 30 35 40 45
k La
(min
-1)
water flow rate (L min-1)
𝐶𝐿 = (𝐶𝐿,0 −
𝛼
𝛽)𝑒−𝛽𝑡 +
𝛼
𝛽 (5.3)

5-13
is lower than actual CL measured, confirming that mass transfer not only happens in the venturi outlet,
but in the tank as well.
Figure 5.11: Difference between measured DO concentration at outlet heights of 4cm (), 8 cm ()and 12 cm
(▲) , and that predicted by assuming no mass transfer happens in the tank at outlet heights of 4cm(▬), 8 cm
(∙∙∙) and 12 cm (- - -).
Figure 5.12 shows kLAV and kLaT determined using Equations (5.2) and (5.3) and their variation with
liquid flow rate and venturi outlet height.
Figure 5.12: Effect of liquid flow rate and outlet height on kLAV at different venturi outlet heights (4 cm ; 8 cm and 12 cm ▲) and kLaT at different venturi outlet heights (4 cm ◊; 8 cm ○; 12 cm Δ). The models are based on averages of measured DO concentration with time.
0
1
2
3
4
5
6
7
8
9
10
0 1 2 3
DO
con
cent
ratio
n (m
g L
-1)
Time (min)
0
2
4
6
8
10
12
14
1
10
100
20 25 30 35 40 45
k La T
(min
-1)
k LA
V(m
3m
in-1
)
Water flow rate (L min-1)

5-14
At outlet heights 4 cm kLaT is much lower than at outlet heights of 8 cm and 12 cm but at 22 L min-1
the variation is smaller, confirming that the low kLa values at these low flow rates are a result of
limitations in the venturi aerator and any improvements in kLa that would be due to better mixing in
the tank are not realised. However, there is still mass transfer occurring in the tank even at these low
liquid flow rates as shown by Figure 5.11.
At 8 cm and 12 cm, kLaT increases with water flow rate possibly because more air is drawn to the
reactor, therefore the number of bubbles formed increases and the flow patterns in the reactor are
conducive for better mass transfer. At the outlet height of 4 cm, kLaT stays constant at all liquid flow
rates, indicating that improvements in kLa with liquid flow rate at 4 cm outlet height result only from
an increase in kLAV i.e. there is little contribution to mass transfer in the tank. Short circuiting at this
height may also have prevented the distribution of aerated liquid from the venturi throughout the
whole tank. In addition to the differing bulk liquid movement at the different outlet heights, the
residence time of air bubbles in the tank could also have varied, as suggested by Briens et al. (1992) in
their investigations of upflow and downflow venturi configurations. At 8 cm and 12 cm outlet heights,
the residence time of the bubbles in the reactor may have been higher than at 4 cm due to the
increased distance that the liquid exiting the venturi has to travel. Therefore, the gas holdup at these
heights would be higher, resulting in increased surface area and, consequently, a higher kLaT.
The mass transfer coefficient in the venturi (kLAV) increased with increasing water flow rate for all
outlet heights, possibly as a result of better bubble formation in the venturi throat and outlet. At liquid
flow rates of 22 L min-1 and 28 L min-1 kLAV unexpectedly changed with outlet height. It was not
established why mass transfer characteristics in the venturi aerator would vary with outlet height,
which only affects bulk liquid movement inside the tank.
The results show that high liquid circulation rates correspond to better kLa, and that at these high flow
rates, kLaT controls the overall mass transfer coefficient since kLAV appears to reach a maximum.
5.2.5 Comparison of power input between stirred tank and venturi aerated tank
The total power input to the reactor systems at all operating conditions was compared and the results
are shown in Figure 5.13. The power input to the venturi-aerated reactor was calculated from the
power discharged by the pump using Equation (2.33) as described in Section 4.4. The specific power
input (P/V) was the taken to be the power input per unit operating volume of the reactor.

5-15
Figure 5.13: Variation of kLa with total power input for all conditions in the stirred tank reactor (○), Single
venturi at outlet heights of 4 cm (); 8cm (); 12 cm (▲) and two venturis in parallel at outlet height of 8cm
(■). The error bars show standard deviation from the mean for three repeats.
At power input lower than 6 kW m-3, the venturi aerated reactor and the stirred tank had similar kLa.
At higher power input, variation of kLa in the venturi aerator with power input depended on the setup
of the reactor, while kLa continued to increase in the stirred tank.
The calculation of power depends very much on the system and assumptions made. Calculations for
energy input to compress gas assumed 100% efficiency and that air was compressed to 2 bar from
atmospheric pressure, therefore changing the outlet pressure in the calculations would result in
different results. For instance, if the air was compressed to 3 bar, the aerated stirred tank would show
higher power input for the same kLa.
5.3 Yeast growth and survival in the Venturi aerated system
S. cerevisiae was cultivated in the aerated stirred tank, in the venturi -aerated reactor and in shake
flask under non-sterile conditions as described in Section 4.5. The shake flasks were inoculated with
cells that had been through the venturi for different periods. A summary of the growth characteristics
is given in Table 5.3. The maximum growth rate of cells in a venturi-aerated system appeared higher
at lower glucose consumption rate compared to the aerated stirred tank. However, more experiments
would need to be conducted at different conditions in both reactors in order to establish whether there
is a trend in the growth of yeast in the two reactor systems.
0.0
1.0
2.0
3.0
4.0
5.0
6.0
7.0
8.0
9.0
10.0
0 2 4 6 8 10 12 14
k La
(min
-1)
Total power (kW m-3)

5-16
From Figure 5.14 the growth of brewer’s yeast in a venturi aerated reactor was similar to that in a
stirred tank. Under the conditions investigated, shear rates in the venturi aerator were not high enough
to damage yeast cells. Figure 5.15 shows that cells that had been through the venturi aerator remained
viable in shake flasks.
Figure 5.14: Comparison of growth of S. cerevisiae in the venturi aerated reactor () to that in the stirred tank
(), and glucose consumption in the venturi aerated reactor (◊) and in the stirred tank (○). The growth data
shown is for two repeats
Figure 5.15: Growth of S. cerevisiae shake flask inoculated with cells from the aerated stirred tank (×) and cells
that had been in the venturi aerated reactor for 15 minutes (▲) and 90 minutes (■) compared to growth of
S.cerevisiae in the aerated stirred tank (). The results shown are the mean of two repeats.
0
5
10
15
20
25
0
1
2
3
4
5
6
7
8
9
10
0 5 10 15 20
Glu
cose
con
cent
ratio
n (g
L-1
)
Bio
mas
s dry
wei
ght c
once
ntra
tion
(g L
-
1 )
time (hr)
0
1
2
3
4
5
6
7
8
9
0 5 10 15 20
Cel
l dry
wei
ght c
once
ntra
tion
(g/L
)
Time (hour)

5-17
Table 5.3: Results for the cultivation of yeast in different reactor setups
Maximum
growth rate
(h-1)
Maximum cell dry weight
concentration after 15
hours (g L-1)
Glucose utilisation at
maximum growth
rate (g L-1 h-1)
Aerated stirred tank 0.115 7.67 1.75
Venturi-aerated reactor 0.138 8.81 1.44
Shake flasks (average) 0.109 6.98 1.41

6-1
6 Conclusions and Recommendations
6.1 Conclusions
A comparison in kLa and energy input between an aerated stirred tank and a venturi-aerated reactor
was conducted. This was done in order to determine whether the energy-intensive compression of air
could be avoided in aerobic bioprocesses in order to reduce operating cost and environmental impact
of bioreactors. The growth of yeast cells in a venturi aerated reactor was compared to that in an
aerated stirred tank to establish whether the cells could survive shear stresses created in the venturi
aerator.
Increasing volumetric liquid flow rate through the venturi resulted in improved kLa and oxygen mass
transfer rates as more water is aerated per unit time, and possibly higher shear rates that resulted in
more bubbles, giving greater surface area for mass transfer to occur. Higher liquid flow rates into the
tank may additionally have resulted in faster mixing and distribution of air bubbles in the tank, also
resulting in improved mass transfer.
Changing the outlet height of the venturi from 4 cm to 8 cm affected bulk liquid movement in the
tank, as evidenced by the differing mixing times at different outlet heights for the same flow rates. At
the higher liquid flow rates, faster mixing time corresponded to higher kLa values, suggesting that
hydrodynamic conditions in the vessel affect the rate of mass transfer. On the other hand, at low flow
rates, the improved mixing time with increased outlet height did not correspond to improved kLa,
supporting the inference that high liquid flow rates result in high mass transfer area, and any
improvements in bulk fluid flow in the tank would be insufficient to facilitate for mass transfer if not
matched by a supply of fresh air bubbles to the tank. The venturi outlet height may also have affected
the bubble residence time in the tank, with improved kLa at higher outlet heights.
The kLa achieved in the venturi aerated reactor was comparable to that of the stirred tank when the
total power input was low. However, at higher power input to the reactors, corresponding to higher
volumetric liquid flow rate in the venturi system, oxygen mass transfer rates are better in the aerated
stirred tank.
There were no significant observed difference between the viability of brewer’s yeast grown in the
aerated stirred tank and that grown in the venturi-aerated reactor.
These findings are specific to the system used in this study, but they provide insights into the
performance of venturi aerators.

6-2
6.2 Recommendations
In order to obtain high mass transfer rates, venturi aerated reactors should be operated at high liquid
flow rates. If liquid flow rates are high enough and bulk liquid movement in the tank is not limited,
then the optimisation of energy input vs mass transfer should be focused on minimising pressure
losses associated with pumping the liquid through the venturi. Venturi aerator performance could be
enhanced by reducing friction losses in the piping and therefore achieving higher liquid flow rates at
lower power input to the pump.
Gourich et al. (2008) report that changing from upflow configuration to downflow configuration
increased residence time of bubbles in the tank, resulting in higher kLa. Therefore further
investigations into improving operation of venturi aeration could focus on whether the residence time
of air bubbles in the tank with donwflow can be further increased to improve gas mass transfer rates.
In this study venturi aeration was found to be comparable to that in an aerated stirred tank. Energy
consumption will however be dependent on the system being used, line losses in a venturi, and
pressure and flow rate of air in a stirred tank.
This study did not establish venturi aeration to be considerably more energy efficient than an aerated
stirred tank for the conditions investigated. It is however worth noting that a liquid pump will have
less capital and maintenance costs than a gas compressor. Venturi aerators could also be used to aerate
recirculated streams in some continuous reactor setups. Instead of using energy to sparge air into the
reactor as well as pump recycled broth, the recirculated stream could be passed through a venturi
aerator.
Further investigations with other microorganisms and in sterile conditions should be conducted in
order to expand on the applicability of venturi aerators to biological systems.

7-1
7 Bibliography Atkinson, B. & Mavituna, F. 1983. Biochemical Engineering and Biotechnology Handbook. Surrey,
United Kingdom: Macmillan Publishers ltd.
Bandaiphet, C. & Prasertsan, P. 2006. Effect of aeration and agitation rates and scale-up on oxygen
transfer coefficient, kLa in exopolysaccharide production from Enterobacter cloacae WD7.
Carbohydrate Polymers. 66 (2006): 216-228.
Batterham, R.J., Hoffmann, W. A. & Conochie, D. S. 1994. A reactor. International patent B01F3/04,
5/04.
Bauer, W.G., Fredrickson, A. G. & Tsuchiya, H. M. 1963. Mass transfer characteristics of a venturi
liquid-gas contactor. I & EC Process Design and Development. 2 (3):178-187.
Baylar, A., Ozkan, F. & Ozturk, M. 2006. Influence of venturi cone angles on jet aeration systems.
Water Management. 58 (2005):9-16.
Baylar, A. & Ozkan, F. 2006. Applications of venturi principle to water aeration systems.
Environmental Fluid Mechanics. 6 (4): 341-357.
Baylar, A., Unsal, M. & Ozkan, F., 2007. Determination of the optimal location of the air hole in
venturi aerators. CLEAN – Soil, Air, Water. 35 (3): 246-249
Bouaifi, M., Hebrard, G., Bastoul, D. & Roustan, M. 2001. A comparative study of gas hold-up,
bubble size, interfacial area and mass transfer coefficients in stirred gas- liquid reactors and bubble
columns. Chemical engineering and processing. 40 (2001): 97 – 111.
Boyce, M. P. Transport and storage of fluids. 1999. In Perry’s Chemical Engineers’ Handbook7th
Edition. R. H. Perry & D. W Green, Eds. New York: McGraw-Hill. 10-37.
Brar, S.K., Verma, M., Tyagi, R. D., Surampalli, R. Y., Barnabe, S. & Valero, J. R. 2007. Bacillus
thuringiensis proteases: Production and role in growth, sporulation and synergism. Process
Biochemistry. 42 (5): 773-790.
Briens, C. L., Huynh, L. X., Large, J. F., Catros, A., Bernard, J. R. & Bergougnou, M. A. 1992.
Hydrodynamics and gas-liquid mass transfer in a downward venturi-bubble column combination.
Chemical Engineering Science. 47 (13): 3549-3556.
Chandrasekharan, K. & Calderbank, P. H. 1981. Further observations on the scale up of aerated
mixing vessels. Chemical Engineering Science. 36 (1981): 819-823.
Chisti, Y. 2000. Animal-cell damage in sparged bioreactors. TIBTECH. 18 (2000): 420-432.

7-2
Chisti, M. Y. 1989. Airlift Bioreactors. London: Elsevier.
Chisti, M. Y. & Jauregui-Haza, U. J. 2002. Oxygen transfer and mixing in mechanically agitated
airlift bioreactors. Biochemical Engineering Journal. 10 (2002): 143-153.
Clarke K.G., Williams P.C., Smit M. and Harrison S.T.L. (2006). Enhancement and repression of
volumetric oxygen transfer coefficient through hydrocarbon addition and its influence on oxygen
transfer rate in stirred tank bioreactors. Biochemical Engineering Journal. 28 (2006): 237-242
Correia, L.D. & Clarke, K.G., 2009. Measurement of the overall volumetric oxygen transfer
coefficient in alkane-aqueous dispersions. Journal of Chemical Technology & Biotechnology. 84 (12):
1793-1797.
d’Hugues, P., Cezac, P., Cabral, T., Battaglia, F., Truong-Meyer, X. M. & Morin, D. 1997.
Bioleaching of a cobaltiferous pyrite: a continuous laboratory-scale study at high solids concentration.
Mineral Engineering. 10 (5): 507-527.
Deckwer, W. D., Burckhart, R., Zoll, G. 1974. Mixing and mass transfer in bubble columns. Chemical
Engineering Science. 29 (1974): 2177-2188.
Dhanasekharan, K. M., Sanyal, J., Jain, A. & Haidari, A. 2005: A generalised approach to model
oxygen transfer in bioreactors using population balances and computational fluid dynamics. Chemical
Engineering Science. 60 (2005): 213-218.
Dong, C., Zhu, J., Wu, X. & Miller, C. F. 2012. Aeration efficiency influenced by venturi aerator
arrangement, liquid flow rate and depth of diffusing pipes. Environmental Technology. 33 (11): 1-10.
Fakeeha, A. H., Jibril, B. Y., Ibrahim, G. & Abasaeed, A. E. 1999. Medium effects on oxygen mass
transfer in a plunging jet loop reactor with a downcomer. Chemical Engineering and Processing. 38
(1999): 259-265.
Federal Emergency Management Agency. 1989. Handbook of Chemical Hazard Analysis Procedure.
USA: Department of Transportation, and Environmental Protection Agency.
Galaction A. –I., Cascaval, D., Oniscu, C. & Turnea, M. 2004. Prediction of oxygen mass transfer
coefficients in stirred bioreactors for bacteria, yeasts and fungus broths. Biochemical Engineering
Journal. 20 (1): 85-94.
Gamisans, X., Sarrà, M. & Javier Lafuente, F. 2004. Fluid flow and pumping efficiency in an ejector-
venturi scrubber. Chemical engineering and processing. 43 (2004): 127-136.

7-3
Garcia-Ochoa, F. & Gomez, E. 2009. Bioreactor scale-up and oxygen transfer rate in microbial
processes: An overview. Biotechnology Advances. 27 (2): 153-76.
Gauthier, L., Thibault. J. & LeDuy, A. 1990. Measuring kLa with randomly pulsed dynamic method.
Biotechnology and Bioengineering. 37 (1991): 889- 893.
Germain, E., Nelles, F., Drews, A., Pearce, P., Kraume, M., Reid, E., Judd, S. J., Stephenson, T.,
2007. Biomass effects on oxygen transfer in membrane bioreactors. Water Research. 41 (5): 1038-
1044.
Gibson, C. E. 1975. A field and laboratory study of oxygen uptake by planktonic blue-green algae.
Journal of Ecology. 63 (3): 867-879.
Gogate, P.R. & Pandit, A.B. 1999. Survey of measurement techniques for gas-liquid mass transfer
coefficient in bioreactors. Biochemical Engineering Journal. 4 (1999): 7-15.
Gogate, P.R., Beenackers, A. C. M. & Pandit, A.B. 2000. Multiple-impeller systems with a special
emphasis on bioreactors: a review. Biochemical Engineering Journal. 6 (2000): 109-144.
Gourich, B. N., Vial, Ch., Belhaj Soulami, M., Zoulalian, A. & Ziyad, M. 2008. Comparison of
hydrodynamic and mass transfer performances of an emulsion loop-venturi reactor in co-current
downflow and upflow configurations. Chemical Engineering Journal. 140 (2008): 439-447.
Gourich, B., El Azher, A., Vial, Ch., Belhaj Soulami, M., Zoulalian A. & Ziyad, M. 2007. Influence
of operating conditions and design parameters on hydrodynamics and mass transfer in an emulsion
loop–venturi reactor. Chemical Engineering and Processing: Process Intensification. 46 (2): 139-149.
Jackson, M. L. & Collins, W.D. 1964. Scale up of a venturi aerator. I & EC Process Design and
Development. 3 (4): 386-393.
Jackson, M. L., 1964. Aeration in Bernoulli types of devices. AIChE Journal. 10(6): 836-842.
Joshi, J. B., Pandit, A. B. & Sharma, M. M. 1982. Mechanically agitated gas-liquid reactors: review
article number 7. Chemical Engineering Science. 37 (6): 813- 844.
Juteau, P., Tremblay, D., Ould-Moulaye, C., Bisaillon, J-G. & Beaudet, R. 2004. Swine waste
treatment by self-heating aerobic thermophilic bioreactors. Water Research. 38 (2004): 539-546.
Kapic, A. & Heindel, T. J. 2006. Correlating gas-liquid mass transfer in a stirred tank reactor.
Chemical Engineering Research and Design. 84 (A3): 239-245.

7-4
Kargi, F. & Moo-Young, M. 1985. Transport phenomena in bioprocesses. In Comprehensive
Biotechnology: Volume 2. M. Moo-Young, C. L. Clooney, A. E. Humphrey, Eds. Oxford: Pergamon
Press.
Kocabaș, P., Çalik, P. & Özdamar, T. H. 2006. Fermentation characteristics of L-tryptophan
production by theoacidophilic bacillus acidocaldarius in a defined medium. Enzyme and Microbial
Technology. 39 (2006): 1077-1088.
Liley, P. E., Thomson, G. H., Friend, D. G., Daubert, T. E. & Buck, E. 1999. Physical and chemical
data. In Perry’s Chemical Engineers’ Handbook 7th ed. R. H. Perry & D. W Green, Eds. New York:
McGraw-Hill. 2-127.
Langheinrich, C., Nienow, A. W., Eddleston, T., Stevenson, N. C., Emery, A. N., Clayton, T. M. &
Slater, N. K. H. 2002. Oxygen transfer in stirred bioreactors under animal cell culture conditions.
Trans IChemE. 80 (March): 3-8.
Linek, V., Benes, P., Sinkule, J. & Moucha, T. 1993. Non-ideal pressure step method for kLa
measurement. Chemical Engineering Science. 48 (9): 1593- 1599.
Linek, V., Vacek, V. & Benes, P. 1985. A critical review and experimental verification of the correct
use of the dynamic method for the determination of oxygen transfer in aerated agitated vessels to
water, electrolyte solutions and viscous fluids. The Chemical Engineering Journal. 34 (1987): 11-34.
Linek, V. & Vacek, V. 1981. Chemical engineering use of catalyzed sulphite oxidation kinetics for
the determination of mass transfer characteristics of gas-liquid contactors. Chemical Engineering
Science. 36 (11): 1747-1768.
McCabe, W. L., Smith, J. C., Harriot, P. 2011. Unit Operations of Chemical Engineering 6th ed. New
York: McGraw- Hill.
Merchuk, J. C. 1983. Basic models for mass transfer. In Heat and Mass Transfer. (AIChe Modular
instruction series B: Stagewise and mass transfer operations). New York: AIChe.
Mohaibes, M. & Heinonen-Tanski, H., 2004. Aerobic thermophilic treatment of farm slurry and food
wastes. Bioresource technology. 95 (2004): 245-254.
Muller, F. L. & Davidson, J. F, 1992. On the contribution of small bubbles to mass transfer in bubble
columns containing highly viscous liquids. Chemical Engineering Science. 47 (13/14): 3525-3532.
Nocentini, M., Fajner, D., Pasquali, G. & Magelli, F. 1993. Gas- liquid mass transfer and holdup in
vessels stirred with multiple Rushton turbines: Water and water- glycerol solutions. Industrial &
Engineering Chemistry Research. 32 (1): 19- 26.

7-5
Noorman, H. 2006. Mass transfer. In Basic Biotechnology. C. Ratledge & B. Kristiansen, Eds. New
York: Cambridge University Press. 201 -217.
Obeta Ugwuanyi, J., 2008. Yield and protein quality of thermophilic Bacillus spp biomass related to
thermophilic aerobic digestion of agricultural wastes for animal feed supplementation. Bioresource
Technology. 99 (2008): 3279-3290.
Pandit, A.B., Niranjan, K. & Davidson, J. F. 1990. Pump-stirred aerator. Chemical Engineering
Science. 46 (9): 2293-2301.
Puskeiler, R. & Weuster-Botz, D. 2005. Combined sulphite method for the measurement of the
oxygen transfer coefficient kLa in bioreactors. Journal of Biotechnology. 120 (2005): 430-438.
Robinson, C. W. & Wilke, C. R. 1973. Oxygen absorption in stirred tanks: A correlation for ionic
strength effects. Biotechnology and Bioengineering. 15 (1973): 755- 782.
Rodriguez, G., Dorado, A. D., Bonsfills, A., Sanahuja, R., Gabriel. D. & Gamisans, X. 2012.
Optimization of oxygen transfer through venturi-based systems applied to the biological sweetening
of biogas. Journal of Chemical Technology & Biotechnology. 87 (6): 854-860.
Rossi, G. 2001. The design of bioreactors. Hydrometallurgy. 59 (2-3): 217-231.
Ruchti, G., Dunn, I. J. & Bourne, J. R., 1981. Comparison of dynamic oxygen electrode methods for
the measurement of kLa. Biotechnology and Bioengineering. 23 (1981): 277-290.
Sánchez Pérez, J. A., Rodriguez Porcel, E. M., Casas Lopez, J. L., Fernandez Sevilla, J. M. & Chisti,
Y. 2006. Shear rate in stirred tank and bubble columns bioreactors. Chemical Engineering Journal.
124 (2006): 1-5.
Schluter, V. & Deckwer, W.–D. 1992. Gas/ liquid mass transfer in stirred vessels. Chemical
Engineering Science. 47 (9-11): 2357- 2362.
Shukla, V. B., Parasu Veera, U., Kulkarni, P. R. & Pandit, A. B., 2001. Scale-up of biotransformation
process in a stirred tank reactor using dual impeller bioreactor. Biochemical Engineering Journal. 8
(2001): 19-29.
Sinnot, R. K. 2005. Chemical Engineering Design. (Coulson & Richardson’s chemical engineering
volume 6). Oxford: Elsevier.
Son, Y. 2006. Determination of shear viscosity and shear rate from pressure drop and flow rate
relationship in a rectangular channel. Polymer. 48 (2): 632-637.

7-6
Stenberg, O. & Andersson, B. 1988. Gas- liquid mass transfer in agitated vessels – I. evaluation of the
gas- liquid mass transfer coefficient from transient-response measurements. Chemical Engineering
Science. 43 (3): 719-724.
Stieger, K. 1999. Mass Transfer Studies in the Lysine Fermentation. MSc dissertation, Department of Chemical Engineering, University of Cape Town.
Suresh, S., Srivastava, V. C., Mishra, I. M., 2009. Techniques for oxygen transfer measurement in
bioreactors: a review. Journal of Chemical Technology and Biotechnology. 84 (2009): 1091-1103.
Thalasso, F., Naveau, H. & Nyns, E.-J. 1995. Design and performance of a bioreactor equipped with a
venturi injector for high gas transfer rates. The Chemical Engineering Journal. 57 (1995): B1-B5.
Treybal, R. 1955. Mass Transfer Operations. New York: McGraw-Hill Book Company.
Tribe, L., A., Briens, C., L. & Margaritis, A. 1995. Determination of the volumetric mass transfer
coefficient (kLa) using the dynamic “gas out- gas in” method: analysis of errors caused by dissolved
oxygen electrodes: Communication to the editor. Biotechnology and Bioengineering. 46 (1995): 388-
392.
Tromans, D. 1998. Temperature and pressure dependent solubility of oxygen in water: A
thermodynamic analysis. Hydrometallurgy. 48 (1998): 327- 342.
van Hille, R., Johnstone-Robertson, M., Huddy, R., Smart, M., van Wyk, N., Ngoma E.& Harrison
S.T.L. 2014. CHE 5054 Introduction to Microbiology Laboratory Manual 2014. Centre for
Bioprocess Engineering, University of Cape Town.
Van’t Riet, K. 1979. Review of measuring methods and results in nonviscous gas-liquid mass transfer
in stirred vessels. Industrial & Engineering Chemistry Process Design and Development. 18 (3): 357-
364.
Villadsen, J., Nielsen, J. & Lidén, G. 2011. Bioreaction Engineering Principles 3rd ed. New York:
Springer.
Welty, J. R., Wicks, C. E., Wilson, R. E. & Rorrer, G. L. 2001. Fundamentals of Momentum, Heat
and Mass Transfer 4th ed. New Jersey. John Wiley & Sons Inc.
Wesselingh, J. A. & Krishna, R. 2000. Mass Transfer in Multicomponent Mixtures. Delft, The
Netherlands: Delft University Press.
Williams, P. C. 2005. Biological Conversion of Alkanes to Dicarboxylic Acids. MSc dissertation, Department of Chemical Engineering, University of Cape Town.
7-7
Yan, G., Hua, Z., Liu, D., Du, G., Chen, J. 2006. Influence of oxygen level on oxidative stress
response of bacillus sp. F26 to menadione. Process Biochemistry. 41 (2006): 764-769.
Yang, S-T. 2007. Preface. In Bioprocessing for Value-Added Products From Renewable Resources:
New Technologies and Applications. S-T. Yang, Ed. Netherlands: Elsevier.