venture capital: survey of the economic...
TRANSCRIPT
European Journal of Business and Social Sciences, Vol. 2, No.7 , pp 78-104, October 2013. P.P. 78 - 104 URL: http://www.ejbss.com/recent.aspx ISSN: 2235 -767X
EUROPEAN JOURNAL OF BUSINESS AND SOCIAL SCIENCES
78
VENTURE CAPITAL: SURVEY OF THE ECONOMIC IMPACT AND THE DETERMINANTS - EMPIRICAL EVIDENCE FROM EGYPT
Dr. Elsayed Elsiefy Associate Professor, QFIS- Hamad Bin Khalifa University- Qatar Foundation,
Faculty of Commerce- Alexandria University, Egypt. Visiting Scholar, Islamic Legal Studies Program,
Harvard Law School. Harvard University
ABSTRACT
he primary focus of the first part of the paper is to demonstrate the empirical academic research on venture capital (VC) that examines the key determinants of
venture capital industry evolution and development as well as the role of the venture capital investment plays in bringing about economic growth. We further investigate different countries' experience with respect to venture capital contribution to the economic development process. The second part of the paper provides evidence from Egypt on the factors that may have had a bearing on VC investments during the period (1980-2010). Using multiple linear regressions method (OLS model), we find positive and significant relation between VC (measured by patent) and GDP per capita, general government expenditure and labor participation rate. In addition, agricultural raw materials exports, and inflation have both proved to have a negative significant relation with VC. Finally, using the Granger Causality test we find the causality relation runs only from both GDP per capita and labor participation rate to VC. Keywords: Venture capital -Determinants- Egypt- Regression model
T
European Journal of Business and Social Sciences, Vol. 2, No.7 , pp 78-104, October 2013. P.P. 78 - 104 URL: http://www.ejbss.com/recent.aspx ISSN: 2235 -767X
EUROPEAN JOURNAL OF BUSINESS AND SOCIAL SCIENCES
79
1-Introduction
Venture capital (VC) is widely recognized as an important vehicle for financing new and small companies with high growth potentials and innovative business model; in particular, high and new technology based enterprises with high-risk but potentially high reward business ideas or models. These companies typically invest heavily in research and development activities and hence intangible assets represent a big chunk of their asset base. This has always presented a challenge to these companies mainly at early stages of operations, as their performance proves difficult to assess. As such, for many of these companies external sources of financing have commonly been seen costly and difficult to acquire. In the case of many of these companies, venture capital may come to be the only most likely source of finance. Looking into many of today's giant high-tech companies including Cisco System, Intel, Microsoft and Netscape; and a number of successful service companies such as eBay, Starbucks and Staples, one finds that venture capital based investments were a major source of funding for these companies. Venture capital, which is also described as ‘unsecured risk financing’(Nandha, 2008), is not associated solely with one-off injection of funds into a new firm such as in the case of bank loans, but is a finance arrangement in exchange for an equity stake in the company that receives VC financing . A common characteristic of all venture capital investments is that the investee companies do not pay interest on debt or dividends on equity. Rather, return on VC investment is generally realized in the form of capital gains through appreciation in the value of VC investment when venture capitalists sell their equity share at the market place. Thus, unlike passive debt-based finance provided by lenders in the form of loans, venture capitalists are often active; value added investors, and sophisticated financial intermediary at mitigating informational asymmetries and agency costs in financial contracting. Due to their expertise, they play a crucial role in increasing the chance of success of fledgling firms during their early stage of operations as they unlike unspecialized banks; provide these firms with specialized advice in business follow-up and monitoring activities (Belke et al, 2003). VCs join entrepreneurs as co-partners retaining important control rights over the company's affairs, which would allow them to intervene in the company's operations when necessary. They are allowed an ongoing participation in the management of the financed companies in the form of managerial support, strategy formulation, human resources policy formulation, operational decision-making, marketing strategy etc. In order to undertake such role in the management venture capitalists usually hold seats in the board of directors of the investee companies. VC is deemed illiquid type of investment. The typical length of VC investment is between three to seven years and may extend to ten years for early stage investment, as it requires longer time to mature. Initial public offering (IPO) is considered the most popular and preferable choice of exit for VCs, besides a trade sale through acquisition, where the whole company is sold to another company. Other avenues of exit such as through secondary sales, where the venture capitalist sells its share in the company to another investor or through buybacks where the entrepreneur repurchases the venture capitalist's share, as well as through liquidations, are also possible. The success of VC and entrepreneurial sectors are considered an essential sign of economic growth and innovation in countries around the world. Through the operation of thousands of VC-backed companies, VC is considered a significant factor in the growth of U.S. economy and one of the most powerful growth engines that contribute to many determinants of the nation's economic vitality including R&D spending, evolution of new industries, and job creation especially those requiring high skilled labor. According to the National Venture Capital Association (NVCA), over the period from 1970 to 2000, US VC-funded
European Journal of Business and Social Sciences, Vol. 2, No.7 , pp 78-104, October 2013. P.P. 78 - 104 URL: http://www.ejbss.com/recent.aspx ISSN: 2235 -767X
EUROPEAN JOURNAL OF BUSINESS AND SOCIAL SCIENCES
80
companies had their sales doubled, generated almost twice the exports and paid almost three times the federal taxes. Compared with the average non-venture capital-backed public companies they invested almost three times more in R&D per each US$1,000 of assets. In 2008, US VC-funded companies generated nearly $3 trillion in revenue and employed more than 12 million people. To put this into perspective, this accounted for 21 percent of US GDP and 11 percent of private sector job market. Baumol 2002 argues that entrepreneurial activity that has thrived supported by large commitments of VC investments to small enterprises may explain much of the significant output growth of the Western nations. However, according to OECD member countries have had varied success in channeling venture capital investments to risky, high value-added sectors in particular, technology-based sectors. The size and depth of venture capital markets across countries remained significantly uneven. In 2009, while VC investments in the United States constituted around 0.13% share of GDP, in other OECD countries such as the United Kingdom and Sweden, VC investment constituted a lower share of GDP amounting to around 0.05% and 0.07% respectively. In the same year, Europe's investment as a share of GDP was only around 25% of that of the US. Many empirical studies have analyzed factors influencing VC fundraising and have identified a number of key factors including GDP growth rate, interest rates, corporate tax, active stock market, and government policies. See for example, Black and Gilson, 1999; Jeng and Well, 2000; Gompers et al, 2008, Cumming and Maclntosh, 2006; Cumming et al, 2005; and Romina and van Pottelsberghe, 2004). Roger Kelly (2009) discusses the reasons why VC within Europe has not reached a critical mass compared to that of the United States and identifies a number of demand and supply side factors. For the supply side, Roger points out a number of factors including lack of industry focus, targeting the wrong sectors and the wrong investment stage, insufficient mobility of VC funds within Europe due to different legal and regulatory regimes and because of fragmented European exit markets. On the demand side, Roger argues that the US is a more dynamic entrepreneurial economy than Europe in the sense that there are less entrepreneurial ideas being generated in Europe compared to the US due to weaker entrepreneurial culture and experience, besides that Europe lacks VC ecosystem that is the network connection between VC markets participants.. Along the same lines Fritsch and Schuler, (2008) discuss the undersupply of attractive investment opportunities and prove its effect on the growth of VC industry in Germany. In addition, Achleitner et al (2010) outline the notion of the relevance of spatial proximity for the growth of VC industry in Germany and proves that geographical distance matters. Similarly, Schwienbacher (2008) studies the difference in the investment practices and contract behavior of the US and the European VC firms and documents that European VC firms are less actively involved in their portfolio companies compared to their US counterparts evidenced among others by longer durations of financing rounds. This suggests that financial and labor markets are less developed in Europe than they are in the US and that European VCs are less active that their US counterparts. In Egypt, due to lack of experienced financial and labor markets in VC investments these makes the Egyptian VC are less active than the US counterparts. That is why we need to study the factors that affect VC success and establish the proper system to facilitate the growth of VC investment. As mentioned in the previous studies the geographical distance matters so it is also important to specify a certain place in the country as an incubator for VC companies to facilitate share of knowledge and experience. Governments' policies, initiatives and intervention can significantly contribute to the viability of the VC industry. Hence, play a vital role in leveraging the impact of VC investment on the society. Belke et al (2003) however, explains that the indirect role the government can play via fostering the VC capital to combat unemployment, specifically emphasis that this should not be understood as fostering more governmental subsidies to the VC industry or calling for encouraging government-run VC activates. Rather
European Journal of Business and Social Sciences, Vol. 2, No.7 , pp 78-104, October 2013. P.P. 78 - 104 URL: http://www.ejbss.com/recent.aspx ISSN: 2235 -767X
EUROPEAN JOURNAL OF BUSINESS AND SOCIAL SCIENCES
81
the government role should be mainly restricted to the provision of a framework of guidelines for more institutional work and entrepreneurial dynamism. Government policies subsidizing science or research parks for the intention of promoting cluster development are likely to be ineffective (Wallsten 2004). There exists wide literature on the topic, which indicates that there exists a number of possible ways for the government to foster the VC markets. Economically, liquid stock market, supporting R&D activities, interest rates, improving the entrepreneurial environment through effective entrepreneurial policies and liberal investment rules, among other things, have been identified as essential factors . Legal determinates and government policies such as preferential tax credit and easing quantitative restrictions on institutional investors such as pension funds, which would help enhance private sources of venture funding, have as well been proven to have a tremendous impact. The rest of the paper is constructed as follows: Section 2 provide survey of the theoretical background and hypothesis development. Section 3 explains Data and descriptive statistics, Section 4 displays Empirical analyses. Finally, section 5 provides summary remarks.
2-Theoretical background and hypothesis development In this section we provide a survey for the impact of venture capital investment on employment, innovation and economic growth and value creation. . We highlight the key determinants of VC industry in the literature. The discussion is further subdivided to determinants pertaining to macroeconomic factors and financial markets dynamism, research and development (R&D) intensity, government policies and legal framework and finally other factors. In addition, we investigate different countries' experience with respect to venture capital contribution to the economic development
2.1 The Economic Impact of Venture Capital Investment A number of empirical literature have been devoted to examine the role venture capital investment plays in economic development. Results have shown that these investments help to enhance and sustain growth, support innovation and contribute to job creation. In this part, we present some empirical evidence on the economic impact of VC investment on these three areas.
2.1.1 Employment Using survey-based data from 20 industrial countries over the period 1982-2003, Feldmann (2010) finds that more readily available venture capital is likely to lower the unemployment rates and subsequently, lower the share of long-term unemployed in the total number of unemployed. Belke and Schaal, (2004) study the relationship between VC investment and employment using panel data for the OECD countries and find that bottleneck for job creation is made worse as fledgling and emerging innovative companies find it difficult to finance their high risk projects. Venture capitalists having been considered a source of financing for risky projects would be expected to play a role in this respect. Belke et al (2003) explain that venture capital plays a crucial role in bringing about employment growth as it provides a source of financing for new firms, innovations and structural change. H1 There is no relation between Venture Capital and Labor participation rate.
European Journal of Business and Social Sciences, Vol. 2, No.7 , pp 78-104, October 2013. P.P. 78 - 104 URL: http://www.ejbss.com/recent.aspx ISSN: 2235 -767X
EUROPEAN JOURNAL OF BUSINESS AND SOCIAL SCIENCES
82
2.1.2 Innovation Kortum and Lerner (1998) examine the influence of venture capital on patents in the US across over three decades from 1965 to 1992 in twenty industries and find a significant positive relationship between the intensity of venture capital activity in an industry and the rate of patenting. They also conclude that a dollar of VC was 3.1 times as likely to lead to a patent, as was a general R&D dollar. Their estimates suggest that venture capital accounts for about 15% of industrial innovations. Similarly, Hirukawa and Ueda (2008) confirm the findings reached by Kortum and Lerner (1998) and find that the positive impact of venture capital on patents proves to be persistent and even intensified during the unprecedented growth period experienced by the VC industry in late 90s. However, unlike the impact on patent count, they find total factor productivity growth not influenced by VC investments, which they argue, is originated from the arrival of new technology rather the long established positive association between VC investment and labor productivity. Therefore, they suggest that, at industry level, VC investment may not necessarily improve efficiency though it may increase patent propensity. Adversely, Chemmanur et al (2008) prove that the efficiency gain (indicated by growth in total-factor productivity (TFP)) generated from VC is significant. Analyzing the relationship between VC investment and TFP in a large sample of US private firms, they find that the overall efficiency of VC-backed firms is higher than that of non-VC backed firms and that this increase intensifies over the first rounds of VC financing and remains at the higher level until exit. Furthermore, increase in efficiency was higher in firms backed by higher reputation VCs. They argue that the efficiency gains generated by VC backed firm arise primarily from improvement in sales as well as from reductions in various input costs. Romain and Pottelsberghe (2004) evaluate the macroeconomic impact of VC compared to R&D activity by large firms in 16 OECD countries from 1990 to 2001. They find that VC contributes to growth through introduction of new products and processes into the market, and improving the absorptive capacity of the stock of knowledge, which increases innovative performance of firms, and the aggregate impact of business and public R&D activities. They also document that VC contribution in social benefits is much higher than that of business or public R&D. An increase of one euro by VC would yield an increase of 3.33 euro in output growth compared to an output growth of 1.99 contributed by an increase in the business R&D capital stock. Similarly, Da Rin, M. and Penas, M. (2007) study the role of venture funding in influencing innovation strategies in Detach companies and find that venture financing help companies invest in the build-up of absorptive capacity through permanent in-house R&D and therefore stay actively tuned to exploit the opportunities the scientific and technological advances create. In addition, Bertoni et al (2010) study the impact of VC investments on the innovation activity of European new technology-based firms over the period 1994-2008 and find positive impact of VC investments on firms' TFP. Similarly, Bertoni et al (2011) analyze the impact of VC funding on the innovation of 191 new Italian technology-based firms in terms of their patenting activity; in particular, they compare the patenting rates of investee and non-investee high-tech firms. Controlling for factors beyond VC that could influence a firm’s patenting behavior, such as the human capital and the use of other financing sources, they show that VC investments have a positive impact on successive patenting activity and that prior to receiving VC, the patenting propensity of the investee firms was no higher than other firms. As no information on VC investments is readily available in Egypt and given the significant positive correlation between patenting and VC investments, we use the value of patents as a proxy for VC investments following, among others, Florida and Kenncy 1986; Kortum and Lerner 2000 and Callahan and Muegge 2002.
European Journal of Business and Social Sciences, Vol. 2, No.7 , pp 78-104, October 2013. P.P. 78 - 104 URL: http://www.ejbss.com/recent.aspx ISSN: 2235 -767X
EUROPEAN JOURNAL OF BUSINESS AND SOCIAL SCIENCES
83
2.1.3 Growth and Value Creation Romina and van Pottelsberghe (2004) test VC contribution to economic growth through innovation
and development of absorptive capacity in 16 major OECD countries over the period 1990-2001. They report significant and direct effect of VC on economic growth. They also argue that VC has indirect impact on the growth of the aggregate economic performance through improving the economic effect of private and public R&D spending and the absorptive capacity of the stock of knowledge generated by universities and firm. Engel (2002) analyses the role of VC investments in the growth of new German firms and shows that firms received venture capital have achieved 170-percentage point higher growth. Samila and Sorenson (2011) using a panel of U.S. urban areas, find positive relation between the supply of venture capital and firm starts, employment, and aggregate income. They suggest that VC investments stimulate the creation of more firms than it funds. Likewise, Peneder and Schwarz (2008) using company data for Austrian companies find that venture capital as are channeled towards enterprises whose innovativeness is above average they help generate additional momentum for growth in the companies' turnover and employment which have an important impact on the overall economic development. Mayer (2010) analyses the causality relation between VC investment and Real GDP growth for 14 European countries and the US over the period 1989 to 2009. He finds that an increase in VC investments of 0.1% of GDP is statistically associated with an increase in real GDP growth of 0.30 percentage point. Controlling for a number of variables that might have a bearing on the growth he further provides evidence that the direction of causality between the two runs from VC to growth. While countries with high VC activities experience higher economic growth, the opposite is not true; not all high growth countries have vibrant VC market.
H2 There is no relation between Venture Capital and GDP growth.
2.2 The Determinants of Venture Capital Investment Despite the empirical investigations proving the aggregate role VC investment plays in countries'
economic growth, (see e.g., Romain and Pottelsberghe, 2004; Baumol, 2002; Engel, 2002; and Hellmann and Puri, 2002), enormous variances according to OECD, have been noticed in the amount of VC investments across developed countries. For instance, in some countries such as the US and Canada, the level of VC investment is relatively significant compared to some other counties such as Japan. The widely posed question is what determines the level of VC investment in a country? Pfeil A. (2000) demonstrates that the most important determinants include among others, highly educated people, easy access to stock markets, and stable economic and political environment.
A number of factors have been documented in the literature examining the basic determinants of VC investment. In this section, we are going to discuss some of literature identifying key factors that determine VC flows. The discussion is subdivided to determinants pertaining to macroeconomic factors and financial market dynamism, research and development (R&D) intensity, government policies and legal framework, and other factors.
H3 There is no relation between Venture Capital and educated people.
European Journal of Business and Social Sciences, Vol. 2, No.7 , pp 78-104, October 2013. P.P. 78 - 104 URL: http://www.ejbss.com/recent.aspx ISSN: 2235 -767X
EUROPEAN JOURNAL OF BUSINESS AND SOCIAL SCIENCES
84
2.2.1 Macroeconomic Factors and Financial Market Dynamism Romain and van Pottelsberghe, (2003) study the main determinants of VC investment in 16 major
OECD countries over the period 1990-2001 and identify three main factors that affect the demand and supply of VC. These factors include research and technological opportunities, the entrepreneurship environment and macroeconomic conditions. They argue that short-term interest rates positively influence the demand for VC whereas long-term interest rates have stronger negative impact on the supply of VC. They also provide evidence that the cyclicality of VC investments follows that of the GDP growth as they find the flow of VC funds react positively and significantly to GDP growth though in periods of high growth, the flow of VC outperforms the GDP growth rate, and vice versa. This cyclicality is as well positively affected by the conditions of labor markets. Inflexibility in labor market proved to reduce the positive impact of GDP growth on the level of VC investments and the impact of the capital stock of knowledge on the growth of firms' investment in R&D. They also confirm positive role of entrepreneurial culture's prevalence and tax incentives, however, finds no significant influence for financial markets liquidity.
Groh A. P. et al. (2008) examine by means of a questionnaire addressed to potential institutional investors worldwide the determinants of international capital allocation in VC and private equity partnerships. The information provided by the respondents about their criteria for international asset allocation reveals that protection of property rights is the dominant concern for the international investors followed by the availability of local venture capitalists and the management quality and the skills of the local entrepreneurs. Interestingly, unlike proposed by many research papers a majority of the respondents confirm that the IPO activity and the size of local public equity markets are not relevant.
In an earlier study by Jeng and Wells 2000 analyzing the determinants of venture capital for a sample of 21 countries, IPOs (initial public offerings) were found to have significant impact on later stage venture capital investing whereas they had no impact on early stage venture capital investing across countries. Interestingly, GDP and market capitalization growth both were found to have insignificant impact. Similarly, Black and Gilson (1999) explain that venture capital flourishes only where an active stock market exist as venture capitalists become able to successfully exit from portfolio companies through successful (IPOs. For this reason, they argue that there is an active venture capital industry in The US as compared to the Germany and Japan. Becher and Hellmann (2003), however, provide new evidence on the German experience towards developing active VC industry and argue that an active IPO market though necessary, is alone insufficient especially in a bank-based system like Germany. Commentary changes of corporate governance and of a country's attitude towards entrepreneurship are also crucial.
Gompers and Lerner 1998 examine the determinants of VC fundraising for the US economy over the period 1969-1994 and find that among other thing, higher GDP growth leads to greater VC activity. The performance of venture organizations, their age and size however, also plays a crucial role in their ability to raise new capital. Using panel data set of 14 European countries over the period 1988 to 2000 Schertler (2003) finds that VC investment for enterprises in early stage of development depends positively on the capitalization of stock market, human capital endowment, and rigidities on labor market. He explains that the odd positive impact of labor market rigidities can be attributed to different capita-labor ratio: that is enterprise operating in economies with rigid labor markets demand more capital per employee than their counterparts operating in flexible labor markets do.
H4 There is no relation between Venture Capital and capitalization of stock market.

European Journal of Business and Social Sciences, Vol. 2, No.7 , pp 78-104, October 2013. P.P. 78 - 104 URL: http://www.ejbss.com/recent.aspx ISSN: 2235 -767X
EUROPEAN JOURNAL OF BUSINESS AND SOCIAL SCIENCES
85
2.2.2 Innovation, Research, and Development (R&D) Activity Gompers and Lerner (1998) examine the effect of R&D spending on the demand for VC for the US
economy over the period 1969-1994. They find that the state-level VC activity is significantly related to the industrial and the academic R&D spending. An increase in the level of R&D by the state increases both the amount of VC invested as well as the number of firms receiving VC. Similarly, Romina and van Pottelsberghe (2004) study the determining factors of VC investments in 16 major OECD countries over the period 1990-2001. They find that the stock of knowledge, number of value of patents and growth in R&D investments all have had significant positive impact in these countries' investment in VC. The higher the rate of entrepreneurship (the percentage of people involved in a start-up), the higher the impact was of the capital stock of knowledge in almost all countries. Using data panel form The US and eleven European countries, Chaabouni (2011) also confirms the positive and multifaceted effect of R&D activity on venture capital evolution. He finds that increasing spending on R&D activities as well as encouraging active policy for scientific and technological advancements specifically focused on high tech industries effectively stimulates VC development. Likewise, Hellmann and Puri (200) provide empirical evidence that VC financing is affected by product market strategies and the outcomes of Silicon Valley high-tech start-ups. They show that innovation and business experience are both more likely to affect allocation of VC investments between different investment opportunities.
H5 There is no relation between Venture Capital and research and development.
2.2.3 Government Policy, Legal Framework and Institutional Environment Brander et al. (2010) combine international data from 25 countries across Europe, East Asia, the US,
Brazil, Australia, and Israel and discuss the effects of the existence of government- sponsored VC (GVC). They provide empirical evidence that GVCs may be helpful in providing certain kinds of support, but may become less useful when they have actual control over business decisions. One reason for this is that GVC are likely to have multiple objectives that may interfere with the pure profit orientation of private VCs. Likewise, Armour and Cumming, ( 2005) analyse the use of publically funded VC funds in 13 European countries, besides Canada and the US during the period 1990- 2002. They show that the presence of public funds, which usually have not been designed with appropriate incentive, tends to crowd out private funds and reduce overall industry returns. They further emphasize on the importance of the legal and regulatory factors and suggest that sound legal framework is considered an important pre-requisite for the development of sustained VC industry. Reducing the harshness of the consequences of personal bankruptcy law, in particular, is found to have significant effect on the demand for VC. Furthermore, better laws facilitate the deal origination process; increase the probability of syndication, which reflect positively and significantly on VC investments (Cumming et al 2005).
Gompers and Lerner (1998) and Romina and van Pottelsberghe, (2004) both discuss the effect of tax rates on VC fundraising in the US economy over the period 1969-1994 and VC demand in 16 major OECD countries over the period 1990-2001 respectively. Both show that lower capital gains tax rates lead to greater VC activity. Gompers and Lerner (1998) and Jeng and Wells (2000) provide evidence that regulatory change in rules governing pension fund investment, which allowed pension funds to freely invest in VC, had generally increased commitments to VC industry. Furthermore, Groh A. P. et al. (2008) find that bribery and corruption play an important role in the allocation process of international capital allocation in VC and public funding and subsidies do not play a role at all in an indication that private money does not follow public money. Belke et al, (2003) emphasize the role of stronger patent rights and adequate incentives
European Journal of Business and Social Sciences, Vol. 2, No.7 , pp 78-104, October 2013. P.P. 78 - 104 URL: http://www.ejbss.com/recent.aspx ISSN: 2235 -767X
EUROPEAN JOURNAL OF BUSINESS AND SOCIAL SCIENCES
86
through the tax system for entrepreneurs to take risk. They point out that high taxation on capital gains, highly progressive tax system, taxes on assets along with strict limitations to roll over losses, which are almost inventible in the start-up phase of new venture are important factors stifling entrepreneurial dynamism and VC investment. Most importantly, they make reference to the role the education system, especially at the university level to address the issue of the scarcity of able human resources. H6 There is no relation between Venture Capital and General government expenditure
2.2.4 Other Factors Discussing the effect of the geographical bias in the investment decision of VCs, Achleitner et al (2010)
demonstrates empirically that spatial proximity between the new venture and the venture capitalist has a severe impact on VC fundraising even in countries with a dense infrastructure like Germany. They find that due to informational problems, which would prevent initial contact, the likelihood of receiving venture capital by a venture project further away from local networks decreases by about one third with each triplication of the journey time. Furthermore, the investment sum per VC is also influenced as it decreases by a threshold of 3.9 m Euro susceptible to increases. The travel costs and the need for closer monitoring play a major role though to different extend depending on the size of the deal. Similarly, Esquire and Shachmurove (2010) confirm the significance of location and geography in determining both, the number of deals and amount of investment by VCs in the Clean-tech industry in the U.S. Further, they investigate the effect of macro-economic variables on venture investment in Clean-tech industry during 1995-2009 and find that investment was affected also by GDP, --year interest rate and consumer price index.
3 Economic Impact of Venture Capital Investment- Countries’ Experience The United States- Venture capital-backed companies have a strong impact on the US economy.
According to National venture Capital Association ( NVCA), while investment in venture-backed companies only equates to between 0.1 and 0.2 percent of U.S. GDP every year, VC-backed companies have generated in 2010 revenue equal $3.1 trillion of U.S. total sales of $ 30 trillion, which comes to 21 percent of U.S. GDP. In addition, $6.27 of revenue was generated in 2010 for every dollar of venture capital invested from 1970 to 2010. Similarly, VC-backed companies generated 11.9 million jobs out of 107.3 million U.S. private sector jobs, which represent 11% of the total private sector employment. In 2008, one U.S. job existed for every $ 37, 702 of venture capital investment from 1970-2008.
Moreover, Venture capital-backed companies outperformed total U.S. economy. While employment in venture capital-backed companies declined by 2% between 2008 and 2010, U.S. private employment declined by 3.1%. Similarly, in terms of revenue compound annual growth rate, while revenue in capital-backed companies grew by 1.6 % over the same period, total US sales declined by 1.5%. The collective market capitalization of the 500 largest public companies with venture roots has increased by approximately$ 700 billion rising from $2.1trillion in 2008 to $2, 8 trillion in 2010.
The venture capital job creating is not limited to one segment of the economy. It permeates the entire American economy. In 2010, employment data for the Software sector show a heavy concentration of venture capital supported jobs in the software industry with nearly 734,064 jobs - almost 90 percent of the total jobs in the sector. Sales reported by these companies in 2010 were recorded at $226.5 billion. To put this into perspective, this amounts to around 40 percent of the industry's total revenues generated that year. Similarly, venture backed companies dominate the Biotechnology industry. Job counts provided by these companies accounted for around seven out of every ten jobs (427,353 million) in the sector. Revenues of
European Journal of Business and Social Sciences, Vol. 2, No.7 , pp 78-104, October 2013. P.P. 78 - 104 URL: http://www.ejbss.com/recent.aspx ISSN: 2235 -767X
EUROPEAN JOURNAL OF BUSINESS AND SOCIAL SCIENCES
87
these companies totaled nearly $161.6 billion, which accounted for 80 percent of all industry revenues in 2005. Computer sector was the largest venture-backed job creator, employing around 1.2 million people in 2010, which reflects 54% of the entire industry's employment. In 2010, these companies contributed nearly $3,402.3 billion in sales.
Canada- the Canadian VC industry is very young. Only 92% of Canadian VC fund started only after 1990. Nevertheless, the impact of Venture capital-backed companies on the Canadian economy is quite significant. In 2007 according to the Canada's venture Capital and Private Equity Association (CVCA), close to 150,000 jobs in Canada are generated by VC-backed technology companies generated, which amounts to around 1.3% of all private sector employees. Between 1996 and 2007, the number of these companies operating inside Canada came to 1,755 companies with aggregate sales of $ 18.3 billion on average distributed between information and communication technology (ICT) with $ 15.4 billion in sales, life science companies with $1.9 billion in sales, and other technologies with $1.0 billion in sales.
Around 50% of the information and communication technology (ICT) companies that rank among the top 1000 Canadian publicly traded companies and represent 32% of the sector's total sales and 83% of the sector's total market capitalization have received VC investment. Furthermore, VC- backed companies represent 13% of the top 350 ICT Canadian private companies, which make 5 % of this category total sale. Direct employment by VC-backed companies in ICT sector represented 8% of the total sector employment. Similarly, Around 54% of life science companies in the top 1000 Canadian publicly traded companies, which represent 26% of the sector's total sales and 38% of the sector's total market capitalization have received VC investment. Among the top 350 life science Canadian private companies, VC-backed companies make 33% and contribute 15 of this this category total sale.
Between 2003 and 2007, VC-backed technology companies have had growth rates 5 times higher for sales and 9 times higher for employment. They have reported compounded annual rates of 17.1% for employment and 32% for total sales compared to 1.9% growth rate for the total private sector employment and 6% growth rate for Canada's GDP. Most of these companies are highly innovative and R&D intensive. R&D activities are performed by around 70 % of all VC-backed companies, 64% of ICT sector, 85% of life science sector, and 63% in other technologies. Canadian VC-backed technology companies are highly export oriented. Exports amount to 70% of VC-backed companies' sales, which is 4 times the export ratio (17%) of the total Canadian private sector.
Europe- According to the European Venture Capital Association (EVCA) in its issue "employment contribution of private equity and venture capital in Europe" in 2005, private equity and venture capital funds have played a crucial role in the European economy. Over the past ten years from 1995-2004 investment by European private equity and venture capital funds have increased by more than six times from 5.5 billion EURO in 1995 to a record of 36.9 billion Euro in 2004 one third of the 36.9 billion Euro in 2004 ( 10.3 billion EURO) was invested in companies in the venture stage. However, despite the small proportion of total capital invested, venture sector accounted for the majority in terms of the number of deals. More than 75% of companies financed (5,557) were in the venture stage.
Employment in VC backed companies has marked an increase of 30.5% per year on average between 1997and 2004. This was about 40 times the average annual growth rate of total employment in the EU 25 (0.7%). Between 2000 and 2004, employment in these companies grew by a compounded rate of 190%, equivalent of 630,000 new jobs compared to a compounded rate of only 2.9% in the EU 25 over the same period. Most of these new created jobs were related to research and development (R&D) activities. On average, every third employee (33%) in VC backed companies worked in R&D and every forth (25%) contributed significantly as a researcher or engineer, compared to the overall economically active population
European Journal of Business and Social Sciences, Vol. 2, No.7 , pp 78-104, October 2013. P.P. 78 - 104 URL: http://www.ejbss.com/recent.aspx ISSN: 2235 -767X
EUROPEAN JOURNAL OF BUSINESS AND SOCIAL SCIENCES
88
in the EU25 in 2003, ratio of R&D employees represented only 1.3%. Industry wise analysis revealed that this ratio is highest in biotechnology ventures (74%) followed by health care and medical devices (50%).
Budget allocation to R&D activities by VC backed companies also reflected their huge contribution. In relation to total expenses, these companies spent on average 45% of their total expenses and 85% of their sales on research and development. Relative to the number of employees, R&D spending translated to 50,700 EURO per employee, which is significantly more than the 8,400 EURO per employee spent on R&D by the 500 companies with the largest R&D spending in the EU25. In addition, Average remuneration in VC backed companies (49,381 EURO) was more than 75% higher than the average gross wage in the EU 25 (27,860 EURO). VC backed companies were also more engaged in employee training and professional development.
4. Data and descriptive statistics
Data collection was produced from the World Bank data base where the bank used variable resources to ensure the accuracy of the data. For Egypt, a thirty year time frame was used (1980-2010) as model for the MENA region.
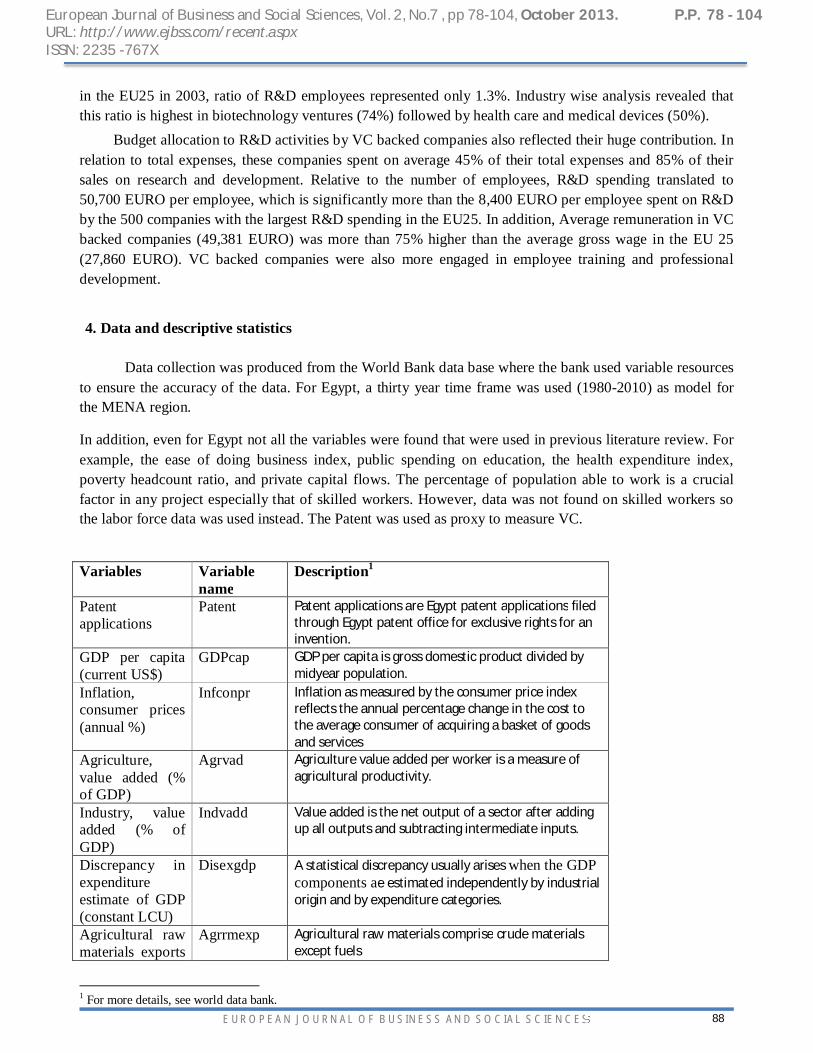
In addition, even for Egypt not all the variables were found that were used in previous literature review. For example, the ease of doing business index, public spending on education, the health expenditure index, poverty headcount ratio, and private capital flows. The percentage of population able to work is a crucial factor in any project especially that of skilled workers. However, data was not found on skilled workers so the labor force data was used instead. The Patent was used as proxy to measure VC.
Variables Variable
name Description1
Patent applications
Patent Patent applications are Egypt patent applications filed through Egypt patent office for exclusive rights for an invention.
GDP per capita (current US$)
GDPcap GDP per capita is gross domestic product divided by midyear population.
Inflation, consumer prices (annual %)
Infconpr Inflation as measured by the consumer price index reflects the annual percentage change in the cost to the average consumer of acquiring a basket of goods and services
Agriculture, value added (% of GDP)
Agrvad Agriculture value added per worker is a measure of agricultural productivity.
Industry, value added (% of GDP)
Indvadd Value added is the net output of a sector after adding up all outputs and subtracting intermediate inputs.
Discrepancy in expenditure estimate of GDP (constant LCU)
Disexgdp A statistical discrepancy usually arises when the GDP components ae estimated independently by industrial origin and by expenditure categories.
Agricultural raw materials exports
Agrrmexp Agricultural raw materials comprise crude materials except fuels
1 For more details, see world data bank.
European Journal of Business and Social Sciences, Vol. 2, No.7 , pp 78-104, October 2013. P.P. 78 - 104 URL: http://www.ejbss.com/recent.aspx ISSN: 2235 -767X
EUROPEAN JOURNAL OF BUSINESS AND SOCIAL SCIENCES
89
Variables Variable name
Description1
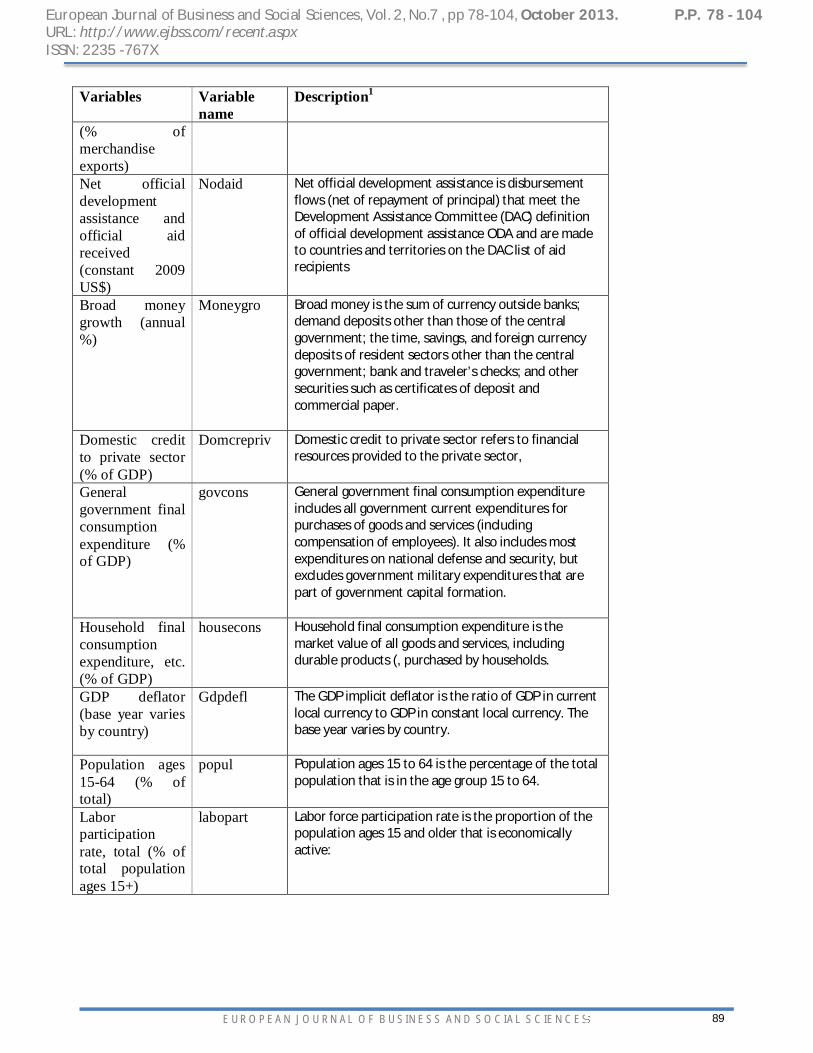
(% of merchandise exports) Net official development assistance and official aid received (constant 2009 US$)
Nodaid Net official development assistance is disbursement flows (net of repayment of principal) that meet the Development Assistance Committee (DAC) definition of official development assistance ODA and are made to countries and territories on the DAC list of aid recipients
Broad money growth (annual %)
Moneygro Broad money is the sum of currency outside banks; demand deposits other than those of the central government; the time, savings, and foreign currency deposits of resident sectors other than the central government; bank and traveler’s checks; and other securities such as certificates of deposit and commercial paper.
Domestic credit to private sector (% of GDP)
Domcrepriv Domestic credit to private sector refers to financial resources provided to the private sector,
General government final consumption expenditure (% of GDP)
govcons General government final consumption expenditure includes all government current expenditures for purchases of goods and services (including compensation of employees). It also includes most expenditures on national defense and security, but excludes government military expenditures that are part of government capital formation.
Household final consumption expenditure, etc. (% of GDP)
housecons Household final consumption expenditure is the market value of all goods and services, including durable products (, purchased by households.
GDP deflator (base year varies by country)
Gdpdefl The GDP implicit deflator is the ratio of GDP in current local currency to GDP in constant local currency. The base year varies by country.
Population ages 15-64 (% of total)
popul Population ages 15 to 64 is the percentage of the total population that is in the age group 15 to 64.
Labor participation rate, total (% of total population ages 15+)
labopart Labor force participation rate is the proportion of the population ages 15 and older that is economically active:
European Journal of Business and Social Sciences, Vol. 2, No.7 , pp 78-104, October 2013. P.P. 78 - 104 URL: http://www.ejbss.com/recent.aspx ISSN: 2235 -767X
EUROPEAN JOURNAL OF BUSINESS AND SOCIAL SCIENCES
90
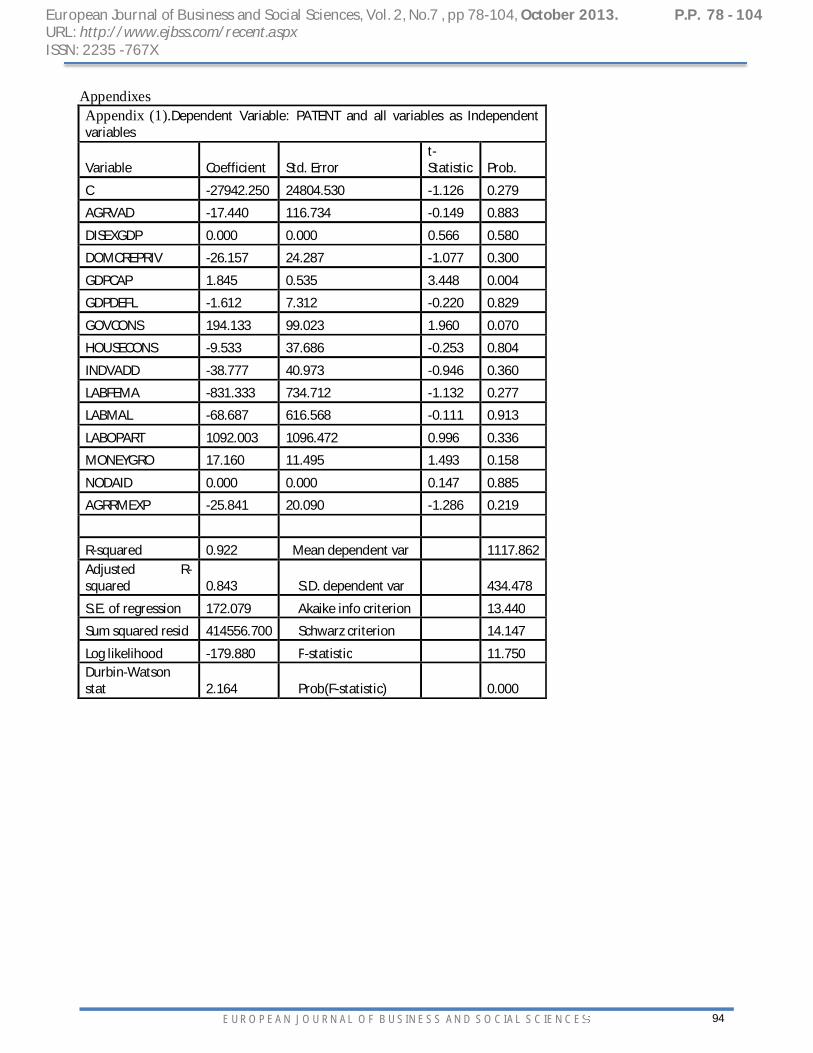
4-Empirical analyses After examining the stationary of the time series, it was found that all variables are stationary at the level so there was no need to generate first or second difference. Aregression analysis for all the variables of the study was carried out. Although ܴଶ -explanatory power -was high 92% and Durbin Watson (DW) was near 2, all the variables were insignificant except for GDPCAP and GOVCONS. Moreover, many variables appear with signals that do not consist with the study hypothesis as shown in appendix (1)
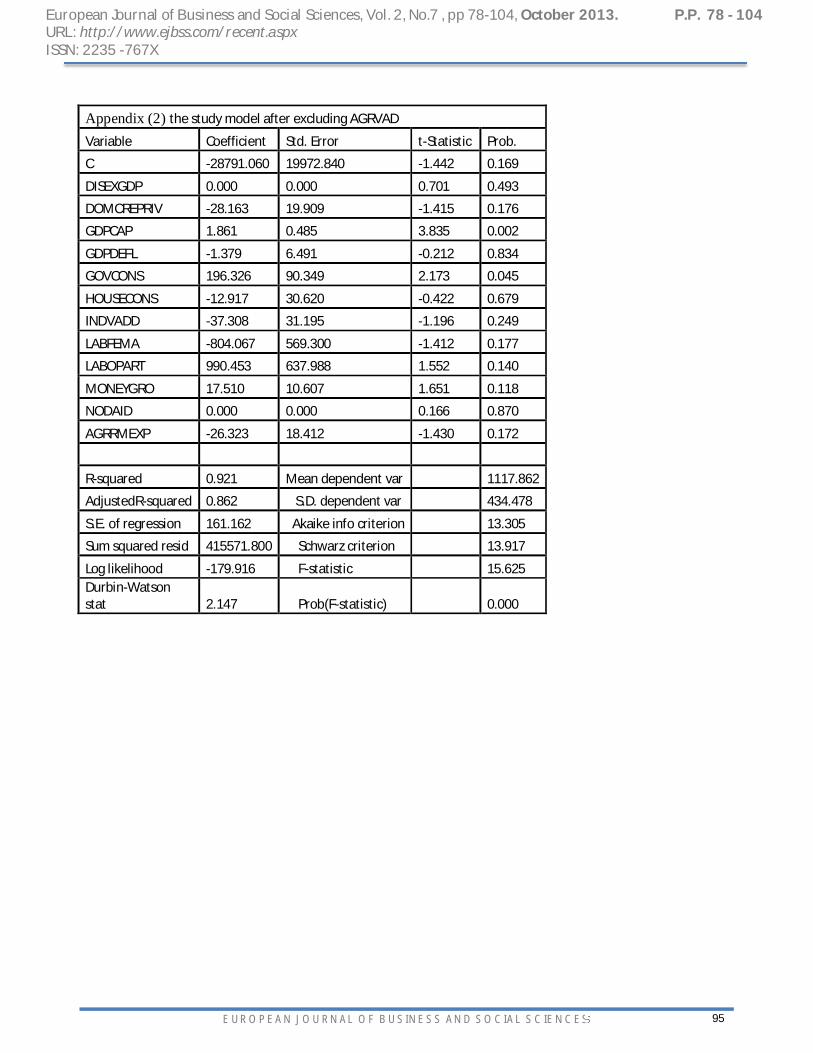
Therefore some changes were needed in the model. The researchers eliminated AGRVAD since it was not significant and had a negative sign but the results remain the same with only GDPCAP and GOVCONS as significant variables with ܴଶ to 92% and Durbin Watson (DW) was near 2 as shown in appendix (2).
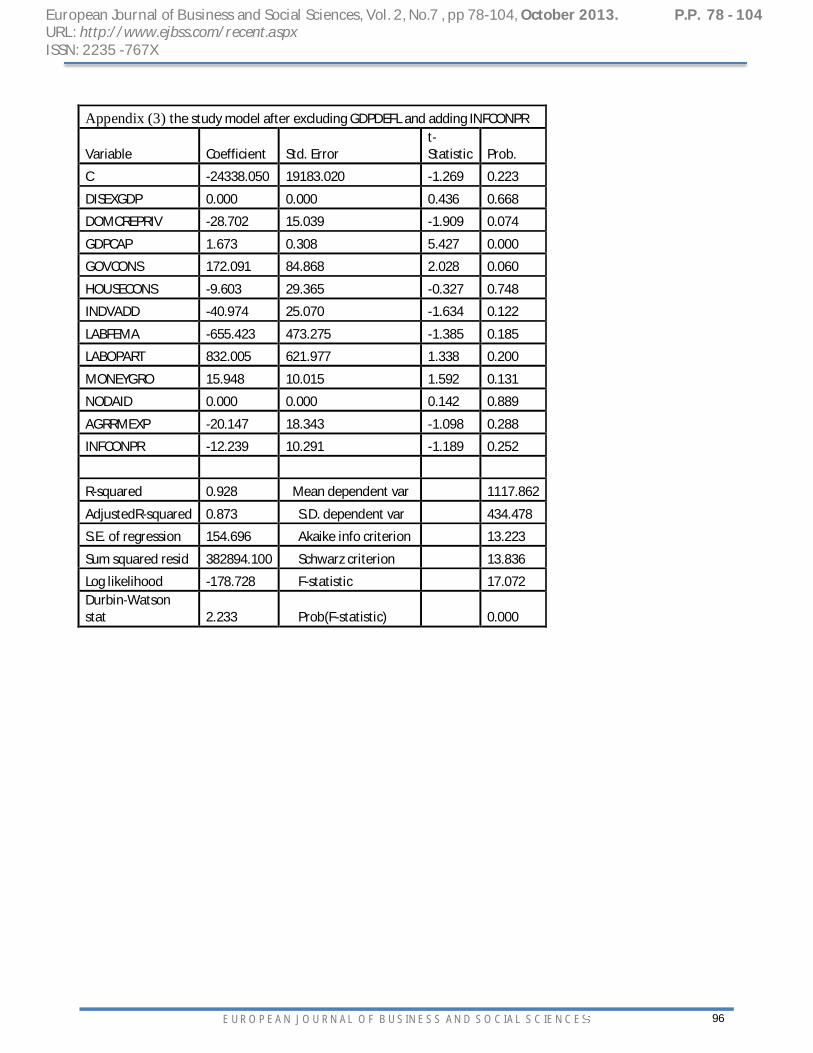
Further, the researcher eliminates GDPDEFL and added a new variable INFCONPE and this led to the improvement of the results, the significant variables became 3 which are DOMCREP, GDPCAP and GOVCONS with ܴଶ 93% and Durbin Watson (DW) was 2.23 as shown in appendix (3)
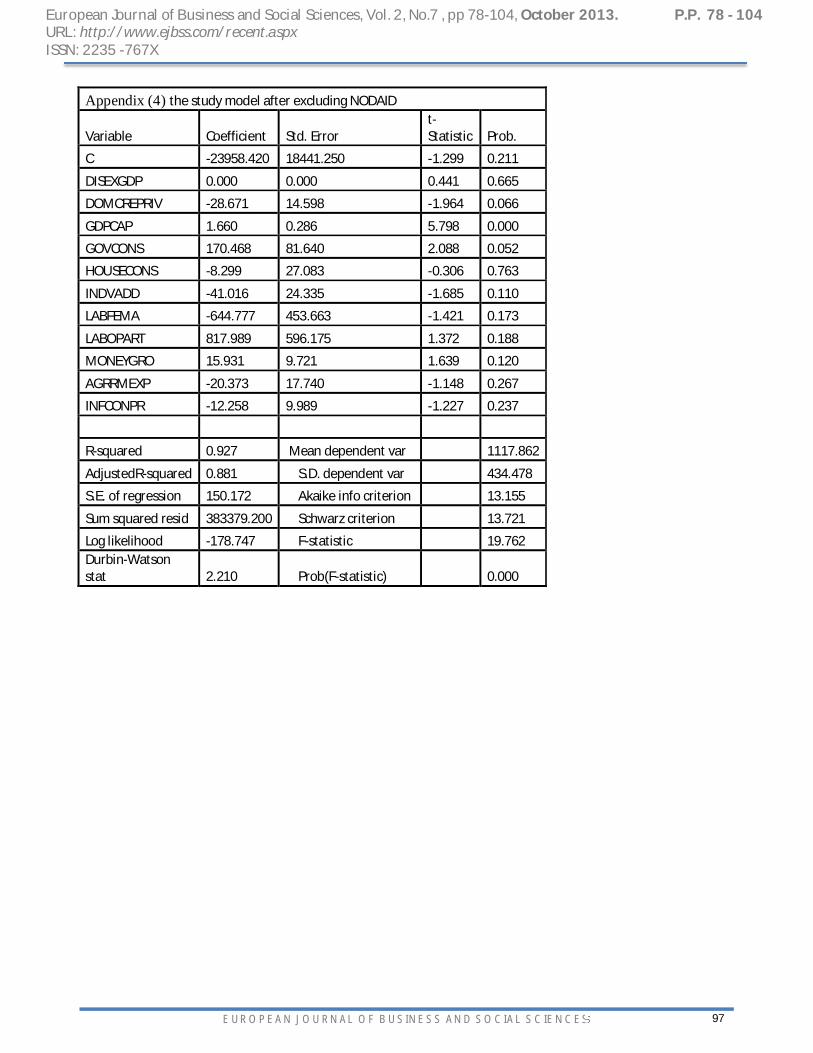
Eliminating NODAID has no effect on the model as shown in appendix (4).
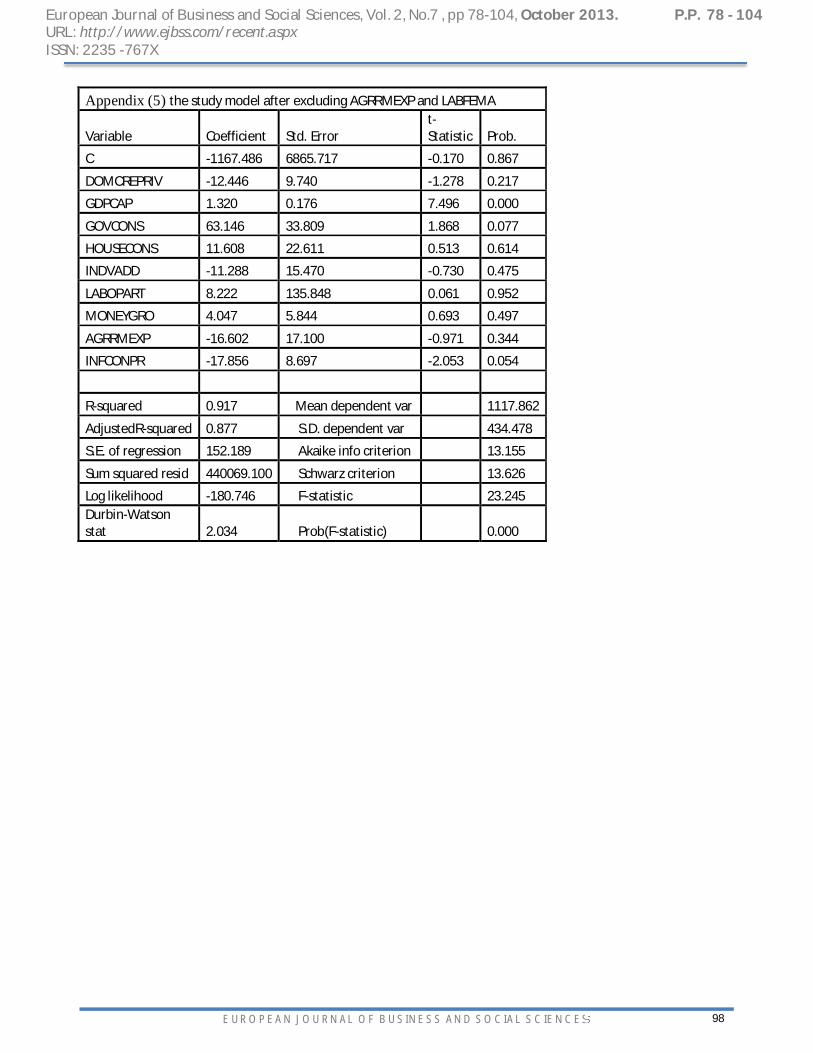
In another stage, the researcher eliminates DISEXGDP and LABFEMA. This led to conversion of DOMCREP from significant into non-significant, and the conversion of INFCONPE from insignificant into significant while GDPCAP and GOVCONS remains significant with a slight improvement of DW to 2.03 as shown in appendix (5).
By eliminating INDVADO which appeared with negative sign and was insignificant, there was no change in the results as shown in appendix (6). Also by eliminating MONEYGR, there was no change in the results as shown in appendix (7).
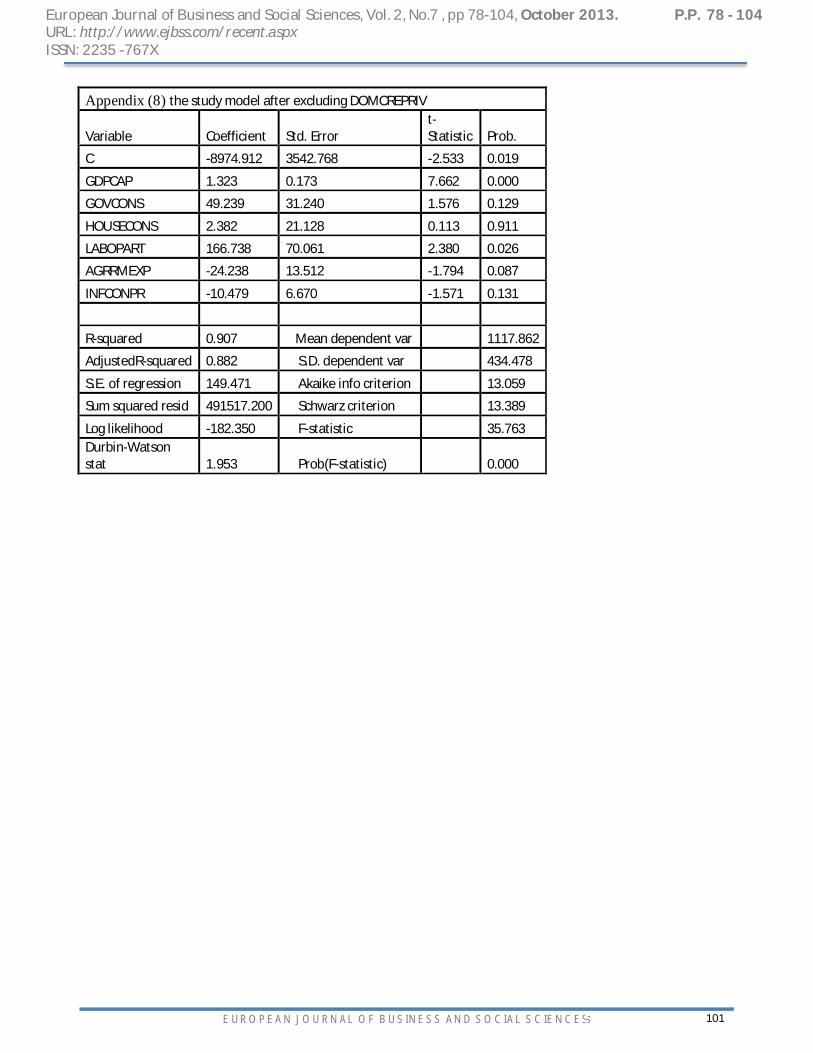
By eliminating DOMCREPRIV, both GOVCONS and INFCONPE became insignificant , LABOPAR appeared significant with R2= 91% and DW=1.95 as shown in appendix (8).
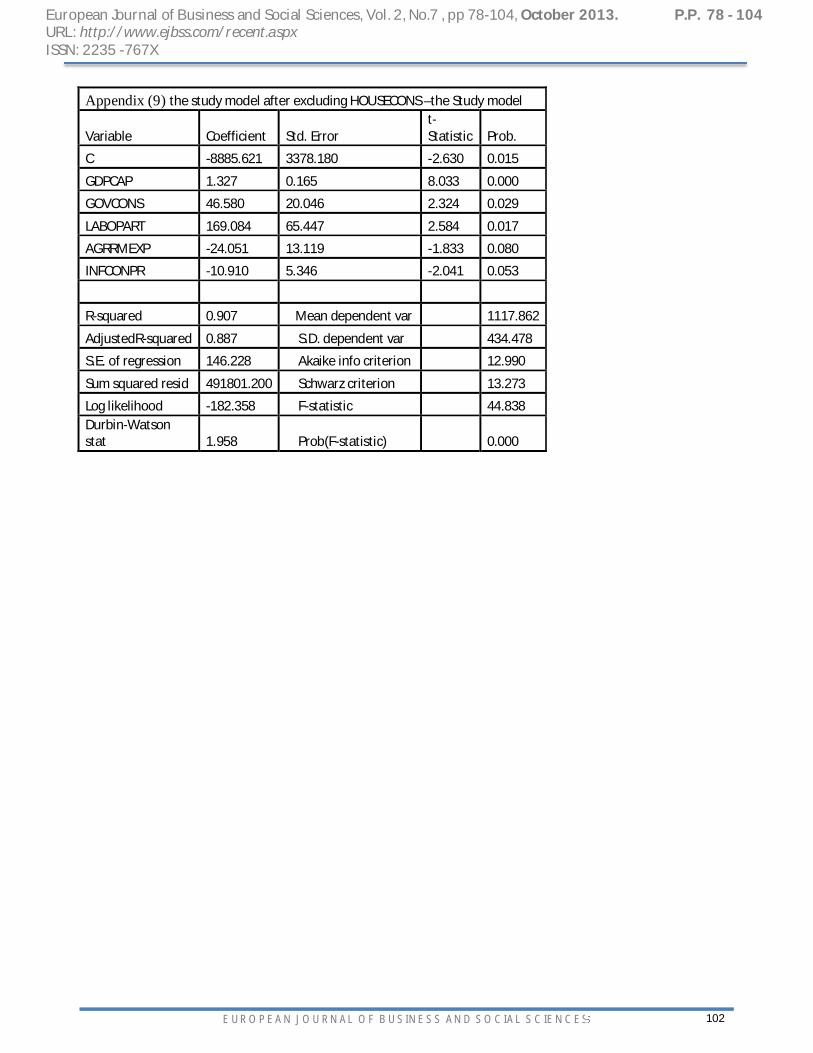
Finally, by eliminating HOUSECO, the results shows remarkable improvement; all the variables became significant with R2=91 and DW = 1.96 as shown in appendix (9).
So, the researchers used the following equation as the research model:
Venture Capital = -8885.62 + 1.33*GDPCAP + 46.58*GOVCONS + 169.08*LABOPART - 24.05*AGRRMEXP - 10.91*INFCONPR
There is a positive relationship between GDPCAP,GOVCONS, LABPAR with VC (measured by patent). Which means that we have to reject the hypothesis 1, hypothesis 2 and hypothesis 6, on the other hand, there is negative relation between AGRMEX,INFCOMP with VC. We couldn’t testify hypothesis 3,4 and 5 because the lack of data. It is highly recommended to be examined in future research.
These results are reasonable since the increase in GDPCAP help to improve the standard of living and this gives access to internet and educational resources which facilitate invention. This result is in agreement with Mayer (2010). While other studies as Jeng and Wells 2000, shows that there is no effect of GDP on Patent.
GOVCONS also leads to increase patent as these spending facilitate the suitable infrastructure as access to internet, electricity, etc. which agree with the results in the previous studies of Feldmann (2010) , Samila and Sorenson (2011) and Belke and Schaal, (2004).
European Journal of Business and Social Sciences, Vol. 2, No.7 , pp 78-104, October 2013. P.P. 78 - 104 URL: http://www.ejbss.com/recent.aspx ISSN: 2235 -767X
EUROPEAN JOURNAL OF BUSINESS AND SOCIAL SCIENCES
91
LABOPART has a positive relation with patent. Since increase the percentage of people in the labor force, increase the pool of people that can produce patents and also increase the labor participation is a sign of the presence of more new projects which motivate new patents and effective method of production. The increase in the labor participation also affect positively the GDP as the presence of more workers, means more products in the market.
On the other hand, it is accepted the negative relation between exporting raw material and invention. This because selling raw materials does not involve any processing so there is no motive for invention, while if there is selling of processed products, this motivate invention due to processes involved in transforming the raw material to goods that needs creativity in increasing production and find solutions to do it in an efficient way.
Also increase in INFCOMP has negative effect since the prices rises and this rise also reach to machines and tools of production which hinder investors from opening new businesses. Also increase inflation raises the cost of living which forces people to spend more, keeping low saving and hence less money is available for investment.
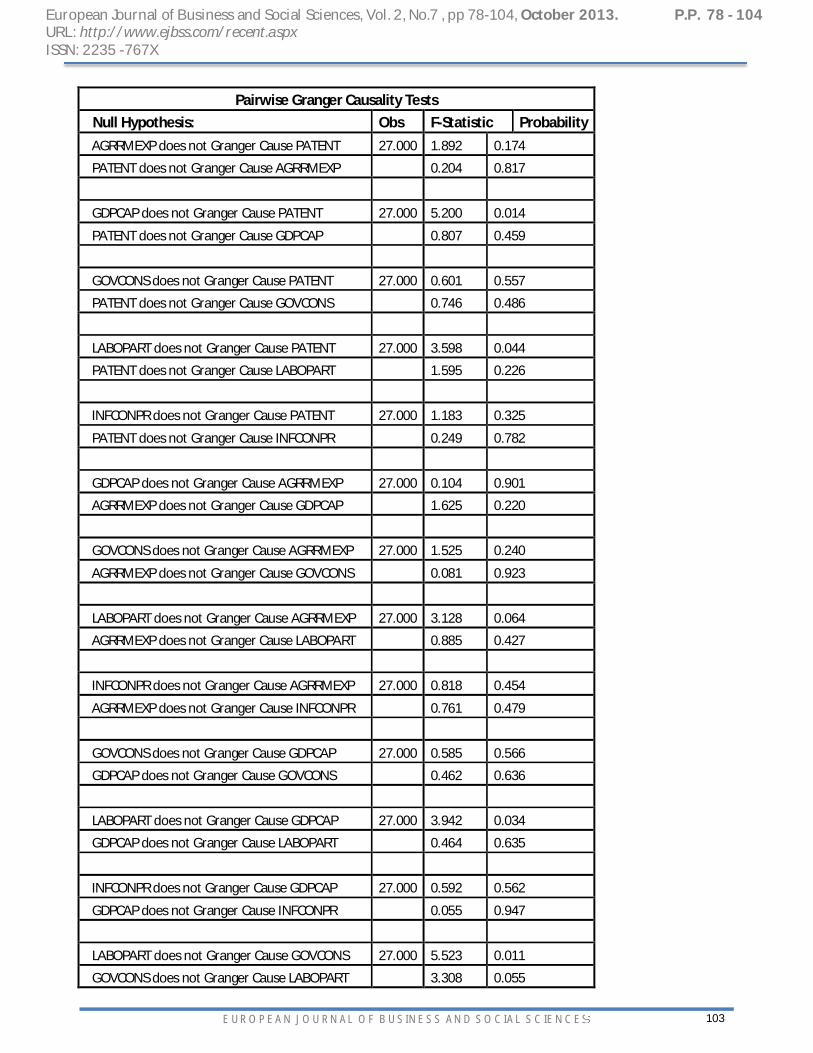
By doing Granger causality tests shows that GDPCAP cause Patent.LABOPART cause all of following Patent, AGRRMEXP and GDPCAP.There is bio causality between GOVCONS and LABOPART.
GOVCONS cause INFCONPR. Finally there is Granger causality from INFOCONPR to LABOPART.
5- Summary
The Economic impact of venture capital investments has been widely documented theoretically and empirically. Crucial economic developments are proven in areas such as economic growth and value creation, innovation, and job creation. Experience across- countries, however, has been different. Various economic and non-economic determinants have been identified to have played a role in enhancing the demand and supply side of VC industry. GDP growth, interest rates, tax rates, capital markets dynamisms, entrepreneurship culture, government policies and legal framework, among others, were proven to have a tremendous impact. According to OECD, effective policy approaches in the venture capital area will need to be tailed to specific national economic and financial contexts. We further investigate different countries' experiences for determents contribute to growth of VC. Regarding the last point, an attempt was made to put together the latest available data published by various recognizable sources as possible depending on the availability of data. Finally, an investigation of the VC determents in Egypt was presented. It was discovered that there is a positive significance relation between VC (measured by Patent) and GDP per capita, general government expenditure and labor participation rate. Also, it was found that negative relation exists between VC and both agricultural raw material exports and inflation, and consumer prices. Finally, using the Granger Causality tests there is causality from both of GDP per capita and from the labor participation rate to VC.
European Journal of Business and Social Sciences, Vol. 2, No.7 , pp 78-104, October 2013. P.P. 78 - 104 URL: http://www.ejbss.com/recent.aspx ISSN: 2235 -767X
EUROPEAN JOURNAL OF BUSINESS AND SOCIAL SCIENCES
92
References
1. Achleitner A., Bender, M., Kaserer C and Lutz E.(2010), "Geographical Location of New Venture and the likelihood of a Venture Capital Investment", Center for Entrepreneurial and Financial Studies, Working paper No. 2010-02.
2. Achleitner, A., Kloeckner, O., (2005), "Employment Contribution of Private Equity and Venture Capital in Europe", Center for Entrepreneurial and Financial Studies.
3. Armour, J. and Cumming, J. (2004), "The Legal Road to Replicating Silicon Valley", ESRC Center for Business Research, University of Cambridge, Working paper No. 281.
4. Armour, J. and Cumming, J. (2005), "Bankruptcy Law and Entrepreneurship", ESRC Center for Business Research, University of Cambridge, Working paper No. 300.
5. Becher, R., Hellmann, T.,(2003)," The Genesis of Venture Capital- Lessons for the German Experience", CESIFO Working Paper No. 883.
6. Belke, A. and Schaal, A., (2004), "Venture Capital Investment and Labor Market Performance: New Empirical Evidence for OECD Countries", IZA DP No. 1447.
7. Belke, A., Fehn, R. and Foster, N., (2003), "Does Venture Capital Investment Spur Employment Growth", Center for European Policy Studies, WD No. 197.
8. Bertoni, F., Colombo, M., D'Adda, D.and Murtinu (2010), "Venture Capital Financing and Innovation in Europe New Technology-Based Firms: A longitudinal analysis on the role of the type of investor", paper contributed for the second conference of corporate R&D, (Concord-2010).
9. Bertoni,F., Croce, A. and D'Adda, D., (2011), " Venture Capital and the Patenting Activity of Italian High-Tech Start-ups", Journal of Industrial and Business Economics, Vol. 38(4): 35-67.
10. Black, B and Gilson, R., (1999)," Does Venture Capital Require an Active Stock Market?" Journal of Applied Corporate Finance, Vol. 11, Issue 4, pp. 36-48
11. Brander, J., Du, Q., Hellmann, T., (2010), " The Effects of Government-Sponsored Venture Capital: International Evidence".
12. Callahan. J and Muegge. S (2002) “Venture Capital's Role in Innovation: Issues, Research and Stakeholder Interests” working paper at the Carleton University November 2002 Carleton University Ottawa, Ontario, Canada
13. Chaabouni, K. (2011), " Determinants and Legitimacy of Venture Capital Financing: An Empirical Verification", Anadolu University Journal of Social Science, Vol. 11, No. 1, pp. 27-38.
14. Chemmanur, T., Krishnan, K., Nandy, D., (2008), "How Does Venture Capital Financing Improve Efficiency in Private Firms? A Look beneath the Surface", CES 08-16.
15. Chemmanur. J, Loutskina .E, and Tian . X(2011)” Corporate Venture Capital, Value Creation, and Innovation” Working Paper, Boston College, University of Virginia, and Indiana University
16. Cumming, D., Schmidt, D.and Walz, U. (2004). "Legality and Venture Governance around the World", Center for Financial Studies, Working paper No. 2004/17.
17. Cumming,.J. (2006), " The Determinants of Venture Capital Portfolio Size: Empirical Evidence", Rensselaer Polytechnic Institute.
18. Da Rin, M. and Penas, M. (2007), "The Effect of Venture Capital on Innovation Strategies", National Bureau of Economic Research, Working Paper No. 13636.
19. Employment Contribution of Private Equity and Venture Capital in Europe, Center for Entrepreneurial and Financial Studies (CEFS) on behave of European Private Equity and Venture Capital Association (EVCA), 2005.
20. Engel, D. (2002)," The impact of Venture Capital in Firm growth: an empirical investigation", Center for European Economic Research, Discussion paper No. 02-20
21. Esquire, . S.and Shachmurove, Y. (2010)," Environmental Economics and Venture Capital", Department of Economics, the City College of the City University of New York,

European Journal of Business and Social Sciences, Vol. 2, No.7 , pp 78-104, October 2013. P.P. 78 - 104 URL: http://www.ejbss.com/recent.aspx ISSN: 2235 -767X
EUROPEAN JOURNAL OF BUSINESS AND SOCIAL SCIENCES
93
22. Feldmann, H., (2010), "Venture Capital Availability and Labor Market Performance in Industrial Countries: Evidence Based on Survey Data", Department of Economics, University of Bath, UK, Working Paper 01/01.
23. Florida . R and kenneyt. M (1986)” Venture Capital, High Technology and Regional Development’ Regional Studies, working paper Vol. 22.1, pp. 3-48.
24. Gompers. P and Xuan . Y )"2009 ( Bridge Building in Venture Capital-Backed Acquisitions" working paper Harvard Business School
25. Hellmann, T. and Puri, M., (2000)," The Interaction between Product Market and Financing Strategy: The Role of Venture Capital", Oxford University, the Review of Financial Studies.
26. Hirukawa, M. and Ueda, M., (2008), "Venture Capital and Industrial Innovation" 27. Jeng, Leslie A. and Wells, Philippe (200), " The determinants of venture capital funding: evidence
across countries", Journal of Corporate Finance, Vol. 6, pp. 241-289. 28. Kelly, R., (2011), "The Performance and Prospects of European Venture Capital", The European
Investment Fund, Working Paper No. 2011-09. 29. Kortum .S and Lerner. J (2000)" Assessing the contribution of venture capital to innovation" RAND
Journal of Economics Vol. 31, No. 4, Winter 2000pp. 674–692 30. Kortum, S. and Lerner, J., (1998), "Does Venture Capital Spur Innovation?", National Bureau of
Economic Research, Working Paper No. 6848. 31. Meyer, T., (2010), "Venture Capital Adds Economic Spice", Deutsche Bank Research, Germany. 32. OEDC (2003)Venture Capital: Trends and Policy Recommendation, 33. Peneder, M., and Schwarz, G., (2008), " Venture Capital: Results of the Impact Study for Austria". 34. Pfeil, A., (2000), "New Ways of Financing Technology Innovation", Human Development Report
Office. 35. Romain, A. and Pottelsberghe, B., (2003),"The Determinants of Venture Capital: A Panel Data
Analysis of 16 OECD Countries", Institute of Innovation Research, Hitotsubashi University, Working Paper No. 03-25.
36. Romain, A. and Pottelsberghe, B., (2004)," The Economic Impact of Venture Capital", Studies of the Economic Research Center, Series 1, No. 18/2004.
37. Samila, S. and Sorenson, O. (2011)," Venture Capital, Entrepreneurship, and Economic Growth", the Review of Economic and Statistics, Vol. 93, No. 1, pp. 338-349.
38. Schertler, A., (2003)," Driving Forces of Venture Capital Investment in Eroupe" A Dynamic Panel Data Analysis", Kiel Working Paper No. 1172.
39. Survey of the Economic and Social Impact of Venture Capital in Europe, European Private Equity and Venture Capital Association (EVCA), June 2002.
40. The Economic Importance of Venture Capital-backed Companies to the US Economy, edition 4, 5, and 6
41. Venture Capital on the Canadian Economy, Canadian's Venture Capital and Private Equity Association, January, 2009. Why Venture Capital is Essential to the Canadian Economy: The Impact of
42. Ueda. M. and Hirukawa . M ( 2003)" Venture Capital and Productivity "Unpublished working paper ،University of Wisconsin, USA. P.152-154.
43. Ueda. M. and Hirukawa . M (2006)” Venture Capital and Industrial “Innovation” Unpublished working paper at University of Wisconsin,
44. Wallsten, S. (2004), "Do Science Parks Generate Regional Economic Growth? An Empirical Analysis of their Effects on Job Growth and Venture Capital", AEI Brooking Joint Center For Regulatory Studies, Working Paper No. 04-04.
European Journal of Business and Social Sciences, Vol. 2, No.7 , pp 78-104, October 2013. P.P. 78 - 104 URL: http://www.ejbss.com/recent.aspx ISSN: 2235 -767X
EUROPEAN JOURNAL OF BUSINESS AND SOCIAL SCIENCES
94
Appendixes Appendix (1).Dependent Variable: PATENT and all variables as Independent variables
Variable Coefficient Std. Error t-Statistic Prob.
C -27942.250 24804.530 -1.126 0.279
AGRVAD -17.440 116.734 -0.149 0.883
DISEXGDP 0.000 0.000 0.566 0.580
DOMCREPRIV -26.157 24.287 -1.077 0.300
GDPCAP 1.845 0.535 3.448 0.004
GDPDEFL -1.612 7.312 -0.220 0.829
GOVCONS 194.133 99.023 1.960 0.070
HOUSECONS -9.533 37.686 -0.253 0.804
INDVADD -38.777 40.973 -0.946 0.360
LABFEMA -831.333 734.712 -1.132 0.277
LABMAL -68.687 616.568 -0.111 0.913
LABOPART 1092.003 1096.472 0.996 0.336
MONEYGRO 17.160 11.495 1.493 0.158
NODAID 0.000 0.000 0.147 0.885
AGRRMEXP -25.841 20.090 -1.286 0.219
R-squared 0.922 Mean dependent var 1117.862 Adjusted R-squared 0.843 S.D. dependent var 434.478
S.E. of regression 172.079 Akaike info criterion 13.440
Sum squared resid 414556.700 Schwarz criterion 14.147
Log likelihood -179.880 F-statistic 11.750 Durbin-Watson stat 2.164 Prob(F-statistic) 0.000
European Journal of Business and Social Sciences, Vol. 2, No.7 , pp 78-104, October 2013. P.P. 78 - 104 URL: http://www.ejbss.com/recent.aspx ISSN: 2235 -767X
EUROPEAN JOURNAL OF BUSINESS AND SOCIAL SCIENCES
95
Appendix (2) the study model after excluding AGRVAD
Variable Coefficient Std. Error t-Statistic Prob.
C -28791.060 19972.840 -1.442 0.169
DISEXGDP 0.000 0.000 0.701 0.493
DOMCREPRIV -28.163 19.909 -1.415 0.176
GDPCAP 1.861 0.485 3.835 0.002
GDPDEFL -1.379 6.491 -0.212 0.834
GOVCONS 196.326 90.349 2.173 0.045
HOUSECONS -12.917 30.620 -0.422 0.679
INDVADD -37.308 31.195 -1.196 0.249
LABFEMA -804.067 569.300 -1.412 0.177
LABOPART 990.453 637.988 1.552 0.140
MONEYGRO 17.510 10.607 1.651 0.118
NODAID 0.000 0.000 0.166 0.870
AGRRMEXP -26.323 18.412 -1.430 0.172
R-squared 0.921 Mean dependent var 1117.862
AdjustedR-squared 0.862 S.D. dependent var 434.478
S.E. of regression 161.162 Akaike info criterion 13.305
Sum squared resid 415571.800 Schwarz criterion 13.917
Log likelihood -179.916 F-statistic 15.625 Durbin-Watson stat 2.147 Prob(F-statistic) 0.000
European Journal of Business and Social Sciences, Vol. 2, No.7 , pp 78-104, October 2013. P.P. 78 - 104 URL: http://www.ejbss.com/recent.aspx ISSN: 2235 -767X
EUROPEAN JOURNAL OF BUSINESS AND SOCIAL SCIENCES
96
Appendix (3) the study model after excluding GDPDEFL and adding INFCONPR
Variable Coefficient Std. Error t-Statistic Prob.
C -24338.050 19183.020 -1.269 0.223
DISEXGDP 0.000 0.000 0.436 0.668
DOMCREPRIV -28.702 15.039 -1.909 0.074
GDPCAP 1.673 0.308 5.427 0.000
GOVCONS 172.091 84.868 2.028 0.060
HOUSECONS -9.603 29.365 -0.327 0.748
INDVADD -40.974 25.070 -1.634 0.122
LABFEMA -655.423 473.275 -1.385 0.185
LABOPART 832.005 621.977 1.338 0.200
MONEYGRO 15.948 10.015 1.592 0.131
NODAID 0.000 0.000 0.142 0.889
AGRRMEXP -20.147 18.343 -1.098 0.288
INFCONPR -12.239 10.291 -1.189 0.252
R-squared 0.928 Mean dependent var 1117.862
AdjustedR-squared 0.873 S.D. dependent var 434.478
S.E. of regression 154.696 Akaike info criterion 13.223
Sum squared resid 382894.100 Schwarz criterion 13.836
Log likelihood -178.728 F-statistic 17.072 Durbin-Watson stat 2.233 Prob(F-statistic) 0.000
European Journal of Business and Social Sciences, Vol. 2, No.7 , pp 78-104, October 2013. P.P. 78 - 104 URL: http://www.ejbss.com/recent.aspx ISSN: 2235 -767X
EUROPEAN JOURNAL OF BUSINESS AND SOCIAL SCIENCES
97
Appendix (4) the study model after excluding NODAID
Variable Coefficient Std. Error t-Statistic Prob.
C -23958.420 18441.250 -1.299 0.211
DISEXGDP 0.000 0.000 0.441 0.665
DOMCREPRIV -28.671 14.598 -1.964 0.066
GDPCAP 1.660 0.286 5.798 0.000
GOVCONS 170.468 81.640 2.088 0.052
HOUSECONS -8.299 27.083 -0.306 0.763
INDVADD -41.016 24.335 -1.685 0.110
LABFEMA -644.777 453.663 -1.421 0.173
LABOPART 817.989 596.175 1.372 0.188
MONEYGRO 15.931 9.721 1.639 0.120
AGRRMEXP -20.373 17.740 -1.148 0.267
INFCONPR -12.258 9.989 -1.227 0.237
R-squared 0.927 Mean dependent var 1117.862
AdjustedR-squared 0.881 S.D. dependent var 434.478
S.E. of regression 150.172 Akaike info criterion 13.155
Sum squared resid 383379.200 Schwarz criterion 13.721
Log likelihood -178.747 F-statistic 19.762 Durbin-Watson stat 2.210 Prob(F-statistic) 0.000
European Journal of Business and Social Sciences, Vol. 2, No.7 , pp 78-104, October 2013. P.P. 78 - 104 URL: http://www.ejbss.com/recent.aspx ISSN: 2235 -767X
EUROPEAN JOURNAL OF BUSINESS AND SOCIAL SCIENCES
98
Appendix (5) the study model after excluding AGRRMEXP and LABFEMA
Variable Coefficient Std. Error t-Statistic Prob.
C -1167.486 6865.717 -0.170 0.867
DOMCREPRIV -12.446 9.740 -1.278 0.217
GDPCAP 1.320 0.176 7.496 0.000
GOVCONS 63.146 33.809 1.868 0.077
HOUSECONS 11.608 22.611 0.513 0.614
INDVADD -11.288 15.470 -0.730 0.475
LABOPART 8.222 135.848 0.061 0.952
MONEYGRO 4.047 5.844 0.693 0.497
AGRRMEXP -16.602 17.100 -0.971 0.344
INFCONPR -17.856 8.697 -2.053 0.054
R-squared 0.917 Mean dependent var 1117.862
AdjustedR-squared 0.877 S.D. dependent var 434.478
S.E. of regression 152.189 Akaike info criterion 13.155
Sum squared resid 440069.100 Schwarz criterion 13.626
Log likelihood -180.746 F-statistic 23.245 Durbin-Watson stat 2.034 Prob(F-statistic) 0.000

European Journal of Business and Social Sciences, Vol. 2, No.7 , pp 78-104, October 2013. P.P. 78 - 104 URL: http://www.ejbss.com/recent.aspx ISSN: 2235 -767X
EUROPEAN JOURNAL OF BUSINESS AND SOCIAL SCIENCES
99
Appendix (6) the study model after excluding INDVADD
Variable Coefficient Std. Error t-Statistic Prob.
C -3699.552 5854.442 -0.632 0.535
DOMCREPRIV -9.754 8.908 -1.095 0.287
GDPCAP 1.315 0.174 7.564 0.000
GOVCONS 56.983 32.352 1.761 0.094
HOUSECONS 11.415 22.344 0.511 0.615
LABOPART 51.658 120.673 0.428 0.673
MONEYGRO 1.580 4.710 0.335 0.741
AGRRMEXP -14.137 16.566 -0.853 0.404
INFCONPR -15.129 7.760 -1.950 0.065
R-squared 0.914 Mean dependent var 1117.862
AdjustedR-squared 0.880 S.D. dependent var 434.478
S.E. of regression 150.399 Akaike info criterion 13.114
Sum squared resid 452399.600 Schwarz criterion 13.538
Log likelihood -181.147 F-statistic 26.709 Durbin-Watson stat 1.995 Prob(F-statistic) 0.000

European Journal of Business and Social Sciences, Vol. 2, No.7 , pp 78-104, October 2013. P.P. 78 - 104 URL: http://www.ejbss.com/recent.aspx ISSN: 2235 -767X
EUROPEAN JOURNAL OF BUSINESS AND SOCIAL SCIENCES
100
Appendix (7) the study model after excluding MONEYGRO
Variable Coefficient Std. Error t-Statistic Prob.
C -3283.912 5599.592 -0.586 0.564
DOMCREPRIV -10.719 8.250 -1.299 0.208
GDPCAP 1.314 0.170 7.723 0.000
GOVCONS 58.064 31.503 1.843 0.080
HOUSECONS 10.939 21.822 0.501 0.621
LABOPART 44.880 116.429 0.385 0.704
AGRRMEXP -13.001 15.870 -0.819 0.422
INFCONPR -15.356 7.565 -2.030 0.055
R-squared 0.914 Mean dependent var 1117.862
Adjusted R-squared 0.885
S.D. dependent var 434.478
S.E. of regression 147.187 Akaike info criterion 13.050
Sum squared resid 454944.600 Schwarz criterion 13.427
Log likelihood -181.228 F-statistic 31.854 Durbin-Watson stat 2.000 Prob(F-statistic) 0.000
European Journal of Business and Social Sciences, Vol. 2, No.7 , pp 78-104, October 2013. P.P. 78 - 104 URL: http://www.ejbss.com/recent.aspx ISSN: 2235 -767X
EUROPEAN JOURNAL OF BUSINESS AND SOCIAL SCIENCES
101
Appendix (8) the study model after excluding DOMCREPRIV
Variable Coefficient Std. Error t-Statistic Prob.
C -8974.912 3542.768 -2.533 0.019
GDPCAP 1.323 0.173 7.662 0.000
GOVCONS 49.239 31.240 1.576 0.129
HOUSECONS 2.382 21.128 0.113 0.911
LABOPART 166.738 70.061 2.380 0.026
AGRRMEXP -24.238 13.512 -1.794 0.087
INFCONPR -10.479 6.670 -1.571 0.131
R-squared 0.907 Mean dependent var 1117.862
AdjustedR-squared 0.882 S.D. dependent var 434.478
S.E. of regression 149.471 Akaike info criterion 13.059
Sum squared resid 491517.200 Schwarz criterion 13.389
Log likelihood -182.350 F-statistic 35.763 Durbin-Watson stat 1.953 Prob(F-statistic) 0.000
European Journal of Business and Social Sciences, Vol. 2, No.7 , pp 78-104, October 2013. P.P. 78 - 104 URL: http://www.ejbss.com/recent.aspx ISSN: 2235 -767X
EUROPEAN JOURNAL OF BUSINESS AND SOCIAL SCIENCES
102
Appendix (9) the study model after excluding HOUSECONS –the Study model
Variable Coefficient Std. Error t-Statistic Prob.
C -8885.621 3378.180 -2.630 0.015
GDPCAP 1.327 0.165 8.033 0.000
GOVCONS 46.580 20.046 2.324 0.029
LABOPART 169.084 65.447 2.584 0.017
AGRRMEXP -24.051 13.119 -1.833 0.080
INFCONPR -10.910 5.346 -2.041 0.053
R-squared 0.907 Mean dependent var 1117.862
AdjustedR-squared 0.887 S.D. dependent var 434.478
S.E. of regression 146.228 Akaike info criterion 12.990
Sum squared resid 491801.200 Schwarz criterion 13.273
Log likelihood -182.358 F-statistic 44.838 Durbin-Watson stat 1.958 Prob(F-statistic) 0.000
European Journal of Business and Social Sciences, Vol. 2, No.7 , pp 78-104, October 2013. P.P. 78 - 104 URL: http://www.ejbss.com/recent.aspx ISSN: 2235 -767X
EUROPEAN JOURNAL OF BUSINESS AND SOCIAL SCIENCES
103
Pairwise Granger Causality Tests Null Hypothesis: Obs F-Statistic Probability AGRRMEXP does not Granger Cause PATENT 27.000 1.892 0.174
PATENT does not Granger Cause AGRRMEXP 0.204 0.817
GDPCAP does not Granger Cause PATENT 27.000 5.200 0.014
PATENT does not Granger Cause GDPCAP 0.807 0.459
GOVCONS does not Granger Cause PATENT 27.000 0.601 0.557
PATENT does not Granger Cause GOVCONS 0.746 0.486
LABOPART does not Granger Cause PATENT 27.000 3.598 0.044
PATENT does not Granger Cause LABOPART 1.595 0.226
INFCONPR does not Granger Cause PATENT 27.000 1.183 0.325
PATENT does not Granger Cause INFCONPR 0.249 0.782
GDPCAP does not Granger Cause AGRRMEXP 27.000 0.104 0.901
AGRRMEXP does not Granger Cause GDPCAP 1.625 0.220
GOVCONS does not Granger Cause AGRRMEXP 27.000 1.525 0.240
AGRRMEXP does not Granger Cause GOVCONS 0.081 0.923
LABOPART does not Granger Cause AGRRMEXP 27.000 3.128 0.064
AGRRMEXP does not Granger Cause LABOPART 0.885 0.427
INFCONPR does not Granger Cause AGRRMEXP 27.000 0.818 0.454
AGRRMEXP does not Granger Cause INFCONPR 0.761 0.479
GOVCONS does not Granger Cause GDPCAP 27.000 0.585 0.566
GDPCAP does not Granger Cause GOVCONS 0.462 0.636
LABOPART does not Granger Cause GDPCAP 27.000 3.942 0.034
GDPCAP does not Granger Cause LABOPART 0.464 0.635
INFCONPR does not Granger Cause GDPCAP 27.000 0.592 0.562
GDPCAP does not Granger Cause INFCONPR 0.055 0.947
LABOPART does not Granger Cause GOVCONS 27.000 5.523 0.011
GOVCONS does not Granger Cause LABOPART 3.308 0.055

European Journal of Business and Social Sciences, Vol. 2, No.7 , pp 78-104, October 2013. P.P. 78 - 104 URL: http://www.ejbss.com/recent.aspx ISSN: 2235 -767X
EUROPEAN JOURNAL OF BUSINESS AND SOCIAL SCIENCES
104
Pairwise Granger Causality Tests Null Hypothesis: Obs F-Statistic Probability
INFCONPR does not Granger Cause GOVCONS 27.000 4.728 0.020
GOVCONS does not Granger Cause INFCONPR 3.911 0.035
INFCONPR does not Granger Cause LABOPART 27.000 3.704 0.041
LABOPART does not Granger Cause INFCONPR 0.738 0.490