venture capital, boards of directors, and the market for
TRANSCRIPT

The Pennsylvania State University
The Graduate School
The Mary Jean and Frank P. Smeal College of Business
VENTURE CAPITAL, BOARDS OF DIRECTORS, AND THE MARKET
FOR CORPORATE CONTROL
A Dissertation in
Business Administration
by
Colin R. Jones
Submitted in Partial Fulfillment
of the Requirements
for the Degree of
Doctor of Philosophy
May 2013

ii
The dissertation of Colin R. Jones was reviewed and approved* by the following:
Chris Muscarella
Professor of Finance
Co-Chair of Committee
Dissertation Co-Advisor
Laura Field
Associate Professor of Finance
Co-Chair of Committee
Dissertation Co-Advisor
David Haushalter
Associate Professor of Finance
N. Edward Coulson
Professor of Economics
William Kracaw
Professor of Finance
Head of the Department of Finance
*Signatures are on file in the Graduate School

iii
ABSTRACT
This dissertation studies the effect of venture capitalists on the decisions of newly-public corporations
after the IPO. I investigate venture capitalists’ role as information conduits in mergers and acquisitions,
specifically, their role while serving on the board of directors of acquiring firms, target firms, or both.
Chapter 1 finds that the information sharing between a VC and a firm’s management results in value-
enhancing acquisitions of VC-backed private targets, especially when the acquirer and target share a
venture capital board member. I also document that this holds true with public targets, which is evidence
in support of the information sharing hypothesis rather than the cheap targets hypothesis. Chapter 2
shows that VC-backed firms are significantly more likely to receive bids and get acquired following their
initial public offering. I also find that they receive higher premiums while the venture capitalist sits on
the board of directors. This seems to come from extracting the negotiation surplus, as the acquirer of VC-
backed targets experiences more pronounced negative announcement returns while the combined
announcement return is on average unaffected. I interpret this as evidence of a wealth transfer from the
acquirer to the target firm. I attribute this to the certification and negotiating abilities of the venture
capitalist serving on the target firm’s board of directors, documenting a further method venture capitalists
can add value to corporations.

iv
TABLE OF CONTENTS
LIST OF TABLES v
LIST OF FIGURES vii
ACKNOWLEDGEMENTS viii
INTRODUCTION 1
CHAPTER 1 - THE INFORMATION ROLE OF VENTURE CAPITALISTS:
HOW VENTURE CAPITALISTS AFFECT THE M&A DECISIONS OF
THEIR PREVIOUS IPOs
3
1.1 INTRODUCTION 3
1.2 BACKGROUND 6
1.3 HYPOTHESES 14
1.4 DATA AND METHODOLOGY 17
1.5 RESULTS 21
1.6 CONCLUSION 28
CHAPTER 2 - THE INFORMATION ROLE OF VENTURE CAPITALISTS
ON BOARDS OF TARGET FIRMS
36
2.1 INTRODUCTION 36
2.2 BACKGROUND 39
2.3 HYPOTHESES 45
2.4 DATA AND METHODOLOGY 47
2.5 RESULTS 50
2.6 CONCLUSION 59
REFERENCES 92

v
LIST OF TABLES
TABLE 1.1: The Effect of Venture Capital Backing on M&A Activity for Recent IPOs
30
TABLE 1.2: Logistic Regression for Likelihood That Target is VC-backed
31
TABLE 1.3: Acquirer CARs in Acquisitions of Private Targets
32
TABLE 1.4: Multivariate Analysis of Acquirer Cumulative Abnormal Announcement
Returns
33
TABLE 1.5: Announcement CARs in Acquisitions of Young VC-backed Public Targets
by Young VC-backed Public Acquirers
34
TABLE 1.6: Multivariate Analysis of Target, Acquirer, and Combined Announcement
Returns in Acquisitions of Young VC-backed Public Targets by Young VC-backed
Public Acquirers
35
TABLE 2.1: IPOs, Venture Capital Backing, and Deal Activity
60
TABLE 2.2: Venture Capital Backing and Deal Activity Through Time
62
TABLE 2.3: Venture Capital Backing and Percentage of Firm Sold in IPO
73
TABLE 2.4a: Venture Capital Backing and Likelihood of an Acquisition Attempt
74
TABLE 2.4b: Venture Capital Backing and Likelihood of Being Acquired
75
TABLE 2.4c: Venture Capital Backing and Likelihood of An Acquisition Attempt
Within 3 years of the IPO
76
TABLE 2.5: IPOs, Venture Capital, and Announcement Returns to Acquisition Targets
in IPO Sample
77
TABLE 2.6a: Acquisition Announcement Returns to Bids on Recent IPOs (VC vs. Non-
VC)
78
TABLE 2.6b: Acquisition Announcement Returns to Completed Acquisitions of Recent
IPOs (VC vs. Non-VC)
79
TABLE 2.6c: Acquisition Announcement Returns to Bids on Recent IPOs (Tech vs.
Non-Tech)
80
TABLE 2.6d: Acquisition Announcement Returns to Completed Acquisitions of Recent
IPOs (Tech vs. Non-Tech)
81

vi
TABLE 2.6e: Acquisition Announcement Returns to Completed Acquisitions of Recent
IPOs (High Tech Only)
82
TABLE 2.6f: Acquisition Announcement Returns to Completed Acquisitions of Recent
IPOs (Non-Tech Only)
83
TABLE 2.7a: VCs, Board Presence, and Announcement Returns to IPOs Receiving Bids
within 3 years of IPO
84
TABLE 2.7b: VCs, Board Presence, and Announcement Returns to IPOs Receiving Bids
within 3 years of IPO (High-Tech Only)
85
TABLE 2.7c: VCs, Board Presence, and Announcement Returns to IPOs Receiving Bids
within 3 years of IPO (Non-Tech Only)
86
TABLE 2.8: Target, Acquirer, and Combined Announcement Returns to Bids on Recent
IPOs
87
TABLE 2.9: Summary Statistics of Regression Variables, VC vs. Non-VC
88
TABLE 2.10a: Regression Analysis of Target Acquisition Announcement CARs
89
TABLE 2.10b: Regression Analysis of Bidder Acquisition Announcement CARs
90
TABLE 2.10c: Regression Analysis of Combined Acquisition Announcement CARs 91

vii
LIST OF FIGURES
FIGURE 2.1: IPOs, Venture Capital Backing, and Acquisition Announcements in Years
Following IPO
64
FIGURE 2.2: Cumulative Total Acquisition Announcements in Years Following IPO
65
FIGURE 2.3: IPOs, Venture Capital Backing, and Acquisitions in Years Following IPO
66
FIGURE 2.4: Cumulative Total Acquisitions in Years Following IPO
67
FIGURE 2.5: Acquisition Announcements on IPO Sample Chronologically
68
FIGURE 2.6: Cumulative Total Bids in Years Following IPO, Technology Firms
69
FIGURE 2.7: Cumulative Total Bids in Years Following IPO, Non-Technology Firms
70
FIGURE 2.8: Cumulative Total Completed Acquisitions in Years Following IPO,
Technology Firms
71
FIGURE 2.9: Cumulative Total Completed Acquisitions in Years Following IPO, Non-
Technology Firms
72

viii
ACKNOWLEDGEMENTS
I’ll start by thanking my incredibly patient advisors, Chris Muscarella and Laura Field,
and committee members, David Haushalter and Ed Coulson. I’d like to acknowledge the Penn
State Smeal College of Business for financial support. I would also like to thank Vladimir
Atanasov, Jean Helwege, Michelle Lowry, Tom Miller, Brad Goldie, and Marco Rossi, as well
as seminar participants at the University of South Carolina, University of Denver, East Carolina
University, the College of William & Mary, and the 2008 FMA meetings for insightful
comments. Special thanks to Spencer Kushner, whose interest in my research at times exceeded
my own, for his research assistance down the stretch.
Whatever it is I’ve done here, I couldn’t have done it without the great group of friends
and colleagues I forged in Happy Valley. From The Threadbare Orchestra to G. Rickey & Co.,
and everything in between, there was nary a dull moment outside of the office. Thanks for
keeping it interesting.
Last but not but least, thanks to my family, for helping me become who I am today.

1
INTRODUCTION
This dissertation studies the effect of venture capitalists on the decisions of newly-public
corporations after the IPO. I investigate venture capitalists’ role as information conduits in
mergers and acquisitions, specifically their role while serving on the board of directors of
acquiring firms, target firms, or both. Chapter 1 studies tightly networked transactions in which
a venture capitalist serves on the board of directors of a recently public firm that acquires a
private target out of the same VC’s portfolio. Chapter 2 examines VC’s effect on the likelihood
of a takeover attempt, the likelihood of takeover completion, and the target, acquirer, and
combined announcement returns to bids (acquisition announcements) on recently public firms.
Given the level of involvement between a venture capitalist and a portfolio firm’s
management, and a VC’s propensity to facilitate collaborations within its network, it is likely
that a VC continues to affect a firm beyond the initial public offering. This could manifest itself
in many ways, including the M&A decisions of management, with a VC facilitating and
encouraging mergers and acquisitions within its network. Chapter 1 seeks determine what role
venture capital firms play in the acquisition decisions of their previous IPOs, and what effect this
has on acquisition announcement returns.
Chapter 1 explores the announcement returns to publicly traded acquirers of venture
capital backed private targets. I find that tightly networked transactions in which a venture
capitalist concurrently sits on the board of both the acquirer and target result in abnormally high
announcement returns. I interpret my findings as evidence that venture capitalists function as
information conduits to alleviate asymmetric information in acquisitions, rather than acting in
their own self-interest at the expense of acquiring firm shareholders. Chapter 1 documents a
further mechanism through which venture capitalists can add value to corporations.

2
It has been well established that venture capitalists are heavily involved with the private firms
in which they invest (Gorman and Sahlman (1989), Gompers (1995), Lerner (1995), Baker and
Gompers (2003)). Less well studied is the role of a venture capitalist after they’ve taken a firm
public. We know that venture capitalists tend to stay on the boards of their companies well after an
IPO (Barry et al. (1990), Gompers (1996)), but we know little about how this affects firm decisions
and firm performance.
Chapter 2 shows that VC-backed firms are significantly more likely to receive bids and
get acquired following their initial public offering. I also find that they receive higher premiums
while the venture capitalist is still on the board of directors. This seems to come from extracting
the negotiation surplus, as the acquirer of VC-backed targets experiences more pronounced
negative announcement returns while the combined announcement return is on average
unaffected. I interpret this as evidence of a wealth transfer from the acquirer to the target firm. I
attribute this to the certification and negotiating abilities of the venture capitalist serving on the
target firm’s board of directors, documenting a further method venture capitalists can add value
to corporations.
I find that venture capitalists continue to affect firm M&A decisions well after the initial
public offering, and that this results in higher returns to firm shareholders. Chapter 1 shows that
the information sharing between a VC and a firm’s management results in value-enhancing
acquisitions of VC-backed private targets. Chapter 2 finds strong evidence that VC involvement
is associated with an increased likelihood of being acquired, and that VC board presence on the
target firm increases the premium paid in acquisition.

3
CHAPTER 1
The Information Role of Venture Capitalists: How Venture Capitalists Affect the M&A
Decisions of Their Previous IPOs
1.1 INTRODUCTION
ON OCTOBER 6, 2006, GOOGLE INC. announced that it would acquire YouTube.com in a
$1.65 billion stock-for-stock transaction. Less than a year earlier, YouTube LLC received its
first and only venture capital round when Sequoia Capital invested $11.5 million in November
2005.1 When the “GooTube” acquisition was completed in November 2006, Sequoia Capital
received 1.07 million shares of Google stock, worth approximately $504 million (a return of
nearly 4300% in a single year). Interestingly, and perhaps not coincidentally, Sequoia Capital
was also a major investor in Google during the search engine’s first and only venture round in
1999. In fact, Sequoia partner Michael Moritz served on the Google board of directors from
May 1999 until his resignation in May 2007.
I suggest that tightly networked transactions like this one are not coincidental, but that the
VC continues to impact the decisions of the newly public firm. Given the level of involvement
between a venture capitalist and a portfolio firm’s management, and a VC’s propensity to
facilitate collaborations within its network, it is likely that a VC continues to affect a firm
beyond a successful public offering2. This could manifest itself in many ways, including the
M&A decisions of management, with a VC facilitating and encouraging mergers and
acquisitions within its network. Specifically, the VC could promote the sale of private targets
from its own portfolio to public acquirers that the VC previously took public. This paper
1 According to Securities Data Company’s VentureXpert database.
2 See Section II of this paper (Background) for an in depth review of the applicable literature.

4
examines the role that venture capital firms play in the acquisition decisions of their previous
IPOs.
I show that public companies that were VC-backed at the IPO [VC-acquirers] are more
likely to acquire VC-backed private targets [VC-targets] in the five years following their IPO. In
a logistic regression for 2,969 acquisitions by firms in my IPO sample, a dummy variable for a
VC-acquirer is positive and significant in determining the likelihood that the target is VC-
backed. This supports the hypothesis that VC-backing at the IPO affects a firm’s M&A activity
following the IPO.
Furthermore, I examine the effect of a venture capitalist’s presence on the announcement
returns of these tightly networked acquisitions. It is possible that the venture capitalist’s role as
an information conduit leads to the identification of profitable acquisitions within its network, ala
Aoki (2000) and Lindsey (2008). In this case, VCs could share valuable information with the
acquiring firm’s management, improving the acquirer’s bidding ability, leading to value-
enhancing acquisitions. On the other hand, it could be that the VC’s propensity to facilitate deals
within its network leads to managerial hubris in the acquiring firm, ala Roll (1986). If acquiring
firm management trusts the VC, management may place too much weight in the information that
is being shared, leading to hubris and overbidding. This would result in value-destructive
acquisitions.
Following a sample of firms that went public between 1996 and 2005, I examine their
acquisitions of private targets within 5 years of the acquirer’s IPO. I identify 188 acquisitions of
VC-backed private targets, 114 involved VCs on both sides, and 34 involving the same VC. I
find mild support for the information sharing hypothesis and strong support against the
managerial hubris hypothesis. Acquisitions in which the same VC backed the acquirer at the

5
IPO and was invested in the private target at the acquisition (SAME_VC transactions)
experience higher cumulative abnormal returns around the acquisition announcement date than
do typical acquisitions of VC-backed private targets by public acquirers. This supports the
information sharing hypothesis.
Masulis and Nahata (2011) also documents the abnormal announcement returns to similar
transactions in the self-dealing portion of their paper, arguing that the positive acquirer
announcement returns are caused by a wealth transfer from the target to the acquirer. They argue
that venture capitalists are selling the target firm “cheap” to the acquirer, resulting in positive
abnormal returns to the acquirer around the acquisition. That is, the acquirer is getting a good
deal on the target due to the self-dealing of the venture capitalist. As the target is a private firm,
we do not observe a market price for the company, so cannot distinguish between my
information sharing hypothesis and their cheap target hypothesis.
However, I distinguish between the information sharing hypothesis and the cheap target
hypothesis by finding acquisitions of VC-backed public targets by VC-backed public acquirers
that had concurrent, overlapping venture capital representation on their respective boards of
directors. While they are few in number, they are quite telling. The highly positive
announcement returns to these transactions disprove the cheap target, or wealth transfer,
hypothesis, and lend strong evidence to the information sharing hypothesis.
I conclude that venture capitalists continue to affect firm M&A decisions well after the
initial public offering, but that this is generally of benefit to acquiring firm shareholders. The
information sharing that occurs between a VC and a firm’s management appears to result in
value-enhancing acquisitions of VC-backed private targets, despite the potential for managerial

6
hubris or self-dealing. This paper documents a further mechanism through which venture
capitalists can add value to corporations.
1.2 BACKGROUND
It is well documented that venture capitalists play a valuable information gathering and
monitoring role for start-up firms, reducing informational asymmetry and agency problems
(Gompers (1995), Lerner (1995), Baker and Gompers (2003)). But in addition to their role as
monitors, existing literature has shown that venture capitalists provide additional value-added
services to the entrepreneurial firm.
Gorman and Sahlman (1989) show that the venture capitalist serves an important role in
fund raising, strategic analysis, management recruitment, and operational planning.
Additionally, they find that the average venture capitalist visits a portfolio company nineteen
times per year, spends 80 hours per year onsite and 30 hours per year on the phone with the
CEO. Sahlman (1990) finds that venture capitalists, while generally not involved in day-to-day
operations, regularly serve on the board of directors. Barry, Muscarella, Peavy, and Vetsuypens
(1990) show that venture capitalists typically control about one-third of the board seats.
Furthermore, the presence of a venture capitalist at an IPO leads to the involvement of
higher quality underwriters and auditors (Barry et al. (1990), Megginson and Weiss (1991)).
Hellman and Puri (2002) examine the differences between venture-backed and non venture-
backed companies and show that the presence of a venture capitalist in a start-up firm leads to a
more professional internal organization (advanced human resource policies, stock option plans,
the hiring of a VP of marketing, etc.). They also find that venture capitalists can play both

7
supportive and controlling roles in the start-up firm, depending on the needs of the particular
firm.
Serving as much more than a monitoring financial intermediary, the venture capitalist
takes on an integral role in the firm during start-up, working to maximize the odds that their
equity investment will lead to a successful exit and superior return. Barry et al. (1990) and
Gompers (1996) show that venture involvement continues long after a firm goes public, where
venture capitalists continue to hold large equity stakes and serve on the board.
In fact, many venture capital firms pride themselves on value-added keiretsu-style
behavior, facilitating strategic alliances among portfolio firms and fostering interaction within
their networks. Lindsey (2008) finds that strategic alliances are more frequent among firms
backed by the same venture capitalist. She also finds that this effect is concentrated in alliances
where high informational asymmetries exist and venture capitalists can utilize their informational
advantage. Venture-backed firms often operate in highly competitive and information-sensitive
industries, where the costs of sharing proprietary information are high. Lindsey (2008) suggests
that venture capitalists can use their information to identify profitable collaborations between
firms, overcoming this hurdle. Furthermore, she shows that these alliances create value for
portfolio firms by increasing the probability of a successful exit (IPO or acquisition).
It is imperative that VCs be able to exit their investments in order to provide liquidity and
returns to their limited partners. This is done either through an initial public offering, an
acquisition, or liquidation. Most prior finance literature focuses on the IPO exit route for venture
capitalists, as it is the most observable. According to Gompers and Lerner (2001), the proportion
of VC-backed IPOs increased from 10% of all IPOs in the 1980s, to 31% in the 1990s, to 56% in
1999, demonstrating the importance of VC-backed firms in the IPO market. Empirical work has

8
shown that VC-backed IPOs experience less underpricing (Barry et al. (1990), Megginson and
Weiss (1991)) and have better long-run performance than non-backed IPOs (Brav and Gompers
(1997)). The authors argue that this is due to the certification role that the venture capitalist
plays in the offering process.
In a Gompers (1995) sample of 794 VC-backed companies, 127 (22.5%) went public,
134 (23.8%) were acquired, 88 (15.6%) were liquidated, and 215 (38.1%) were still privately
held at the end of the sample. In the same sample, Gompers (1995) finds that IPO exits offered
an average return of 59.5% per year (7.1x invested capital in 4.2 years), M&A exits averaged
15.4% per year (1.7x invested capital in 3.7 years), and liquidations lost 80% of their value in 4.1
years. Gompers’ findings demonstrate that while IPOs are a primary source of large returns for
venture capitalists, acquisitions are also an important form of exit, especially in a dry IPO
market. Therefore, venture capitalists may be incentivized to leverage every available tool to
generate exits, including their relationship with the management of a potential acquirer that the
VC previously took public.
“No conflict, no interest” is an old venture capital saying, and this is not the first paper to
address potential conflicts of interest in the venture capital realm. Gompers and Lerner (1999)
address a conflict of interest inherent when an investment bank underwrites an IPO in which its
holds equity through a venture capital subsidiary. The authors find that investors require greater
underpricing for offerings in which the lead underwriter is also a venture investor in the firm.
The authors interpret this as proof of the rational discounting hypothesis, or that investors are
smart enough to anticipate conflicts of interest and compound them into the price at the IPO.
Given the level of involvement between a venture capitalist and a firm’s management,
and a VC’s propensity to facilitate alliances within its network, it is likely that a VC continues to

9
affect a firm beyond the initial public offering. This could manifest itself in many ways,
including the M&A decisions of management, with a VC facilitating and encouraging mergers
and acquisitions within its network. Specifically, the VC could promote the sale of private
targets from its own portfolio to public acquirers that the VC previously took public. The nature
of the VC’s effect on M&A decisions of public firms is an empirical question. This paper seeks
to determine how the VC’s role affects acquiring firm value as measured by acquirer
announcement returns.
The determinants of acquisition announcement returns to publicly-held bidders have been
heavily studied in the financial literature. Earlier event studies show that bidders have no or
slightly negative announcement returns (Jensen and Ruback (1983), Andrade, Mitchell, and
Stafford (2001)). This is generally attributed to managerial hubris, in which acquiring managers
overestimate their ability to run the target (Roll (1986)), or managerial empire building behavior,
in which managers’ personal objectives are inconsistent with maximizing shareholder value
(Jensen (1986), Morck, Schleifer, and Vishny (1990), Harford (1999)). Furthermore, earlier
studies documented that cash deals resulted in better acquirer returns than stock deals (Jensen
and Ruback (1983), Andrade, Mitchell, and Stafford (2001)). This was attributed to the concept
of stock acquisitions as a signal of overvalued acquirer equity (Myer and Majluf (1984), Travlos
(1987)). But more recently, the financial literature has demonstrated the determinants of acquirer
CARs to be much more nuanced.
Chang (1998) and Fuller, Netter and Stegemoller (2002) show that target ownership is an
important factor in predicting acquirer returns, where acquirers of public targets lose 1% on
average but acquirers of private targets gain about 1.5%. Additionally, the method of payment
effect was also shown to depend on target ownership structure. Acquisitions of private targets

10
fair better when financed with equity, which runs counter to public target acquisitions. This is
attributed to the contingency pricing effect, in which target shareholders partially bear the cost of
overpayment when the acquirer pays with stock (Hansen (1987)). Interestingly, Moeller,
Schlingemann, and Stulz (2007) find that the method of payment is irrelevant after controlling
for acquiring firm idiosyncratic volatility. Using the acquirer’s excess stock return volatility as a
proxy for information asymmetry, the authors show that acquirer CARs are negatively related to
idiosyncratic volatility.
Asquith et al. (1983) show that relative deal size is also a determinant of acquirer
announcement returns, where returns are increasing in the ratio of target market capitalization to
bidder market capitalization. Furthermore, Moeller, Schlingemann, and Stulz (2004) find that
acquirer size (as separate from relative size) is an additional determinant of acquirer
announcement returns for both public and private targets, with small acquirers fairing better than
large acquirers on average. The effect of Tobin’s q and the highly correlated market-to-book
ratio of the acquirer is unclear. Lang et al. (1991) and Servaes (1991) find evidence that high-q
bidders have higher announcement returns, but Dong et al. (2006) find the opposite and Moeller
et al. (2004) find no relation at all. This is likely due to sample period differences. It is
generally acknowledged that pre-1990 announcement returns were increasing in acquirer q, but
reversed in the 1990s.
Interestingly, Moeller, Schlingemann, and Stulz (2005) point out that average
announcement returns may be a misleading measure of returns to acquiring firm shareholders.
They find that from 1991-2001, while 3-day announcement cumulative abnormal returns [CARs]
averaged 1.2%, on the whole acquiring firm shareholders lost $216 billion. The authors compare
this to the 1980s, in which acquiring firms’ shareholders averaged 0.6% in CARs but lost only $4

11
billion in acquiring firm value. Most of the losses in their sample came between 1998 and 2001,
where CARs averaged 0.7% but lost $240 billion in acquiring firm value. Specifically, most of
the dollar losses came in 87 large loss deals (defined as an acquiring firm loss of at least $1
billion). The authors find that the acquirer’s in the large loss deals had high Tobin’s q and low
book-to-market ratios, which is consistent with the Jensen (2005) hypothesis that high firm
valuations give managers leeway to make poor acquisitions.
However, only recently have researchers begun to explore the effect of venture capital
involvement on acquisition announcement returns. A related working paper by Gompers and
Xuan (2009) examines the characteristics of public acquirers of private venture-backed
companies, finding that these acquirers are larger, have higher Tobin’s Q, and operate in a
related industry. Their study shows that the market reacts less positively to the announcement of
the acquisition of a venture-backed firm, but that longer-run returns and operating performance
were higher following these acquisitions. The authors attribute the smaller announcement
returns to the view that venture capitalists are strong negotiators or that an adverse selection
problem exists. But nowhere in the paper do they examine whether the public acquirer had been
venture-backed before going public.
A related paper by Masulis and Nahata (2011) studies the acquisition announcement
returns for public acquirers of private targets. The authors find that acquirers of VC-backed
targets experience larger announcement CARs than acquirers of non-backed targets. They
suggest that this is the result of VCs selling their firms cheap due to conflicts of interest between
VCs and other target shareholders (i.e. entrepreneurs, angel investors). However, the paper only
finds support for the self-dealing hypothesis, in which a VC has a concurrent financial stake in
both the acquirer and the target.

12
While at first this paper may appear similar to Masulis and Nahata (2011), my paper has
significant differences and additions. I look at acquisitions by recent IPOs, which allows me to
comment on the effect of VC-backing on post-IPO acquisition behavior. Masulis and Nahata
(2011) look at acquisitions of VC-backed targets by all acquirers, and make no mention of
acquirer VC-backing (with the exception of the self-dealing observations). Masulis and Nahata
(2011) impose a strong filter on their sample of acquisitions, requiring the target size to be at
least 10% of the acquirer size. They do this so that they can get financial data on the target.
Acquirers are not required to disclose target financials unless the target is 10% of the acquirer.
To get an idea of the sample selection, Andrade, Mitchell, and Stafford (2001) find that the
median target size is 11.7% of the acquirer from 1973-1998 and 11.2% from 1990-1998 (a
similar time frame to Masulis and Nahata (2011)). For comparison, the Masulis and Nahata
(2011) sample mean target size is 45% and median 24%. This censors the sample to deals with
high relative target size, which Asquith et al. (1983) shows have higher announcement returns. It
may also censor the sample to high profile deals where witnessing self-dealing is the least likely.
In the Masulis and Nahata (2011) self-dealing section, the authors identify 25
acquisitions in which a VC has a concurrent financial stake in both the acquirer and the target.
This is a dummy variable, so the authors cannot comment on how much of the acquirer or target
the VC owns (in fact, this information is difficult to ascertain). The authors find that these deals
have higher CARs than acquisitions where the VC doesn’t have a stake in the acquirer, and
conclude that it is because the VC (as target representative) isn’t incentivized to negotiate as hard
with the acquirer when holding a concurrent financial stake. However, Masulis and Nahata
(2011) is unable to show if the VC is the lead investor in the target, which could limit the VC’s
effect on negotiations. And again, in such large deals, it is unlikely that the VC would have as

13
much influence over the target’s decisions, making self-dealing less likely. My paper examines
SAME_VC transactions, in which the VC was invested (concurrent or not) in the acquirer and
the target, over a different time period, and offers an alternative explanation (information
sharing) for abnormal announcement returns.
Furthermore, I distinguish between the information sharing hypothesis and the cheap
target hypothesis by finding acquisitions of VC-backed public targets by VC-backed public
acquirers that had concurrent, overlapping venture capital representation on their respective
boards of directors. While they are few in number, they are quite telling. The highly positive
target, acquirer, and combined announcement returns to these transactions disprove the cheap
target, or wealth transfer, hypothesis, and lend strong evidence to the information sharing
hypothesis.
Both Gompers and Xuan (2009) and Masulis and Nahata (2011) explore target venture-
backing as a determinant of acquirer announcement returns. This paper documents that the
effect of this determinant depends on whether the acquirer was also VC-backed at the IPO. I
follow Aoki (2000) and Lindsey (2008) in examining whether the venture capitalist, acting as an
information conduit, can facilitate value-added activities within its network. Specifically, the
venture capitalist may help an acquirer overcome informational asymmetries and alleviate
managerial hubris in bidding on private venture-backed targets.
The lasting effect that venture capitalists have on their previous IPOs requires further
investigation. This paper explores whether public acquirers that were VC-backed at the IPO are
more likely to acquire VC-backed private targets, and how this bias affects acquiring firm
announcement returns. I extend both the M&A literature on acquisitions of private targets by

14
public acquirers and the venture capital literature on the effect of venture capital backing on
post-IPO behavior.
1.3 HYPOTHESES
Do VC-backed IPOs Differ In Their M&A Behavior?
Given the level of involvement between a venture capitalist and a portfolio firm’s
management, and a VC’s propensity to facilitate alliances within its network (Lindsey (2008)), it
is likely that a VC continues to affect a firm beyond the initial public offering. This could
manifest itself in many ways, including the M&A decisions of management, with a VC
facilitating and encouraging mergers and acquisitions within its network. Specifically, the VC
could promote the sale of private targets from its own portfolio to public acquirers that the VC
previously took public. In either case, I would expect to see that acquirers that were VC-backed
at the IPO [VC-acquirers] are more likely to acquire VC-backed private targets [VC-targets].
H1: Acquirers that were VC-backed at the IPO are more likely to acquire VC-
backed private targets, even after accounting for industry and time.
Information Sharing or Managerial Hubris?
Information Sharing: It is possible that the venture capitalist’s informational advantage
leads to the identification of profitable acquisitions within its network, ala Aoki (2000) and
Lindsey (2008). In this case, VCs could share asymmetric information with the acquiring firm’s
management, improving the acquirer’s bidding ability, leading to value-enhancing acquisitions.
Of course, we cannot observe what a target is truly worth. Examining acquirer acquisition

15
announcement returns will reveal whether the market interprets these tightly networked
transactions as information sharing or managerial hubris.
H2: The market believes the venture capitalist’s involvement reduces asymmetric
information and improves the acquirer’s bidding ability. The acquirer would
experience above average abnormal returns over the announcement window.
Managerial Hubris: It could be that the VC’s propensity to facilitate deals within its
network leads to managerial hubris in the acquiring firm, ala Roll (1986). If acquiring firm
management trusts the VC, management may place too much weight in the information that is
being shared, leading to hubris and overbidding. (It is also possible that the VC pressures
acquiring firms to make acquisitions from the VCs network under threat of retribution, but this is
not necessary to explain overbidding by the acquirer.) In either case, we’d expect to see
overbidding by the acquirer which would lead to value-destructive acquisitions.
H2A: The market believes the venture capitalist’s involvement leads to
overbidding for the target. The acquirer would experience below average
abnormal returns over the announcement window.
Differentiating Between Information Sharing and Cheap Target Hypotheses
Of course, as Masulis and Nahata (2011) suggest, above average abnormal announcement
returns could also be interpreted as a result of the venture capitalist selling its targets cheap due
to conflicts of interest with target shareholders. In their self-dealing hypothesis, the venture
capitalist is not incentivized to achieve a high price for its target if it also holds a concurrent
financial stake in the acquiring firm since it would also gain from any positive announcement
16
return to the acquirer. Unfortunately, my paper faces the same data limitations as Masulis and
Nahata (2011), making it difficult to differentiate between these two hypotheses with the private
target sample.
If accurate information on venture capitalist percentage holdings in the acquirer and
target were available, then it would be straight forward to look at the relationship between VC
holdings in the acquirer and acquisition announcement returns. If the cheap targets hypothesis is
correct, then abnormal CARs should be increasing in the VC’s stake in the acquirer. If
information sharing is correct, the VC’s stake shouldn’t matter in determining announcement
returns. It would also be possible to compare concurrent financial stakes (which Masulis and
Nahata (2011) examine) against historical financial acquirer stakes (the VC held a stake at the
IPO, but has since exited the position). If the information sharing hypothesis is correct, these
shouldn’t differ. If the cheap target hypothesis is correct, concurrent-stake acquisitions should
have higher CARs. But for a variety of reasons, including database limitations, reporting
requirements, and the opaque nature of venture capital share distributions, accurate venture
capital holdings could not be ascertained for private targets.
However, I am able distinguish between the information sharing hypothesis and the
cheap target hypothesis by finding acquisitions of VC-backed public targets by VC-backed
public acquirers that had concurrent, overlapping venture capital representation on their
respective boards of directors. While they are few in number, they are quite telling. The highly
positive target, acquirier, and combined announcement returns to these transactions disprove the
cheap target, or wealth transfer, hypothesis, and lend strong evidence to the information sharing
hypothesis.

17
Predictions
Whatever the effect of the venture capitalist on the M&A behavior of their previous
IPOs, I expect that the effect will:
1) Decrease if management changes between IPO and acquisition. During the startup,
the venture capitalist develops a working relationship with the firm’s management. If
management changes, I expect the VC’s influence on management to diminish.
2) Increase if the VC sits on the board at the IPO and the acquisition. I expect that the
VC’s relationship with management is more pronounced by a presence on the board.
3) Decrease with time from IPO. The further the VC is from the close involvement with
management during the startup and IPO, the VC’s influence on management should
decrease.
1.4 DATA AND METHODOLOGY
The initial sample is compiled from SDC’s Global New Issues, Mergers & Acquisitions,
and VentureXpert databases. The IPO sample consists of firms that went public between
January 1, 1996 and December 31, 2005 on the American, Nasdaq, and New York stock
exchanges. It must be the firm’s original public offering and the offering price must be at least
$5. I exclude utilities, financials, unit offerings, rights offerings, REITs, and ADRs. This results
in sample of 2,491 IPOs, of which 1,153 (46.3%) are venture-backed.
The M&A sample consists of completed acquisitions announced between January 1, 1996
and Decemeber 31, 2006 of private targets by public acquirers whose stock is listed on the
American, Nasdaq, and New York stock exchanges. Acquirers and targets must be U.S. based,
the acquisition must be for 100% of the target, and no toe-hold positions exist before the

18
announcement. I exclude all financial acquirers and targets. I then cross-reference the M&A
sample with the IPO sample to determine which acquirers were in the IPO list and, of those,
which were venture-backed. Acquirer stock returns must be available in the CRSP database.
This results in a sample of 2,781 acquisitions of non-VC-backed targets and 188 acquisitions of
VC-backed targets that occurred within 5 years of a firm’s IPO.
I compile a list of venture-backed companies from VentureXpert, and cross-reference that
list with the M&A group to find a sample of venture-backed targets. The venture-backed targets
sample was created by cross-referencing the M&A sample on CUSIP and company name for all
firms in the VentureXpert database of 19,317 portfolio companies. This results in a sample of
188 venture-backed targets. It is clear that these 188 acquisitions are not a comprehensive
sample, but the current depth of the database and my methodology limit my ability to collect a
larger sample. However, there is little reason to think that this sample is biased or
unrepresentative of the population.
From VentureXpert, I gather the names of venture capital firms invested in both the VC-
backed acquirers and VC-backed targets, and hand-check for the presence of overlapping VCs,
which I call SAME_VC transactions. I construct a dummy variable for SAME_VC that equals 1
if there is at least one overlapping VC and 0 if it is a DIFFERENT_VC transaction. The final
sample consists of 34 SAME_VC transactions, 114 DIFFERENT_VC, and 40 acquisitions of
VC-backed targets by acquirers that were not VC-backed at the IPO.
For the 34 SAME_VC acquisitions, I hand-collect from SEC filings whether the CEO
was the same at both the IPO and acquisition. SAME_CEO equals 1 if so and 0 if the CEO
changed. I also check if the VC remained on the board of directors from the IPO through the

19
acquisition. VC_BOARD equals 1 if the VC was on the board at the IPO and the acquisition,
and 0 if not.
From CRSP, I gather the announcement returns for all 2,969 acquisitions. Using a 3-day
window [-1, +1] relative to the announcement date, I use market-adjusted returns using the CRSP
equal-weighted index to define cumulative abnormal returns. Using a market-model or the
CRSP value-weighted index to calculate abnormal returns did not appreciably alter my results.
Later, I Winsorize the CAR data at the 1% and 99% tails to account for the possibility of outliers
biasing the small sample.
High technology companies are defined as those operating in SIC codes 283 (biological
products, genetics, and pharmaceuticals), 357 (computers), 365-369 (electronic equipment), 481
(high-tech communications), 482-489 (communications services), 737 (software services).
As control variables, I gather acquirer size, market-to-book ratio, and idiosyncratic excess
stock return volatility. I define size as shares outstanding multiplied by acquirer stock price the
two days before the acquisition announcement. I define market-to-book ratio as the market value
of equity divided by the book value of equity, where book equity is equal to Total Assets – Total
Liabilities – Preferred Stock + Deferred Taxes + Convertible Debt (Kayhan and Titman (2007)).
I measure idiosyncratic volatility as the standard deviation of the acquirer’s daily stock return
minus the equal weighted market return from 205 days to 6 days prior to the acquisition
announcement (Moeller et al. (2007)).
To analyze acquisitions of public targets, I construct a new sample of recently public
firms that get acquired. This IPO sample consists of initial public offerings on the NYSE,
AMEX, and Nasdaq between January 1, 1985 and December 31, 2009. The firm had to be based
in the United States. I exclude utilities, unit offerings, rights offerings, REITs, and ADRs. I

20
remove IPO firms that had an offer price of less than $5, raised less than $5 million, or had an
unidentifiable PERMNO. The M&A sample consists of transactions announced between
January 1, 1985 and May 17, 2010, where both the acquirer and target must be based in the
United States and publicly traded. The deals must have been completed or withdrawn. I
eliminate financials and utilities. A maximum of 5% toehold could have existed prior to
announcement, and the acquirer must seek to own 100% of the target after the acquisition. I
eliminate observations that had material alternative news around the announcement period.
Merging the samples I find 1,404 acquisition announcements of firms in the IPO sample, and
1,216 completed acquisitions of those firms. I filter for VC-backed acquirers within 5 years of
their IPO making acquisitions of VC-backed targets within 3 years of their IPO, where
overlapping venture capitalists would be most likely, which results in 90 acquisition attempts.
For both bidders and targets, I use a market-adjusted 5-day window [-2,+2] to measure
cumulative abnormal returns [CARs], where the announcement date is day 0. I subtract off the
return to the CRSP value-weighted index over the same period to define cumulative abnormal
returns. All returns data is obtained from CRSP.
∑ ( )
where

21
I also look at market-adjusted 13-day window [-10,+2] to capture any short-term run-up
to the acquisition announcement. For robustness, I run the data with both the CRSP equal- and
value-weighted market indices.
As in Bradley et al (1988) and Mulherin and Boone (2000), combined return (or synergy
return) is defined as the value-weighted CAR of the transaction, where bidder and target values
are their respective market caps 3 trading days prior to the announcement date.
( ) ( ) ( ) ( )
( )
1.5 RESULTS
The Effect of Venture Capital Backing on M&A Activity
Table 1 demonstrates the strong inclination of VC-backed IPOs to acquire VC-backed
private targets in the five years following the IPO. Of the 188 VC-targets in my sample, 148
were acquired by VC-acquirers (78.7%). Of the 2,969 acquisitions in my full sample, VC-
acquirers made 1256 (42.3%) of all acquisitions, of which VC-targets represent 148 (11.8%) of
the acquisitions. This is interesting when compared to the activity of non-VC-backed acquirers,
where VC-targets make up only 2.3% of their acquisitions. A binomial test for the difference in
proportions was strongly significant.
Furthermore, of the 188 observed VC-backed private targets, 34 (18.1%) came from
acquirers that were backed by the same venture capital firm at the IPO. 114 (60.6%) came from
acquirers that were backed by different VC firms, and 40 (21.3%) came from acquirers that were

22
never VC-backed. This indicates that a VC-backed private target is nearly as likely to be
acquired by a firm that was backed by the same VC than any non-backed firm in the IPO sample.
This could of course be due to the VC’s tendency to invest in firms operating in high-tech
SIC codes. High-tech companies should be more likely to acquire high-tech targets, which could
present an omitted variable bias if I don’t control for industry effects. To account for this, I run a
logistic regression which includes control variables to determine the likelihood of acquiring a
VC-target. Table 2 shows a logistic regression where the dependent variable is a dummy that
equals 1 if the target is VC-backed and 0 if not. In addition to the dummy for VC-acquirer, I
include a dummy if the acquirer operates in a high-tech industry and a time variable to capture
any time trends or bubble effects. The VC-acquirer dummy is positive and significant in
determining the likelihood of acquiring a VC-backed private target.
It is clear from this data that VC-backed IPOs disproportionately acquire VC-backed
targets, even after accounting for industry. This is strong support for Hypothesis 1, that VC-
backed acquirers are more likely to acquire VC-backed private targets in the years following
their IPO.
Acquisition Announcement Returns
Table 3 Panel A shows acquirers’ 3-day cumulative abnormal returns for acquisition
announcements. My full sample of 2,969 acquisitions by public acquirers of private targets
appears similar to those in previous studies (Chang (1998), Fuller, Netter, and Stegemoller
(2002)), with a mean acquirer announcement return of 1.3%. But contrary to both Masulis and
Nahata (2011) and Gompers and Xuan (2009), I find that acquirer announcement CARs don’t

23
significantly differ for VC-backed targets than they do for non-VC-backed private targets (2.3%
vs. 1.3% respectively).
However, within the sample of VC-backed targets, SAME_VC transactions experience
larger returns than other acquisitions of VC-backed targets. SAME_VC acquisitions experience
mean returns of 4.7%, compared to 1.6% for DIFFERENT_VC transactions and approximately
0% for acquisitions of VC-targets by non-VC-acquirers. However, mean difference tests fail to
attain acceptable significance, which could be due to the presence of outliers in the small sample.
These results still show mild support for the information sharing hypothesis, and strong support
against the managerial hubris hypothesis.
With a sample of only 34 SAME_VC acquisitions, the results could be strongly affected
by statistical outliers. Panel B reports the results after Winsorizing the CARs data to account for
outliers. Winsorizing at the 1% and 99% tails increases significance in means and mean
differences without drastically altering the absolute values. Here, SAME_VC transactions
significantly outperform acquisitions of VC-targets by non-VC-acquirers (5.6% difference). The
difference between SAME_VC and DIFFERENT_VC acquisitions was 3.2%, but only
significant at the 20% level. This is further support for the information sharing hypothesis, and
strong support against the managerial hubris hypothesis. The information sharing that occurs
between a VC and a firm’s management appears to result in value-enhancing acquisitions of VC-
backed private targets, despite potential managerial hubris.
Segmenting the 34 SAME_VC acquisitions on whether or not management has changed
yields interesting results. For 26 of the 34 acquisitions, the CEO remained the same from the
IPO to the acquisition. Acquisitions where the CEO was different experience average
announcement CARs 4.1% larger than those acquisitions in which the CEO remained the same.

24
This runs counter to my prediction that the effect of the VC would decrease with management
turnover. However, a mean difference test was insignificant. The fact that 26 of the 34
acquisitions involved the same CEO is support for the lasting effect of venture backing on post-
IPO acquisition activity.
Segmenting the 34 SAME_VC acquisitions on whether or not the venture capitalist
served on the board at both the IPO and the acquisition also proves interesting. For 18 of the 34
acquisitions, the venture capitalist remained on the board from the IPO through the acquisition.
These acquisitions had a mean announcement CAR of nearly 7%, significantly different from
zero at the 5% level, but not significantly different from acquisitions in which the VC left the
board before the acquisition. Though lacking significance, this supports my prediction that the
effect of the VC will increase with board presence.
Multivariate Analysis of Acquirer Announcement CARs
Table 4 presents the results of ordinary least squares regressions. The dependent variable
is 3-day [-1, +1] acquirer announcement CARs, measured using market-adjusted returns on the
CRSP equal weighted index (Winsorized at the 1% and 99% tails). The results, though generally
insignificant, still tell a story. If the managerial hubris hypothesis were correct, the SAME_VC
variable would be a negative and significant determinant of acquirer announcement CARs. The
fact that it is positive and fails to significantly load in the regression indicates that I can reject the
managerial hubris hypothesis. This is further support that the market believes venture capitalists
don’t influence their previous successes to make value-destructive acquisitions.
Regression 1 shows that when acquiring a VC-backed private target, public acquirers fair
better if they were VC-backed at the IPO. Regression 2 shows that SAME_VC transactions are

25
likely to fair better, though the coefficient wasn’t strongly significant. In regression 3, I include
variables for management turnover and VC board presence at the acquisition. Interestingly,
these coefficients run against each other. VC board presence at the IPO and the acquisition has a
significantly positive effect on acquisition announcement CARs, while a static CEO has an
insignificantly negative effect. On one hand, this supports my prediction that VC board presence
would facilitate information sharing. On the other, it runs counter to my prediction that a change
in management would hinder information sharing.
Since VCs generally remain on the board for a few years after an IPO before stepping
down, it is possible that the VC board presence is picking up some characteristic of more recent
IPOs. Therefore, all regressions include a control variable that measures the number of years
from the IPO to the acquisition announcement date. This control variable is insignificant, so
from the regressions it is clear that information sharing is strongly facilitated by the VC’s
presence on the board, but not significantly affected by a change in management or the passage
of time. In addition, I include five other control variables in all regressions to account for other
possible determinants of announcement returns: 1) log of acquirer’s market cap at the
acquisition, which should be negatively related to acquirer CARs (Moeller, Schlingemann, and
Stulz (2004)), 2) a dummy variable for acquisitions financed with pure-equity, which should be
positively related to acquirer CARs since my sample is all private targets (Fuller, Netter, and
Stegemoller (2002)), 3) a dummy variable if the acquisition is in a different two-digit SIC code
to account for the possibility of empire building behavior (Morck et al. (1990)), 4) acquirer
idiosyncratic excess stock return volatility to account for information asymmetry, which should
be negatively related (Moeller, Schlingemann, and Stulz (2007)), 5) acquirer market-to-book
ratio as a proxy for Tobin’s Q (Lang et al (1991), Servaes (1991), Dong et al. (2006)). Size is the

26
only control variable to achieve significance at the 10% level. Though most controls lack
significance, in all regressions these controls have the proper sign as predicted by the literature.
Information Sharing Vs. Cheap Targets
Table 5 documents the remarkable returns to SAME_VC acquisitions of public targets by
public acquirers. I identify 90 acquisitions of VC-backed targets within 3 years of their IPO by
VC-backed acquirers within 5 years of their IPO. I searched the IPO and merger documents on
EDGAR to identify overlapping board presence and shareholdings by the same venture capital
firm. While I only have 3 observations of SAME_VC public/public acquisitions, the returns to
these acquisitions lend evidence in favor of the information sharing hypothesis and strongly
against the cheap target hypothesis.
The average 5-day value-weighted announcement return to the target was 50.4%. This is
28.9% higher than the average of similar acquisitions involving different venture capitalists. The
average 5-day value-weighted announcement return to the acquirer was 5.6%, compared to an
average of -4.3% for similar acquisitions with different VCs. The 5-day value-weighted
combined announcement return, a metric more aligned with the overall quality of the business
combination, was 11.7%. This can be compared to the average of -0.6% for similar acquisitions
without an overlapping venture capitalist. Looking at these announcement returns, it is obvious
that the market reacts very well to acquisitions involving firms that share a venture capitalist.
The cheap target hypothesis argues that the positive announcement return to acquirers in
SAME_VC acquisitions is due to the venture capitalist selling the target firm cheap due to the
self-dealing interests of the venture capitalist. This is describing a wealth transfer from target
firm shareholders to acquiring firm shareholders. If this were the case, the acquirer
27
announcement return would be more positive than expected, the target announcement return (a
proxy for the premium paid in acquisition) would be lower than expected, and the combined
announcement return would be no different than expected. However, my data shows that all
three announcement returns are drastically higher than expected, strongly supporting the
information sharing hypothesis rather than the cheap target hypothesis.
Table 6 further documents this effect, laying out multivariate regression results for target,
acquirer, and combined announcement returns. A dummy variable for the presence of
overlapping board representation of the same venture capitalist is positive and significant in
explaining all three announcement returns. This is further evidence for the information sharing
hypothesis.
Discussion of Results
It is clear from my results that the market believes venture capitalists are not leveraging
their relationship with acquiring firm management to encourage overbidding which would result
in value-destructive acquisitions. An obvious question is, why not?
It could be that the venture capitalist’s role in the acquiring firm presents legal
disincentives for acting in their own self-interest. In 18 of the 34 SAME_VC acquisitions, the
VC sat on the board of directors at the IPO and the acquisition. In these instances, the VC is
expected to act in the interest of shareholders. If this were the case, I’d expect to see higher
acquirer announcement CARs for firms in which the VC remains on the board at the acquisition
and is therefore bound not to act self-interested. While I don’t find a significant difference in
means for acquisitions in which the VC remains on the board and those where the VC did not
(7% and 2.3% respectively), I do find that it is significant in my regression at the 10% level. Of

28
course, I predicted that information sharing would also be facilitated by VC presence on the
board, which would also explain this result.
More likely, reputational concerns deter venture capitalists from over-exerting their
influence on management for the VC’s own benefit. Gompers (1996) and Krishnan, Ivanov,
Masulis, and Singh (2010) point out that reputational concerns are important to venture
capitalists, as they repeatedly bring companies public. Reputation affects the VC firm’s ability
to certify companies, raise new funds, and gain access to quality deal flow. Other recent
literature has shown the importance of networks in the venture capitalist industry, providing
further evidence on the importance of reputation (Hochberg, Ljungqvist, and Lu 2007). The
results of my event study indicate that the market believes that venture capitalists avoid selfish
one-time wealth transfers in favor of long-run value maximization through improved reputation
and strong networks.
1.6 CONCLUSION
I find that venture capitalists continue to affect firm M&A decisions well after the initial
public offering, but that this results in higher returns to acquiring firm shareholders. The
information sharing that occurs between a VC and a firm’s management appears to result in
value-enhancing acquisitions of VC-backed private targets, despite the potential for elevated
managerial hubris or self-dealing. I reject the managerial hubris hypothesis that venture
capitalist are using their role as information conduit to encourage overbidding at the expense of
acquiring firm shareholders. I also demonstrate that the information sharing present in the sale
of private targets to public acquirers holds in acquisitions of public targets as well, allowing me
to reject the cheap targets hypothesis. Using this sample of public targets, I reject the cheap

29
targets hypothesis that argues venture capitalists are self-dealing in these transactions selling
target firms cheap as they have an interest in the acquirer as well. This paper demonstrates a
further mechanism through which venture capitalists can add value to corporations.

30
TABLE 1.1
The Effect of Venture Capital Backing on M&A Activity for Recent IPOs Sample is comprised of 2,969 acquisitions from 1996-2006 of private targets by public firms within 5 years of their
IPO. Acquirers must be companies that went public between 1996-2005, listed on the NYSE, Nasdaq, or AMEX,
with an offering price of at least $5, excluding financials and utilities. Within the sample, there are 188 VC-backed
private targets and 2781 non-backed private targets. ***, **, and * denote significantly different from zero at the 1,
5, and 10 percent levels respectively (binomial test for difference in proportions).
PANEL A: FULL SAMPLE (n=2,969)
Private Targets
Public Acquirers VC Backed Non VC Backed
VC Backed At IPO
Acquisitions 148 1108
Row % 11.8% 88.2%
Non VC Backed At IPO
Acquisitions 40 1673
Row % 2.3% 97.7%
Difference 9.5%***
PANEL B: VC-BACKED PRIVATE TARGETS (n=188)
VC-backed Private Targets
Public Acquirers SAME VC DIFF VC
VC Backed At IPO
Acquisitions 34 114
% of n 18.1% 60.6%
Non VC Backed At IPO
Acquisitions 40
% of n 21.3%
PANEL C: AVERAGE YEARS BETWEEN IPO AND ACQUISITION
Public Acquirer
SAME VC DIFF VC NON VC
Mean (years) 1.81 1.68 1.97
Median (years) 1.47 1.22 1.77
n 34 114 40

31
TABLE 1.2
Logistic Regression for Likelihood That Target is VC-backed Sample is comprised of 2,969 acquisitions from 1996-2006 of private targets by public firms within 5 years of their
IPO. Within the sample, there are 188 VC-backed private targets and 2781 non-backed private targets. VC_TGT is
the dependent variable, which equals 1 if the target was VC-backed. VC_AQ equals 1 if the acquirer was VC-
backed at its IPO. TECH_SIC is a dummy if the firm operates in one of the following high-tech SIC codes:
283,481,365,366,367,368,369,482,483,484,485,486,487,488,489,357,or 737. Year is the year in which the acquisition was
announced to capture possible time trends or bubble effects. Acquirers must be companies that went public between
1996-2005, listed on the NYSE, Nasdaq, or AMEX, with an offering price of at least $5, excluding financials and
utilities. ***, **, and * denote significance at the 1, 5, and 10 percent levels respectively.
Logistic Model: VC_TGT = VC_AQ + TECH_SIC + YEAR
Estimate Std Errors Wald Chi-Sq Pr > Chi Sq
Intercept -138.0* 71.953 3.6776 0.0551
VC_AQ 1.1831*** 0.1905 38.5717 <.0001
TECH_SIC 1.7016*** 0.2063 68.041 <.0001
YEAR 0.0668* 0.036 3.4421 0.0636

32
TABLE 1.3
Acquirer CARs in Acquisitions of Private Targets Sample is comprised of 2,969 acquisitions from 1996-2006 of private targets by public firms within 5 years of their
IPO. Acquirers must be companies that went public between 1996-2005, listed on the NYSE, Nasdaq, or AMEX,
with an offering price >$5, excluding financials and utilities. Cumulative abnormal return is calculated using a
market-adjusted returns method subtracting the return on the CRSP equal-weighted index over a 3-day window
[-1,+1] surrounding the announcement date. SAME CEO equals 1 if the CEO was the same at the IPO and
acquisition, 0 if not. VC ON BRD = 1 if the same venture capitalist was on the firm’s board at both the IPO and the
acquisition, 0 if not. In Panel B, sub-sample data is Winsorized as the 1% and 99% tails with a minimum of 1
observation winsorized at each end. ***, **, and * denote significantly different from zero at the 1, 5, and 10
percent levels respectively (two-tailed t test for means, signed rank test for medians).
PANEL A: ACQUIRER ANNOUNCEMENT RETURNS (CAR [-1,+1])
N Mean p-value Median p-value % > 0
FULL SAMPLE 2969 0.013*** <.0001 0.006*** <.0001 55.6%
NON-VC TARGETS 2781 0.013*** <.0001 0.006*** <.0001 55.8%
VC-BACKED TARGETS 188 0.017* 0.08 0.005 0.25 52.7%
NON-VC ACQUIRER 40 -0.008 0.54 -0.008 0.36 45.0%
VC-BACKED ACQUIRER 148 0.023** 0.04 0.009 0.10 54.7%
DIFFERENT VC 114 0.016 0.17 0.005 0.36 52.6%
SAME VC 34 0.047 0.13 0.033* 0.09 61.8%
SAME CEO 26 0.037 0.33 0.022 0.35 57.7%
DIFFERENT CEO 8 0.079 0.11 0.071* 0.08 75.0%
VC ON BOARD 18 0.052 0.21 0.043* 0.03 83.3%
VC NOT ON BOARD 16 0.041 0.40 -0.018 1.00 37.5%
PANEL B: WINSORIZED ACQUIRER ANNOUNCEMENT RETURNS (CAR [-1,+1])
VC-BACKED TARGETS 188 0.016* 0.06 0.005 0.23 52.7%
NON-VC ACQUIRER 40 -0.009 0.44 -0.008 0.35 45.0%
VC-BACKED ACQUIRER 148 0.023** 0.03 0.009* 0.09 54.7%
DIFFERENT VC 114 0.015 0.19 0.005 0.36 52.6%
SAME VC 34 0.048** 0.04 0.033* 0.08 61.8%
SAME CEO 26 0.038 0.15 0.022 0.31 57.7%
DIFFERENT CEO 8 0.079 0.11 0.071* 0.08 75.0%
VC ON BOARD 18 0.070** 0.03 0.043** 0.02 83.3%
VC NOT ON BOARD 16 0.023 0.50 -0.018 1.00 37.5%
PANEL C: MEAN DIFFERENCES Difference p-value
(VC AQ) - (NON VC AQ) 0.031** 0.04
(SAME VC) - (DIFF VC) 0.032 0.18
(SAME VC) - (NON VC AQ) 0.056** 0.03
(DIFF VC) - (NON VC AQ) 0.024 0.14
(DIFF CEO) - (SAME CEO) 0.041 0.44
(VC BOARD) - (VC NOT BOARD) 0.047 0.29

33
TABLE 1.4
Multivariate Analysis of Acquirer Cumulative Abnormal Announcement Returns This table reports ordinary least squares estimates. Sample is comprised of 2,969 acquisitions from 1996-2006 of
private targets by public firms within 5 years of their IPO. Acquirers must be companies that went public between
1996-2005, listed on the NYSE, Nasdaq, or AMEX, with an offering price >$5, excluding financials and utilities.
Cumulative abnormal return is calculated using a market-adjusted returns method subtracting the return on the
CRSP equal-weighted index over a 3-day window [-1,+1] surrounding the announcement date. The dependent
variable is Winsorized at the 1% and 99% tails. ***, **, and * denote significantly different from zero at the 1, 5,
and 10 percent levels respectively (p-values in brackets).
OLS REGRESSIONS
Dependent Variable = CAR [-1, +1]
(1) (2) (3) (4)
VC ACQUIRER 0.041*
[0.09] 0.035
[0.14]
0.036
[0.12]
0.035
[0.14]
SAME VC 0.025
[ 0.27]
0.032
[ 0.47]
VC ON BOARD 0.074*
[0.07]
0.066
[0.11]
SAME CEO -0.030
[0.39]
-0.056
[0.27]
LOG SIZE -0.009**
[0.04]
-0.009*
[ 0.06]
-0.010**
[0.04]
-0.009*
[ 0.06]
M/B RATIO -0.009
[0.79]
-0.008
[0.82]
-0.011
[0.73]
-0.007
[0.84]
ALL STOCK 0.018
[0.35]
0.015
[ 0.45]
0.019
[0.34]
0.018
[0.36]
DIFFERENT SIC 0.010
[ 0.62]
0.009
[ 0.62]
0.010
[0.59]
0.008
[0.66]
VOLATILITY -0.560
[ 0.22]
-0.539
[0.24]
-0.522
[0.26]
-0.543
[0.24]
TIME SINCE IPO 0.007
[ 0.34]
0.006
[ 0.38]
0.006
[ 0.36]
0.006
[0.39]
Adjusted R2 0.010 0.011 0.019 0.016
n 188 188 188 188
INDEPENDENT VARIABLE DEFINITIONS
VC ACQUIRER Equals 1 if the acquirer was VC-backed at its IPO
SAME VC Equals 1 if the acquirer and the target were backed by the same VC firm
SAME CEO Equals 1 if the CEO was the same at the IPO and at the acquisition
VC ON_BOARD Equals 1 if the VC in question was on the board at the IPO and acquisition
TIME SINCE IPO Years from the acquirer's IPO to the announcement date of the acquisition
LOG SIZE Log of acquirer's market capitalization at announcement date
ALL STOCK Equals 1 if the transaction was financed with 100% stock
DIFFERENT SIC Equals 1 if the acquirer and the target operate in different two-digit SIC code
VOLATILITY Std deviation of excess acquirer stock returns from 205 to 6 days prior
M/B RATIO Acquirer’s market value of equity divided by book value of equity
*TECH SIC defined as being in 283,481,365,366,367,368,369,482,483,484,485,486,487,488,489,357,or 737

34
TABLE 1.5
Announcement CARs in Acquisitions of Young VC-backed Public Targets
by Young VC-backed Public Acquirers This table reports target, acquirer, and combined cumulative abnormal announcement returns. Same VC indicates that target and acquirer had concurrent board
representation of the same venture capital firm at their respective IPOs and at the acquisition announcement. DIFF VC indicates that the acquirer and target were
both VC-backed at the IPO, the acquirer was within 5 years of its IPO, and the target was within 3 years of its IPO. Equal (Value) indicates that the CRSP equal
(value) weighted index was used in calculating market adjusted returns. IPO sample consists of initial public offerings on the NYSE, AMEX, and Nasdaq
between January 1, 1985 and December 31, 2009. The firm had to be based in the United States. I exclude utilities, unit offerings, rights offerings, REITs, and
ADRs. I remove IPO firms that had an offer price of less than $5, raised less than $5 million, or had an unidentifiable PERMNO. The M&A sample consists of
transactions announced between January 1, 1985 and May 17, 2010, where both the acquirer and target must be based in the United States and publicly traded.
The deals must have been completed or withdrawn. I eliminate financials and utilities. A maximum of 5% toehold could have existed prior to announcement,
and the acquirer must seek to own 100% of the target after the acquisition. Merging the samples results in 1,404 acquisition announcements of firms in the IPO
sample, and 1,216 completed acquisitions of those firms. Screening for acquirers within 5 years of their IPO making acquisitions of targets within 3 years of their
IPO results in 90 acquisition attempts. ***, **, and * denote significance at the 1, 5, and 10 percent levels respectively.
Mean CARs Same VC (1) Diff VC (2) All Others (3)
(1)-(2) (1)-(3)
Target [-2,+2] CAR (Equal) 50.07% 21.19% 24.41%
28.88%
25.66% ***
Target [-2,+2] CAR (Value) 50.44% 21.52% 24.61%
28.92% *
25.83% ***
Target [-10,+2] CAR (Equal) 71.76% 23.86% 28.83%
47.90% **
42.93% ***
Target [-10,+2] CAR (Value) 74.20% 24.47% 29.43%
49.73% **
44.77% ***
Acquirer [-2,+2] CAR (Equal) 5.21% -4.66% -2.02%
9.87%
7.23% ***
Acquirer [-2,+2] CAR (Value) 5.58% -4.33% -0.33%
9.91%
5.91%
Acquirer [-10,+2] CAR (Equal) 12.18% -4.13% -0.92%
16.31%
13.10% **
Acquirer [-10,+2] CAR (Value) 14.62% -3.51% -0.33%
18.13%
14.95%
Combined CAR (Equal Weighted) 11.32% -0.88% 1.07%
12.20%
10.25% ***
Combined CAR (Value Weighted) 11.69% -0.55% 1.28%
12.24%
10.41% ***
n 3 87 1314

35
TABLE 1.6
Multivariate Analysis of Target, Acquirer, and Combined Announcement Returns in Acquisitions
of Young VC-backed Public Targets by Young VC-backed Public Acquirers This table reports ordinary least squares estimates for acquisitions of targets within three years of their IPO by acquirers within 5 years of their IPO. Same VC
indicates that target and acquirer had concurrent board representation of the same venture capital firm at their respective IPOs and at the acquisition
announcement. DIFF VC indicates that the acquirer and target did not have the same VC concurrently sitting on their board, or the information was not
identifiable on EDGAR. Equal (Value) indicates that the CRSP equal (value) weighted index was used in calculating market adjusted returns. The sample
formation is described in the methodology section. The sample consists of 1,404 acquisition announcements of firms in the IPO sample, and 1,216 completed
acquisitions of those firms. Filtering for VC-backed acquirers within 5 years of their IPO making acquisitions of VC-backed targets within 3 years of their IPO
results in 90 acquisition attempts. Diversifying acquisition equals 1 if the firms operated in different 2-digit SIC codes. Tender offer equals 1 if the bid was a
tender offer. All Stock equals 1 if the offer was a 100% stock offer. ln(Acquirer (Target) Market Cap) is the natural log of the acquirer’s (target’s) share price 3-
days prior to the announcement multiplied by the shares outstanding. Relative size is the target’s market cap divided by the acquirer’s market cap. Tech Bubble
equals 1 is the acquisition was in the years 1998,1999, or 2000. ***, **, and * denote significance at the 1, 5, and 10 percent levels respectively.
Dependent Variable Target [-2,+2] CAR Acquirer [-2,+2] CAR Combined [-2,+2] CAR
Coeff. p-value Coeff. p-value Coeff. p-value
Intercept 0.623 ** 0.020
0.175
0.291
0.360 ** 0.017
Same VC 0.375 ** 0.016
0.176 * 0.069
0.206 ** 0.019
Diversifying Acquisition -0.077 0.289
0.058 0.197
0.045 0.267
Tender Offer 0.175 0.124
-0.143 ** 0.045
-0.112 * 0.081
All Stock 0.062 0.419
-0.045 0.354
-0.029 0.499
ln(Acquirer Market Cap) 0.202 *** <.0001
0.039 0.189
0.000
1.000
ln(Target Market Cap) -0.272 *** <.0001
-0.064 ** 0.037
-0.029
0.295
Relative Size 0.182
0.288
0.137
0.202
-0.014
0.882
Tech Bubble (1998-2000) 0.048
0.411
0.012
0.733
0.002
0.944
N 90
90
90
Adj R-squared 0.464 0.083 0.096

36
CHAPTER 2
The Information Role of Venture Capitalists on Boards of Target Firms
2.1 INTRODUCTION
On February 14, 2002, PayPal Inc. held their initial public offering. Just 144 days later,
on July 8, 2002, eBay Inc. announced that it had entered an agreement to buy PayPal for nearly
$1.5 billion, an 18% premium over the previous day’s closing price, and an 82% premium over
PayPal’s IPO offering price. Prior to PayPal’s IPO, eBay had repeatedly been in negotiations to
buy PayPal. These attempts ultimately failed. At both the time of the IPO and the time of the
acquisition, several venture capitalists sat on PayPal’s board of directors. This leads one to
wonder why PayPal would go through the expensive IPO process just to sell the firm to eBay 4.5
months after the IPO. Zingales (1995) would argue that this is precisely why PayPal went
public, to intentionally create a free-riding shareholder problem with which to extract the surplus
in negotiation. In this context, it would appear that PayPal went public in order to extract a
higher premium in negotiating the later sale of the firm to eBay.
This paper explores whether the venture capitalists’ presence affects the likelihood of
takeover, and how their presence affects the target, acquirer, and combined announcement
returns around the acquisition announcement of recently public firms. I find strong evidence that
venture-backed firms are more likely to get acquired and light evidence that they receive higher
premiums in acquisition.
It has been well established that venture capitalists are heavily involved with the private
firms in which they invest (Gorman and Sahlman (1989), Gompers (1995), Lerner (1995), Baker
and Gompers (2003)). Less well studied is the role of a venture capitalist after they’ve taken a
firm public. We know that venture capitalists tend to stay on the boards of their companies well

37
after an IPO (Barry et al. (1990), Gompers (1996)), but we know little about how this affects
firm decisions and firm performance. One way VCs may affect firm decision making is through
merger and acquisition choices. A few recent working papers (Gompers and Xuan (2009),
Masulis and Nahata (2011)) have explored how venture capitalists who maintain their seat on the
board influence decisions of public companies that choose to make an acquisition (acquiring
firms), but there has been little research on how VCs may affect the decisions of publicly-held
firms being acquired (target firms). This paper documents how venture capital backing at the
IPO increases the likelihood of takeover after an IPO, with little effect if any on the target,
acquirer, and combined announcement returns.
When Valero Energy announced on April 25, 2005 that it would acquire Premcor Inc. for
$6.9 billion in a combination of cash and stock, Valero’s stock price fell 1.8% in the three day
announcement window, while Premcor’s rose 16.5%. This is typical of many acquisitions of
public targets by public acquirers. Andrade, Mitchell, and Stafford (2001) find that from 1973-
1998, acquisitions result in a 16% return to targets and -0.7% return to bidders on average. With
this knowledge, a vast financial literature has struggled to explain why a public company such as
Valero Energy would undertake such an acquisition, knowing that the expected announcement
return is most likely negative. Popular explanations include managerial hubris (Roll (1986)),
agency costs of free cash flow (Jensen (1986), Harford (1999)), empire building (Morck,
Schleifer, and Vishny (1990), Masulis, Wang, and Xie (2007)), and the signaling of over-valued
equity in the case of stock-based acquisitions (Rhodes-Kropf and Viswanathan (2004), Moeller,
Schlingemann, and Stulz (2005)).
The gist of these theories is that, for whatever reason, management’s interests are
divergent from those of its shareholders. However, for a value-weighted diversified shareholder,
the Valero/Premcor acquisition would have generated a combined announcement return of 2.2%,

38
and Andrade, Mitchell, and Stafford (2001) find that these combined announcement returns
averaged 1.8% from 1973-1998. Using combined announcement returns as a key metric of
interest, a proxy of the overall quality of a business combination, I investigate the role that
venture capitalists play in identifying and facilitating synergistic mergers and acquisitions.
Hansen and Lott (1996) argue that if shareholders are well diversified, the objective of
firm management is not to maximize firm value, but rather to maximize the value of their
shareholder’s entire portfolio. Therefore, diversified investors may be indifferent to wealth
transfers between acquirer and target, and only concerned with the wealth gain/loss associated
with the entire merger. If it is indeed true that managers are acting in the interest of diversified
shareholders, then bidder announcement returns alone are an incomplete metric to evaluate and
study acquisitions. A more relevant question is: was wealth created through the acquisition for a
diversified shareholder?
Bradley, Desai, and Kim (1988), Berkovitch and Narayanan (1993), Mulherin and Boone
(2000), and Andrade, Mitchell, and Stafford (2001) show that while acquisitions tend to transfer
wealth from acquirers to targets, acquisitions generally create wealth on the whole. While many
finance papers examine the determinants of acquirer and/or target announcement returns, there
has been little research on the determinants of total wealth creation, or synergistic gains, in
acquisitions. I use the involvement of a venture capitalist prior to and/or after the IPO, and also
explore the effect on total wealth creation, or lack thereof, in acquisitions.
This paper studies the effect of venture capitalists on the decisions of newly-public
corporations after the IPO. I extend both the merger and acquisition literature and the venture
capital literature by investigating the venture capitalist’s role as an information conduit in
mergers and acquisitions, specifically, their role while serving on the board of directors of a
target firm. I find that VC-backed firms are significantly more likely to receive bids and get

39
acquired following their initial public offering. I find light evidence that they may also receive
higher premiums, and strong evidence that they at least don’t receive lower premiums.
2.2 BACKGROUND
It has been well established that venture capitalists are heavily involved with the private
firms in which they invest (Gorman and Sahlman (1989), Gompers (1995), Lerner (1995), Baker
and Gompers (2003)). Less well studied is the role of a venture capitalist after they’ve taken a
firm public. We know that venture capitalists tend to stay on the boards of their companies well
after an IPO (Barry et al. (1990), Gompers (1996)), but we know little about how this affects
firm decisions and firm performance. One way VCs may affect firm decision making is through
merger and acquisition choices. A few recent working papers (Gompers and Xuan (2009),
Masulis and Nahata (2011)) have explored how venture capitalists who maintain their seat on the
board influence decisions of public companies that choose to make an acquisition (acquiring
firms), but there has been little research on how VCs may affect the decisions of publicly-held
firms being acquired (target firms).
Venture capitalists are generally thought to be value-added investors, who, through a
strong network of contacts, are able to raise capital, gain access to deal flow, invest in quality
companies, and add value to firm management. After the IPO, it is less clear how VCs are
involved with a firm, but oversight of a large public enterprise is probably low on their list of
core competencies. It would make sense that selling the company they brought public in an
acquisition would not only alleviate these responsibilities, but also lead to a nice return.
Mulherin and Boone (2000) show that targets receive an average premium of 20.2% in

40
acquisitions. The private benefits captured by the VC (reduced responsibility, grandstanding,
increased network, lock ups, etc) may lead firms with VC presence to sell for lower premiums.
In addition, VCs who want to sell off their shares in a company they’ve taken public run
the risk of signaling negative information to the market (Field and Hanka (2001)), resulting in a
decrease in share price. Selling the entire public company through a merger or acquisition after
an IPO avoids this problem. VCs may be willing to sell at a lower premium in order to avoid
this dilemma.
However, VCs are also considered to be strong monitors, certifiers, and shrewd
negotiators, well informed about the value of the companies and industries in which they invest.
This could lead them to command a higher premium for their target companies. Whether VC
presence on the board (and/or as a large shareholder) commands a higher premium as a target of
an acquisition is an empirical question. This paper studies the effect of venture capitalists on the
decisions of newly-public corporations after the IPO. I investigate the venture capitalist’s role as
an information conduit in mergers and acquisitions, specifically, their role while serving on the
board of directors of a target firm. I document the increased likelihood of a takeover attempt, the
likelihood of takeover completion, and the target, acquirer, and combined returns around the
acquisition announcement of newly public VC-backed firms.
The finance literature has clearly documented that announcement returns to public
acquirers of public targets are negative/null on average (Andrade, Mitchell, and Stafford (2001)).
With this knowledge, the literature has struggled to explain why managers/firms continue to
undertake acquisitions that have a negative expected impact on firm value. Popular explanations
include managerial hubris (Roll (1986)), agency costs of free cash flow (Jensen (1986), Harford
(1999)), empire building (Morck, Schleifer, and Vishny (1990), Masulis, Wang, and Xie (2007)),
and the signaling of over-valued equity in the case of stock-based acquisitions (Rhodes-Kropf

41
and Viswanathan (2004), Moeller, Schlingemann, and Stulz (2005)). The gist of these theories is
that, for whatever reason, managers are not acting in the interest of their shareholders.
Hansen and Lott (1996) argue that if shareholders are well diversified, the objective of
firm management is not to maximize firm value, but rather to maximize the value of their
shareholder’s entire portfolio. Therefore, diversified investors may be indifferent to wealth
transfers between acquirer and target, and only concerned with the wealth gain/loss associated
with the entire merger. While this may initially seem like a stretch, recent research indicates this
line of logic may actually be quite accurate.
A recent paper by Matvos and Ostrovsky (2008) shows that institutional shareholders
gain on average around acquisition announcements because they have substantial ownership in
both the target (who gains on average) and the acquirer (who loses on average). They also
provide evidence that institutional shareholders with cross-holdings in both the acquirer and the
target are more likely to approve an acquisition than shareholders that only hold the acquirer.
This could explain why mergers that apparently destroy acquirer value continue to get
shareholder approval. It is not farfetched to think that investors are more concerned with the
value of their entire portfolio than just the value of the bidder. A related paper, Harford, Jenter,
and Li (2011), shows that there exist significant institutional cross-holdings in acquirers and
targets and argue that this influences bidding firm management’s choice of target.
If it is indeed true that managers are acting in the interest of diversified shareholders, then
bidder and target announcement returns alone are an incomplete metric to evaluate acquisitions.
A more relevant question is: what are the determinants of wealth creative acquisitions?
A large financial literature examines the determinants of acquirer announcement returns,
but there has been little research on the determinants of total wealth creation, or synergistic
gains, in acquisitions.

42
Bradley, Desai, and Kim (1988) show that successful tender offers result in a synergistic
wealth gain of 7.48% to a value-weighted investor. They also show that this gain is mostly
captured by the target shareholders, especially in multiple-bidder contests. However, they don’t
address firm or deal characteristics in explaining this wealth gain.
Berkovitch and Narayanan (1993) find that total gains are positive in 76.4% of
acquisitions. They use the correlation between target gains and total gains to test for takeover
motive. They argue that a positive correlation indicates a synergy motive, a negative correlation
indicates an agency motive, and zero correlation indicates hubris. They find that synergy is the
primary motive for takeover, but that agency and hubris are also prevalent. However, they stop
short of examining the characteristics that may determine the returns to these deals.
Mulherin and Boone (2000) document that though acquirer’s tend to transfer wealth to
targets, mergers and acquisitions generally create wealth on the whole. Returns to targets
average 20.2%, which more than makes up for the small average losses to bidders, which
benefits a diversified shareholder. In their sample, acquisitions average a 3.56% gain to the
value-weighted shareholder who holds both acquirer and target. Andrade, Mitchell, and Stafford
(2001) find qualitatively similar results.
The vast majority of finance studies have used bidder, target, and deal characteristics to
explain acquirer announcement returns. Several finance studies show that cash deals result in
better acquirer announcement returns than stock deals (Jensen and Ruback (1983), Andrade,
Mitchell, and Stafford (2001)), which is attributed to theory that stock acquisitions are a signal of
overvalued equity (Myers and Majluf (1984), Travlos (1987)).
Morck, Shleifer, and Vishny (1990) find that diversifying acquisitions are associated with
negative bidder announcement returns. In a sample of 326 acquisitions, the authors show that
bidder returns are lower when the acquirer and target don’t share the same 4-digit SIC code.

43
Jensen (1986) argues that high amounts of firm leverage disciplines managers and
reduces free cash flow that would otherwise be left to management’s discretion, suggesting it
should lead to better acquisitions. Maloney et al. (1993) finds empirical support for this
hypothesis.
Jensen (1986) argues that managers with firm free cash flows will waste it on negative
NPV projects rather than distribute it to shareholders. Lang, Stulz, and Walking (1991) find that
free cash flow is negatively related to bidder announcement returns for low-Q bidders, but not
for high-Q bidders. They argue that the agency costs of free cash flow are higher for low-Q
bidders because they are less likely to have positive NPV projects. Harford (1999) finds that
cash-rich firms make worse acquisitions regardless of Tobin’s-Q.
The evidence on the effect of Tobin’s Q on bidder returns is mixed. Lang et al. (1989,
1991) and Servaes (1991) find evidence that high-Q bidders have higher announcement returns,
but Dong et al. (2006) and Moeller et al. (2004) find the opposite. This is likely due to sample
period differences. It is generally acknowledged that pre-1990 announcement returns were
increasing in acquirer Q, but reversed in the 1990s. These papers have also shown that returns
are higher with the acquisition of a low-Q target by a high Q bidder, and lower with the
acquisition of a high-Q target by a low-Q bidder.
Asquith et al. (1983) show that relative deal size is a determinant of acquirer
announcement returns, where returns are increasing in the ratio of target market capitalization to
bidder market capitalization.
Moeller, Schlingemann, and Stulz (2004) find that acquirer size (as separate from relative
size) is an additional determinant of acquirer announcement returns for both public and private
targets, with small acquirers faring better than large acquirers on average. They argue that this is
due to the prevalence of agency costs and managerial hubris in large acquirers.

44
Masulis et al. (2007) find that bidders with high G-indexes make acquisitions with worse
announcement returns than low G-index firms. They argue that weakly governed firms result in
entrenched managers and that high G-index firms aren’t subject to the market for corporate
control.
Stulz, Walking, and Song (1990) show that target announcement returns are negatively
related to target institutional ownership, but that value-weighted announcement returns (total
return to bidder and target) are not related to target institutional ownership. They propose this is
due to the idea that institutions are willing to sell at less of a premium because they are in lower
tax brackets. However, they do not control for the endogeneity of size and institutional
ownership.
Duggal and Millar (1999) find a positive relationship between bidder gains and bidder
institutional ownership in a simple OLS regression. However, they also find that institutional
ownership is endogenous with firm size, inside ownership, and presence in the S&P 500.
Employing a two-stage regression of bidder gains on predicted institutional ownership, they do
not find a relationship between institutional ownership and bidder announcement returns.
Bargeron, Schlingemann, Stulz, and Zutter (2008) find that shareholders of public targets
receive higher premiums from publicly held bidders than privately held bidders or private equity
firms. They also show that the premiums paid by public bidders is positively related to target
institutional ownership. While the authors argue for an agency cost story, their results are also
consistent with the concept that managers in public firms are acting to maximize the value of
their investors’ portfolios, and not just bidder value.
Huang and Walking (1987) find that announcement returns to targets are higher with cash
offers than with stock offers. Song and Walking (1993) find that targets tend to have lower
managerial ownership than their industry competitors, but that managerial ownership can lead to

45
higher announcement returns in contested offers. They interpret this as evidence that an optimal
level target managerial ownership exists, in which managers can better negotiate but not stop
acquisitions, per Stulz (1988).
This paper extends both the merger and acquisition literature and the venture capital
literature. I find that VC-backed firms are significantly more likely to receive bids and get
acquired following their initial public offering. I find light evidence that they may also receive
higher premiums, and strong evidence that they don’t receive lower premiums.
2.3 HYPOTHESES
Likelihood of being acquired after the IPO
H1: Venture capital backed firms are more likely to be acquired within 3 years of their IPO.
Due to the venture capitalist’s networks, industry knowledge, and informational
advantage, VCs are able to identify profitable business combinations and promote their firms as
takeover targets. This increases the likelihood of takeover, and is financially beneficial to target
firm shareholders. In modeling the likelihood of takeover for newly public firms, a dummy
variable for VC board presence at both the IPO and takeover announcement would be positive
and significant.
Acquisition attempts on venture capital-backed firms
H2: Acquisition likelihood is inversely related to the percentage of the firm sold in the IPO.
Venture capitalists who are interested in going public and then selling the firm in an
acquisition may offer a small portion of the firm for sale in the IPO. This allows the shares to
trade in the public markets, establishes a price, and creates a free-riding shareholder problem, but

46
the venture capitalist, as well as other insiders, still maintains a large block with which to
negotiate.
Premiums paid in acquisitions of VC-backed IPOs
H3: Newly public VC-backed firms that become targets command a higher premium.
Venture capitalists are thought to be well-informed, shrewd negotiators. Their presence
on the board of directors of a newly public firm at both the IPO and takeover announcement will
be positive and significant in predicting the premium paid in acquisition.
Acquirer announcement returns
H4: Acquirer announcement returns are lower in acquisitions of VC-backed targets.
Hypothesis 3 posits that venture capitalists are negotiating for higher premiums for the
target firm, which should result in a wealth transfer from the acquirer to the target. Their
presence on the board of directors of a newly public firm at both the IPO and takeover
announcement will be negative and significant in predicting the announcement return to the
acquirer.
Combined announcement returns
H5: Combined announcement returns are higher in acquisitions of VC-backed targets.
The wealth transfer between acquirer and target should have no effect on the combined
wealth change in the acquisition. But in the VC’s unique role as an information conduit, their
presence on the board of directors of a newly public firm at both the IPO and takeover
announcement will be positive and significant in predicting the combined announcement return
in the acquisition.

47
2.4 DATA AND METHODOLOGY
The sample is compiled from SDC’s Global New Issues and Mergers & Acquisitions
databases. The initial IPO sample consists of initial public offerings on the NYSE, AMEX, and
Nasdaq between January 1, 1985 and December 31, 2009. The firm had to be based in the
United States. I exclude utilities, unit offerings, rights offerings, REITs, and ADRs. I remove
IPO firms that had an offer price of less than $5 or raised less than $5 million. I also require that
firms have identifiable PERMNOs. This results in a sample of 4,819 IPOs. Of the 4,819 IPOs,
2,204 (45.7%) were VC-backed at the IPO.
The Mergers & Acquisitions sample consists of transactions announced between January
1, 1985 and May 17, 2010. Both the acquirer and target must be based in the United States and
publicly traded. The deals must have been completed or withdrawn. I eliminate financials and
utilities. A maximum of 5% toehold could have existed prior to announcement, and the acquirer
must seek to own 100% of the target after the acquisition. This results in 4,205 announced deals,
and 3,292 completed deals. Requiring targets to have returns listed on CRSP results in a sample
of 3,119 acquisitions.
Merging the IPO sample with the M&A sample, I create a set of IPOs that had
acquisition announcements. After requiring the acquired firm to have a PERMNO and returns
on CRSP on the acquisition date, my I find 1,440 acquisition announcements on firms that are
also in my IPO sample. 1,237 of these acquisition announcements resulted in a completed
acquisition. After gathering returns data, I find several transactions that involved material
alternative news in and around the acquisition announcement. I eliminate these from my later
samples, as the market reaction to alternative news obscures the effect of the acquisition
announcement. After eliminating transactions with errors or alternative news, I have 1,404

48
acquisition announcements on firms that are also in my IPO sample. 1,216 of these bids were
completed.
High technology companies are defined as those operating in SIC codes 283 (biological
products, genetics, and pharmaceuticals), 357 (computers), 365-369 (electronic equipment), 481
(high-tech communications), 482-489 (communications services), 737 (software services).
Venture capitalist board data was hand collected from SEC filings on EDGAR. I would
first go to the IPO documents to find the lead venture capitalist. In the common event that there
was more than one VC invested, I would choose the VC firm with the largest percentage
ownership in the company that also had a board seat. Where available, I would gather their
percentage ownership before the offering and after the offering. I would then go to the
documents in and around the acquisition announcement to discover if the venture capitalist was
still on the board of directors, and where available and applicable, the percentage ownership in
the target company. If the same lead venture capitalist was on the board at the IPO and at the
acquisition announcement, VC On Board is a 1. If the VC had departed the board between the
IPO and acquisition, VC On Board is a 0.
Of the 313 VC-backed IPOs that received bids within 3 years of their IPO, I was able to
identify VC board presence at the acquisition for 203 bids (missing data was mostly due to the
fact that the firm went public and was acquired before EDGAR begins). Several of my
observations went public before EDGAR begins, but received bids within 3 years of their IPO.
As such, I identified VC percentage ownership before and after the IPO in 179 and 180 cases
respectively. There were 6 observations where I could identify VC board presence at the bid, but
not find the VC percentage ownership in the firm, resulting in 197 observations of VC ownership
at the bid.

49
Returns Data
For both bidders and targets, I use a market-adjusted 5-day window [-2,+2] to measure
cumulative abnormal returns [CARs], where the announcement date is day 0. I subtract off the
return to the CRSP value-weighted index over the same period to define cumulative abnormal
returns. All returns data is obtained from CRSP.
∑ ( )
where
I also look at market-adjusted 13-day window [-10,+2] to capture any short-term run-up
to the acquisition announcement, as well as a preliminary 30 day window before the
announcement windows [-40,-10] to capture early run-up before my announcement windows.
For robustness, I run the data with both the CRSP equal- and value-weighted market indices.
As in Bradley et al (1988) and Mulherin and Boone (2000), combined return (or synergy
return) is defined as the value-weighted CAR of the transaction, where bidder and target values
are their respective market caps 2 days prior to the announcement date.
( ) ( ) ( ) ( )
( )

50
Variable Definitions
Market Cap is defined as the share price multiplied by shares outstanding. Market-to-
Book Ratio is the market value of equity divided by the book value of equity. Property is the
ratio of a firm’s property, plant, and equipment to total assets at the time if the IPO. Liquidity is
current assets minus current liabilities, divided by total assets at the time if the IPO. TGT VC
equals 1 if the firm had venture capital backing at the IPO. TGT VC Young Firm (Acquirer VC
Young Firm) is defined as a VC-backed firm within 3 (5) years of its IPO. Acquirer Tech and
TGT TECH equal 1 if the firm operates in SIC codes 283 (biological products, genetics, and
pharmaceuticals), 357 (computers), 365-369 (electronic equipment), 481 (high-tech
communications), 482-489 (communications services), or 737 (software services). Diversifying
Acquisition equals 1 if firms operate in different 2-digit SIC codes. Tender offer equals 1 if the
bid was a tender offer. All Cash equals 1 if the offer was a 100% cash offer. All Stock equals 1
if the offer was a 100% stock offer. ln(Acquirer (Target) Market Cap) is the natural log of the
acquirer’s (target’s) share price 3-days prior to the announcement multiplied by the shares
outstanding. Relative size is the target’s market cap divided by the acquirer’s market cap. Tech
Bubble equals 1 is the acquisition was in the years 1998,1999, or 2000.
2.5 RESULTS
Table 1 presents a breakdown of my sample, showing that at first glance, VC-backed
IPOs are acquired at a much higher rate than non-VC-backed IPOs. Of the 4,819 IPOs in my
sample, 2,204 (45.7%) were VC-backed. Of the 1,440 bids (announced takeovers) made on the
firms in my IPO sample, 814 (56.5%) were VC-backed IPOs. Of the bids on the IPOs sample
(1,440), 1,237 are completed, with VC-backed IPOs representing 719 (58.1%) of the completed
takeovers of firms in my IPO sample. That is to say that while VC-backed IPOs make up only

51
46% of my IPO sample, they represent 58% of the IPOs that end up being acquired. Of the
2,204 VC-backed IPOs in my sample, 814 (36.9%) receive acquisition bids at some point, of
which 719 (32.6%) are completed. Compare this with the 2,615 non-VC-backed IPOs, where
just 626 (23.9%) receive acquisition bids at some point, with 518 (19.8%) being completed.
That is to say that in my sample, approximately 1 out of 3 VC-backed IPOs end up being
acquired (32.6%), while only 1 out of 5 non-VC-backed IPOs get acquired (19.8%).
Table 1 Panel B shows that of the 3,381 announced deals (bids) in my full M&A sample,
2,686 (79.4%) end up being completed. Bids on firms that are also in my IPO sample are more
likely to be completed. Of the 1,440 targets that were also in my IPO sample, where 1,237
(85.9%) were completed. Within this sample of IPOs firms that end up receiving bids, VC-
backed IPO firms are more likely to complete/accept the acquisition than non-VC-backed IPO
firms (88.3% vs. 82.7%). This demonstrates that not only are VC-backed IPOs more likely to
receive bids (Table 1 Panel A), but the bid is more likely to be completed (Table 1 Panel B).
Table 2 breaks down my sample by both calendar year and year following the respective
IPO, while figures 1 through 5 present Table 2 graphically. Figure 1 present bids on IPO firms
by year following the respective IPO. Figure 1 shows that VC-backed IPO firms receive bids at
a higher rate the years following their IPO than do non-VC-backed IPO firms. Figure 2 shows
the cumulative percentage of the firms in my IPO sample that are acquired by the year following
respective IPOs. Within the first 3 years of a the respective IPO, 15% of VC-backed IPOs are
the target of an acquisition attempt, compared to less than 10% of non-VC-backed IPOs. Figure
2 shows that this gap only widens as time passes from the IPO.
Figure 3 shows the percentage of firms in my IPO sample actually acquired (successful
acquisitions) by the year following their respective IPO. Again, VC-backed IPOs are acquired at
a much higher rate than non-VC-backed IPOs. Figure 4 presents the cumulative percentage of

52
firms acquired by the year following their respective IPO. Again, we see that VC-backed IPOs
are acquired at a higher rate than non-VC-backed IPOs, and that this cumulative gap widens over
time.
Figure 5 lays out the bids received by firms in my IPO sample chronologically. The
years 1998, 1999, and 2000 (the bubble) were very active periods for acquisitions of firms in my
IPO sample. 393 (31.8%) of the 1,237 completed acquisitions in my sample occurred during the
years 1998, 1999, and 2000. However, this was an active acquisition period for both VC- and
non-VC-backed IPO firms. 224 (31.2%) of the 719 VC-backed IPO firms were acquired during
these years, compared to 169 (32.6%) of the 518 non-VC-backed IPO firms.
Venture capitalists generally concentrate their investments in high technology industries.
As a result, this increased likelihood of an acquisition could be due to the fact that the majority
of venture capital investments are in high technology companies, and not due to any effect of the
venture capitalist. Figure 6, 7, 8, and 9 separate target firms on their SIC codes into high
technology-based and non-technology based companies. High technology companies are
defined as those operating in SIC codes 283 (biological products, genetics, and pharmaceuticals),
357 (computers), 365-369 (electronic equipment), 481 (high-tech communications), 482-489
(communications services), 737 (software services).
It is clear from Figures 6, 7, 8, and 9 that the increased likelihood of being acquired due
to venture capitalist involvement holds true for both high-technology and non-technology
companies. In my IPO sample, there were 2,053 high-technology IPOs. Of these, 1,373 were
VC-backed, while 680 were not. In non-technology SIC codes, there were 2,840 IPOs in my
sample, of which 1,969 were non-VC backed, and 871 that had venture capital backing. My
acquisition sample, after removing errors and firms with alternative news around the acquisition,
contains 1,404 bids made on my IPO sample. Of those, coincidentally, 702 were high

53
technology targets and 702 were non-technology targets. Within the high technology sample,
506 (72.1%) of the targets were VC-backed while 196 (27.9%) were not. Within the non-
technology sample, 283 (40.4%) were VC-backed while 419 (59.6%) were not.
Looking at the high-technology sample, 33% of VC-backed IPOs receive an acquisition
bid within 10 years of their IPO, while only 25% of non-VC backed IPOs receive a bid over the
same respective time period. Within the non-technology sample, 29% of VC-backed IPOs
receive an acquisition bid within 10 years of their IPO, while only 17% of non-VC backed IPOs
do. This shows that venture capital involvement seems to increase the likelihood of an
acquisition attempt for both high technology and non-technology companies.
Of the 1,404 firms in my acquisition attempts sample, 1,216 were completed. Of the
1,216 completed acquisitions, 626 were high technology companies, while 590 were in non-
technology sectors. Within the high technology sample, 30% of the VC-backed IPOs are
acquired within 10 years, while only 21% of non-VC backed IPOs are. Within the non-
technology sample, 25% of VC-backed IPOs are acquired within 10 years, while only 14% of
non-VC backed IPOs are. This demonstrates that venture capital involvement seems to increase
the likelihood of being acquired, regardless of whether a firm is considered high-tech or not.
Table 3 shows that VC-backed firms sell a smaller portion of the firm in the initial public
offering than non-VC-backed firms, a variable I’ll utilize in my logistic regressions. VC-backed
firms sell an average of 27.8% of the firm in the IPO, while non-VC-backed firms sell an
average of 37.99%. Table 3 also shows that VC-backed firms are more likely to sell very small
portions in the IPO, with 4.3% of the firms selling less than 10%, 13.8% selling less than 15%,
and 45.6% selling less than 25%. I also break the sample into tech and non-tech subgroups,
where the same pattern holds true.

54
Table 4a lays out logistic regression results modeling the likelihood of receiving a bid. A
dummy variable for venture capital backing is strongly significant in predicting the likelihood of
being the target of an acquisition attempt.
Table 4b lays out logistic regression results modeling the likelihood of being acquired. A
dummy variable for venture capital backing is strongly significant in predicting the likelihood of
being acquired. Table 4c lays out regression results modeling the likelihood of being acquired
within 3 years of the initial public offering. A dummy variable for venture capital backing at the
IPO is strongly significant in predicting the likelihood of being quickly acquired, where no other
control variable.
Table 5 lays out an initial breakdown of acquisition announcement returns to my sample,
for all bids and for the subset of completed acquisitions. Of the 1,404 IPO firms that eventually
receive an acquisition bid, firms that had VC-backing at the IPO receive higher abnormal
announcement returns over both the 5-day (25.8% vs. 22.3%) and 13-day windows (30.2% vs.
26.6%). Both differences are statistically significant at the 5% level, and hold for both the equal-
weighted and value-weighted index. When examining differences in abnormal announcement
returns for the 1,216 acquisitions of IPO firms that were eventually completed, VC-backed firms
again have a higher mean than Non-VC backed firms (26.4% vs. 24% over the 5-day window,
30.1% vs. 28.1% over the 13-day window), but the difference in means lacks statistical
significance at the 10% level.
Table 6 examines my subjects of interest: IPO firms that are acquired relatively quickly
after the IPO. Table 4a looks at acquisition announcement returns to recent IPOs receiving bids
within 1, 3, and 5 years of their respective IPO. There were 123 IPO firms that were acquired
within 1 year of their respective IPOs (73 VC-backed vs. 50 Non-VC), 545 acquired within 3
years of their IPO (313 VC-backed vs. 232 Non-VC backed), and 828 acquired within 5 years of

55
their IPO (478 VC-backed vs. 350 Non-VC backed). VC-backed firms average higher abnormal
announcement returns over the 5-day and 13-day windows with both the equal-weighted and
value-weighted index. However, difference in means tests lacked statistical significance at the
10% level. Looking at firms that receive bids within 5 years of their respective IPO, VC-backed
firms average higher mean abnormal returns over the 5-day window (26.1% vs. 22.5%) and over
the 13-day window (31% vs. 27.4%), both statistically different at the 10% level.
Table 6b looks at acquisition announcement returns to targets were eventually acquired
(as opposed to just receiving bids) within 1, 3, and 5 years of their respective IPO. There were
116 IPO firms that were acquired within 1 year of their respective IPOs (73 VC-backed vs. 43
Non-VC), 483 acquired within 3 years of their IPO (277 VC-backed vs. 206 Non-VC backed),
and 721 acquired within 5 years of their IPO (420 VC-backed vs. 301 Non-VC backed). Again,
VC-backed firms average higher abnormal announcement returns over the 5-day and 13-day
windows with both the equal-weighted and value-weighted index. However difference in means
tests lacked statistical significance at the 10% level.
Table 6c segments the sample of IPO firms receiving bids on high-tech SIC codes and
non-technology-based SIC codes. There were 123 IPO firms that received bids within 1 year of
their respective IPO (67 High-tech vs. 56 Non-tech), 545 that received bids within 3 years (273
vs. 272), and 828 that received bids within 5 years (417 vs. 411). High-technology IPO firms
average higher abnormal announcement returns than non-technology-based IPO firms. High-
tech IPO firms that receive bids within 1 year of their IPO average abnormal announcement
returns 10.25% higher than non-tech firms (30.9% vs. 20.6%) over the 13-day announcement
window, significant at the 10% level. Looking at firms that receive bids within 5 years of their
respective IPO, high-tech firms average higher mean abnormal returns over the 5-day window

56
(27% vs. 22.2%) and over the 13-day window (32.4% vs. 26.5%), both statistically different at
the 5% and 1% level respectively.
Table 6d looks at announcement returns of completed acquisitions to recent IPO firms,
segmented on high-tech classification. The same relationship observed in Table 4c holds here as
well. In my sample of recent IPOs that get acquired, high-tech firms receive significantly higher
announcement returns than non-tech firms. Recent high-tech IPOs that are acquired with 1 year,
3 years, and 5 years of their respective IPO average 10.7%, 6.6%, and 5.9% higher abnormal
announcement returns than non-tech firms. Qualitative results are the same using the equal-
weighted or value-weighted CRSP index in calculating abnormal returns.
Table 6e looks at announcement returns to only the high-tech IPO firms that are acquired
relatively quickly after their IPO. While few of the difference in means test were significant,
segmenting on VC-backing produces some intriguing results. Of the 64 high-tech firms that are
acquired within1 year of their IPO, 49 were VC-backed and 15 were not. VC-backed high-tech
firms acquired within 1 year averaged a 32.6% announcement return over the 13-day
announcement window, versus a 26.9% average for non-VC-backed firms (a 5.6% difference).
However, looking at high-tech firms acquired within 3 years (5 years) of their IPO, VC-backed
firms experience lower announcement returns by 2.7% (3.8%).
The opposite is true for non-technology firms. VC-backed non-tech firms experience
slightly lower announcement returns if acquired within 1 year of their IPO over the 13-day
announcement window (-0.91% difference), but higher announcement returns if acquired within
3 years or 5 years of their IPO (5.01% and 5.29 % respectively).
Table 7a, 7b, and 7c examine announcement returns associated with the hand collected
board data. Table 5a looks at returns to IPO firms that are acquired within three years,
segmented on VC-backing and VC board presence. When the venture capitalist maintains their

57
seat on the board of directors from the IPO to the acquisition announcement, target firms
experience a 35% announcement return over the 13-day window, as opposed to a 28.2%
announcement return when the venture capitalist has departed the board before the acquisition
announcement is made. When the VC is still on the board at the acquisition announcement, VC-
backed firms receive a 7.75% higher announcement return than non-VC-backed firms. This
difference goes away if the VC no longer maintains a seat on the board of directors.
Tables 7b and 7c break Table 7a into high-tech and non-tech subsets. Table 7b looks at
announcement returns to only high-tech IPO firms that are acquired within three years of their
IPO, segmenting on VC-backing and VC board presence. VC and non-VC firms have about the
same announcement returns when the venture capitalist is still on the board at the acquisition
announcement. However, in instances where the VC no longer maintains a board seat,
announcement returns are significantly lower than both VC-backed firms in which the VC is still
on the board and non-VC backed firms.
Conversely, as shown in Table 7c, VC board presence is associated with lower
announcement returns when looking at non-technology companies. Though not statistically
significant, firms in which the VC maintained their board seat had lower average announcement
returns than firms in which the VC had departed the board. Table 7c shows that VC-backed
firms, regardless of board presence, are associated with higher announcement returns than non-
VC backed non-technology firms.
Table 8 documents the target, acquirer, and combined announcement returns by whether
the target and acquirer were both VC-backed IPOs at some point.
Table 9 contains summary statistics for key variables to be used in regressions. Of
particular interest, Table 9 includes summary statistics of the hand collected board data from the
SEC website. Of the 313 VC-backed IPOs that received bids within 3 years of their IPO, I was

58
able to identify VC board presence at the acquisition for 203 bids. The lead venture capitalist
maintained their board seat through the acquisition announcement in 87.2% of the cases. The
lead venture capitalist held 22.46% of the firm on average before the IPO, 16.73% after the IPO,
and 11.34% at the acquisition announcement. The average venture capitalist held onto 65.9% of
their stake between the post-IPO period and acquisition announcement.
Table 9 also shows that VC-backed targets tend to be smaller, and acquirers of VC-
backed targets tend to be larger. As such, the relative size of the target to the acquirer is lower.
Target size, acquirer size, and relative size will be controlled for in the regression tables to
follow.
Table 10a, 10b, and 10c lay out multivariate regressions results of target, bidder, and
combined announcement returns. A dummy variable for venture capital backing has little
explanatory power in explaining target announcement returns. For bidders however, if the target
is VC-backed the bidder has lower announcement returns. I interpret this as light evidence that
VC-backed targets extract more of the surplus in acquisitions than non-VC backed firms.
Looking at the regressions on combined announcement returns reinforces this. The dummy
variable for VC backing is insignificant in explaining combined returns, indicating that there is a
wealth transfer from acquirer to target, rather than value-destruction. I attribute this to the
certification and negotiating ability of the venture capitalist.
Discussion of Results
VC-backed IPOs are significantly more likely to be acquired within 3 years of their IPO.
Firms offering a small percentage (less than 10%) of the firm for sale in the IPO are significantly
less likely to be acquired, which is the opposite of my prediction. There is light evidence to

59
indicate that VC-backed firms receive higher premiums, acquirers of VC-backed recent IPOs
overpay (wealth transfer), and that this has little effect on combined wealth effects.
2.6 CONCLUSION
This paper studies the effect of venture capitalists on the decisions of newly-public
corporations after the initial public offering. I extend both the merger and acquisition literature
and the venture capital literature by investigating the venture capitalist’s role as an information
conduit in mergers and acquisitions, specifically, their role while serving on the board of
directors of a target firm. I find that VC-backed firms are significantly more likely to receive
bids and get acquired following their initial public offering. I also find that they receive higher
premiums while the venture capitalist is still on the board of directors. This seems to come from
extracting the negotiation surplus, as the acquirer of VC-backed targets experiences more
pronounced negative announcement returns while the combined announcement return is on
average unaffected. I interpret this as evidence of a wealth transfer from the acquirer to the
target firm. I attribute this to the certification and negotiating abilities of the venture capitalist
serving on the target firm’s board of directors, documenting a further method venture capitalists
can add value to corporations.

60
Table 2.1: IPOs, Venture Capital Backing, and Deal Activity IPO sample consists of initial public offerings on the NYSE, AMEX, and Nasdaq between January 1, 1985 and December 31, 2009. The firm had to be based in
the United States. I exclude utilities, unit offerings, rights offerings, REITs, and ADRs. I remove IPO firms that had an offer price of less than $5, raised less
than $5 million, or had an unidentifiable PERMNO. The M&A sample consists of transactions announced between January 1, 1985 and May 17, 2010, where
both the acquirer and target must be based in the United States and publicly traded. The deals must have been completed or withdrawn. I eliminate financials
and utilities. A maximum of 5% toehold could have existed prior to announcement, and the acquirer must seek to own 100% of the target after the acquisition.
***, **, and * denote significantly different from zero at the 1, 5, and 10 percent levels respectively (binomial test for difference in proportions).
PANEL A All IPOs VC-Backed IPOs Non-VC-Backed IPOs Difference
# of IPOs 4,819 2,204 2,615
% of IPOs 100% 45.7% 54.3%
# Announced “IPO” Takeovers 1440 814 626
% of Announced “IPO” Takeovers 100% 56.5% 43.5%
# Completed “IPO” Takeovers 1237 719 518
% of Completed “IPO” Takeovers 100% 58.1% 41.9%
Announced Deals / # IPOs 29.9% 36.9% 23.9% 13%***
Completed Deals / Announced Deals 85.9% 88.3% 82.7% 5.6%***
Completed Deals / # IPOs 25.7% 32.6% 19.8% 12.8%***

61
Table 2.1 (cont’d): IPOs, Venture Capital Backing, and Deal Activity IPO sample consists of initial public offerings on the NYSE, AMEX, and Nasdaq between January 1, 1985 and December 31, 2009. The firm had to be based in
the United States. I exclude utilities, unit offerings, rights offerings, REITs, and ADRs. I remove IPO firms that had an offer price of less than $5, raised less
than $5 million, or had an unidentifiable PERMNO. The M&A sample consists of transactions announced between January 1, 1985 and May 17, 2010, where
both the acquirer and target must be based in the United States and publicly traded. The deals must have been completed or withdrawn. I eliminate financials
and utilities. A maximum of 5% toehold could have existed prior to announcement, and the acquirer must seek to own 100% of the target after the acquisition.
***, **, and * denote significantly different from zero at the 1, 5, and 10 percent levels respectively (binomial test for difference in proportions).
PANEL B Announced M&A Deals Completed M&A Deals % Completed
Full M&A Sample 3,381 2,686 79.4%
All Announced "IPO" Takeovers 1,440 1,237 85.9%
% of M&A Sample 42.6% 46.1%
VC-backed IPOs 814 719 88.3%
% of M&A Sample 24.1% 26.8%
Non-VC IPOs 626 518 82.7%
% of M&A Sample 18.5% 19.3%

62
Table 2.2: Venture Capital Backing and Deal Activity Through Time This table show deal activity on the IPO sample both chronologically and in relation to the year following IPO. The IPO sample consists of initial public
offerings on the NYSE, AMEX, and Nasdaq between January 1, 1985 and December 31, 2009. The firm had to be based in the United States. I exclude utilities,
unit offerings, rights offerings, REITs, and ADRs. I remove IPO firms that had an offer price of less than $5, raised less than $5 million, or had an unidentifiable
PERMNO. The M&A sample consists of transactions announced between January 1, 1985 and May 17, 2010, where both the acquirer and target must be based
in the United States and publicly traded. The deals must have been completed or withdrawn. I eliminate financials and utilities. A maximum of 5% toehold
could have existed prior to announcement, and the acquirer must seek to own 100% of the target after the acquisition. ***, **, and * denote significantly
different from zero at the 1, 5, and 10 percent levels respectively (binomial test for difference in proportions). (Begins on following page.)

63
Table 2.2 (Cont’d)
Bids on IPO Sample Completed Acquisitions Bids on IPO Sample Completed Acquisitions
Year Following IPO
Non-VC IPOs VC IPOs Total
Non-VC IPOs VC IPOs All IPOs Year
Non-VC IPOs VC IPOs Total
Non-VC IPOs VC IPOs Total
1 48 75 123 41 74 115
1987 2 3 5 2 3 5
2
85 116 201
77 99 176
1988
13 5 18
9 4 13
3
100 136 236
88 114 202
1989
12 5 17
8 4 12
4
68 93 161
53 79 132
1990
7 5 12
5 5 10
5
53 76 129
44 66 110
1991
2 4 6
1 4 5
6
54 66 120
38 58 96
1992
7 6 13
4 3 7
7
30 58 88
23 54 77
1993
7 14 21
2 11 13
8
29 57 86
22 50 72
1994
23 29 52
17 24 41
9
24 33 57
22 31 53
1995
31 43 74
27 39 66
10
25 17 42
22 15 37
1996
44 41 85
35 33 68
11
29 25 54
21 22 43
1997
58 57 115
46 51 97
12
29 20 49
26 18 44
1998
72 75 147
60 69 129
13
16 10 26
11 10 21
1999
65 95 160
57 84 141
14
6 7 13
5 6 11
2000
60 81 141
52 71 123
15
11 6 17
8 6 14
2001
38 71 109
33 59 92
16
3 9 12
3 8 11
2002
27 43 70
25 38 63
17
9 2 11
7 2 9
2003
19 44 63
18 41 59
18
2 3 5
2 2 4
2004
31 28 59
27 25 52
19
2 1 3
2 1 3
2005
19 40 59
19 36 55
20
1 2 3
1 2 3
2006
32 34 66
27 33 60
21
1 0 1
1 0 1
2007
24 37 61
22 35 57
22
1 0 1
1 0 1
2008
21 28 49
11 23 34
23
0 0 0
0 0 0
2009
10 23 33
9 21 30
24 0 2 2 0 2 2 2010 2 3 5 2 3 5
Total 626 814 1440 518 719 1237 Total 626 814 1440 518 719 1237

64
Figure 2.1: IPOs, Venture Capital Backing, and Acquisition Announcements in Years Following IPO This graph shows the percentage of firms in the IPO sample that that are the target of an acquisition announcement by year following their IPO. The IPO sample
consists of initial public offerings on the NYSE, AMEX, and Nasdaq between January 1, 1985 and December 31, 2009. The firm had to be based in the United
States. I exclude utilities, unit offerings, rights offerings, REITs, and ADRs. I remove IPO firms that had an offer price of less than $5, raised less than $5
million, or had an unidentifiable PERMNO. The M&A sample consists of transactions announced between January 1, 1985 and May 17, 2010, where both the
acquirer and target must be based in the United States and publicly traded. The deals must have been completed or withdrawn. I eliminate financials and
utilities. A maximum of 5% toehold could have existed prior to announcement, and the acquirer must seek to own 100% of the target after the acquisition.
Merging the samples results in 1,440 acquisition announcements of firms in the IPO sample, and 1,237 completed acquisitions of those firms.
0
0.01
0.02
0.03
0.04
0.05
0.06
0.07
1 2 3 4 5 6 7 8 9 10 11 12 13 14 15 16 17 18 19 20 21 22 24
% o
f IP
O S
amp
le R
ece
ivin
g B
ids
Year Following IPO
Bids on Firms in IPO Sample by Year Following IPO
Non-VC IPOs VC IPOs

65
Figure 2.2: Cumulative Total Acquisition Announcements in Years Following IPO IPO sample consists of initial public offerings on the NYSE, AMEX, and Nasdaq between January 1, 1985 and December 31, 2009. The firm had to be based in
the United States. I exclude utilities, unit offerings, rights offerings, REITs, and ADRs. I remove IPO firms that had an offer price of less than $5, raised less
than $5 million, or had an unidentifiable PERMNO. The M&A sample consists of transactions announced between January 1, 1985 and May 17, 2010, where
both the acquirer and target must be based in the United States and publicly traded. The deals must have been completed or withdrawn. I eliminate financials
and utilities. A maximum of 5% toehold could have existed prior to announcement, and the acquirer must seek to own 100% of the target after the acquisition.
Merging the samples results in 1,440 acquisition announcements of firms in the IPO sample, and 1,237 completed acquisitions of those firms.
0.0%
5.0%
10.0%
15.0%
20.0%
25.0%
30.0%
35.0%
40.0%
1 2 3 4 5 6 7 8 9 10 11 12 13 14 15 16 17 18 19 20 21 22 24
Cu
mu
lati
ve %
of
IPO
Sam
ple
Re
ceiv
ing
Bid
s
Year Following IPO
Cumulative % of Bids on IPO Sample by Year Following IPO
Non-VC IPOs VC IPOs

66
Figure 2.3: IPOs, Venture Capital Backing, and Acquisitions in Years Following IPO This graph shows the percentage of firms in the IPO sample that were acquired by year following their IPO, segmented on whether the IPO was VC-backed at
the IPO. The IPO sample consists of initial public offerings on the NYSE, AMEX, and Nasdaq between January 1, 1985 and December 31, 2009. The firm had
to be based in the United States. I exclude utilities, unit offerings, rights offerings, REITs, and ADRs. I remove IPO firms that had an offer price of less than $5,
raised less than $5 million, or had an unidentifiable PERMNO. The M&A sample consists of transactions announced between January 1, 1985 and May 17,
2010, where both the acquirer and target must be based in the United States and publicly traded. The deals must have been completed or withdrawn. I eliminate
financials and utilities. A maximum of 5% toehold could have existed prior to announcement, and the acquirer must seek to own 100% of the target after the
acquisition. Merging the samples results in 1,440 acquisition announcements of firms in the IPO sample, and 1,237 completed acquisitions of those firms.
0
0.01
0.02
0.03
0.04
0.05
0.06
1 2 3 4 5 6 7 8 9 10 11 12 13 14 15 16 17 18 19 20 21 22 24
% o
f IP
O S
amp
le A
cqu
ire
d
Years Following IPO
% of IPO Sample Acquired by year following IPO
Non-VC IPOs VC IPOs

67
Figure 2.4: Cumulative Total Acquisitions in Years Following IPO This graph shows the cumulative percentage of the IPO sample that is acquired in the years following the IPO. IPO sample consists of initial public offerings on
the NYSE, AMEX, and Nasdaq between January 1, 1985 and December 31, 2009. The firm had to be based in the United States. I exclude utilities, unit
offerings, rights offerings, REITs, and ADRs. I remove IPO firms that had an offer price of less than $5, raised less than $5 million, or had an unidentifiable
PERMNO. The M&A sample consists of transactions announced between January 1, 1985 and May 17, 2010, where both the acquirer and target must be based
in the United States and publicly traded. The deals must have been completed or withdrawn. I eliminate financials and utilities. A maximum of 5% toehold
could have existed prior to announcement, and the acquirer must seek to own 100% of the target after the acquisition. Merging the samples results in 1,440
acquisition announcements of firms in the IPO sample, and 1,237 completed acquisitions of those firms.
0.0%
5.0%
10.0%
15.0%
20.0%
25.0%
30.0%
35.0%
1 2 3 4 5 6 7 8 9 10 11 12 13 14 15 16 17 18 19 20 21 22 24
Cu
mu
lati
ve %
of
IPO
Sam
ple
Acq
uir
ed
Year Following IPO
Cumulative % of IPO Sample Acquired
Non-VC IPOs VC IPOs

68
Figure 2.5: Acquisition Announcements on IPO Sample Chronologically This graph shows the number of acquisition announcements made on IPO sample chronologically. IPO sample consists of initial public offerings on the NYSE,
AMEX, and Nasdaq between January 1, 1985 and December 31, 2009. The firm had to be based in the United States. I exclude utilities, unit offerings, rights
offerings, REITs, and ADRs. I remove IPO firms that had an offer price of less than $5, raised less than $5 million, or had an unidentifiable PERMNO. The
M&A sample consists of transactions announced between January 1, 1985 and May 17, 2010, where both the acquirer and target must be based in the United
States and publicly traded. The deals must have been completed or withdrawn. I eliminate financials and utilities. A maximum of 5% toehold could have
existed prior to announcement, and the acquirer must seek to own 100% of the target after the acquisition. Merging the samples results in 1,440 acquisition
announcements of firms in the IPO sample, and 1,237 completed acquisitions of those firms.
0
10
20
30
40
50
60
70
80
90
100
1987 1988 1989 1990 1991 1992 1993 1994 1995 1996 1997 1998 1999 2000 2001 2002 2003 2004 2005 2006 2007 2008 2009 2010
# o
f A
cqu
isit
ion
An
no
un
cem
en
ts o
n IP
O S
amp
le
Year
Bids on IPO Sample Chronologically
Non-VC IPOs VC IPOs

69
Figure 2.6: Cumulative Total Bids in Years Following IPO, Technology Firms This graph shows the percentage of firms in the IPO sample that were acquired by year following their IPO, segmented on whether the IPO was VC-backed at
the IPO. IPO sample consists of initial public offerings on the NYSE, AMEX, and Nasdaq between January 1, 1985 and December 31, 2009. The firm had to be
based in the United States. I exclude utilities, unit offerings, rights offerings, REITs, and ADRs. I remove IPO firms that had an offer price of less than $5,
raised less than $5 million, or had an unidentifiable PERMNO. The M&A sample consists of transactions announced between January 1, 1985 and May 17,
2010, where both the acquirer and target must be based in the United States and publicly traded. The deals must have been completed or withdrawn. I eliminate
financials and utilities. A maximum of 5% toehold could have existed prior to announcement, and the acquirer must seek to own 100% of the target after the
acquisition. Merging the samples results in 1,404 acquisition announcements of firms in the IPO sample, and 1,216 completed acquisitions of those firms. High-
tech is defined as operating in the following SIC codes: 283,481,365,366,367,368,369,482,483,484,485,486,487,488,489,357,or 737.
0
0.05
0.1
0.15
0.2
0.25
0.3
0.35
1 2 3 4 5 6 7 8 9 10
Cu
mu
lati
ve %
of
IPO
s
Year Following IPO
Cummulative % of Tech IPOs Receiving Bids by Year Following IPO
Non-VC IPOs
VC-backed IPOs

70
Figure 2.7: Cumulative Total Bids in Years Following IPO, Non-Technology Firms This graph shows the percentage of firms in the IPO sample that were acquired by year following their IPO, segmented on whether the IPO was VC-backed at
the IPO. IPO sample consists of initial public offerings on the NYSE, AMEX, and Nasdaq between January 1, 1985 and December 31, 2009. The firm had to be
based in the United States. I exclude utilities, unit offerings, rights offerings, REITs, and ADRs. I remove IPO firms that had an offer price of less than $5,
raised less than $5 million, or had an unidentifiable PERMNO. The M&A sample consists of transactions announced between January 1, 1985 and May 17,
2010, where both the acquirer and target must be based in the United States and publicly traded. The deals must have been completed or withdrawn. I eliminate
financials and utilities. A maximum of 5% toehold could have existed prior to announcement, and the acquirer must seek to own 100% of the target after the
acquisition. Merging the samples results in 1,404 acquisition announcements of firms in the IPO sample, and 1,216 completed acquisitions of those firms. High-
tech is defined as operating in the following SIC codes: 283,481,365,366,367,368,369,482,483,484,485,486,487,488,489,357,or 737.
0
0.05
0.1
0.15
0.2
0.25
0.3
0.35
1 2 3 4 5 6 7 8 9 10
Cu
mu
lati
ve %
of
IPO
s
Year Following IPO
Cummulative % of Non-tech IPOs Receiving Bids by Year Following IPO
Non-VC
VC

71
Figure 2.8: Cumulative Total Completed Acquisitions in Years Following IPO, Technology Firms This graph shows the percentage of firms in the IPO sample that were acquired by year following their IPO, segmented on whether the IPO was VC-backed at
the IPO. IPO sample consists of initial public offerings on the NYSE, AMEX, and Nasdaq between January 1, 1985 and December 31, 2009. The firm had to be
based in the United States. I exclude utilities, unit offerings, rights offerings, REITs, and ADRs. I remove IPO firms that had an offer price of less than $5,
raised less than $5 million, or had an unidentifiable PERMNO. The M&A sample consists of transactions announced between January 1, 1985 and May 17,
2010, where both the acquirer and target must be based in the United States and publicly traded. The deals must have been completed or withdrawn. I eliminate
financials and utilities. A maximum of 5% toehold could have existed prior to announcement, and the acquirer must seek to own 100% of the target after the
acquisition. Merging the samples results in 1,404 acquisition announcements of firms in the IPO sample, and 1,216 completed acquisitions of those firms. High-
tech is defined as operating in the following SIC codes: 283,481,365,366,367,368,369,482,483,484,485,486,487,488,489,357,or 737.
0.00
0.05
0.10
0.15
0.20
0.25
0.30
0.35
1 2 3 4 5 6 7 8 9 10
Cu
mu
lati
ve %
of
IPO
s
Year Following IPO
Cummulative % of Tech IPOs Acquired by Year Following IPO
Non-VC
VC

72
Figure 2.9: Cumulative Total Completed Acquisitions in Years Following IPO, Non-Technology Firms This graph shows the percentage of firms in the IPO sample that were acquired by year following their IPO, segmented on whether the IPO was VC-backed at
the IPO. IPO sample consists of initial public offerings on the NYSE, AMEX, and Nasdaq between January 1, 1985 and December 31, 2009. The firm had to be
based in the United States. I exclude utilities, unit offerings, rights offerings, REITs, and ADRs. I remove IPO firms that had an offer price of less than $5,
raised less than $5 million, or had an unidentifiable PERMNO. The M&A sample consists of transactions announced between January 1, 1985 and May 17,
2010, where both the acquirer and target must be based in the United States and publicly traded. The deals must have been completed or withdrawn. I eliminate
financials and utilities. A maximum of 5% toehold could have existed prior to announcement, and the acquirer must seek to own 100% of the target after the
acquisition. Merging the samples results in 1,404 acquisition announcements of firms in the IPO sample, and 1,216 completed acquisitions of those firms. High-
tech is defined as operating in the following SIC codes: 283,481,365,366,367,368,369,482,483,484,485,486,487,488,489,357,or 737.
0
0.05
0.1
0.15
0.2
0.25
0.3
1 2 3 4 5 6 7 8 9 10
Cu
mu
lati
ve %
of
IPO
s
Year Following IPO
Cummulative % of Non-Tech IPOs Acquired by Year Following IPO
Non-VC
VC

73
Table 2.3: Venture Capital Backing and Percentage of Firm Sold in IPO VC equals 1 if the firm had venture capital backing at the IPO. High-tech equals 1 if the firm operates in the following SIC codes: 283, 481, 365, 366, 367, 368,
369, 482, 483, 484, 485, 486, 487, 488, 489, 357, or 737. Less than 10% sold in the IPO equals 1 if the firm sold less than 10% of their equity in the IPO. ***,
**, and * denote significance at the 1, 5, and 10 percent levels respectively.
VC-backed Non-VC Backed Difference
Average Percent Sold in IPO 27.82% 37.99% 10.17% ***
Sell Less than 10% 4.30% 2% 2.30% ***
Sell Less than 15% 13.81% 7.21% 6.60% ***
Sell Less than 25% 45.59% 28.10% 17.49% ***
n 2244 2648
High Tech Non Tech
VC-backed Non-VC Backed Difference VC-backed Non-VC Backed Difference
Average Percent Sold in IPO 25.29% 35.20% -9.91% ***
31.81% 38.95% -7.14% ***
Sell Less than 10% 5.68% 3.53% 2.15% **
2.07% 1.52% 0.54%
Sell Less than 15% 17.92% 11.19% 6.72% ***
7.35% 5.84% 1.51%
Sell Less than 25% 54.62% 35.49% 19.13% ***
31.34% 25.55% 5.80% ***
n 1373 679 871 1968

74
Table 2.4a: Venture Capital Backing and Likelihood of an Acquisition Attempt Logistic regression in which the depenent variable equals 1 if the IPO firm is at some point the target of an acquisition attempt. Each regression includes fixed
year effect dummy variables. VC equals 1 if the firm had venture capital backing at the IPO. High-tech equals 1 if the firm operates in the following SIC codes:
283,481,365,366,367,368,369,482,483,484,485,486,487,488,489,357,or 737. Less than 10% sold in the IPO equals 1 if the firm sold less than 10% of their equity
in the IPO. Market Cap is the natural log of the firm’s market cap in 2007 dollars. Leverage is the ratio of the total book value of debt to total assets at the time
of the IPO. Market to book is the ratio of the market cap at the first day close to the book value of equity at the IPO. Property is the ratio of net property, plant,
and equipment to total assets at the time of the IPO. Liquidity is the ratio of current assets minus current liabilities to total assets at the time of the IPO. ***, **,
and * denote significance at the 1, 5, and 10 percent levels respectively.
Model 1 Model 2 Model 3
Coef. Estimate p-value Coef. Estimate p-value Coef. Estimate p-value
VC
0.509 *** <.0001
0.512 *** <.0001
High Tech
0.324 *** <.0001
0.327 *** <.0001
Less than 10% Sold in IPO
-0.464 ** 0.027
Market Cap 0.119 *** 0.000 0.089 *** 0.008
0.113 *** 0.001
Leverage -0.312 * 0.090 -0.295 0.102
-0.309 * 0.088
Market to Book 0.000 0.620 0.000 0.676
0.000 0.663
Property -0.140 0.527 0.069 0.758
0.065 0.773
Liquidity 0.411 *** 0.008 0.029 0.857
0.025 0.875
Intercept -2.248 *** <.0001 -2.084 *** <.0001
-2.360 *** <.0001
Likelihood Ratio Test Statistic 220.71 ***
303.81 ***
308.96 ***
Max Rescaled R2 0.07
0.09
0.09
n 4662
4662
4662
Acquisition Attempts ("1") 1380
1380
1380
No Bids Made ("0") 3282 3282 3282

75
Table 2.4b: Venture Capital Backing and Likelihood of Being Acquired Logistic regression in which the depenent variable equals 1 if the IPO firm is at some point acquired. Each regression includes fixed year effect dummy
variables. VC equals 1 if the firm had venture capital backing at the IPO. High-tech equals 1 if the firm operates in the following SIC codes:
283,481,365,366,367,368,369,482,483,484,485,486,487,488,489,357,or 737. Less than 10% sold in the IPO equals 1 if the firm sold less than 10% of their equity
in the IPO. Market Cap is the natural log of the firm’s market cap in 2007 dollars. Leverage is the ratio of the total book value of debt to total assets at the time
of the IPO. Market to book is the ratio of the market cap at the first day close to the book value of equity at the IPO. Property is the ratio of net property, plant,
and equipment to total assets at the time of the IPO. Liquidity is the ratio of current assets minus current liabilities to total assets at the time of the IPO. ***, **,
and * denote significance at the 1, 5, and 10 percent levels respectively.
Model 1 Model 2 Model 3
Coef. Estimate p-value Coef. Estimate p-value Coef. Estimate p-value
VC
0.513 *** <.0001
0.517 *** <.0001
High Tech
0.337 *** <.0001
0.340 *** <.0001
Less than 10% Sold in IPO
-0.586 *** 0.009
Market Cap 0.114 *** 0.001 0.083 ** 0.019
0.114 *** 0.002
Leverage -0.218 0.244 -0.200
0.274
-0.217 0.237
Market to Book 0.000 0.608 0.000
0.655
0.000 0.643
Property -0.170 0.468 0.050
0.834
0.044 0.854
Liquidity 0.539 *** 0.001 0.150
0.370
0.145 0.385
Intercept -2.555 *** <.0001 -2.385 *** <.0001
-2.732 *** <.0001
Likelihood Ratio Test Statistic 191.146 ***
270.491 ***
277.898 ***
Max Rescaled R2 0.06
0.08
0.09
n 4662
4662
4662
Acquired ("1") 1198
1198
1198
Not Acquired ("0") 3464 3464 3464

76
Table 2.4c: Venture Capital Backing and Likelihood of An Acquisition Attempt Within 3 years of the IPO Logistic regression in which the depenent variable equals 1 if the IPO firm is acquired within 3 years of their respective IPO. Each regression includes fixed year
effect dummy variables. VC equals 1 if the firm had venture capital backing at the IPO. High-tech equals 1 if the firm operates in the following SIC codes:
283,481,365,366,367,368,369,482,483,484,485,486,487,488,489,357,or 737. Less than 10% sold in the IPO equals 1 if the firm sold less than 10% of their equity
in the IPO. Market Cap is the natural log of the firm’s market cap in 2007 dollars. Leverage is the ratio of the total book value of debt to total assets at the time
of the IPO. Market to book is the ratio of the market cap at the first day close to the book value of equity at the IPO. Property is the ratio of net property, plant,
and equipment to total assets at the time of the IPO. Liquidity is the ratio of current assets minus current liabilities to total assets at the time of the IPO. ***, **,
and * denote significance at the 1, 5, and 10 percent levels respectively.
Model 1 Model 2 Model 3
Coef. Estimate p-value Coef. Estimate p-value Coef. Estimate p-value
VC
0.4463 *** <.0001
0.4507 *** <.0001
High Tech
0.0907
0.3912
0.0939 0.375
Less than 10% Sold in IPO
-0.4183 0.1408
Market Cap 0.0689 0.1307 0.0501
0.2852
0.0738 0.1359
Leverage -0.0406 0.8488 -0.0338
0.8701
-0.0446 0.8302
Market to Book -0.00035 0.5927 -0.0003
0.6353
-0.00029 0.6345
Property -0.3783 0.2332 -0.2641
0.4107
-0.2731 0.3953
Liquidity 0.1398 0.5041 -0.1185
0.5825
-0.1232 0.568
Intercept -3.6455 *** <.0001 -3.5587 *** <.0001
-3.8268 *** <.0001
Likelihood Ratio Test Statistic 116.8936 ***
138.3374 *** <.0001
140.6652 ***
Max Rescaled R2 0.05
0.06
0.06
n 4662
4662
4662
Acquired with 3 years ("1") 539
539
539
Not Acquired within 3 years ("0") 4123 4123 4123

77
Table 2.5: IPOs, Venture Capital, and Announcement Returns to Acquisition Targets in IPO Sample IPO sample consists of initial public offerings on the NYSE, AMEX, and Nasdaq between January 1, 1985 and December 31, 2009. The firm had to be based in
the United States. I exclude utilities, unit offerings, rights offerings, REITs, and ADRs. I remove IPO firms that had an offer price of less than $5, raised less
than $5 million, or had an unidentifiable PERMNO. The M&A sample consists of transactions announced between January 1, 1985 and May 17, 2010, where
both the acquirer and target must be based in the United States and publicly traded. The deals must have been completed or withdrawn. I eliminate financials
and utilities. A maximum of 5% toehold could have existed prior to announcement, and the acquirer must seek to own 100% of the target after the acquisition.
Merging the samples results in 1,404 acquisition announcements of firms in the IPO sample, and 1,216 completed acquisitions of those firms. ***, **, and *
denote significance at the 1, 5, and 10 percent levels respectively.
Market Adjusted Returns CARs on Full Sample (All Bids), n=1404
Equal Weighted Index VC-Backed Non-VC Backed Difference p-value
(-2,+2) 25.77 22.33 3.44** 0.024
(-10,+2) 30.17 26.62 3.55** 0.025
(-40,-10) 3.21 4.90 -1.69 0.188
Value Weighted Index VC-Backed Non-VC Backed Difference p-value
(-2,+2) 25.99 22.53 3.46** 0.024
(-10,+2) 30.8 27.19 3.61** 0.024
(-40,-10) 5.12 6.36 -1.24 0.339
Market Adjusted Returns CARs on Completed Acquisitions, n=1216
Equal Weighted Index VC-Backed Non-VC Backed Difference p-value
(-2,+2) 26.36 23.97 2.39 0.15
(-10,+2) 30.91 28.12 2.79 0.10
(-40,-10) 3.82 5.40 -1.58 0.25
Value Weighted Index VC-Backed Non-VC Backed Difference p-value
(-2,+2) 26.58 24.18 2.40 0.15
(-10,+2) 31.50 28.69 2.82 0.10
(-40,-10) 5.68 6.97 -1.29 0.35

78
Table 2.6a: Acquisition Announcement Returns to Bids on Recent IPOs (VC vs. Non-VC) IPO sample consists of initial public offerings on the NYSE, AMEX, and Nasdaq between January 1, 1985 and December 31, 2009. The firm had to be based in
the United States. I exclude utilities, unit offerings, rights offerings, REITs, and ADRs. I remove IPO firms that had an offer price of less than $5, raised less
than $5 million, or had an unidentifiable PERMNO. The M&A sample consists of transactions announced between January 1, 1985 and May 17, 2010, where
both the acquirer and target must be based in the United States and publicly traded. The deals must have been completed or withdrawn. I eliminate financials
and utilities. A maximum of 5% toehold could have existed prior to announcement, and the acquirer must seek to own 100% of the target after the acquisition.
Merging the samples results in 1,404 acquisition announcements of firms in the IPO sample, and 1,216 completed acquisitions of those firms. ***, **, and *
denote significance at the 1, 5, and 10 percent levels respectively.
Mean Target CARs in Bids on Recent IPOs
(Equal Weighted Market Adjusted Returns)
Received Bid Within 1 Year of IPO
(n=123)
Received Bid Within 3 Years of IPO
(n=545)
Received Bid Within 5 Years of IPO
(n=828)
VC-Backed Non-VC Difference VC-Backed Non-VC Difference VC-Backed Non-VC Difference
N 73 50 313 232 478 350
(-2,+2) Window 22.54% 20.01% 2.53% 25.08% 22.37% 2.71% 26.13% 22.52% 3.61%*
(-10,+2) Window 28.44% 22.96% 5.48% 30.54% 26.75% 3.80% 31.02% 27.36% 3.66%*
(-40,-10) Window 0.02% -0.50% 0.51% 2.10% 4.37% -2.27% 2.64% 4.78% -2.14%
Mean Target CARs in Bids on Recent IPOs
(Value Weighted Market Adjusted Returns)
Received Bid Within 1 Year of IPO
(n=123)
Received Bid Within 3 Years of IPO
(n=545)
Received Bid Within 5 Years of IPO
(n=828)
VC-Backed Non-VC Difference VC-Backed Non-VC Difference VC-Backed Non-VC Difference
N 73 50 313 232 478 350
(-2,+2) Window 22.53% 20.35% 2.18% 25.23% 22.65% 2.58% 26.29% 22.69% 3.60%*
(-10,+2) Window 29.12% 23.80% 5.32% 31.12% 27.33% 3.80% 31.60% 27.88% 3.72%*
(-40,-10) Window 2.07% 0.25% 1.82% 3.95% 5.67% -1.72% 4.57% 6.17% -1.60%

79
Table 2.6b: Acquisition Announcement Returns to Completed Acquisitions of Recent IPOs (VC vs. Non-VC) IPO sample consists of initial public offerings on the NYSE, AMEX, and Nasdaq between January 1, 1985 and December 31, 2009. The firm had to be based in
the United States. I exclude utilities, unit offerings, rights offerings, REITs, and ADRs. I remove IPO firms that had an offer price of less than $5, raised less
than $5 million, or had an unidentifiable PERMNO. The M&A sample consists of transactions announced between January 1, 1985 and May 17, 2010, where
both the acquirer and target must be based in the United States and publicly traded. The deals must have been completed or withdrawn. I eliminate financials
and utilities. A maximum of 5% toehold could have existed prior to announcement, and the acquirer must seek to own 100% of the target after the acquisition.
Merging the samples results in 1,404 acquisition announcements of firms in the IPO sample, and 1,216 completed acquisitions of those firms. ***, **, and *
denote significance at the 1, 5, and 10 percent levels respectively.
Mean Target CARs in Completed Acquisitions on Recent IPOs
(Equal Weighted Market Adjusted Returns)
Acquired Within 1 Year of IPO
(n=116)
Acquired Within 3 Years of IPO
(n=483)
Acquired Within 5 Years of IPO
(n=721)
VC-Backed Non-VC Difference VC-Backed Non-VC Difference VC-Backed Non-VC Difference
N 73 43 277 206 420 301
(-2,+2) Window 22.54% 20.61% 1.94% 25.76% 23.64% 2.12% 27.08% 24.59% 2.49%
(-10,+2) Window 28.44% 23.05% 5.40% 31.25% 27.83% 3.43% 31.93% 29.27% 2.66%
(-40,-10) Window 0.02% 0.79% -0.78% 2.52% 5.38% 2.86% 3.49% 5.44% -1.95%
Mean Target CARs in Completed Acquisitions on Recent IPOs
(Value Weighted Market Adjusted Returns)
Acquired Within 1 Year of IPO
(n=116)
Acquired Within 3 Years of IPO
(n=483)
Acquired Within 5 Years of IPO
(n=721)
VC-Backed Non-VC Difference VC-Backed Non-VC Difference VC-Backed Non-VC Difference
N 73 43 277 206
420 301
(-2,+2) Window 22.53% 20.99% 1.54% 25.91% 23.94% 1.97% 27.24% 24.79% 2.45%
(-10,+2) Window 29.12% 23.83% 5.29% 31.82% 28.42% 3.40% 32.47% 29.81% 2.66%
(-40,-10) Window 2.07% 1.46% 0.61% 4.22% 6.82% -2.59% 5.29% 6.99% -1.70%

80
Table 2.6c: Acquisition Announcement Returns to Bids on Recent IPOs (Tech vs. Non-Tech) IPO sample consists of initial public offerings on the NYSE, AMEX, and Nasdaq between January 1, 1985 and December 31, 2009. The firm had to be based in
the United States. I exclude utilities, unit offerings, rights offerings, REITs, and ADRs. I remove IPO firms that had an offer price of less than $5, raised less
than $5 million, or had an unidentifiable PERMNO. The M&A sample consists of transactions announced between January 1, 1985 and May 17, 2010, where
both the acquirer and target must be based in the United States and publicly traded. The deals must have been completed or withdrawn. I eliminate financials and
utilities. High-tech is defined as operating in the following SIC codes: 283,481,365,366,367,368,369,482,483,484,485,486,487,488,489,357,or 737. A maximum of 5%
toehold could have existed prior to announcement, and the acquirer must seek to own 100% of the target after the acquisition. Merging the samples results in
1,404 acquisition announcements of firms in the IPO sample, and 1,216 completed acquisitions of those firms. ***, **, and * denote significance at the 1, 5, and
10 percent levels respectively.
Mean Target CARs in Bids on Recent IPOs
(Equal Weighted Market Adjusted Returns)
Acquired Within 1 Year of IPO
(n=123)
Acquired Within 3 Years of IPO
(n=545)
Acquired Within 5 Years of IPO
(n=828)
Tech Non-Tech Difference Tech Non-Tech Difference Tech Non-Tech Difference
N 67 56 273 272 417 411
(-2,+2) Window 24.46% 17.99% 6.47% 0.2578 0.2206 0.0371 27.01% 22.16% 4.86%**
(-10,+2) Window 30.88% 20.63% 10.25%** 0.3149 0.2636 5.13%* 32.43% 26.47% 5.96%***
(-40,-10) Window 3.37% -4.46% 7.83% 0.0516 0.00966 4.20%* 5.49% 1.57% 3.93%**
Mean Target CARs in Bids on Recent IPOs
(Value Weighted Market Adjusted Returns)
Acquired Within 1 Year of IPO
(n=123)
Acquired Within 3 Years of IPO
(n=545)
Acquired Within 5 Years of IPO
(n=828)
Tech Non-Tech Difference Tech Non-Tech Difference Tech Non-Tech Difference
N 67 56 273 272 417 411
(-2,+2) Window 24.55% 18.16% 6.39% 26.05% 22.21% 3.84% 27.28% 22.22% 5.06%**
(-10,+2) Window 31.83% 21.13% 10.70%** 32.36% 26.65% 5.71%** 33.29% 26.73% 6.56%***
(-40,-10) Window 5.60% -3.79% 9.39%* 7.22% 2.12% 5.10%** 7.59% 2.86% 4.73%***

81
Table 2.6d: Acquisition Announcement Returns to Completed Acquisitions of Recent IPOs (Tech vs. Non-Tech) IPO sample consists of initial public offerings on the NYSE, AMEX, and Nasdaq between January 1, 1985 and December 31, 2009. The firm had to be based in
the United States. I exclude utilities, unit offerings, rights offerings, REITs, and ADRs. I remove IPO firms that had an offer price of less than $5, raised less
than $5 million, or had an unidentifiable PERMNO. The M&A sample consists of transactions announced between January 1, 1985 and May 17, 2010, where
both the acquirer and target must be based in the United States and publicly traded. The deals must have been completed or withdrawn. I eliminate financials
and utilities. High-tech is defined as operating in the following SIC codes: 283,481,365,366,367,368,369,482,483,484,485,486,487,488,489,357,or 737. A maximum of
5% toehold could have existed prior to announcement, and the acquirer must seek to own 100% of the target after the acquisition. Merging the samples results in
1,404 acquisition announcements of firms in the IPO sample, and 1,216 completed acquisitions of those firms. ***, **, and * denote significance at the 1, 5, and
10 percent levels respectively.
Mean Target CARs in Completed Acquisitions on Recent IPOs
(Equal Weighted Market Adjusted Returns)
Acquired Within 1 Year of IPO
(n=116)
Acquired Within 3 Years of IPO
(n=483)
Acquired Within 5 Years of IPO
(n=721)
Tech Non-Tech Difference Tech Non-Tech Difference Tech Non-Tech Difference
N 64 52 245 238 370 351
(-2,+2) Window 24.83% 18.13% 6.69% 27.11% 22.54% 4.57%* 28.27% 23.69% 4.58%**
(-10,+2) Window 31.23% 20.55% 10.68%** 33.04% 26.45% 6.59%** 33.68% 27.81% 5.87%**
(-40,-10) Window 2.75% -2.71% 5.46% 5.62% 1.79% 3.83%* 6.23% 2.27% 3.96%**
Mean Target CARs in Completed Acquisitions on Recent IPOs
(Value Weighted Market Adjusted Returns)
Acquired Within 1 Year of IPO
(n=116)
Acquired Within 3 Years of IPO
(n=483)
Acquired Within 5 Years of IPO
(n=721)
Tech Non-Tech Difference Tech Non-Tech Difference Tech Non-Tech Difference
N 64 52 245 238 370 351
(-2,+2) Window 24.94% 18.29% 6.65% 27.38% 22.68% 4.70%* 28.54% 23.77% 4.77%**
(-10,+2) Window 32.12% 21.05% 11.07%** 33.90% 26.74% 7.16%** 34.50% 28.04% 6.46%***
(-40,-10) Window 4.97% -2.00% 6.97% 7.65% 2.94% 4.72%** 8.32% 3.55% 4.77%**

82
Table 2.6e: Acquisition Announcement Returns to Completed Acquisitions of Recent IPOs (High Tech Only) IPO sample consists of initial public offerings on the NYSE, AMEX, and Nasdaq between January 1, 1985 and December 31, 2009. The firm had to be based in
the United States. I exclude utilities, unit offerings, rights offerings, REITs, and ADRs. I remove IPO firms that had an offer price of less than $5, raised less
than $5 million, or had an unidentifiable PERMNO. The M&A sample consists of transactions announced between January 1, 1985 and May 17, 2010, where
both the acquirer and target must be based in the United States and publicly traded. The deals must have been completed or withdrawn. I eliminate financials
and utilities. High-tech is defined as operating in the following SIC codes: 283,481,365,366,367,368,369,482,483,484,485,486,487,488,489,357,or 737. A maximum of
5% toehold could have existed prior to announcement, and the acquirer must seek to own 100% of the target after the acquisition. Merging the samples results in
1,404 acquisition announcements of firms in the IPO sample, and 1,216 completed acquisitions of those firms. ***, **, and * denote significance at the 1, 5, and
10 percent levels respectively.
Mean Target CARs in Completed Acquisitions on High Tech IPOs
(Equal Weighted Market Adjusted Returns)
Acquired Within 1 Year of IPO
(n=64)
Acquired Within 3 Years of IPO
(n=245)
Acquired Within 5 Years of IPO
(n=370)
VC-Backed Non-VC Difference VC-Backed Non-VC Difference VC-
Backed Non-VC Difference
N 49 15 178 67 265 105
(-2,+2) Window 25.86% 21.43% 4.43% 25.92% 30.26% -4.34% 27.35% 30.60% -3.24%
(-10,+2) Window 32.55% 26.92% 5.63% 32.30% 35.00% -2.71% 32.61% 36.37% -3.75%
(-40,-10) Window 3.76% -0.54% 4.30% 4.50% 8.61% -4.11% 5.84% 7.21% -1.37%
Mean Target CARs in Completed Acquisitions on High Tech IPOs
(Value Weighted Market Adjusted Returns)
Acquired Within 1 Year of IPO
(n=64)
Acquired Within 3 Years of IPO
(n=245)
Acquired Within 5 Years of IPO
(n=370)
VC-Backed Non-VC Difference VC-Backed Non-VC Difference VC-
Backed Non-VC Difference
N 49 15 178 67 265 105
(-2,+2) Window 25.98% 21.54% 4.44% 26.17% 30.60% -4.43% 27.59% 30.94% -3.35%
(-10,+2) Window 33.45% 27.78% 5.67% 33.02% 36.22% -3.20% 33.31% 37.51% -4.20%
(-40,-10) Window 6.49% 0.00% 6.49% 6.65% 10.33% -3.69% 8.06% 8.96% -0.90%

83
Table 2.6f: Acquisition Announcement Returns to Completed Acquisitions of Recent IPOs (Non-Tech Only) IPO sample consists of initial public offerings on the NYSE, AMEX, and Nasdaq between January 1, 1985 and December 31, 2009. The firm had to be based in
the United States. I exclude utilities, unit offerings, rights offerings, REITs, and ADRs. I remove IPO firms that had an offer price of less than $5, raised less
than $5 million, or had an unidentifiable PERMNO. The M&A sample consists of transactions announced between January 1, 1985 and May 17, 2010, where
both the acquirer and target must be based in the United States and publicly traded. The deals must have been completed or withdrawn. I eliminate financials
and utilities. High-tech is defined as operating in the following SIC codes: 283,481,365,366,367,368,369,482,483,484,485,486,487,488,489,357,or 737. A maximum of
5% toehold could have existed prior to announcement, and the acquirer must seek to own 100% of the target after the acquisition. Merging the samples results in
1,404 acquisition announcements of firms in the IPO sample, and 1,216 completed acquisitions of those firms. ***, **, and * denote significance at the 1, 5, and
10 percent levels respectively.
Mean Target CARs in Completed Acquisitions on Non-Tech IPOs
(Equal Weighted Market Adjusted Returns)
Acquired Within 1 Year of IPO
(n=52)
Acquired Within 3 Years of IPO
(n=238)
Acquired Within 5 Years of IPO
(n=351)
VC-Backed Non-VC Difference VC-Backed Non-VC Difference VC-
Backed Non-VC Difference
N 24 28 99 139 155 196
(-2,+2) Window 15.76% 20.16% -4.40% 25.47% 20.44% 5.03% 26.63% 21.37% 5.25%
(-10,+2) Window 20.06% 20.97% -0.91% 29.38% 24.37% 5.01% 30.76% 25.47% 5.29%
(-40,-10) Window -7.63% 1.51% -9.14% -1.05% 3.82% -4.88% -0.54% 4.49% -5.03%**
Mean Target CARs in Completed Acquisitions on Non-Tech IPOs
(Value Weighted Market Adjusted Returns)
Acquired Within 1 Year of IPO
(n=52)
Acquired Within 3 Years of IPO
(n=238)
Acquired Within 5 Years of IPO
(n=351)
VC-Backed Non-VC Difference VC-Backed Non-VC Difference VC-
Backed Non-VC Difference
N 24 28 99 139 155 196
(-2,+2) Window 15.48% 20.69% -5.21% 25.44% 20.72% 4.71% 26.64% 21.50% 5.14%
(-10,+2) Window 20.28% 21.71% -1.43% 29.66% 24.66% 5.00% 31.03% 25.68% 5.35%
(-40,-10) Window -6.96% 2.25% -9.21% -0.13% 5.12% -5.25% 0.54% 5.93% -5.39%**

84
Table 2.7a: VCs, Board Presence, and Announcement Returns to IPOs Receiving Bids within 3 years of IPO IPO sample consists of initial public offerings on the NYSE, AMEX, and Nasdaq between January 1, 1985 and December 31, 2009. The firm had to be based in
the United States. I exclude utilities, unit offerings, rights offerings, REITs, and ADRs. I remove IPO firms that had an offer price of less than $5, raised less
than $5 million, or had an unidentifiable PERMNO. The M&A sample consists of transactions announced between January 1, 1985 and May 17, 2010, where
both the acquirer and target must be based in the United States and publicly traded. The deals must have been completed or withdrawn. I eliminate financials
and utilities. A maximum of 5% toehold could have existed prior to announcement, and the acquirer must seek to own 100% of the target after the acquisition. I
hand collect board and ownership data from EDGAR for firms acquired with 3 years of their respective IPO to determine if the lead VC continues to maintain a
board seat from the IPO through the acquisition. ***, **, and * denote significance at the 1, 5, and 10 percent levels respectively.
Mean Announcement CARs [-10,+2] Value Weighted Index VC-backed (n=313) Non VC-backed (n=232) Difference
VC On Board (n=177) 35.08% 27.33%
7.75%**
VC Not On Board (n=25) 28.16% 0.83%
Difference 6.92%
VC-backed, But Board Information Unidentifiable (n=111) 25.48%
Mean Announcement CARs [-2,+2] Value Weighted Index VC-backed (n=313) Non VC-backed (n=232) Difference
VC On Board (n=177) 27.89% 22.65%
5.24%*
VC Not On Board (n=25) 28.89% 6.24%
Difference -1.01%
VC-backed, But Board Information Unidentifiable (n=111) 20.17%
Mean Announcement CARs [-10,+2] Equal Weighted Index VC-backed (n=313) Non VC-backed (n=232) Difference
VC On Board (n=177) 34.30% 26.75%
7.55%**
VC Not On Board (n=25) 27.81% 1.06%
Difference 6.49%
VC-backed, But Board Information Unidentifiable (n=111) 25.17%
Mean Announcement CARs [-2,+2] Equal Weighted Index VC-backed (n=313) Non VC-backed (n=232) Difference
VC On Board (n=177) 27.62% 22.37%
5.25%*
VC Not On Board (n=25) 28.82% 6.45%
Difference -1.20%
VC-backed, But Board Information Unidentifiable (n=111) 20.19%
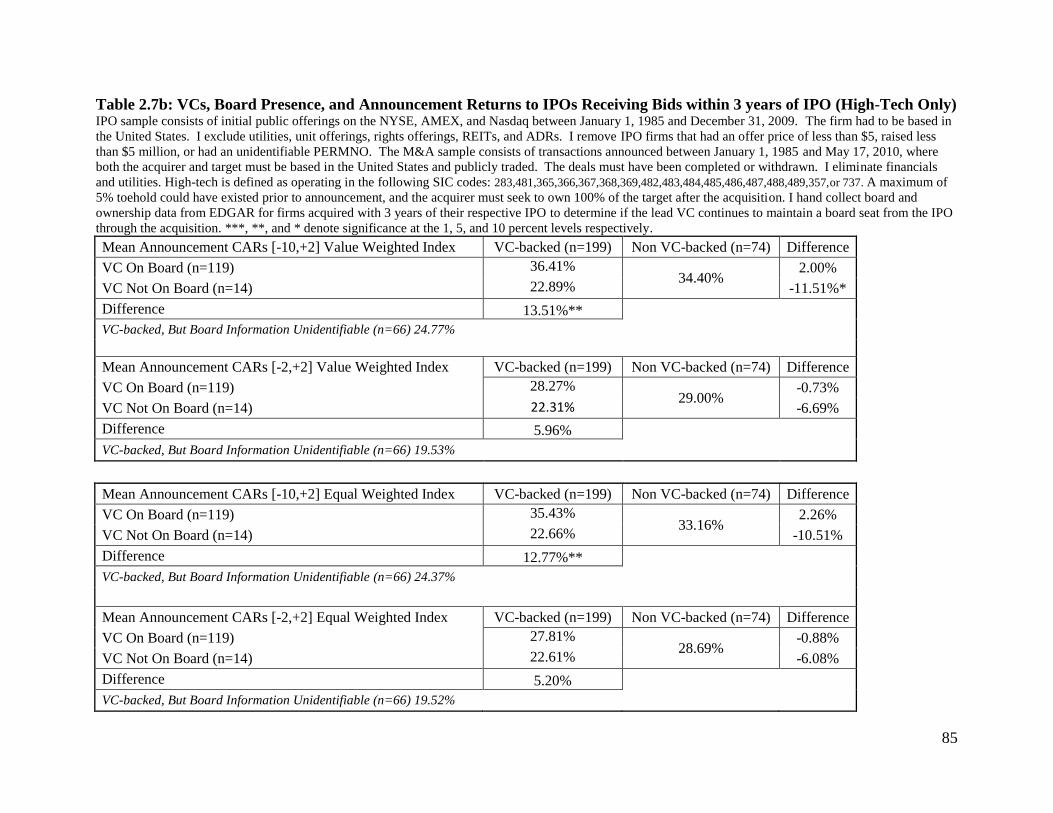
85
Table 2.7b: VCs, Board Presence, and Announcement Returns to IPOs Receiving Bids within 3 years of IPO (High-Tech Only) IPO sample consists of initial public offerings on the NYSE, AMEX, and Nasdaq between January 1, 1985 and December 31, 2009. The firm had to be based in
the United States. I exclude utilities, unit offerings, rights offerings, REITs, and ADRs. I remove IPO firms that had an offer price of less than $5, raised less
than $5 million, or had an unidentifiable PERMNO. The M&A sample consists of transactions announced between January 1, 1985 and May 17, 2010, where
both the acquirer and target must be based in the United States and publicly traded. The deals must have been completed or withdrawn. I eliminate financials
and utilities. High-tech is defined as operating in the following SIC codes: 283,481,365,366,367,368,369,482,483,484,485,486,487,488,489,357,or 737. A maximum of
5% toehold could have existed prior to announcement, and the acquirer must seek to own 100% of the target after the acquisition. I hand collect board and
ownership data from EDGAR for firms acquired with 3 years of their respective IPO to determine if the lead VC continues to maintain a board seat from the IPO
through the acquisition. ***, **, and * denote significance at the 1, 5, and 10 percent levels respectively.
Mean Announcement CARs [-10,+2] Value Weighted Index VC-backed (n=199) Non VC-backed (n=74) Difference
VC On Board (n=119) 36.41% 34.40%
2.00%
VC Not On Board (n=14) 22.89% -11.51%*
Difference 13.51%**
VC-backed, But Board Information Unidentifiable (n=66) 24.77%
Mean Announcement CARs [-2,+2] Value Weighted Index VC-backed (n=199) Non VC-backed (n=74) Difference
VC On Board (n=119) 28.27% 29.00%
-0.73%
VC Not On Board (n=14) 22.31% -6.69%
Difference 5.96%
VC-backed, But Board Information Unidentifiable (n=66) 19.53%
Mean Announcement CARs [-10,+2] Equal Weighted Index VC-backed (n=199) Non VC-backed (n=74) Difference
VC On Board (n=119) 35.43% 33.16%
2.26%
VC Not On Board (n=14) 22.66% -10.51%
Difference 12.77%**
VC-backed, But Board Information Unidentifiable (n=66) 24.37%
Mean Announcement CARs [-2,+2] Equal Weighted Index VC-backed (n=199) Non VC-backed (n=74) Difference
VC On Board (n=119) 27.81% 28.69%
-0.88%
VC Not On Board (n=14) 22.61% -6.08%
Difference 5.20%
VC-backed, But Board Information Unidentifiable (n=66) 19.52%

86
Table 2.7c: VCs, Board Presence, and Announcement Returns to IPOs Receiving Bids within 3 years of IPO (Non-Tech Only) IPO sample consists of initial public offerings on the NYSE, AMEX, and Nasdaq between January 1, 1985 and December 31, 2009. The firm had to be based in
the United States. I exclude utilities, unit offerings, rights offerings, REITs, and ADRs. I remove IPO firms that had an offer price of less than $5, raised less
than $5 million, or had an unidentifiable PERMNO. The M&A sample consists of transactions announced between January 1, 1985 and May 17, 2010, where
both the acquirer and target must be based in the United States and publicly traded. The deals must have been completed or withdrawn. I eliminate financials
and utilities. High-tech is defined as operating in the following SIC codes: 283,481,365,366,367,368,369,482,483,484,485,486,487,488,489,357,or 737. A maximum of
5% toehold could have existed prior to announcement, and the acquirer must seek to own 100% of the target after the acquisition. I hand collect board and
ownership data from EDGAR for firms acquired with 3 years of their respective IPO to determine if the lead VC continues to maintain a board seat from the IPO
through the acquisition. ***, **, and * denote significance at the 1, 5, and 10 percent levels respectively.
Mean Announcement CARs [-10,+2] Value Weighted Index VC-backed (n=114) Non VC-backed (n=158) Difference
VC On Board (n=58) 32.37% 24.01%
8.36%
VC Not On Board (n=11) 34.86% 10.85%
Difference -2.49%
VC-backed, But Board Information Unidentifiable (n=45) 26.51%
Mean Announcement CARs [-2,+2] Value Weighted Index VC-backed (n=114) Non VC-backed (n=158) Difference
VC On Board (n=58) 27.10% 19.68%
7.42%
VC Not On Board (n=11) 37.27% 17.59%
Difference -10.17%
VC-backed, But Board Information Unidentifiable (n=45) 21.11%
Mean Announcement CARs [-10,+2] Equal Weighted Index VC-backed (n=114) Non VC-backed (n=158) Difference
VC On Board (n=58) 31.99% 23.74%
8.25%
VC Not On Board (n=11) 34.37% 10.63%
Difference -2.38%
VC-backed, But Board Information Unidentifiable (n=45) 26.33%
Mean Announcement CARs [-2,+2] Equal Weighted Index VC-backed (n=114) Non VC-backed (n=158) Difference
VC On Board (n=58) 27.22% 19.41%
7.81%
VC Not On Board (n=11) 36.73% 17.32%
Difference -9.51%
VC-backed, But Board Information Unidentifiable (n=45) 21.16%

87
Table 2.8a: Target, Acquirer, and Combined Announcement Returns to Bids on Recent IPOs IPO sample consists of initial public offerings on the NYSE, AMEX, and Nasdaq between January 1, 1985 and December 31, 2009. The firm had to be based in
the United States. I exclude utilities, unit offerings, rights offerings, REITs, and ADRs. I remove IPO firms that had an offer price of less than $5, raised less
than $5 million, or had an unidentifiable PERMNO. The M&A sample consists of transactions announced between January 1, 1985 and May 17, 2010, where
both the acquirer and target must be based in the United States and publicly traded. The deals must have been completed or withdrawn. I eliminate financials
and utilities. High-tech is defined as operating in the following SIC codes: 283,481,365,366,367,368,369,482,483,484,485,486,487,488,489,357,or 737. A maximum of
5% toehold could have existed prior to announcement, and the acquirer must seek to own 100% of the target after the acquisition. A firm is considered a VC-
backed IPO if they were VC-backed and in my IPO sample. ***, **, and * denote significance at the 1, 5, and 10 percent levels respectively.
Mean Announcement CARs [-2,+2] Value Weighted Index
VC-backed IPO Target VC-backed IPO Acquirer N Variable Mean Median
0
0 506
Target
22.37% 17.46%
Acquirer
-1.07% -0.65%
Combined
2.35% 1.70%
1 109
Target
23.30% 18.86%
Acquirer
-1.35% -1.03%
Combined
1.37% 1.56%
1
0 466
Target
28.11% 21.97%
Acquirer
-2.10% -1.23%
Combined
0.97% 0.48%
1 323
Target
22.94% 19.67%
Acquirer
-3.32% -2.67%
Combined -0.38% 0.27%

88
Table 2.9: Summary Statistics of Regression Variables, VC vs. Non-VC IPO sample consists of initial public offerings on the NYSE, AMEX, and Nasdaq between January 1, 1985 and December 31, 2009. The firm had to be based in
the United States. I exclude utilities, unit offerings, rights offerings, REITs, and ADRs. I remove IPO firms that had an offer price of less than $5, raised less
than $5 million, or had an unidentifiable PERMNO. The M&A sample consists of transactions announced between January 1, 1985 and May 17, 2010, where
both the acquirer and target must be based in the United States and publicly traded. The deals must have been completed or withdrawn. I eliminate financials
and utilities. High-tech is defined as operating in the following SIC codes: 283,481,365,366,367,368,369,482,483,484,485,486,487,488,489,357,or 737. A maximum of
5% toehold could have existed prior to announcement, and the acquirer must seek to own 100% of the target after the acquisition. I hand collect board and
ownership data from EDGAR for firms acquired with 3 years of their respective IPO to determine if the lead VC continues to maintain a board seat from the IPO
through the acquisition. ***, **, and * denote test for mean differences were significant at the 1, 5, and 10 percent levels respectively.
VC-backed Target Non-VC Backed Target
Variable N Mean Median N Mean Median
Target Market Cap (000s) (3 days prior to bid) 789 666,641 161,079 615 805,231 171,734
Acquirer Market Cap (000s) (3 days prior to bid)*** 789 19,404,092 1,791,790 615 8,945,513 1,302,016
RelativeSize** 789 28.5% 11.3% 615 35.2% 17.3%
Stock (at least some stock used)*** 789 63.5% 1 615 55.1% 1
All Stock*** 789 49.9% 0 615 35.6% 0
All Cash 789 27.9% 0 615 25.5% 0
Tender Offer 789 18.0% 0 615 21.0% 0
Diversifying Acquisition 789 33.3% 0 615 35.9% 0
Target Age (Years from IPO to Bid)** 789 4.9 3.9 615 5.5 4.2
Target Young Firm (<3 years) 789 39.7% 0 615 37.7% 0
VC Still On Board at Bid 203 87.2% 1
% VC Owns Before IPO 179 22.46% 18.90%
% VC Owns After IPO 180 16.73% 15.05%
% VC Owns at Bid 197 11.34% 8.60%
% of VC Stake Held from IPO to Bid 173 65.9% 81.3%
[-2,+2] CAR to Acquirer (Value Weighted)** 789 -2.6% -1.6% 615 -1.1% -0.8%
[-2,+2] CAR to Target (Value Weighted)** 789 26.0% 21.6% 615 22.5% 17.6%
[-2,+2] CAR to Acquirer (Equal Weighted)*** 789 -2.8% -2.0% 615 -1.3% -1.1%
[-2,+2] CAR to Target (Equal Weighted)** 789 25.8% 21.0% 615 22.3% 17.3%
Combined Announcement CAR (Value Weighted)*** 789 0.4% 0.4% 615 2.2% 1.7%
Combined Announcement CAR (Equal Weighted)*** 789 0.2% 0.3% 615 2.0% 1.7%
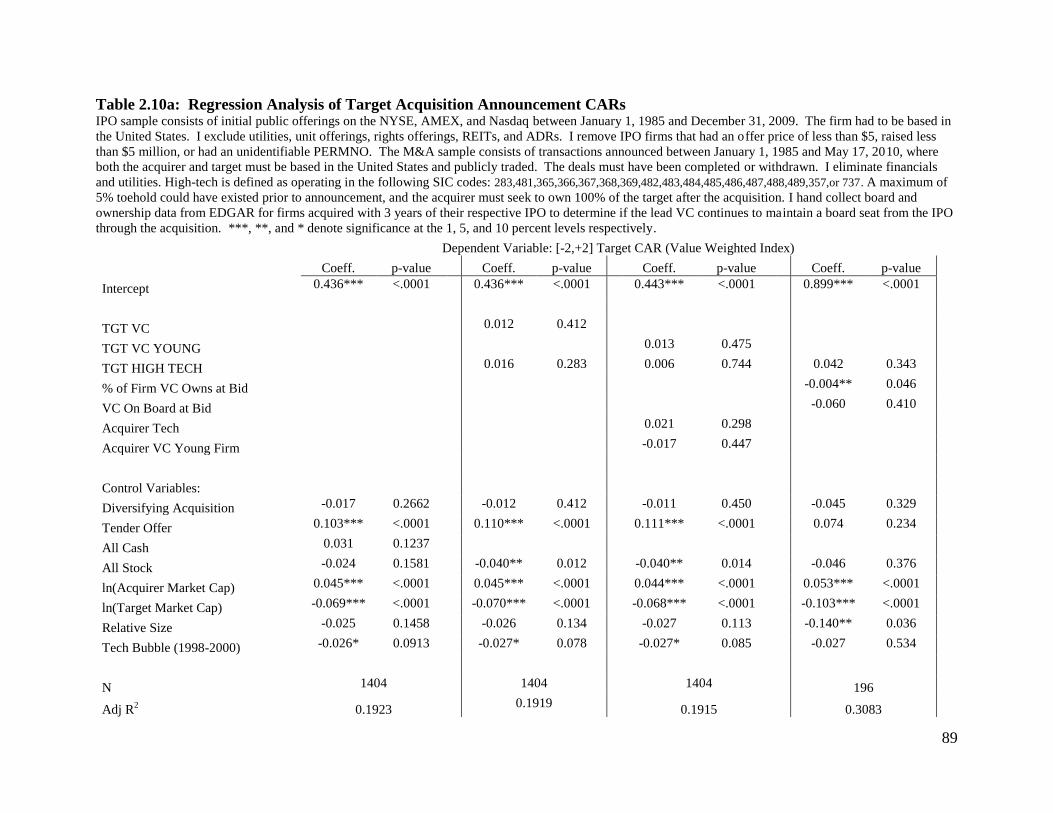
89
Table 2.10a: Regression Analysis of Target Acquisition Announcement CARs IPO sample consists of initial public offerings on the NYSE, AMEX, and Nasdaq between January 1, 1985 and December 31, 2009. The firm had to be based in
the United States. I exclude utilities, unit offerings, rights offerings, REITs, and ADRs. I remove IPO firms that had an offer price of less than $5, raised less
than $5 million, or had an unidentifiable PERMNO. The M&A sample consists of transactions announced between January 1, 1985 and May 17, 2010, where
both the acquirer and target must be based in the United States and publicly traded. The deals must have been completed or withdrawn. I eliminate financials
and utilities. High-tech is defined as operating in the following SIC codes: 283,481,365,366,367,368,369,482,483,484,485,486,487,488,489,357,or 737. A maximum of
5% toehold could have existed prior to announcement, and the acquirer must seek to own 100% of the target after the acquisition. I hand collect board and
ownership data from EDGAR for firms acquired with 3 years of their respective IPO to determine if the lead VC continues to maintain a board seat from the IPO
through the acquisition. ***, **, and * denote significance at the 1, 5, and 10 percent levels respectively.
Dependent Variable: [-2,+2] Target CAR (Value Weighted Index)
Coeff. p-value
Coeff. p-value
Coeff. p-value
Coeff. p-value
Intercept 0.436*** <.0001
0.436*** <.0001
0.443*** <.0001
0.899*** <.0001
TGT VC
0.012 0.412
TGT VC YOUNG
0.013 0.475
TGT HIGH TECH
0.016 0.283
0.006 0.744
0.042 0.343
% of Firm VC Owns at Bid
-0.004** 0.046
VC On Board at Bid
-0.060 0.410
Acquirer Tech
0.021 0.298
Acquirer VC Young Firm
-0.017 0.447
Control Variables:
Diversifying Acquisition -0.017 0.2662
-0.012 0.412
-0.011 0.450
-0.045 0.329
Tender Offer 0.103*** <.0001
0.110*** <.0001
0.111*** <.0001
0.074 0.234
All Cash 0.031 0.1237
All Stock -0.024 0.1581
-0.040** 0.012
-0.040** 0.014
-0.046 0.376
ln(Acquirer Market Cap) 0.045*** <.0001
0.045*** <.0001
0.044*** <.0001
0.053*** <.0001
ln(Target Market Cap) -0.069*** <.0001
-0.070*** <.0001
-0.068*** <.0001
-0.103*** <.0001
Relative Size -0.025 0.1458
-0.026 0.134
-0.027 0.113
-0.140** 0.036
Tech Bubble (1998-2000) -0.026* 0.0913
-0.027* 0.078
-0.027* 0.085
-0.027 0.534
N 1404
1404
1404
196
Adj R2 0.1923
0.1919
0.1915
0.3083

90
Table 2.10b: Regression Analysis of Bidder Acquisition Announcement CARs IPO sample consists of initial public offerings on the NYSE, AMEX, and Nasdaq between January 1, 1985 and December 31, 2009. The firm had to be based in
the United States. I exclude utilities, unit offerings, rights offerings, REITs, and ADRs. I remove IPO firms that had an offer price of less than $5, raised less
than $5 million, or had an unidentifiable PERMNO. The M&A sample consists of transactions announced between January 1, 1985 and May 17, 2010, where
both the acquirer and target must be based in the United States and publicly traded. The deals must have been completed or withdrawn. I eliminate financials
and utilities. High-tech is defined as operating in the following SIC codes: 283,481,365,366,367,368,369,482,483,484,485,486,487,488,489,357,or 737. A maximum of
5% toehold could have existed prior to announcement, and the acquirer must seek to own 100% of the target after the acquisition. I hand collect board and
ownership data from EDGAR for firms acquired with 3 years of their respective IPO to determine if the lead VC continues to maintain a board seat from the IPO
through the acquisition. ***, **, and * denote significance at the 1, 5, and 10 percent levels respectively.
Dependent Variable: [-2,+2] Bidder CAR (Value Weighted Index)
Coeff. p-value
Coeff. p-value
Coeff. p-value
Coeff. p-value
Intercept 0.043* 0.0721
0.051** 0.032
0.050** 0.037
0.167* 0.058
TGT VC
-0.012** 0.046
TGT VC YOUNG
0.003 0.721
TGT TECH
-0.007 0.251
-0.002 0.809
0.000 0.998
% of Firm VC Owns at Bid
0.000 0.751
VC On Board at Bid
-0.048 0.199
Acquirer Tech
-0.012 0.126
Acquirer VC Young Firm
-0.007 0.444
Control Variables:
Diversifying Acquisition 0.012** 0.0494
0.010 0.100
0.009 0.125
0.004 0.866
Tender Offer 0.007 0.42
0.010 0.201
0.009 0.241
-0.022 0.500
All Cash 0.011 0.1985
All Stock -0.019*** 0.0073
-0.019*** 0.003
-0.019*** 0.003
-0.028 0.293
ln(Acquirer Market Cap) 0.005** 0.0276
0.006*** 0.003
0.006*** 0.005
0.006 0.368
ln(Target Market Cap) -0.011*** <.0001
-0.012*** <.0001
-0.012*** <.0001
-0.019** 0.036
Relative Size 0.012* 0.0918
0.012* 0.077
0.012* 0.086
0.018 0.606
Tech Bubble (1998-2000) -0.007 0.2668
-0.008 0.179
-0.007 0.239
0.029 0.197
N 1404
1404
1404
196
Adj R2 0.0376
0.0407
0.0388
0.0074

91
Table 2.10c: Regression Analysis of Combined Acquisition Announcement CARs IPO sample consists of initial public offerings on the NYSE, AMEX, and Nasdaq between January 1, 1985 and December 31, 2009. The firm had to be based in
the United States. I exclude utilities, unit offerings, rights offerings, REITs, and ADRs. I remove IPO firms that had an offer price of less than $5, raised less
than $5 million, or had an unidentifiable PERMNO. The M&A sample consists of transactions announced between January 1, 1985 and May 17, 2010, where
both the acquirer and target must be based in the United States and publicly traded. The deals must have been completed or withdrawn. I eliminate financials
and utilities. High-tech is defined as operating in the following SIC codes: 283,481,365,366,367,368,369,482,483,484,485,486,487,488,489,357,or 737. A maximum of
5% toehold could have existed prior to announcement, and the acquirer must seek to own 100% of the target after the acquisition. I hand collect board and
ownership data from EDGAR for firms acquired with 3 years of their respective IPO to determine if the lead VC continues to maintain a board seat from the IPO
through the acquisition. ***, **, and * denote significance at the 1, 5, and 10 percent levels respectively.
Dependent Variable: [-2,+2] Combined CAR (Value Weighted Index)
Coeff. p-value
Coeff. p-value
Coeff. p-value
Coeff. p-value
Intercept 0.107*** <.0001
0.113*** <.0001
0.115*** <.0001
0.256*** 0.002
TGT VC
-0.009 0.126
TGT VC YOUNG FIRM
0.005 0.488
TGT TECH
-0.008 0.173
-0.004 0.592
-0.009 0.677
% of Firm VC Owns at Bid
-0.001 0.185
VC On Board at Bid
-0.050 0.146
Acquirer Tech
-0.009 0.263
Acquirer VC Young Firm
-0.012 0.143
Control Variables:
Diversifying Acquisition 0.007 0.2075
0.005 0.354
0.005 0.404
-0.005 0.806
Tender Offer 0.016** 0.032
0.019** 0.010
0.018** 0.014
-0.030 0.311
All Cash 0.007 0.3459
All Stock -0.026*** <.0001
-0.025*** <.0001
-0.025*** <.0001
-0.040 0.104
ln(Acquirer Market Cap) -0.007*** 0.0004
-0.006*** 0.003
-0.006*** 0.002
-0.007 0.314
ln(Target Market Cap) 0.001 0.6466
0.000 0.992
0.000 0.916
-0.005 0.554
Relative Size -0.001 0.898
0.000 0.948
-0.001 0.873
-0.052* 0.098
Tech Bubble (1998-2000) -0.004 0.4882
-0.005 0.380
-0.004 0.502
0.024 0.236
N 1404
1404
1404
196
Adj R2 0.0420
0.0447
0.0443
0.0423

92
REFERENCES
Andrade, Gregor, M. Mitchell, and E. Stafford, 2001, New evidence and perspectives on mergers
and acquisitions, Journal of Economic Perspectives 15, 103-120.
Aoki, M, 2000, Information and governance in the silicon valley model, Corporate Governance:
Theoretical and Empirical Perspectives, Cambridge, UK. Cambridge University Press.
Asquith, P, R. Brunner, Mullins, D., The gains to bidding firms from merger, Journal of
Financial Economics 11, 121-139.
Baker, Malcolm and Paul A. Gompers, 2003, The determinants of board structure at the initial
public offering, Journal of Law and Economics 46, 569-598.
Bargeron, L., Schlingemann, F.P., Stulz, R.M, Zutter, C.J., 2007. Why do private acquirers pay
so little compared to public acquirers?, Journal of Financial Economic 89, 375-390.
Barry, Christopher B., Chris J. Muscarella, John W. Peavy III, and Michael R. Vetsuypens, 1990,
The role of venture capital in the creation of public companies, Journal of Financial Economics
27, 447-471.
Berkovitch, E. and M.P. Narayanan, 1993, Motives for Takeovers: An Empirical Investigation,
Journal of Financial and Quantitative Analysis 28, 347-362
Boone, Audra L., Laura Casares Field, Jonathan M. Karpoff, and Charu G. Raheja, 2007, The
determinants of corporate board size and composition: An empirical analysis, Journal of
Financial Economics 85, 66-101.
Bradley, M., Desai, A., Kim, E.H., 1988. Synergistic gains from corporate acquisitions and their
division between the stockholders of target and acquiring firms. Journal of Financial Economics
21, 3–40.
Brav, Alon and Paul A. Gompers, 1997, Myth or reality? The long-run underperformance of
initial public offerings: Evidence from venture and nonventure capital-backed companies,
Journal of Finance 52, 1791-1821.
Brav, Alon and Paul A. Gompers, 2003, The role of lock-ups in initial public offerings, Review
of Financial Studies 16, 1-29.
Bygrave, William D., 1988, The structure of the investment networks of venture capital firms,
Journal of Business Venturing 3, 137–158.
Chang, S., 1998, Takeovers of privately held targets, methods of payment and bidder returns,
Journal of Finance, 53, 773-784.

93
Datta, S., M. Iskandar-Datta, K. Raman, Executive Compensation and Corporate Acquisition
Decisions, Journal of Finance, 56, 2299-2336.
Demsetz, Harold and Kenneth Lehn, 1985, The structure of corporate ownership: Causes and
consequences, Journal of Political Economy 93, 1155-1177.
Dong, M., Hirshleifer, D., Richardson, S., Teoh, S.H., 2006, Does investor misevaluation drive
the takeover market?, Journal of Finance 61, 725-762.
Duggal, R., Millar, J.A., 1999. Institutional ownership and firm performance: the case of bidder
returns. Journal of Corporate Finance 5, 103–117.
Field, Laura Casares, and Gordon Hanka, 2001, The expiration of IPO share lockups, Journal of
Finance 56, 471-498.
Field, Laura Casares, and Jonathan Karpoff, 2002, Takeover defenses of IPO firms, Journal of
Finance 57, 1857-1889
Field, Laura Casares and Dennis P. Sheehan, 2004, IPO underpricing and outside blockholdings,
Journal of Corporate Finance 10, 263-280.
Fuller, K., J. Netter and M. Stegemoller, 2002, What do returns to acquiring firms tell us?
Evidence from firms that make many acquisitions, Journal of Finance, 57, 1763-1793.
Gompers, Paul A., 1995, Optimal investment, monitoring, and the staging of venture capital,
Journal of Finance 50, 1461–1490.
Gompers, Paul A., 1996, Grandstanding in the venture capital industry, Journal of Financial
Economics 42, 133–156.
Gompers, Paul A. and Josh Lerner, 1998, Venture capital distributions: Short-run and long-run
reactions, Journal of Finance 53, 2161-2183.
Gompers, Paul A. and Josh Lerner, 1999, Conflict of interest in the issuance of public securities:
Evidence from venture capital, Journal of Law and Economics 62, 1-28.
Gompers, Paul A., and Josh Lerner, 2000, Money chasing deals? The impact of fund inflows on
private equity valuations, Journal of Financial Economics 55, 281–325.
Gompers, Paul A., and Josh Lerner, 2001, The venture capital revolution, Journal of Economic
Perspectives 15, 145-168.
Gompers, Paul A., Joy Ishii, and Andrew Metrick, 2003, Corporate Governance and Equity
Prices, Quarterly Journal of Economics 118, 107-155.

94
Gompers, Paul A., and Yuhai Xuan, 2009, Bridge Building in Venture Capital-Backed
Acquisitions, Working paper (Harvard Business School).
Gorman, Michael, and William A. Sahlman, 1989, What do venture capitalists do? Journal of
Business Venturing 4, 231–248.
Hansen, Robert, 1987, A theory for the choice of exchange medium in mergers and acquisitions,
Journal of Business 60, 75-95.
Hansen, R., and J. Lott., 1996, Externalities and Corporate Objectives in a World with
Diversified Share-holders/Consumers, Journal of Financial and Quantitative Analysis 31, 43-68.
Harford, J., 1999. Corporate cash reserves and acquisitions. Journal of Finance 54 (6), 1969–
1997.
Harford, J., and K. Li, 2007, Decoupling CEO wealth and firm performance: the case of
acquiring CEOs, Journal of Finance 62, 917–950.
Harford, J., E. Ofek, and K. Li, 2011, Institutional cross-holdings and their effect on acquisition
decisions, Journal of Financial Economics, 99(1), 27-39.
Hartzell, J.C., Ofek, E., and Yermack, D., 2004, What’s in it for me? CEOs whose firms are
acquired. Review of Financial Studies 17, 37–61.
Hellmann, Thomas J., and Manju Puri, 2002, Venture capital and the professionalization of start-
up firms: Empirical evidence, Journal of Finance 57, 169–197.
Hochberg, Yael V., Alexander Ljungqvist, and Yang Lu, Whom you know matters: Venture
capital networks and investment performance, Journal of Finance 62, 251-301.
Huang, Y., Walkling, R., 1987. Target abnormal returns associated with acquisition
announcements: payment, acquisition form, and managerial resistance. Journal of Financial
Economics 19, 329–349.
Jensen, M., 1986, The agency costs of free cash flow, corporate finance and takeovers, American
Economic Review 76, 323-329.
Jensen, M. and R. Ruback, 1983, The market for corporate control: the scientific evidence,
Journal of Financial Economics 11, 5-50.
Jensen, M., 2005, Agency costs of overvalued equity, Financial Management 34, 5-19.
Kaplan, Steven N., and Per Stromberg, 2004, Characteristics, contracts and actions: Evidence
from venture capital analyses, Journal of Finance 59, 2177–2210.

95
Kayhan, Ayla and S. Titman, 2007, Firms’ histories and their capital structures, Journal of
Financial Economics 83, 1-32.
Krishnan, C.N.V, Vladimir Ivanov, Ronald W. Masulis, and Ajai K. Singh, 2010, Venture
capital reputation, post-IPO performance, and coporate governance, Journal of Financial and
Quantitative Analysis, forthcoming.
Lang, L.H.P., Stulz, R., Walkling, R.A., 1991, A test of the free cash flow hypothesis: the case of
bidder returns, Journal of Financial Economics 29, 315-336.
Lang, L.H.P., Stulz, R.M., Walkling, R.A., 1989. Managerial performance, Tobin’s Q, and the
gains from successful tender offers. Journal of Financial Economics 24, 137–154.
Lerner, Josh, 1994a, The syndication of venture capital investments, Financial Management 23,
16–27.
Lerner, Josh, 1994b, Venture capitalists and the decision to go public, Journal of Financial
Economics 35, 293–316.
Lerner, Josh, 1995, Venture capitalists and the oversight of private firms, Journal of Finance 50,
301-318.
Lewellen, Wilbur, Claudio Loderer, and Ahron Rosenfeld, 1985, Merger decisions and executive
stock ownership in acquiring firms, Journal of Accounting and Economics 7, 209-231.
Lindsey, Laura, 2008, Blurring firm boundaries: the role of venture capital in strategic alliances,
Journal of Finance, 63(3), 1137-1168.
Maloney, M., R. McCormick, and M. Mitchell, 1993, Managerial decision making and capital
structure, Journal of Business, 189-217
Masulis, Ronald W., and Rajarishi Nahata, 2011, Venture Capital Conflicts of Interest: Evidence
from Acquisitions of Venture Backed Firms, Journal of Financial and Quantitative Analysis,
forthcoming.
Masulis, R. W., C. Wang, and F. Xie. 2007. Corporate Governance and Acquirer Returns.
Journal of Finance 62:1851–89.
Matvos, Gregor, and Michael Ostrovsky, 2006, Cross-Ownership, Returns, and Voting in
Mergers, Journal of Financial Economics 89, 391-403.
Megginson, W.C. and K.A. Weiss, 1991, Venture capital certification in initial public offerings,
Journal of Finance 46, 879-893.
Moeller, S.B., F.P. Schlingemann and R.M. Stulz, 2004, Firm size and the gains from
acquisitions, Journal of Financial Economics 73, 201-228.

96
Moeller, S.B., F.P. Schlingemann and R.M. Stulz, 2005, Wealth destruction on a massive scale?
A study of acquiring firm returns in the recent merger wave, Journal of Finance 60, 757-782.
Moeller, S.B., F.P. Schlingemann and R.M. Stulz, 2007, How do diversity of opinion and
information asymmetry affect acquirer returns?, Review of Financial Studies, forthcoming.
Morck, R., A. Shleifer and R.W. Vishny, 1990, Do managerial objectives drive bad
acquisitions?, Journal of Finance 45, 31–48.
Mulherin, J. H. and A. L. Boone (2000), ‘Comparing Acquisitions and Divestitures’, Journal of
Corporate Finance, Vol. 6, pp. 117-139.
Myers, S.C. and N.S. Majluf, 1984, Corporate financing and investment decisions when firms
have information that investors do not have, Journal of Financial Economics 13, 187-221.
Raad, E., Ryan, R., Sinkey, J. F. Jr., 1999. Leverage, Ownership Structure, and Returns to
Shareholders of Target and Bidding Firms. Quarterly Journal of Business and Economics 38, 37-
-53.
Rhodes-Kropf, M. and S. Viswanathan, Market valuation and merger waves, The Journal of
Finance 59, 2685-2718.
Roll, Richard, 1986, The hubris hypothesis of corporate takeovers, Journal of Business 59, 197-
216.
Sahlman, William A., 1990, The structure and governance of venture capital organizations,
Journal of Financial Economics 27, 473–421.
Servaes, H., 1991, Tobin’s q, agency costs, and corporate control: an empirical analysis of firm
specific parameters, Journal of Finance 46, 409-419.
Song, M., and Walking, R., 1993, The impact of managerial ownership on acquisition
attempts and target shareholder wealth, 28 J. Fin. Quant. Analysis 439-457.
Sorensen, Morten, 2007, How smart is smart money? An empirical two-sided matching model of
venture capital, Journal of Finance 62, 2725-2762.
Stulz, R., 1988. Managerial control of voting rights: financing policies and the market for
corporate control. Journal of Financial Economics 20, 25–54.
Stulz, René M., Ralph A. Walkling, and Moon H. Song, 1990, The Distribution of Target
Ownership and the Division of Gains in Successful Takeovers, Journal of Finance 45,
817-834.

97
Travlos, N.G., 1987, Corporate Takeover Bids, Methods of Payment, and Bidding Firms’ Stock
Returns, Journal of Finance 42, 943-963.
Yermack, David, 1996, Higher market valuation of companies with a small board of
directors, Journal of Financial Economics 40, 185-213.
Zingales, Luigi, 1995, Inside ownership and the decision to go public, The Review of
Economic Studies 62 (3), 425-448.

VITA
Colin R. Jones
AREAS OF INTEREST
Private Equity, Venture Capital, M&A, IPOs
ACADEMIC EXPERIENCE
University of South Carolina, Moore School of Business 2013-Present
Clinical Assistant Professor of Finance
College of William & Mary, Mason School of Business 2011-2013
Visiting Assistant Professor of Finance
EDUCATION
The Pennsylvania State University, Smeal College of Business
PhD in Finance
2013
College of William & Mary, Mason School of Business
Master of Business Administration
2006
New Mexico State University, College of Business
Bachelor of Business Administration
2002
INDUSTRY EXPERIENCE
Flywheel Ventures
Summer Analyst
2006
Los Alamos National Laboratories
Graduate Research Assistant
2005
Green Garlic Records
Founder
2002 - 2004
New Mexico State University Center for Entrepreneurship
Research Assistant
2002
INVITED PRESENTATIONS
The Information Role of Venture Capitalists: How Venture Capitalists Affect the M&A Decisions of Their
Previous IPOs, FMA Annual Conference (2008), University of South Carolina (2011), College of
William & Mary (2011), University of Denver (2010), East Carolina University (2010)
Discussant for The Corporate Acquisition Policy of Financially Distressed Firms by Dror Parnes, FMA
Annual Conference (October 2008)
HONORS AND AWARDS
Nominated for Ossian R. MacKenzie Teaching Award, Penn State Smeal College of Business, 2010
Doctoral Research Award, Penn State Smeal College of Business, 2008- 2010
Beta Gamma Sigma, William & Mary Mason School of Business, 2006
Portfolio Manager, Batten Student Managed Investment Fund, W&M Mason School of Business, 2006
MBA Community Fellow, William & Mary Mason School of Business, 2005-2006
Crimson Scholar, New Mexico State University, 2000-2002