ventilation and perfusion in health and disease · ventilation and perfusion in health and disease...
TRANSCRIPT

VENTILATION AND
PERFUSION IN HEALTH AND
DISEASE
Dr.HARIPRASAD VS

Ventilation
Total ventilation - total rate of air flow in and out of the lung during normal tidal breathing.
Alveolar ventilation -represents the amount of fresh inspired air available for gas exchange in alveolar gas compartment
VA=VE-VD
VA x n=VT x n-VD x n
Also;
VCO2= VAxFCO2
VA = VCO2/PCO2


Alveolar gas equation
pAO2 The alveolar partial pressure of
oxygen
107 mmHg
FIO2 The fraction of inspired gas that is
oxygen
.21
PATM The prevailing atmospheric
pressure
760 mmHg
pH2O The saturated vapour pressure of
water at body temperature
47 mmHg
paCO2 The arterial partial pressure of
carbon dioxide (pCO2)
40 mmHg
RER The respiratory exchange ratio 0.8

Anatomical Dead space
Volume of the conducting airways.
Usually 150 Ml.
Increases with large breath.
Measured by fowler’s or N2 wash out
method.

Subject breaths though a valve box
•N2 concentration at the mouth is analyzed
•Following a single breath of pure O2,N2
conc increases as dead space gas is
washed out by the alveolar gas, finally
reaching a plateau.
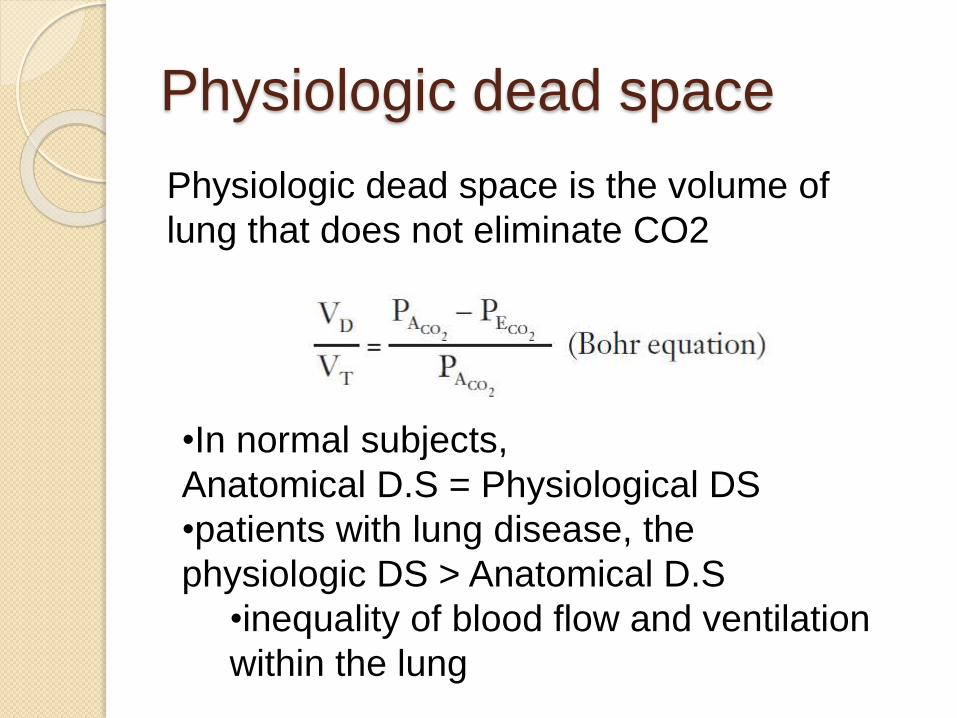
Physiologic dead space
Physiologic dead space is the volume of
lung that does not eliminate CO2
•In normal subjects,
Anatomical D.S = Physiological DS
•patients with lung disease, the
physiologic DS > Anatomical D.S
•inequality of blood flow and ventilation
within the lung

Dead space ventilation
Pulmonary embolism
Vascular obliteration ex. PAH
Emphysema

Regional Differences in
Ventilation
“change in volume per unit resting volume” !
lower regions of the lung ventilate better
than do the upper zones.
Supine position-ventilation of the lowermost
(posterior) lung exceeds that of the
uppermost (anterior) lung.
Lateral position -the dependent lung is best
ventilated.

Why ?•weight of the lung - lower portions of the lung
requires a larger pressure below it than above
it
•intrapleural pressure is less negative at the
bottom.•Basal region has a
small
resting volume,
expanding pressure &
placed on the steep
part of the pressure
volume curve.
•‘Paradox’

At low lung volumes the intrapleural
pressure at the base exceeds airway
pressure.
the lung at the base compressed,
and ventilation is impossible until the
intrapleural pressure falls
apex of the lung is on a favourable part of
the pressure-volume curve and ventilates
well.
upper regions ventilate better at low lung

Airway Closure
The compressed region of lung at the base
does not have all its gas exhaled out.
airways in the region of respiratory
bronchioles close first trapping gas in the
distal alveoli.
1. only at very low lung volumes in young normal
subjects.
2. Elderly airway closure in the lowermost regions
of the lung occurs at higher volumes
Dependent regions of the lung may be only
intermittently ventilated leading to defective
gas exchange
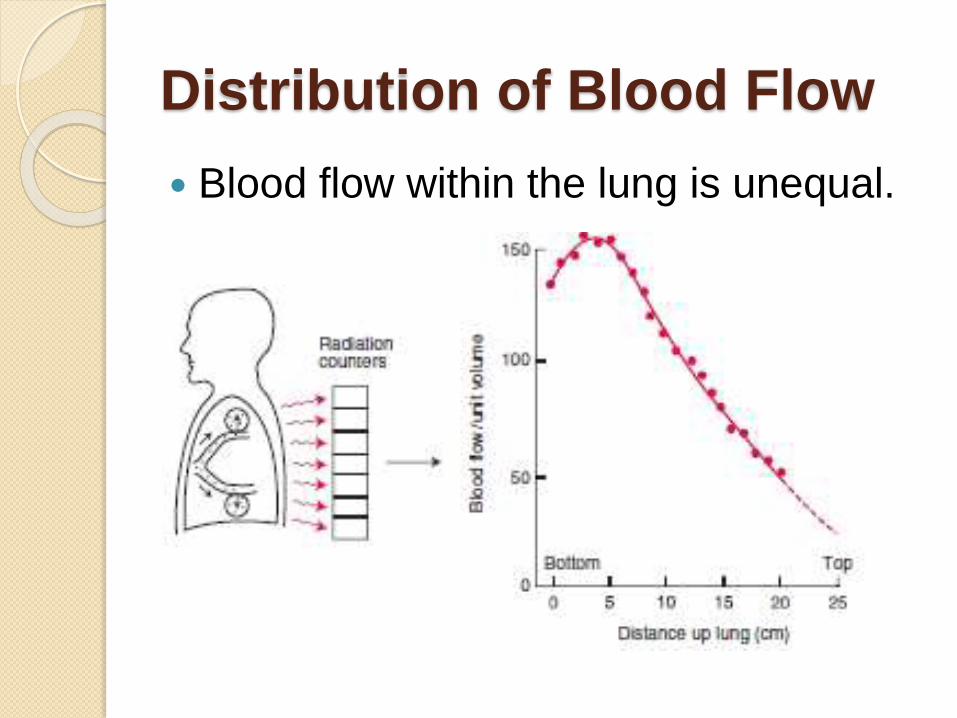
Distribution of Blood Flow
Blood flow within the lung is unequal.

On mild exercise , both upper and lower
zone blood flows increase, and the regional
differences become less pronounced.
The uneven distribution of blood flow is due
to the hydrostatic pressure differences
within the blood vessels.
difference in pressure between the top and
bottom- 30 cm of H2O
This is a large pressure difference for a low-
pressure system as the pulmonary
circulation
J Appl Physiol 15: 405-410

No blood flow possible.
Severe hemorrhage
Positive pressure ventilation
‘Alveolar dead space.’

Zone 4 -can be seen at the lung bases at
low lung volumes or in Pulmonary oedema.
Pulmonary interstitial pressure (Pi) rises as
lung volume decreases due to reduced
radial tethering of the lung Parenchyma
Pa > Pi > Pv > PA

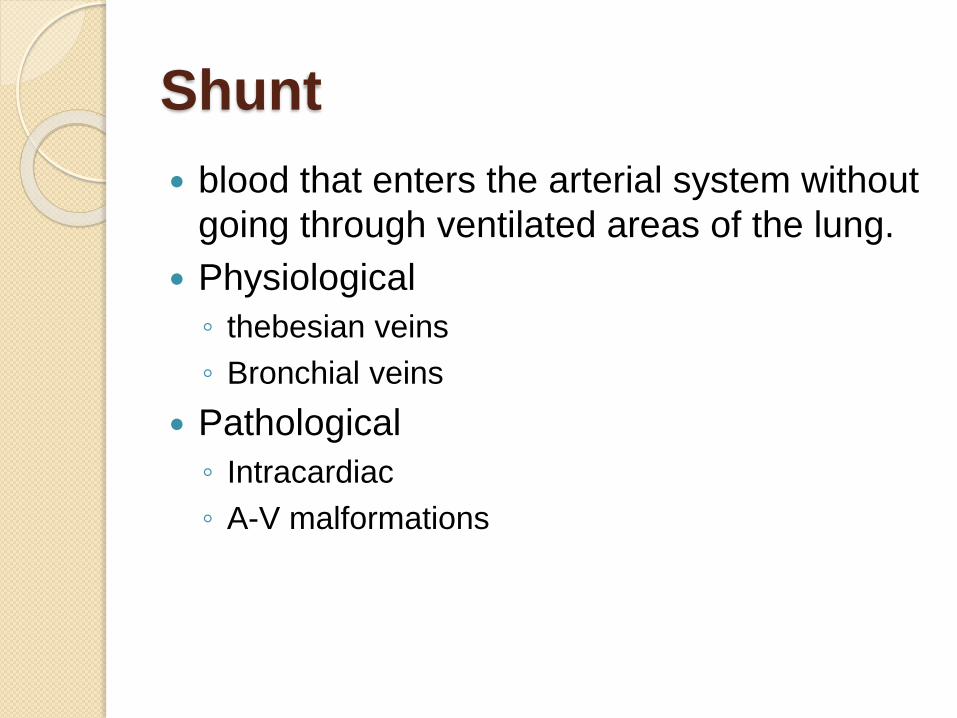
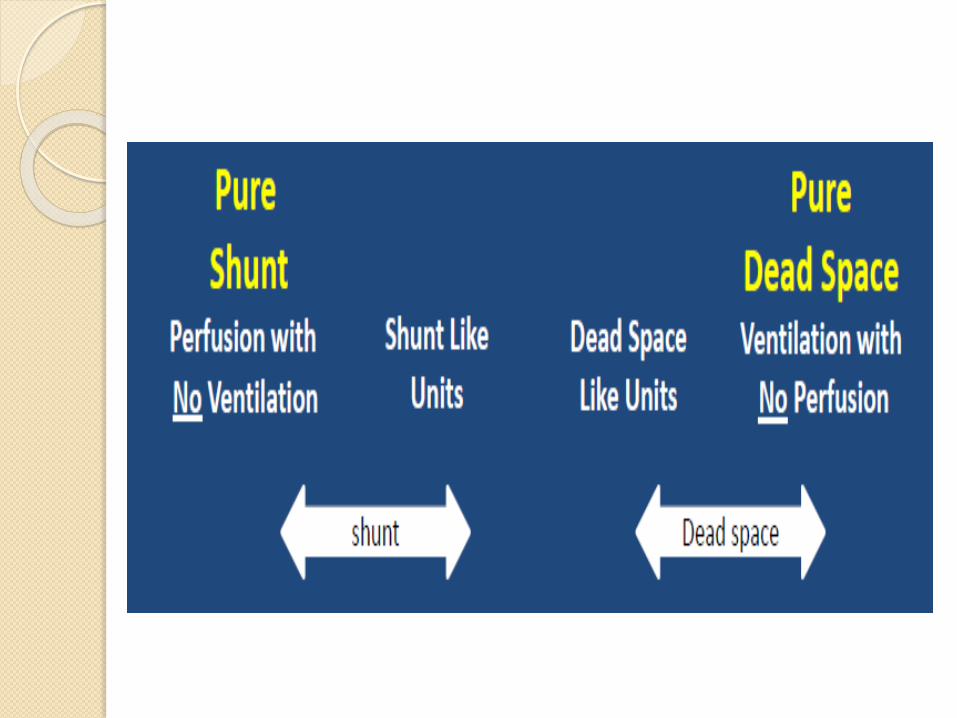
Shunt
blood that enters the arterial system without
going through ventilated areas of the lung.
Physiological
◦ thebesian veins
◦ Bronchial veins
Pathological
◦ Intracardiac
◦ A-V malformations

Shunt equation
QT = total blood flow
Qs= shunt blood flow
CvO2= O2 concentration in shunted blood
Cc’O2= O2 concentration in end-capillary
blood
CaO2 =O2 concentration in the arterial blood

a 5% shunt for every 100 mm Hg
decrease in Pao2 below 700 mm Hg
while the patient is breathing 100%.
If PaO2 on FiO2 1.0 is 200, the shunt is
approximately (700-200)* 5 ie 25 %.
Pure shunt does not respond to
increase in FiO2.
ARDS – 25-50% shunt, responds to
PEEP.

Ventilation-Perfusion Ratio
What determines the concentration of dye ?
rate at which the dye is added (ventilation)
rate at which water is pumped (blood flow)

Alterations in the Ventilation-
Perfusion Ratio

O2-CO2 diagram

Regional changes in V-Q
Ventilation increases slowly from top
to bottom of the lung and blood flow
increases more rapidly.
V-Q ratio is abnormally high at the top
of the lung and much lower at the
bottom
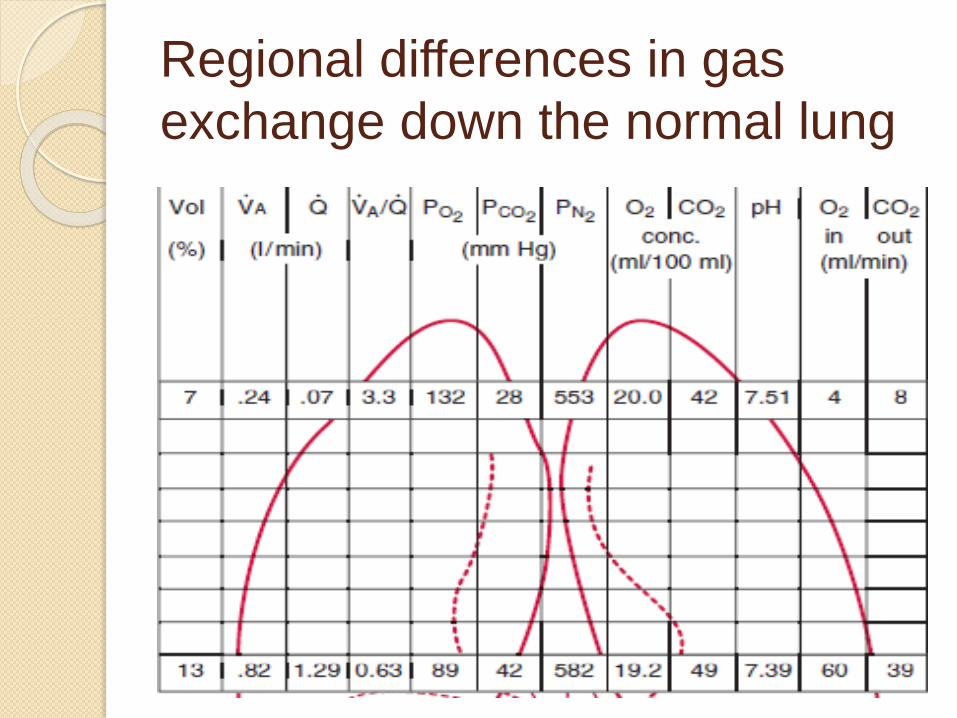
Regional differences in gas
exchange down the normal lung

Po2 at the apex is higher than at the
base of the lung.
However, the major share of the blood
leaving the lung comes from the lower
zones, where the Po2 is low.
This depresses the arterial oxygen
saturation.

V-Q mismatch in disease state.

Low V-Q ratio.

Units with high V-Q ratio add little oxygen to
the blood, compared the decrement caused
by the alveoli with the low ratio.
The net result of these mechanisms is a
depression of the arterial Po2 below that of
the mixed alveolar Po2—alveolar-arterial
O2 difference.
Normal-4

CO2 dissociation curve is linear
Although the elimination of CO2 is
impaired by V/Q inequality, this can
be corrected by increasing the
ventilation to the alveoli.

Distributions of Ventilation-
Perfusion Ratios
All the ventilation and blood flow goes to
compartments with normal V-Q ratio of 1.0.
no blood flow to the unventilated
compartment (shunt).
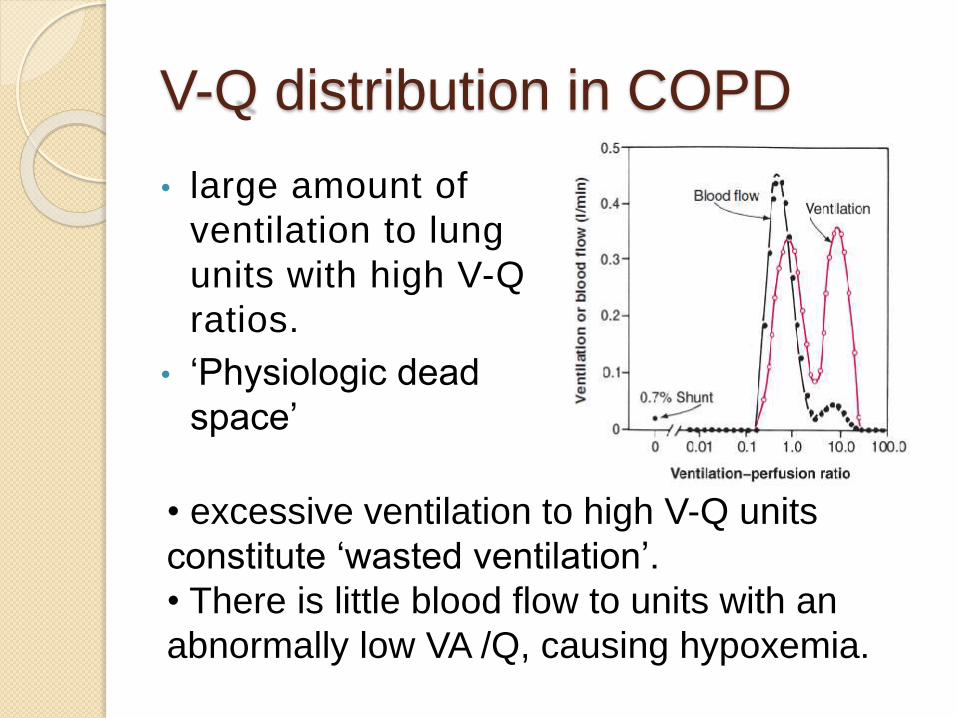
V-Q distribution in COPD
• large amount of
ventilation to lung
units with high V-Q
ratios.
• ‘Physiologic dead
space’
• excessive ventilation to high V-Q units
constitute ‘wasted ventilation’.
• There is little blood flow to units with an
abnormally low VA /Q, causing hypoxemia.

Increase in
ventilation to high
VA /Q units →physiologic dead
space.
large amounts of
blood flow to low VA
/Q units →physiologic shunt
→ severe
hypoxemia
type B disease.

Hypoxic vasoconstriction
Alveolar hypoxia constricts small pulmonary arteries
direct effect of the low PO2 on vascular smooth muscle
Directs blood flow away from poorly ventilated areas →minimizing the arterial hypoxemia.
Bronchodilators can abolish this mechanism and cause mild hypoxia by increasing the blood flow to poorly ventilated areas.
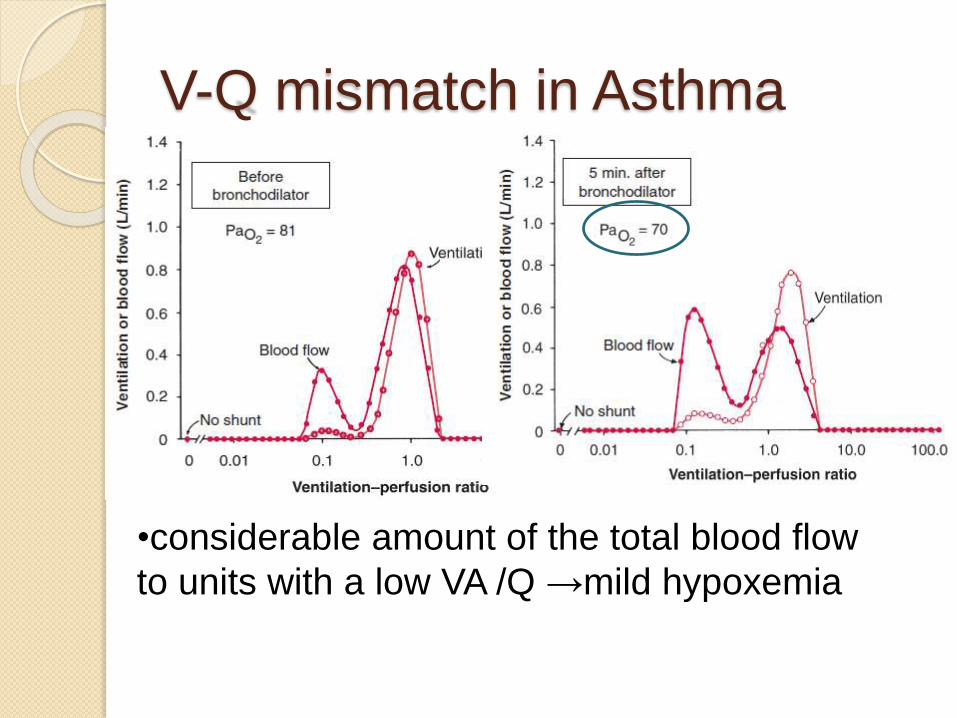
V-Q mismatch in Asthma
•considerable amount of the total blood flow
to units with a low VA /Q →mild hypoxemia

Bronchodilators increase the
hypoxemia, by abolishing the HPV
and , increasing the blood flow to lung
units with low V/Q ratio’s
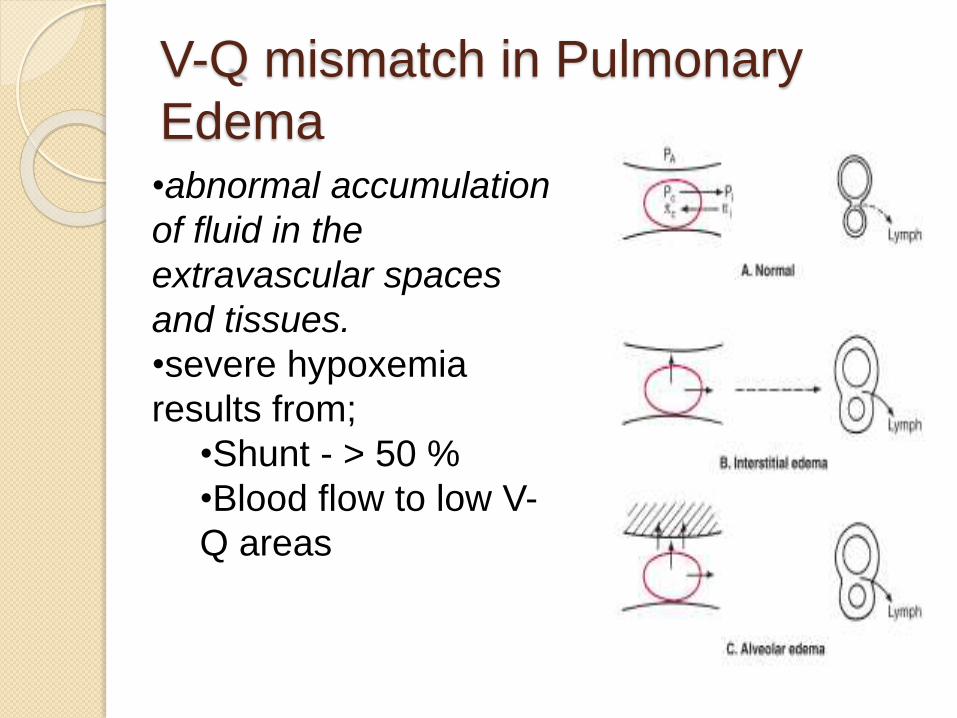
V-Q mismatch in Pulmonary
Edema•abnormal accumulation
of fluid in the
extravascular spaces
and tissues.
•severe hypoxemia
results from;
•Shunt - > 50 %
•Blood flow to low V-
Q areas


Pulmonary Embolism
Moderate hypoxemia without carbon
dioxide retention
diffusion impairment
opening up of latent pulmonary a-v
anastomoses
V-Q inequality-areas with High V-Q ratios
dead space ventilation
Shunting
blood flow is greatly reduced but not
completely absent, leading to areas
with high V-Q ratio’s.
Shunt occurs due to blood flow
through the areas with hemorrhagic
atelectasis, in which the alveoli are not
functional.
The large physiological dead space in
pulmonary embolism can cause
hypercapnia, however the substantial
increase in ventilation maintains the Paco2
at a normal level.
In the setting of acute PE, hypercapnia
reflects massive embolism as the
ventilatory muscles are unable to sustain
the marked increase of minute ventilation
needed to maintain normal arterial Paco2

Interstitial Pulmonary Fibrosis
Basic pathology -thickening of the
interstitium of the alveolar wall
Spirometry -restrictive pattern
Characterized by hypoxia and
hypocapnia at rest.
mild hypoxia at rest, worsened by
exercise.

Cause of hypoxia ?
Rest Exercise
V-Q Inequality
Major factor during rest
D.I minor factor, as lung
as enormous reserves
of diffusion at rest.
Diffusion impairment
Major factor during exercise
Exercise -↓ time for RBC’S in
pulmonary circulation
Further worsens hypoxia
V-Q Inequality
Inadequate ↑ in Cardiac output
( ↓PaO2 in mixed blood, ↑PVR
)
Inappropriately high
Respiratory rate→↑ dead
space Ventilation/ ↑V-Q

hypoxemia can be explained by the degree of
VA /Q inequality at rest.
Measured PaO2 below
predicted in exercise !
Additional hypoxemia is
due to D.I

DLCo as a diagnostic test ?
Dlco is strikingly reduced in ILD
Remains low in exercise, normal- ↑ 2-3 fold.
Etiology-
◦ thickening of the blood–gas barrier
◦ ↓blood volume because of obliterated of
blood vessels by the fibrotic process
→if the Dlco is not low, the diagnosis of
ILDshould be regarded with suspicion.

Diseases of the Chest Wall
Scoliosis -lateral curvature of the
spine
◦ More serious
kyphosis - posterior curvature.
Restrictive lung disease !
Hypoxemia due to :
◦ V-Q inequality
Atelectasis & compression of dependent areas
Airway closure
Hypercapnia
◦ Due to ↑ W.O.B caused by
Stiff chest wall
respiratory muscles operating at mechanical
disadvantage
◦ reduced ventilatory response to CO2

Take home points !
V-Q matching is required for maintaining normal PO2 and PCO2 levels in blood.
V-Q mismatching is one of the most common causes of hypoxia and rarely hypercapnia in most of the lung diseases.
Shunt and dead space ventilation are the two ends of the spectrum of V-Q mismatch.