venoco, inc. monterey shale focused analyst day
TRANSCRIPT

VENOCO, INC.
Monterey Shale Focused
Analyst Day
Wednesday, May 26, 2010
New York Plaza Hotel
www.venocoinc.com
NOTE: Slides 82, 85 and 89 were updated as of July 14, 2010
Cautionary Statement Regarding Forward Looking Information
2Venoco, Inc.
Statements included in this presentation, other than statements of historical fact, are forward-looking statements within the meaning of the Private Securities Litigation Reform Act of 1995. Venoco, Inc. (“Venoco” or “the Company”) cautions that assumptions, expectations, projections, intentions, or beliefs about future events may, and often do, vary from actual results and the differences can be material. Some of the key factors which could cause actual results to vary from those Venoco expects include changes in natural gas and oil prices, the timing and cost of planned capital expenditures, the timing of permits and/or approvals, availability of acquisitions, uncertainties in estimating proved reserves and forecasting production results, reserve estimates, cash flows and production and other costs, the availability and cost of gathering and transportation facilities and transportation arrangements, operational factors affecting the commencement or maintenance of producing wells, the condition of the capital markets generally, as well as the Company‟s ability to access them, and uncertainties regarding environmental regulations or litigation and other legal or regulatory developments affecting Venoco‟sbusiness. More information about the risks and uncertainties relating to Venoco's forward-looking statements may be found in the Company‟s SEC filings, including under the heading "Risk Factors" in Venoco's Annual Report on Form 10-K for the year ended December 31, 2009, and are incorporated herein by reference. You should not place undue reliance on these forward-looking statements, which speak only as of the date of this presentation. Forward looking statements made about the Hastings Complex and the contract with Denbury Resources are subject to business risks and uncertainties not in Venoco‟s control including, but not limited to the implementation of a CO2 flood and the production results and reserves if the flood is implemented. Forward looking statements made about the South Ellwood pipeline and lease extension projects are subject to risks and uncertainties relating to, among other things, the receipt of the governmental consents and approvals necessary to pursue the projects. The Company may not be able to complete its search for a joint venture partner relating to the Monterey shale on acceptable terms, in a timely manner, or at all. The Company‟s activities with respect to the Monterey shale are subject to numerous operating, geological and other risks and may not be successful. Our results in the onshore Monterey will be subject to greater risks than results in areas where we have more data and drilling experience. Results from our onshore Monterey project will depend on, among other things, our ability to identify productive intervals and drilling and completion techniques necessary to achieve commercial production from those intervals. Except as otherwise required by law, Venoco does not undertake any obligation to update any forward-looking or other statements as a result of new information, future events or otherwise.
Estimates of unproved reserves or resources which may potentially be recoverable through additional drilling or recovery techniques are by their nature more uncertain than estimates of proved reserves and accordingly are subject to substantially greater risk of not actually being realized by the Company.

The Company
3Venoco, Inc.
Venoco is an independent energy company engaged in the
acquisition, exploitation and development of oil and natural gas
properties primarily in California.
Applying new technology to revitalize legacy assets

Why does opportunity exist?
Majors have dominated since early 1900s
F&D in heavy oil fields best use of capital
Exploration teams built in early 1980s cut as oil price drops
Venoco founded in 1992 to acquire non-core assets in CA
Venoco acquires Monterey production in 1997, 1999
Venoco begins regional study in 2005
Venoco, Inc. 4
Monterey Shale
(1) Based on cum oil production to date.
(2) Internal estimates of Southern California oil basins.
(3) Venoco internal estimates of potential Monterey acreage.
(4) Based on estimated OOIP per 640 acre section of 80 MMBOE.
World Class Source Rock
Largest U.S. Oil Shale Play(1)
Southern California Multi 100-Billion
Barrels of OOIP(2)
Venoco is the “pure” Monterey play
with >350 Monterey barrels OOIP per
share
Leased >80% of onshore undeveloped
acres in the last 3 years
California
E&P
Mkt. Cap
$MM
(5/21/10)
California
Acreage
(Net)
Monterey
Acreage
(Net)
Monterey
Acres / $MM
Market Cap
Venoco $653 383,000 155,000 237
OXY $64,490 1,300,000 873,000 14
PXP $3,190 116,400 70,000(3) 22
NFG $3,880 23,100 14,000(3) 4
BRY $1,550 6,500 6,500 4

Monterey Competitive Landscape
Significant Competitors
Majors – Primarily Chevron
and AERA (Shell & Exxon)
Dominated since early
1900s
Focused on heavy oil
Occidental
Acquired many producing
fields
Acreage positions within
certain Venoco target areas
Lack of “Super-Independents”
in California
Venoco most active leasing
Monterey
Venoco, Inc. 5
Venoco
Occidental
Area of VQ-OXY Joint 3D Shoot
(Venoco field ownership in red text.)
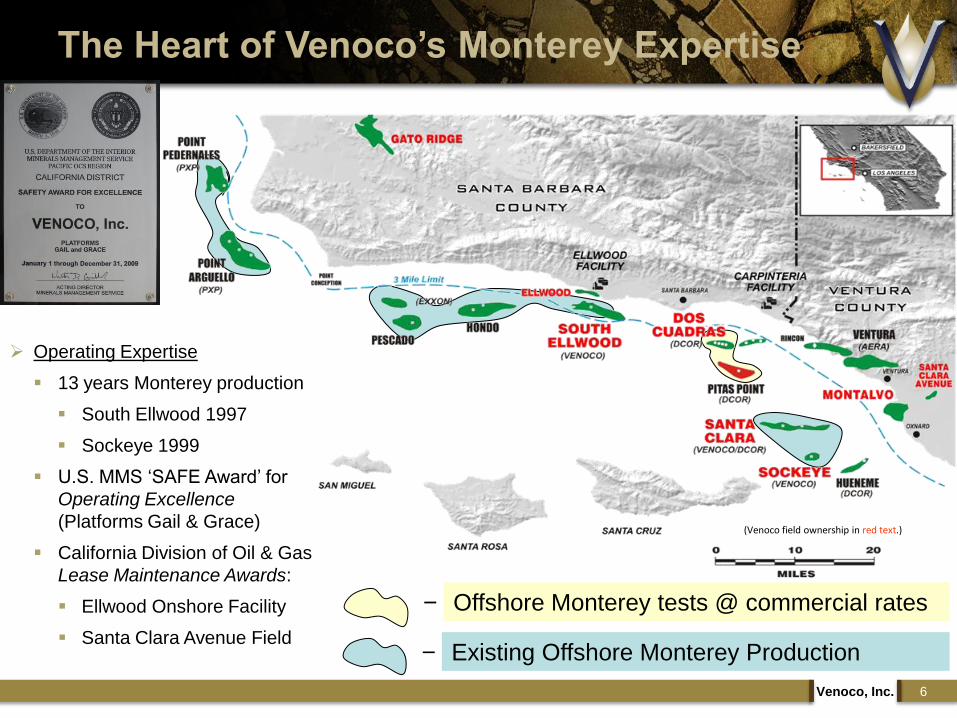
Existing Offshore Monterey Production–
Offshore Monterey tests @ commercial rates–
The Heart of Venoco’s Monterey Expertise
6Venoco, Inc.
Operating Expertise
13 years Monterey production
South Ellwood 1997
Sockeye 1999
U.S. MMS „SAFE Award‟ for
Operating Excellence
(Platforms Gail & Grace)
California Division of Oil & Gas
Lease Maintenance Awards:
Ellwood Onshore Facility
Santa Clara Avenue Field
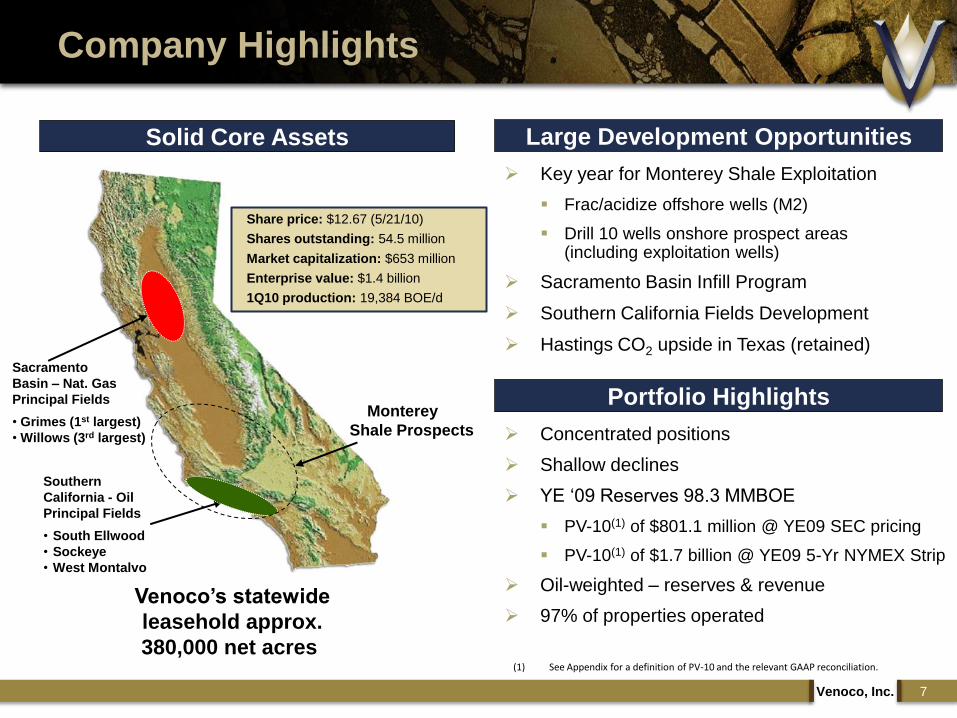
Company Highlights
7Venoco, Inc.
Concentrated positions
Shallow declines
YE „09 Reserves 98.3 MMBOE
PV-10(1) of $801.1 million @ YE09 SEC pricing
PV-10(1) of $1.7 billion @ YE09 5-Yr NYMEX Strip
Oil-weighted – reserves & revenue
97% of properties operated
Key year for Monterey Shale Exploitation
Frac/acidize offshore wells (M2)
Drill 10 wells onshore prospect areas (including exploitation wells)
Sacramento Basin Infill Program
Southern California Fields Development
Hastings CO2 upside in Texas (retained)Sacramento
Basin – Nat. Gas
Principal Fields
• Grimes (1st largest)
• Willows (3rd largest)
Southern
California - Oil
Principal Fields
• South Ellwood
• Sockeye
• West Montalvo
Monterey
Shale Prospects
Solid Core Assets Large Development Opportunities
Portfolio Highlights
(1) See Appendix for a definition of PV-10 and the relevant GAAP reconciliation.
Venoco’s statewide
leasehold approx.
380,000 net acres
Share price: $12.67 (5/21/10)
Shares outstanding: 54.5 million
Market capitalization: $653 million
Enterprise value: $1.4 billion
1Q10 production: 19,384 BOE/d
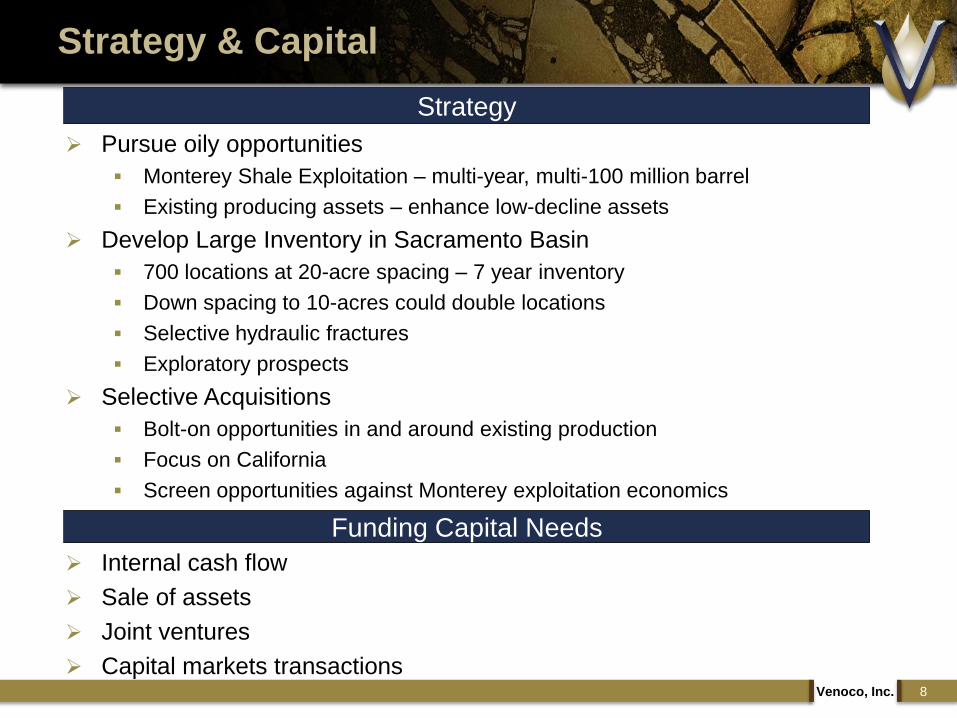
Pursue oily opportunities
Monterey Shale Exploitation – multi-year, multi-100 million barrel
Existing producing assets – enhance low-decline assets
Develop Large Inventory in Sacramento Basin
700 locations at 20-acre spacing – 7 year inventory
Down spacing to 10-acres could double locations
Selective hydraulic fractures
Exploratory prospects
Selective Acquisitions
Bolt-on opportunities in and around existing production
Focus on California
Screen opportunities against Monterey exploitation economics
Venoco, Inc. 8
Strategy & Capital
Strategy
Funding Capital Needs
Internal cash flow
Sale of assets
Joint ventures
Capital markets transactions
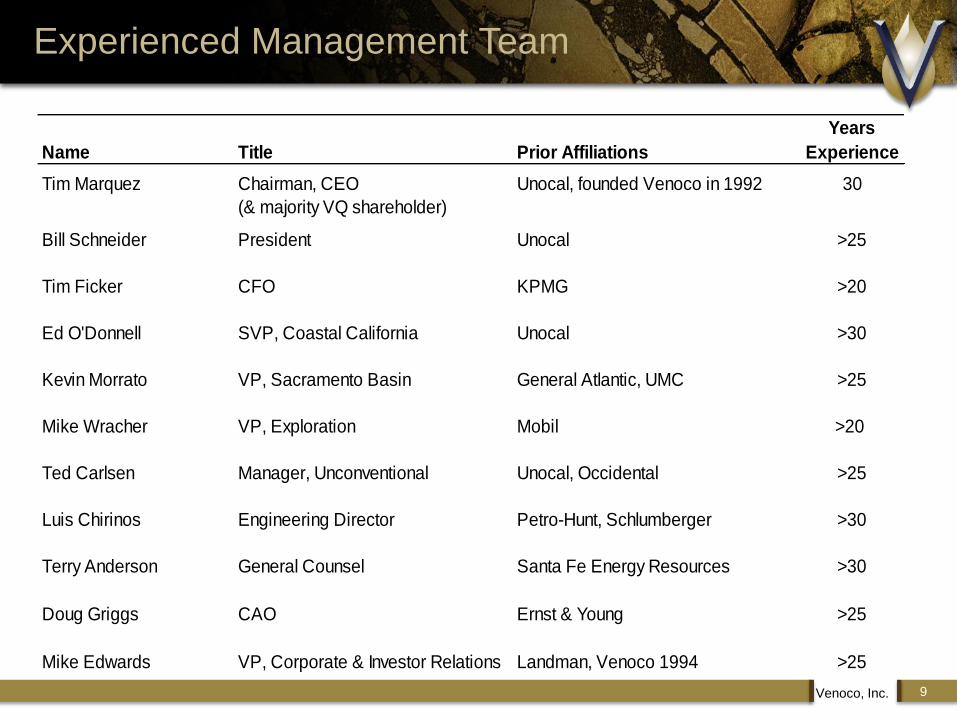
Experienced Management Team
9
Years
Name Title Prior Affiliations Experience
Tim Marquez Chairman, CEO
(& majority VQ shareholder)
Unocal, founded Venoco in 1992 30
Bill Schneider President Unocal >25
Tim Ficker CFO KPMG >20
Ed O'Donnell SVP, Coastal California Unocal >30
Kevin Morrato VP, Sacramento Basin General Atlantic, UMC >25
Mike Wracher VP, Exploration Mobil >20
Ted Carlsen Manager, Unconventional Unocal, Occidental >25
Luis Chirinos Engineering Director Petro-Hunt, Schlumberger >30
Terry Anderson General Counsel Santa Fe Energy Resources >30
Doug Griggs CAO Ernst & Young >25
Mike Edwards VP, Corporate & Investor Relations Landman, Venoco 1994 >25
Venoco, Inc.
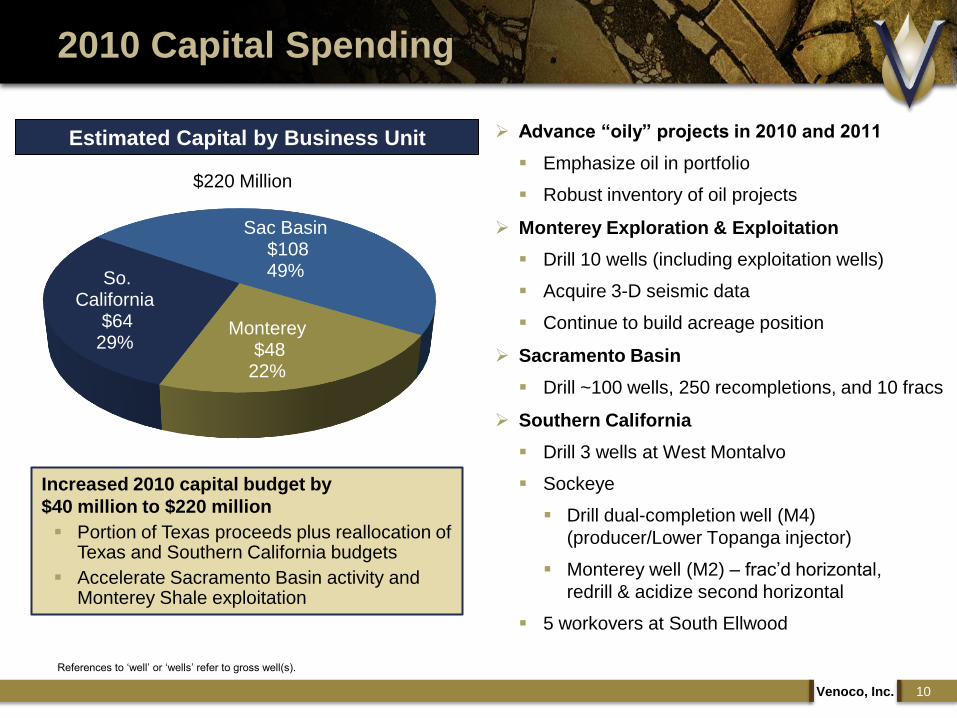
2010 Capital Spending
10Venoco, Inc.
Advance “oily” projects in 2010 and 2011
Emphasize oil in portfolio
Robust inventory of oil projects
Monterey Exploration & Exploitation
Drill 10 wells (including exploitation wells)
Acquire 3-D seismic data
Continue to build acreage position
Sacramento Basin
Drill ~100 wells, 250 recompletions, and 10 fracs
Southern California
Drill 3 wells at West Montalvo
Sockeye
Drill dual-completion well (M4)
(producer/Lower Topanga injector)
Monterey well (M2) – frac‟d horizontal,
redrill & acidize second horizontal
5 workovers at South Ellwood
References to „well‟ or „wells‟ refer to gross well(s).
Estimated Capital by Business Unit
$220 Million
So. California
$64 29%
Sac Basin$108 49%
Monterey$48
22%
Increased 2010 capital budget by
$40 million to $220 million
Portion of Texas proceeds plus reallocation of Texas and Southern California budgets
Accelerate Sacramento Basin activity and Monterey Shale exploitation
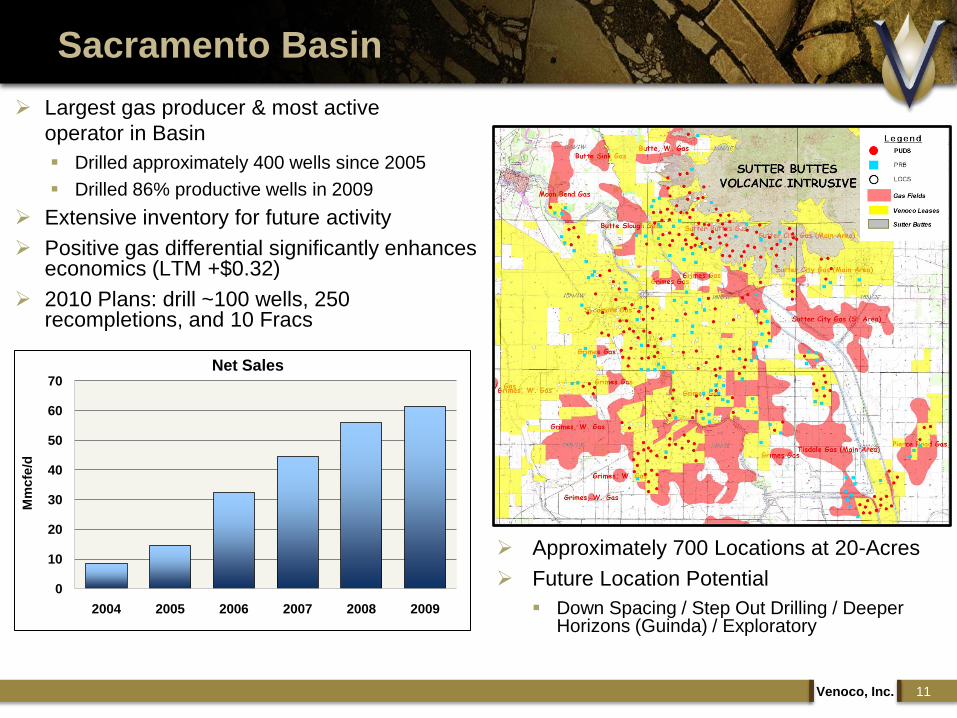
Sacramento Basin
11Venoco, Inc.
Approximately 700 Locations at 20-Acres
Future Location Potential
Down Spacing / Step Out Drilling / Deeper Horizons (Guinda) / Exploratory
Largest gas producer & most active
operator in Basin
Drilled approximately 400 wells since 2005
Drilled 86% productive wells in 2009
Extensive inventory for future activity
Positive gas differential significantly enhances economics (LTM +$0.32)
2010 Plans: drill ~100 wells, 250 recompletions, and 10 Fracs
0
10
20
30
40
50
60
70
2004 2005 2006 2007 2008 2009
Mm
cfe
/d
Net Sales
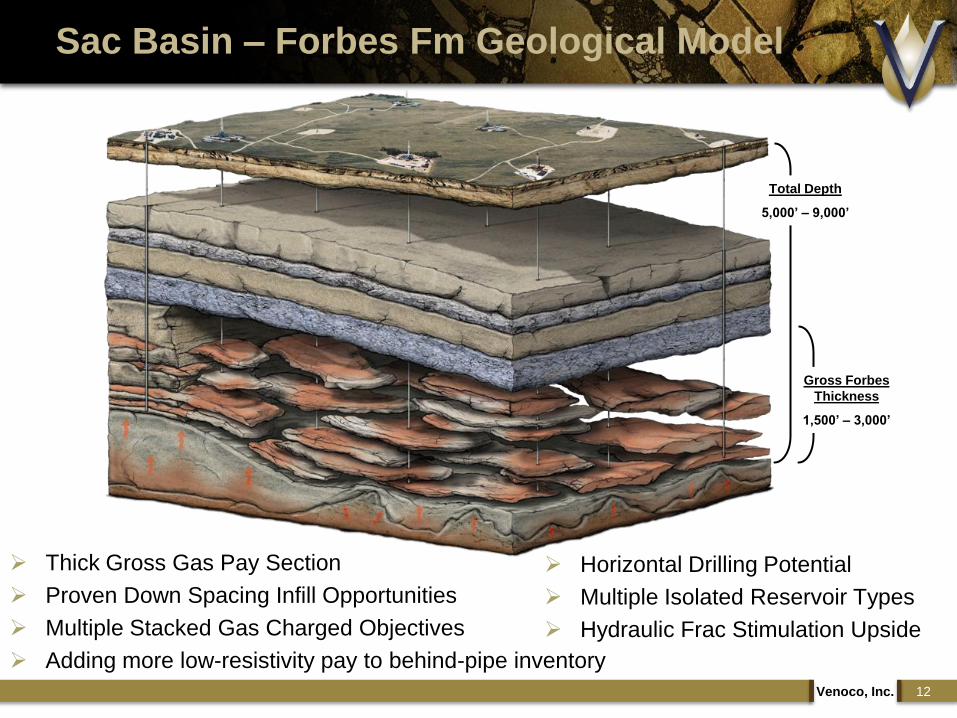
Sac Basin – Forbes Fm Geological Model
Gross Forbes
Thickness
1,500’ – 3,000’
Total Depth
5,000’ – 9,000’
Thick Gross Gas Pay Section
Proven Down Spacing Infill Opportunities
Multiple Stacked Gas Charged Objectives
Adding more low-resistivity pay to behind-pipe inventory
Horizontal Drilling Potential
Multiple Isolated Reservoir Types
Hydraulic Frac Stimulation Upside
12Venoco, Inc.

Sac Basin – Reinterpreting Pay
13Venoco, Inc.
Low SP =
more sand
Good Sonic
Porosity Strong Gas Show
More Typical Results:
(Channel Sand Pay)
High
Resistivity
Low Contrast/Resolution vs.. Traditional Channel Sand
Easily identifiable Channel
Sands developed in early
years

Sac Basin – Reinterpreting Pay
14Venoco, Inc.
Sycamore Field
Sutter County
Drilled 6/2007
Zone Open 5/2009
100 MCF/D Flat for 1 year
@ 100 psi
Frac‟d 4/2010
Post-Frac Rate
900 MCF/D @ 1800 psi
However, we‟ve been
successful in learning to
identify additional pay in
these distal laminates.
Flat SP =
less sand
Low
Resistivity
Faster ROP =
Softer Rock
No Gas
Effect on
Sonic
Actual Results:
Low Contrast/Resolution Pay
Modest Gas Shows
Low Contrast/Resolution vs.. Traditional Channel Sand
Log results in Low Contrast
/ Low Resolution Pay
Sac Basin Economics
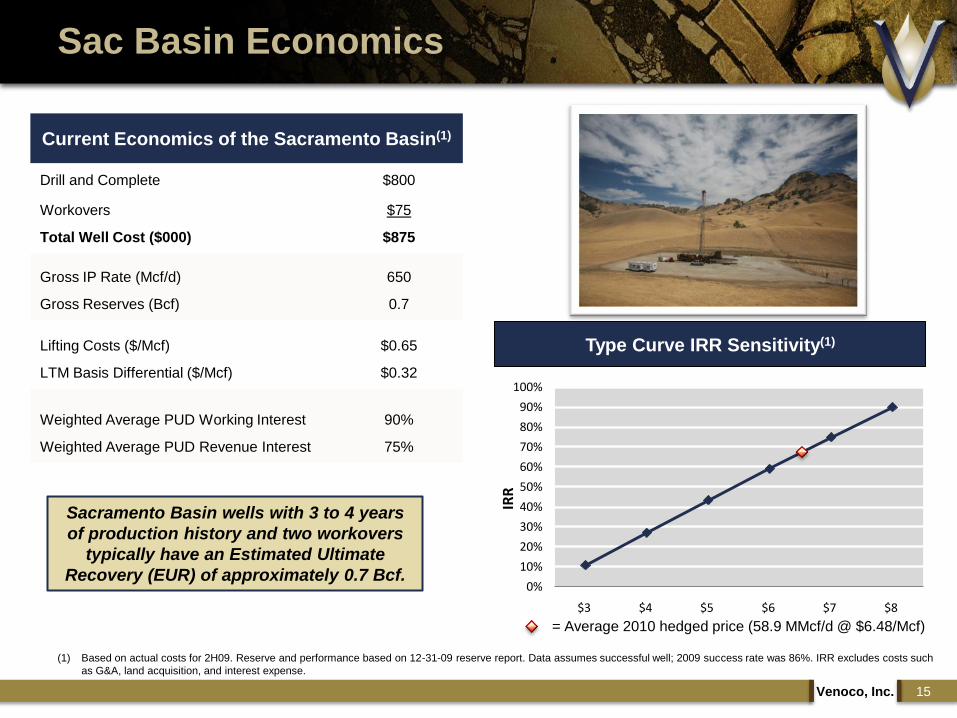
Current Economics of the Sacramento Basin(1)
Drill and Complete $800
Workovers $75
Total Well Cost ($000) $875
Gross IP Rate (Mcf/d) 650
Gross Reserves (Bcf) 0.7
Lifting Costs ($/Mcf) $0.65
LTM Basis Differential ($/Mcf) $0.32
Weighted Average PUD Working Interest 90%
Weighted Average PUD Revenue Interest 75%
(1) Based on actual costs for 2H09. Reserve and performance based on 12-31-09 reserve report. Data assumes successful well; 2009 success rate was 86%. IRR excludes costs such
as G&A, land acquisition, and interest expense.
Type Curve IRR Sensitivity(1)
Sacramento Basin wells with 3 to 4 years
of production history and two workovers
typically have an Estimated Ultimate
Recovery (EUR) of approximately 0.7 Bcf.0%
10%
20%
30%
40%
50%
60%
70%
80%
90%
100%
$3 $4 $5 $6 $7 $8
IRR
= Average 2010 hedged price (58.9 MMcf/d @ $6.48/Mcf)
15Venoco, Inc.
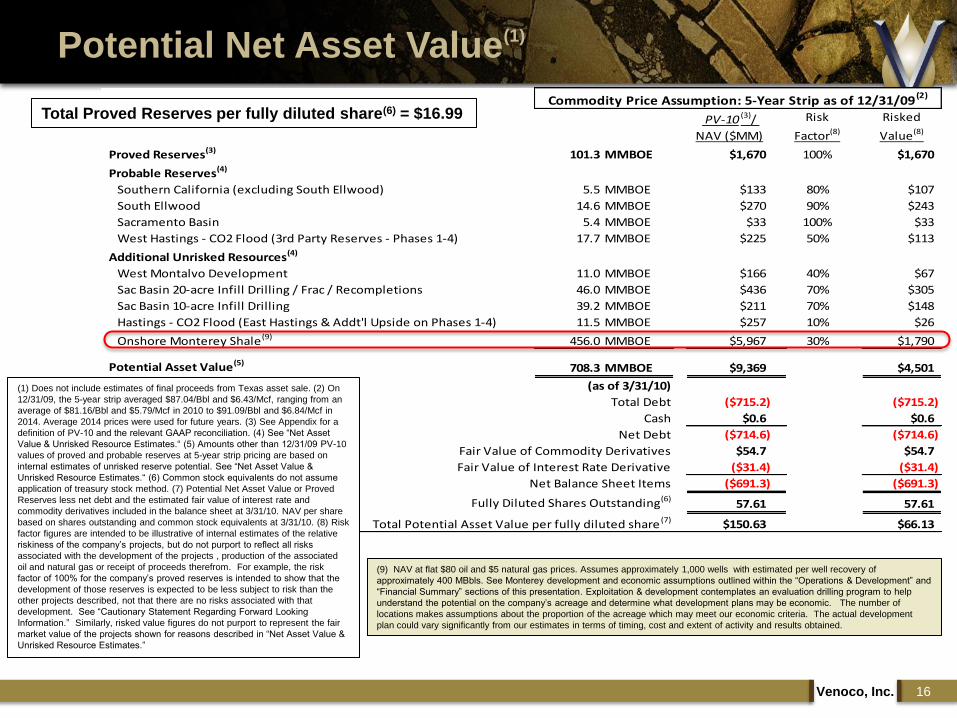
Potential Net Asset Value(1)
16Venoco, Inc.
PV-10 (3)/
NAV ($MM)
Risk
Factor(8)
Risked
Value(8)
Proved Reserves(3) 101.3 MMBOE $1,670 100% $1,670
Probable Reserves(4)
Southern California (excluding South Ellwood) 5.5 MMBOE $133 80% $107
South Ellwood 14.6 MMBOE $270 90% $243
Sacramento Basin 5.4 MMBOE $33 100% $33
West Hastings - CO2 Flood (3rd Party Reserves - Phases 1-4) 17.7 MMBOE $225 50% $113
Additional Unrisked Resources(4)
West Montalvo Development 11.0 MMBOE $166 40% $67
Sac Basin 20-acre Infill Drilling / Frac / Recompletions 46.0 MMBOE $436 70% $305
Sac Basin 10-acre Infill Drilling 39.2 MMBOE $211 70% $148
Hastings - CO2 Flood (East Hastings & Addt'l Upside on Phases 1-4) 11.5 MMBOE $257 10% $26
Onshore Monterey Shale(9) 456.0 MMBOE $5,967 30% $1,790
Potential Asset Value(5)708.3 MMBOE $9,369 $4,501
(as of 3/31/10)
Total Debt ($715.2) ($715.2)
Cash $0.6 $0.6
Net Debt ($714.6) ($714.6)
Fair Value of Commodity Derivatives $54.7 $54.7
Fair Value of Interest Rate Derivative ($31.4) ($31.4)
Net Balance Sheet Items ($691.3) ($691.3)
Fully Diluted Shares Outstanding(6)57.61 57.61
Total Potential Asset Value per fully diluted share (7) $150.63 $66.13
Commodity Price Assumption: 5-Year Strip as of 12/31/09(2)
(1) Does not include estimates of final proceeds from Texas asset sale. (2) On
12/31/09, the 5-year strip averaged $87.04/Bbl and $6.43/Mcf, ranging from an
average of $81.16/Bbl and $5.79/Mcf in 2010 to $91.09/Bbl and $6.84/Mcf in
2014. Average 2014 prices were used for future years. (3) See Appendix for a
definition of PV-10 and the relevant GAAP reconciliation. (4) See “Net Asset
Value & Unrisked Resource Estimates.“ (5) Amounts other than 12/31/09 PV-10
values of proved and probable reserves at 5-year strip pricing are based on
internal estimates of unrisked reserve potential. See “Net Asset Value &
Unrisked Resource Estimates.“ (6) Common stock equivalents do not assume
application of treasury stock method. (7) Potential Net Asset Value or Proved
Reserves less net debt and the estimated fair value of interest rate and
commodity derivatives included in the balance sheet at 3/31/10. NAV per share
based on shares outstanding and common stock equivalents at 3/31/10. (8) Risk
factor figures are intended to be illustrative of internal estimates of the relative
riskiness of the company‟s projects, but do not purport to reflect all risks
associated with the development of the projects , production of the associated
oil and natural gas or receipt of proceeds therefrom. For example, the risk
factor of 100% for the company‟s proved reserves is intended to show that the
development of those reserves is expected to be less subject to risk than the
other projects described, not that there are no risks associated with that
development. See “Cautionary Statement Regarding Forward Looking
Information.” Similarly, risked value figures do not purport to represent the fair
market value of the projects shown for reasons described in “Net Asset Value &
Unrisked Resource Estimates.”
Total Proved Reserves per fully diluted share(6) = $16.99
(9) NAV at flat $80 oil and $5 natural gas prices. Assumes approximately 1,000 wells with estimated per well recovery of
approximately 400 MBbls. See Monterey development and economic assumptions outlined within the “Operations & Development” and
“Financial Summary” sections of this presentation. Exploitation & development contemplates an evaluation drilling program to help
understand the potential on the company‟s acreage and determine what development plans may be economic. The number of
locations makes assumptions about the proportion of the acreage which may meet our economic criteria. The actual development
plan could vary significantly from our estimates in terms of timing, cost and extent of activity and results obtained.
Monterey Shale
Mike Wracher
Vice President, Exploration

Monterey Overview and Venoco‟s Opportunity
Monterey Primer – Luis Chirinos, Engineering Director History of Monterey production and its technical drivers
Characterizing the Monterey – Marc Kamerling, PhD, Senior Geologist Monterey geology and geophysical properties
Characterizing Monterey Production – Mike Wracher, VP Exploration Monterey reservoir performance
Operations & Development – Ed O‟Donnell, Sr. VP Southern California Asset optimization and three pilot development projects
Financial Summary & Wrap Up – Tim Marquez, Chairman & CEO 5-Year Monterey Forecast and NAV
Questions & Answers
Venoco, Inc. 18
Today’s Agenda

Enormous Original Oil in Place
Venoco estimates >20 billion barrels OOIP(1) on onshore
undeveloped acreage
“The best analog for the Monterey is the Monterey”
Monterey has produced more oil than any other shale
Monterey fields account for 2.5 billion barrels of recoverable oil
Venoco has identified 30 key areas within current onshore Monterey
acreage position
Recent advances in “unconventional” development technology have the
potential to unlock immense reserves in the Monterey
Much current Monterey production from conventional traps and
natural fractures
We expect future development to be driven by modern reservoir
characterization and highly deviated frac‟d/acidized completion
techniques
Venoco, Inc. 19
The Monterey
(1) Internal estimates.
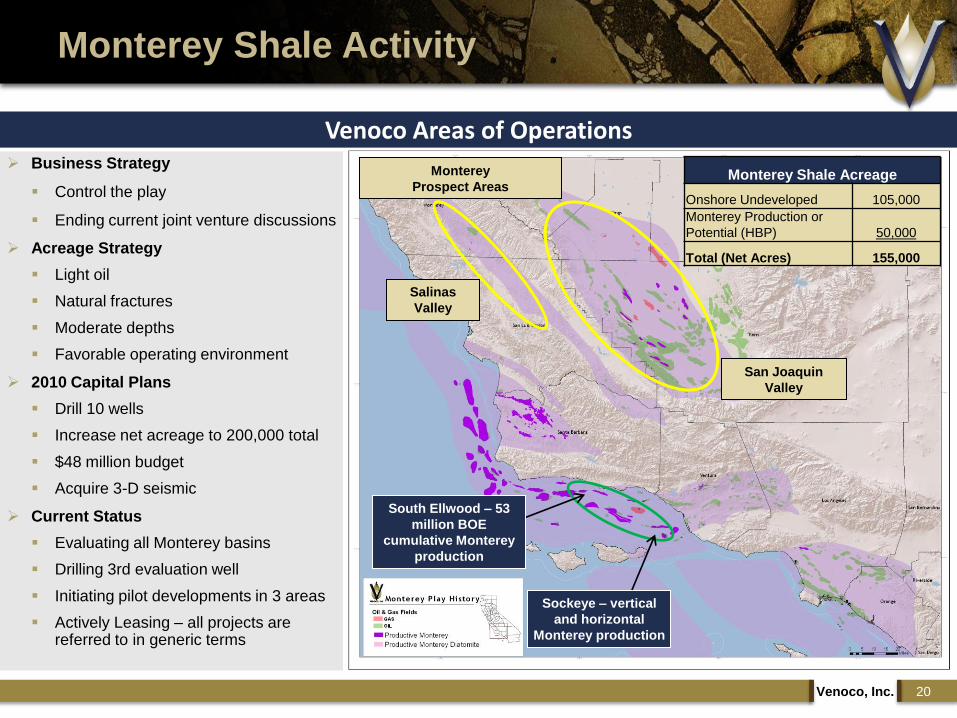
Business Strategy
Control the play
Ending current joint venture discussions
Acreage Strategy
Light oil
Natural fractures
Moderate depths
Favorable operating environment
2010 Capital Plans
Drill 10 wells
Increase net acreage to 200,000 total
$48 million budget
Acquire 3-D seismic
Current Status
Evaluating all Monterey basins
Drilling 3rd evaluation well
Initiating pilot developments in 3 areas
Actively Leasing – all projects are referred to in generic terms
Monterey
Prospect Areas
San Joaquin
Valley
Salinas
Valley
South Ellwood – 53
million BOE
cumulative Monterey
production
Sockeye – vertical
and horizontal
Monterey production
Monterey Shale Activity
Venoco, Inc. 20
Venoco Areas of Operations
Monterey Shale Acreage
Onshore Undeveloped 105,000
Monterey Production or
Potential (HBP) 50,000
Total (Net Acres) 155,000

Increase total acreage position to 350,000 net acres
Drill original 30 evaluation areas and 60-80 development wells
3-year capital expenditures of approximately $350 million
Estimated Monterey production approaching 40,000 BOE/d by 2014(1)
Modeled resource ~500 million BOE(1)
Unrisked NAV >$5 billion(1)
Additional resource upside: Each 1% recovery = ~200 million BOE
Venoco, Inc. 21
Three Year Opportunity
Activity 2010 2011 2012
Evaluation Drilling 7 wells 8 wells 12 wells
Seismic Initiate 500 sq. mile
joint VQ-OXY
seismic acquisition
Complete joint
seismic acquisition
Land Lease 60,000
additional net acres
Lease150,000
additional net acres
Development Drilling 3 wells 22 wells 38 wells
Capital $48 million $120-140 million $160-180 million
(1) See Monterey development and economic assumptions outlined within the “Operations & Development” and “Financial Summary” sections of this presentation. Also
see “Cautionary Statement Regarding Forward Looking Information” and “Net Asset Value & Unrisked Resource Estimates.”
Monterey PrimerLuis Chirinos
Engineering Director

Long history of production from organic shales
Monterey has produced for over a century
Technology to fully exploit its potential is very recent
Technical drivers
Drilling methods, completion technology, production
optimization, analysis
Venoco, Inc. 23
History of Shale Production
Devonian
(NY)
Ohio
Antrim
Monterey
(offshore)
Monterey
(onshore)
Barnett
& BakkenHaynesville
& Marcellus
Ho
rizo
nta
l Drilli
ng
Mo
de
rn P
etr
op
hysic
al M
od
el 1
99
8
Mu
lti-sta
ge
fra
cs in
Ba
rne
tt 2
00
1
Se
ism
ic m
on
ito
rin
g B
arn
ett
c 2
00
0
1stB
arn
ett
MH
F jo
b 1
98
5

Lost Hills
Belridge
Elk Hills
North
Shafter
Monterey – Abundant Data Exists
Venoco, Inc. 24
Overview of wells and logs by region
Prospect Area Wellbores penetrating Monterey VQ acquired open hole logs Tests or production Monterey Additional wells studied
One 43 17 33 292
Two 62 49 12 18
Three 200 100 151 2,950
Total 305 166 196 3,260
Massive amount of data has
been collected in the Monterey
>300 wells have penetrated the
Monterey in our areas of interest
~200 of those wells tested or
produced from the Monterey
We have analyzed the logs on
over 50 of these wells
Wells penetrating the Monterey

Matrix Dominated
Pore throat size controls permeability
Storage proportional to porosity
Peak rate proportional to matrix permeability.
May require hydraulic fracturing
Decline proportional to storage volume
Dual Porosity
Best permeability if open fractures
Storage partitioned between matrix and fractures
High peak rate
Moderate decline depending on matrix
permeability
Venoco, Inc. 25
Controls on Productivity And Reserves
Fracture Dominated
Productivity controlled by the Number + Frequency + Aperture + Orientation of fractures
Storage proportional to fracture volume
High peak rate
High initial decline, flattening according to areal extent of fractures
Pore Throat Size

Reserves per well
Production rate
Well cost
Modern petrophysical methods
Modern drilling and completion techniques
Horizontal drilling – single and multi-lateral
Massive hydraulic fracturing
Multi-stage stimulation
Seismic monitoring
Brittleness
Thickness
Depth
Porosity / Permeability
Oil Gravity / Oil in place
Venoco, Inc. 26
Identifying Quality Matrix
Key Rock & Fluid
Properties
Enabling
Technologies
Economic
Drivers

Venoco, Inc. 27
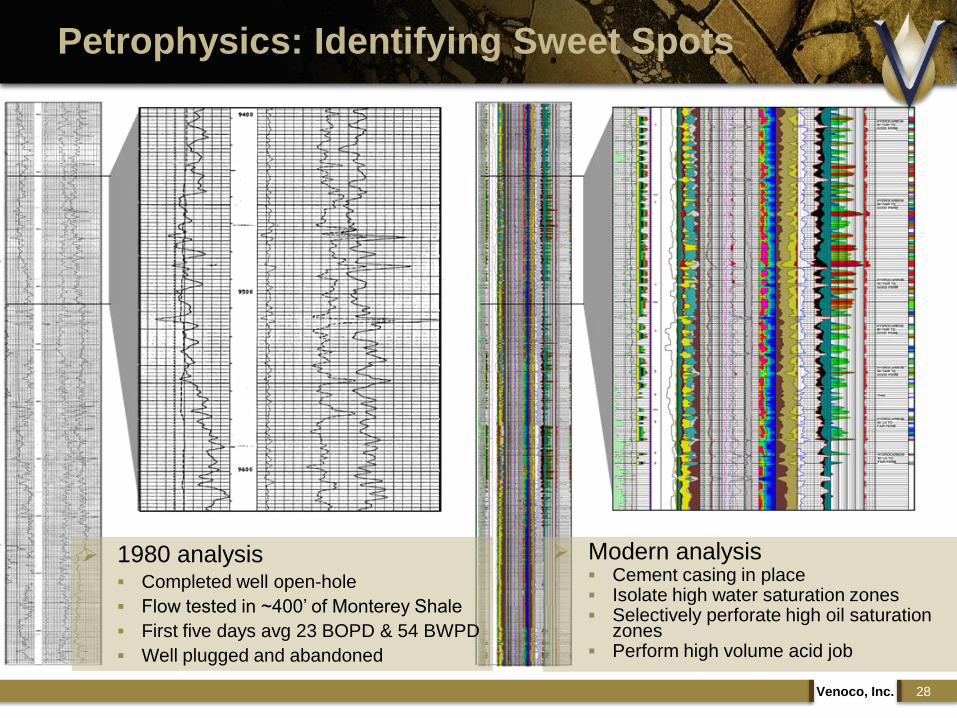
Petrophysics: Identifying Sweet Spots
An old well on our acreage
Drilled before modern
evaluation methods were
available
Old logs re-processed with
new petrophysical model
Identifies oil reservoirs
Venoco, Inc. 28
Petrophysics: Identifying Sweet Spots
1980 analysis Completed well open-hole
Flow tested in ~400‟ of Monterey Shale
First five days avg 23 BOPD & 54 BWPD
Well plugged and abandoned
Modern analysis Cement casing in place Isolate high water saturation zones Selectively perforate high oil saturation
zones Perform high volume acid job
Venoco, Inc. 29
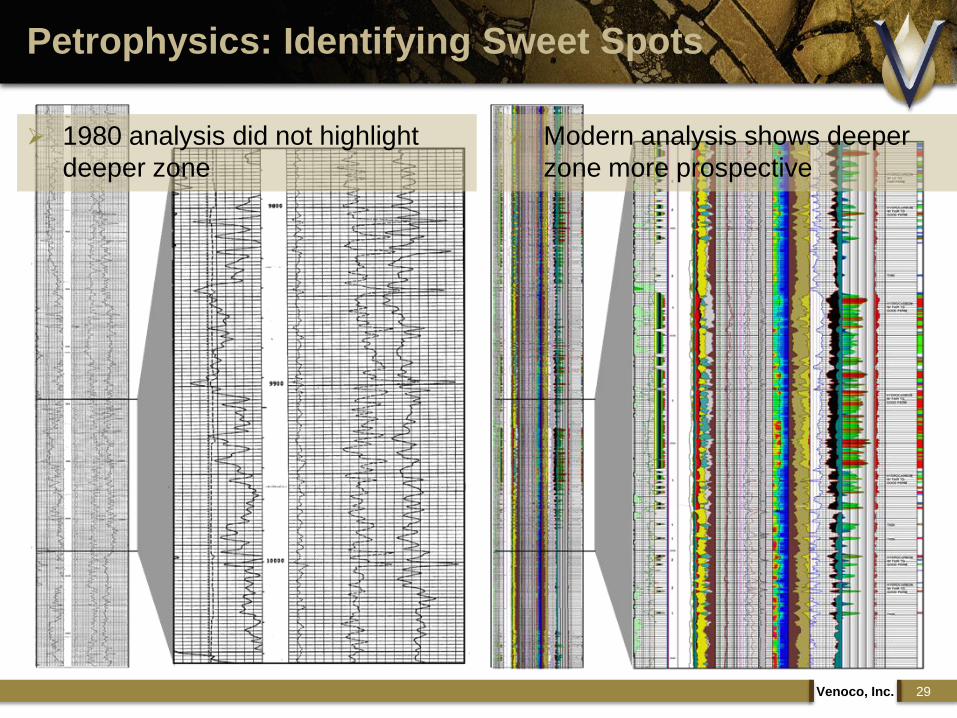
Petrophysics: Identifying Sweet Spots
1980 analysis did not highlight
deeper zone
Modern analysis shows deeper
zone more prospective
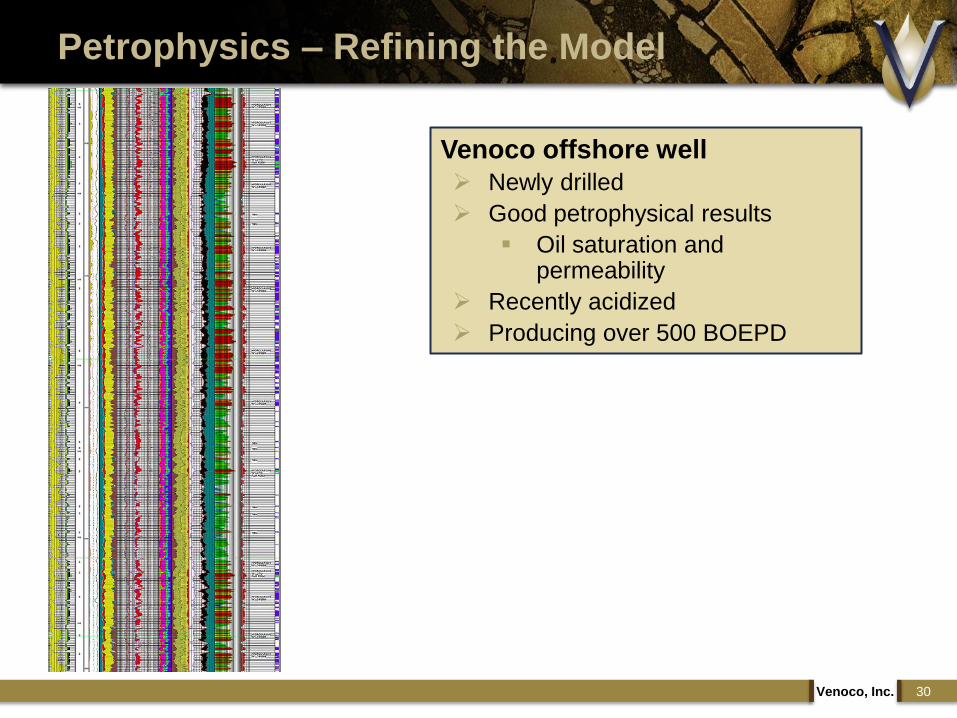
Petrophysics – Refining the Model
Venoco, Inc. 30
Venoco offshore well
Newly drilled
Good petrophysical results
Oil saturation and permeability
Recently acidized
Producing over 500 BOEPD
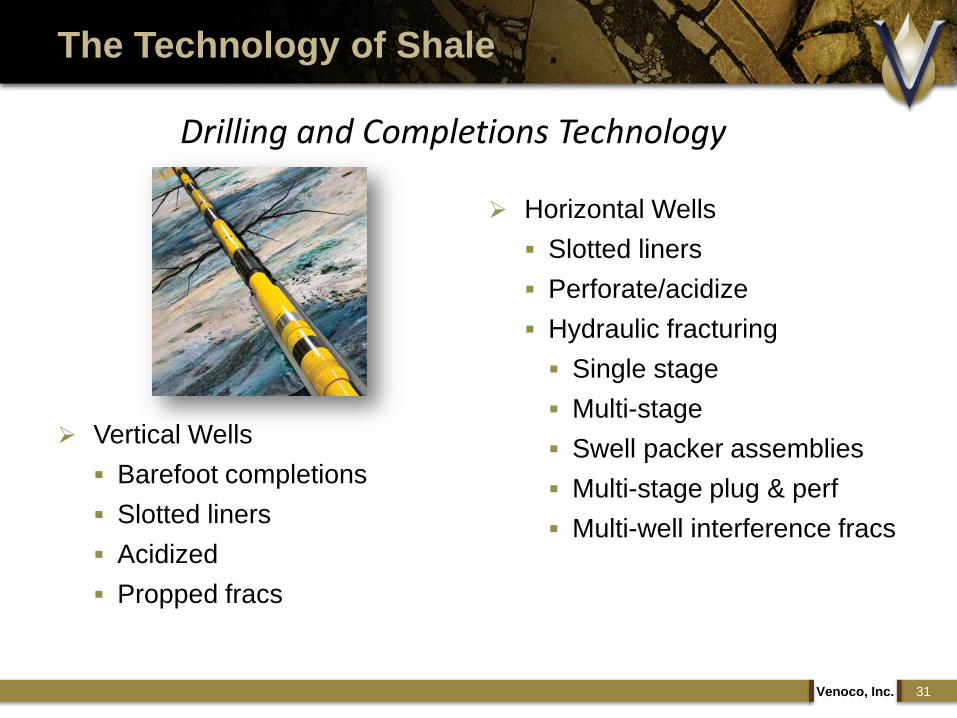
The Technology of Shale
Vertical Wells
Barefoot completions
Slotted liners
Acidized
Propped fracs
Horizontal Wells
Slotted liners
Perforate/acidize
Hydraulic fracturing
Single stage
Multi-stage
Swell packer assemblies
Multi-stage plug & perf
Multi-well interference fracs
Venoco, Inc. 31
Drilling and Completions Technology
Venoco, Inc. 32
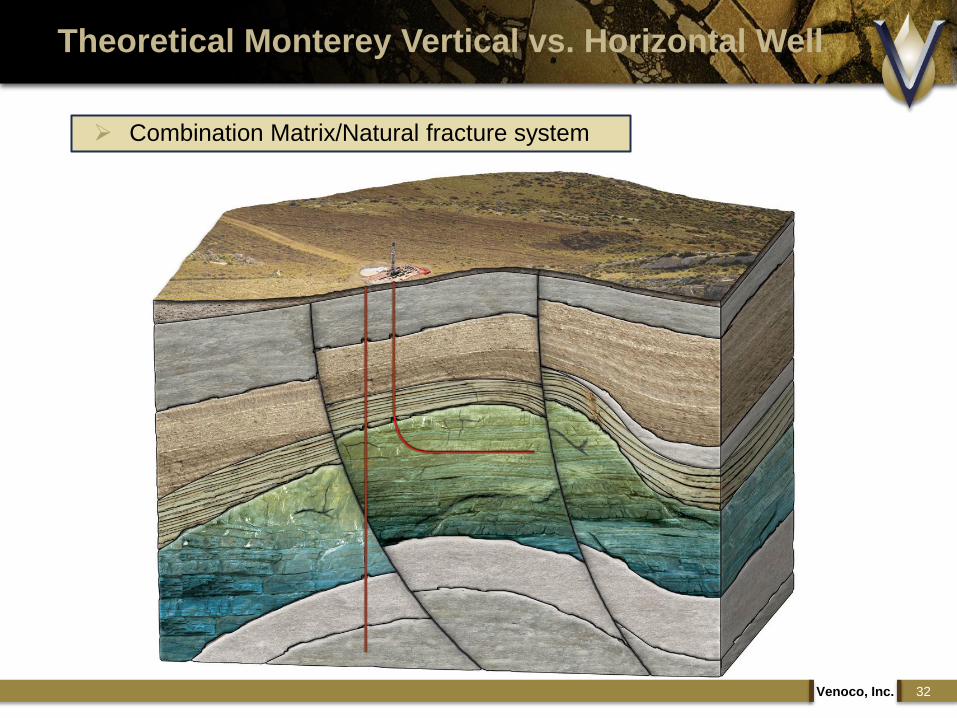
Theoretical Monterey Vertical vs. Horizontal Well
Combination Matrix/Natural fracture system
Venoco, Inc. 33
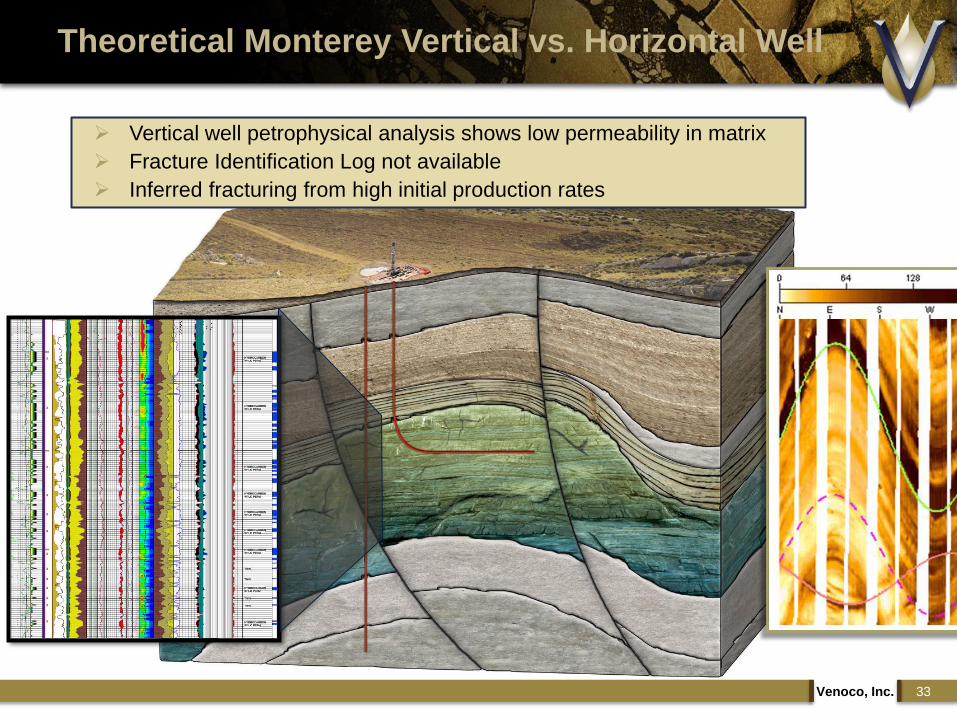
Theoretical Monterey Vertical vs. Horizontal Well
Vertical well petrophysical analysis shows low permeability in matrix
Fracture Identification Log not available
Inferred fracturing from high initial production rates
Venoco, Inc. 34
Theoretical Monterey Vertical vs. Horizontal Well
0200400600800
1,0001,2001,4001,6001,800
7/1
/20
10
3/1
/20
11
11
/1/2
01
1
7/1
/20
12
3/1
/20
13
11
/1/2
01
3
7/1
/20
14
3/1
/20
15
11
/1/2
01
5
7/1
/20
16
3/1
/20
17
11
/1/2
01
7
7/1
/20
18
3/1
/20
19
11
/1/2
01
9
Estimated Production Profiles
Vertical Horizontal
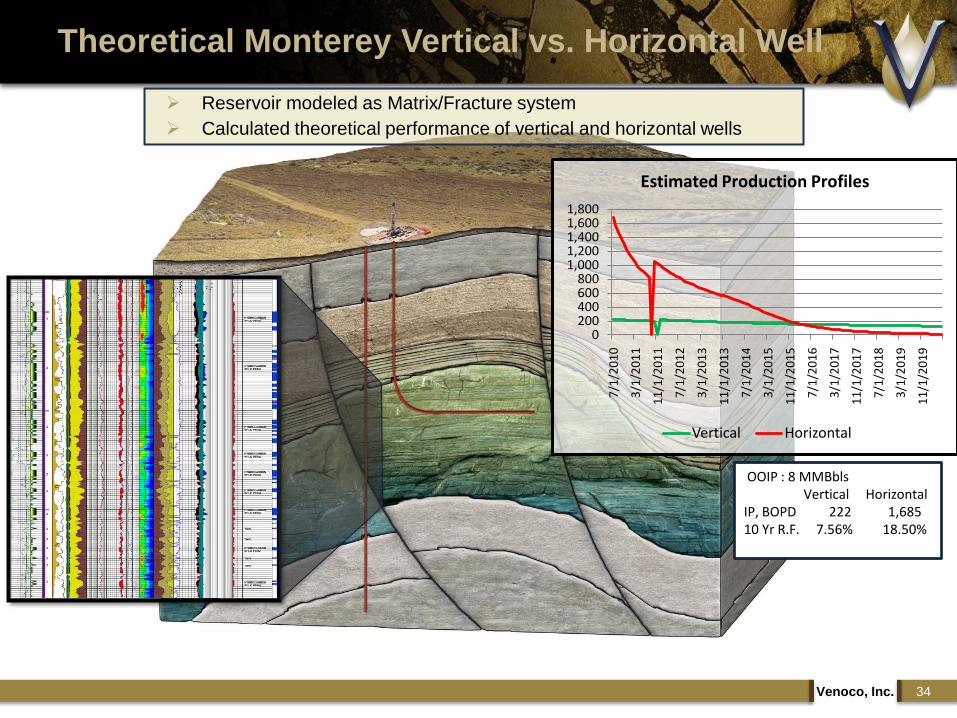
Reservoir modeled as Matrix/Fracture system
Calculated theoretical performance of vertical and horizontal wells
OOIP : 8 MMBblsVertical Horizontal
IP, BOPD 222 1,68510 Yr R.F. 7.56% 18.50%

The Monterey compares very favorably to unconventional oil plays
Enormous amounts of hydrocarbons in place
Venoco, Inc. 35
Comparing Shale Plays
Reservoir TVDThickness
(ft)Oil
GravityPerm (md)
Por. (%)
Oil Sat.TOC(%)
OOIP / 640 acres (MMBbls)
EUR / 640 acres
(MMBbls)
Middle Bakken(1)
8,500’ to 10,500’
140’ 42o .005 –0.2
5 75% 6-20% 5 0.50
Niobrara2,000’ to
8000’>150’ 39o n/a 6 50% 5% 40 n/a
Eagle Ford8,000’ to 14,000’
250’ 45o 0.0013 12 72% 4.7% 30 1.57
MontereyProject C
7,000’ to 14,000’
500 - 6000’ 42o 1.3 -18.7 (2) 13 - 29 61% 5% 84 3.10
(1) From USGS Paper 1653.
(2) Venoco net pay estimates based on 1 millidarcy or better permeability.

Producing Monterey reservoirs have EUR‟s in excess of 2.5 billion BOE(1)
The Monterey is the source rock for over 37 billion BOE in producing California fields
For comparison, the Bakken is expected to produce 3 to 4 billion BOE (U.S. Geological Survey Assessment (April 10, 2008)
Venoco, Inc. 36
Primer – Monterey vs. Bakken
Reservoir TVDNet Pay
(ft)Oil
GravityPerm (md)
Por. (%)
Oil Sat.BHT(o F)
OOIP / 640acres
(MMBbls)
EUR/640 acres
(MMBOE)
Middle Bakken(2)
8,500’ to 10,500’
8’ – 14’ 42o .005 – 0.2 8 – 10 75% 240o 5 0.5
Monterey Project A
6,000’ to 11,500’
193’(3) 33o3.73 25 49% 228o 71 2.1
Monterey Project B
9,900’ to11,000’
242’ 27o1 – 18.9 26 53% 233o 97 2.4
Monterey Project C
7,000’ to 14,000’
44 – 387’ 42o1.3 – 18.7 13 - 29 61% 264o 84 3.1
(1) Assumes 250MMBOE Belridge. 200MMBOE for Lost Hills.
(2) From USGS Paper 1653.
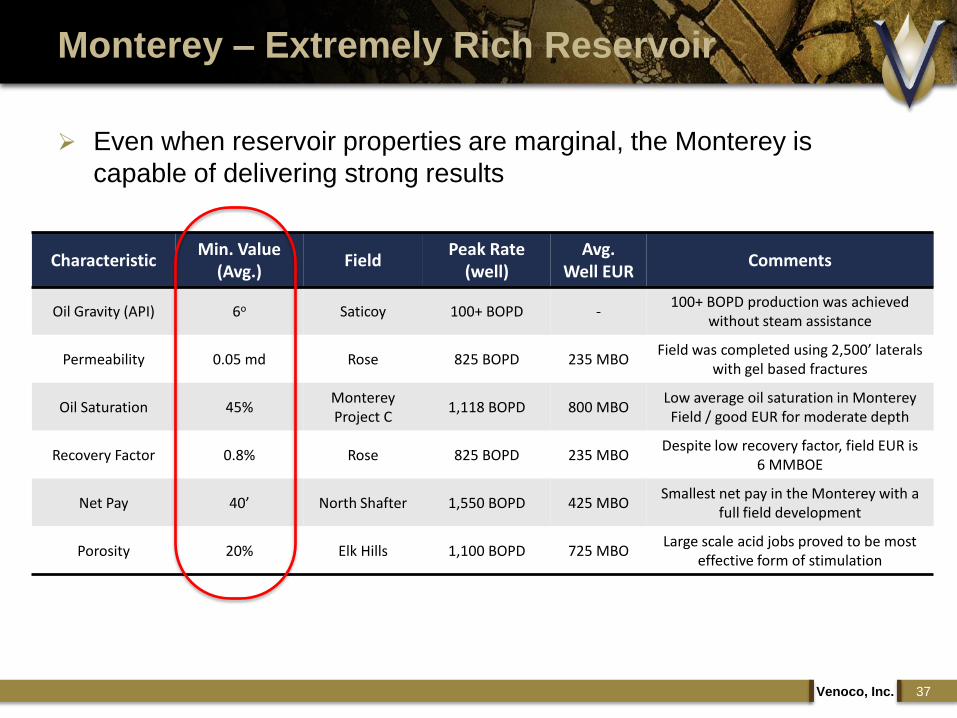
CharacteristicMin. Value
(Avg.)Field
Peak Rate (well)
Avg. Well EUR
Comments
Oil Gravity (API) 6o Saticoy 100+ BOPD -100+ BOPD production was achieved
without steam assistance
Permeability 0.05 md Rose 825 BOPD 235 MBOField was completed using 2,500’ laterals
with gel based fractures
Oil Saturation 45%Monterey Project C
1,118 BOPD 800 MBOLow average oil saturation in Monterey Field / good EUR for moderate depth
Recovery Factor 0.8% Rose 825 BOPD 235 MBODespite low recovery factor, field EUR is
6 MMBOE
Net Pay 40’ North Shafter 1,550 BOPD 425 MBOSmallest net pay in the Monterey with a
full field development
Porosity 20% Elk Hills 1,100 BOPD 725 MBOLarge scale acid jobs proved to be most
effective form of stimulation
Venoco, Inc. 37
Monterey – Extremely Rich Reservoir
Even when reservoir properties are marginal, the Monterey is
capable of delivering strong results
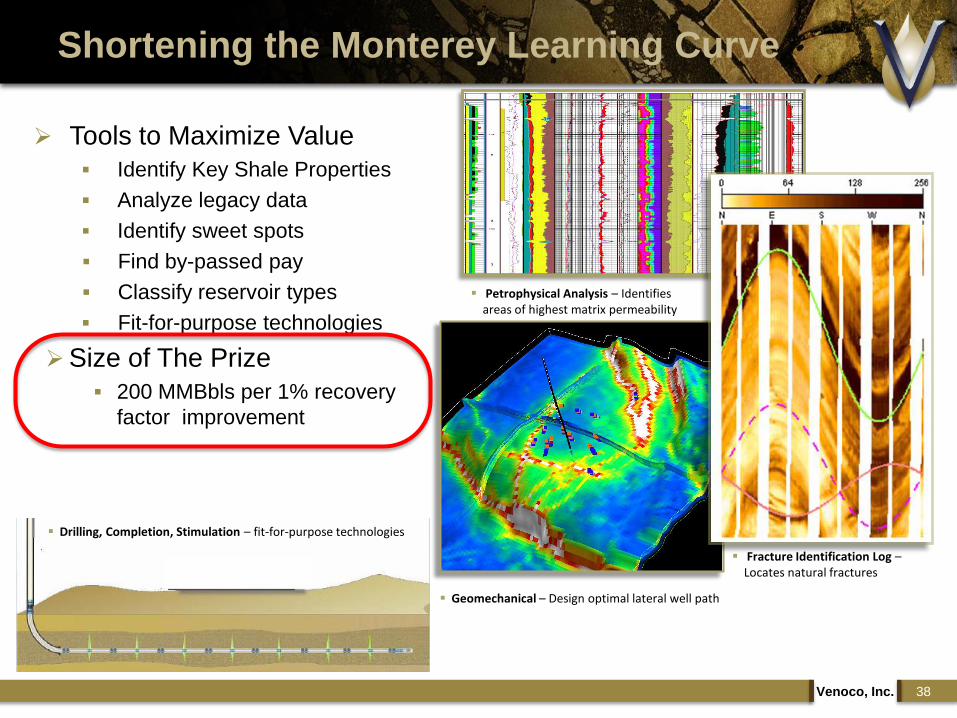
Shortening the Monterey Learning Curve
Venoco, Inc. 38
Tools to Maximize Value
Identify Key Shale Properties
Analyze legacy data
Identify sweet spots
Find by-passed pay
Classify reservoir types
Fit-for-purpose technologies
Size of The Prize
200 MMBbls per 1% recovery
factor improvement
Petrophysical Analysis – Identifies areas of highest matrix permeability
Fracture Identification Log –Locates natural fractures
Geomechanical – Design optimal lateral well path
Drilling, Completion, Stimulation – fit-for-purpose technologies
Characterizing the MontereyMarc Kamerling, PhD
Senior Geologist
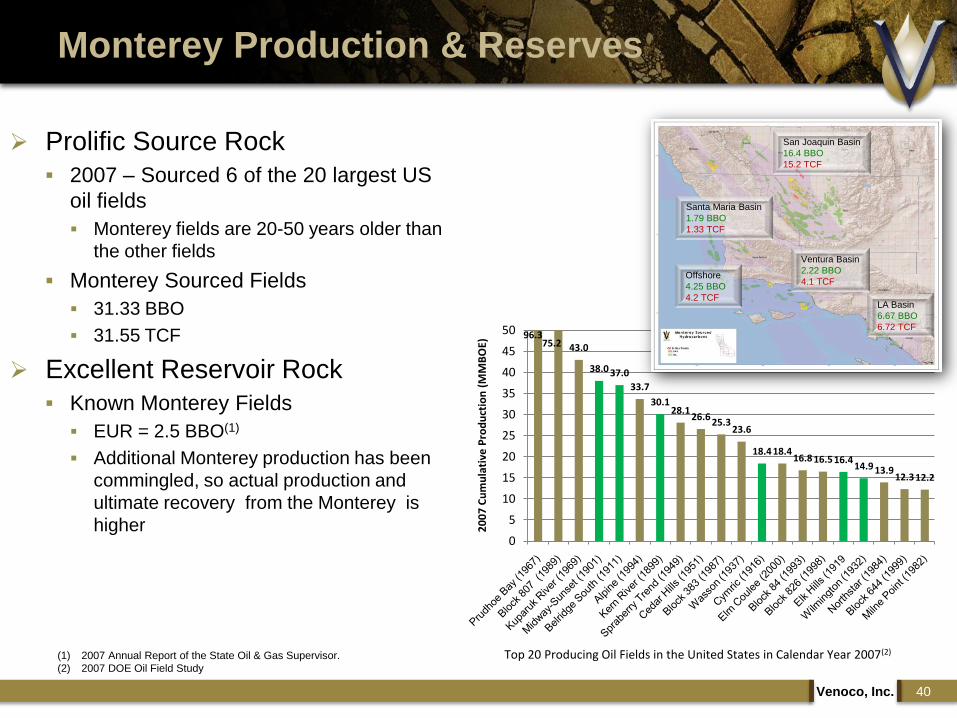
Prolific Source Rock
2007 – Sourced 6 of the 20 largest US
oil fields
Monterey fields are 20-50 years older than
the other fields
Monterey Sourced Fields
31.33 BBO
31.55 TCF
Excellent Reservoir Rock
Known Monterey Fields
EUR = 2.5 BBO(1)
Additional Monterey production has been
commingled, so actual production and
ultimate recovery from the Monterey is
higher
Venoco, Inc. 40
Monterey Production & Reserves
43.0
38.0 37.0
33.7
30.128.1
26.625.3
23.6
18.418.416.8 16.5 16.4
14.9 13.912.3 12.2
0
5
10
15
20
25
30
35
40
45
50
20
07
Cu
mu
lati
ve P
rod
uct
ion
(M
MB
OE)
96.375.2
Ventura Basin
2.22 BBO
4.1 TCF
LA Basin
6.67 BBO
6.72 TCF
Santa Maria Basin
1.79 BBO
1.33 TCF
San Joaquin Basin
16.4 BBO
15.2 TCF
Offshore
4.25 BBO
4.2 TCF
(1) 2007 Annual Report of the State Oil & Gas Supervisor.
(2) 2007 DOE Oil Field Study
Top 20 Producing Oil Fields in the United States in Calendar Year 2007(2)

South Belridge(2) = 540 MMBO
Hondo = 317 MMBO
Cat Canyon(2) = 335 MMBO
Point Arguello = 208 MMBO
Orcutt(2) = 175 MMBO
Pescado = 147 MMBO
Elk Hills = 86 MMBO
Point Pedernales = 77 MMBO
South Ellwood = 72 MMBO
North Belridge = 71 MMBO
Lost Hills = 71 MMBO
Sacate = 70 MMBO
Lompoc = 48 MMBO
Sockeye = 17 MMBO
Buena Vista = 36 MMBO
Zaca = 33 MMBO
Santa Clara Off(2) = 28 MMBO
Santa Maria = 23 MMBO
Oakridge = 17 MMBO
N. Shafter = 13 MMBO
Ojai = 10 MMBO
Barham Ranch = 6 MMBO
Rose = 6 MMBO
Careaga Canyon = 5 MMBO
Monument Jct = 5 MMBO
Railroad Gap = 1 MMBO
Santa Clara On = 1 MMBO
McKittrick = 1 MMBO
Sargent = 1 MMBO
Venoco, Inc. 41
Producing Monterey Fields(1)
(1) 2007 Annual Report of the State Oil & Gas Supervisor couple with Internal Analysis and estimates.
(2) Monterey production comingled with other reservoirs.
Total Monterey EUR ~ 2.5 Billion Barrels (12/31/2007)

Monterey Opportunity
Monterey Overview
Dominated by Legacy fields
Diverse reservoir styles
Structural – South Ellwood
Structural-Matrix – Elk Hills
Stratigraphic – North Shafter
Peak generation – 1 million
years to the present
Type Section
Venoco, Inc. 42
Additional turbidite
sand targets
Monterey section
(500 – 3,000‟ thick)Monterey outcrop and oil seep from
fractures

Monterey Shale – Deposition
Biogenic Shale
Concentrated in protected or distal environments
Deep Marine Sands
Deposited during unique Miocene environment
Siliceous Shales – Diatoms
Limestones – Foraminifera
Clay/Mud Shales – terrigenous detritus and/or non-deposition (phosphates)
Venoco, Inc. 43
Sand/Clay Rich
Diatom Rich
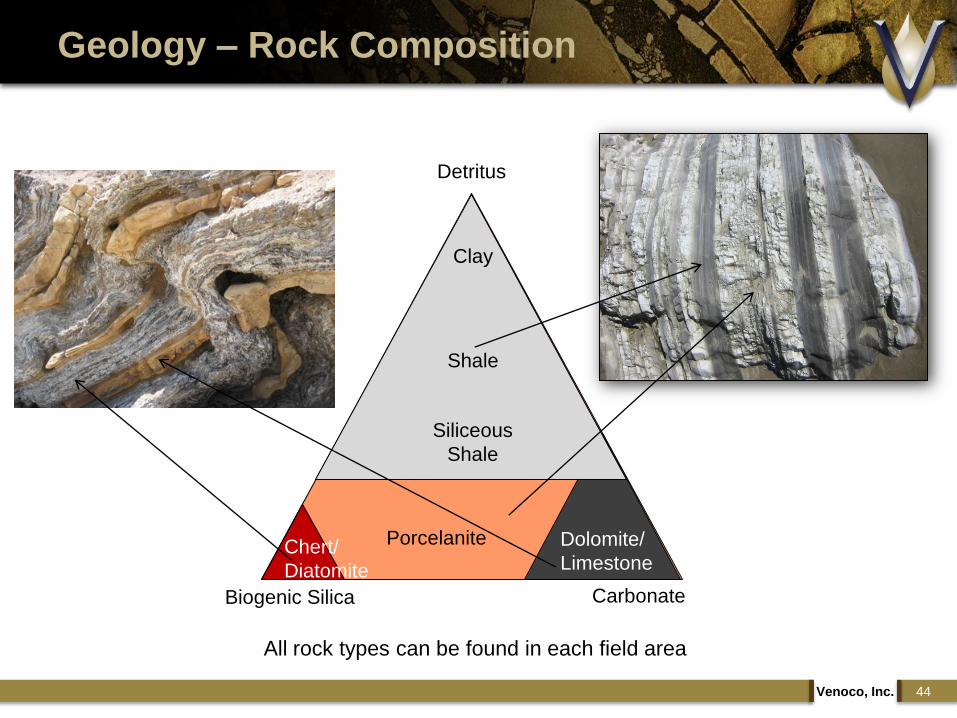
Geology – Rock Composition
Venoco, Inc. 44
Detritus
CarbonateBiogenic Silica
Dolomite/
Limestone
PorcelaniteChert/
Diatomite
Clay
Shale
Siliceous
Shale
All rock types can be found in each field area
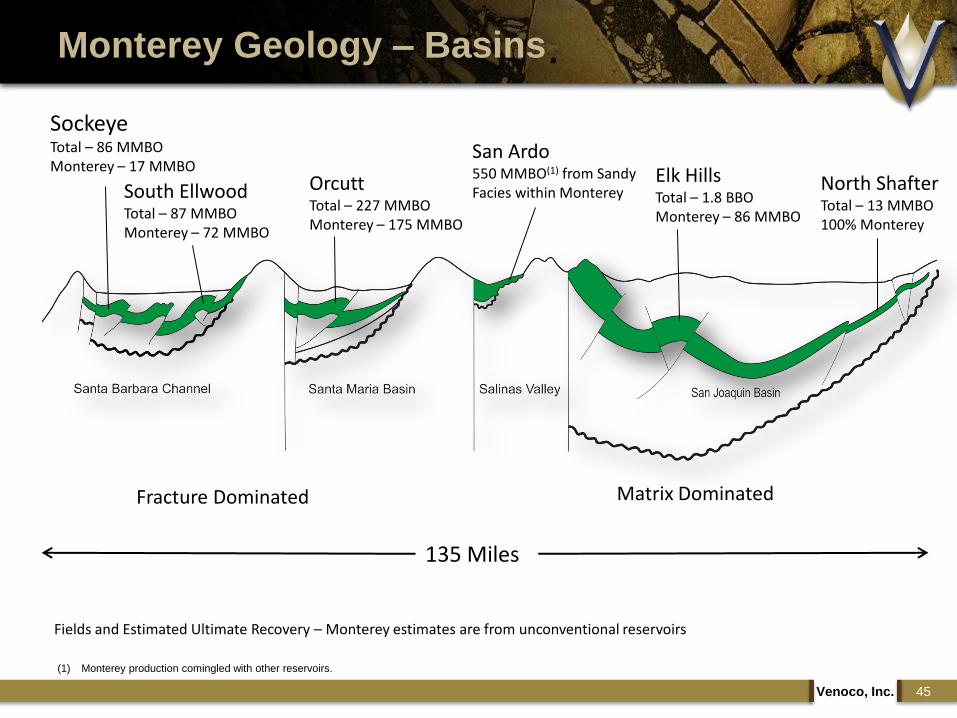
Monterey Geology – Basins
Venoco, Inc. 45
Elk HillsTotal – 1.8 BBOMonterey – 86 MMBO
San Ardo550 MMBO(1) from SandyFacies within MontereyOrcutt
Total – 227 MMBOMonterey – 175 MMBO
South EllwoodTotal – 87 MMBOMonterey – 72 MMBO
SockeyeTotal – 86 MMBOMonterey – 17 MMBO
North ShafterTotal – 13 MMBO100% Monterey
135 Miles
Matrix DominatedFracture Dominated
Fields and Estimated Ultimate Recovery – Monterey estimates are from unconventional reservoirs
(1) Monterey production comingled with other reservoirs.
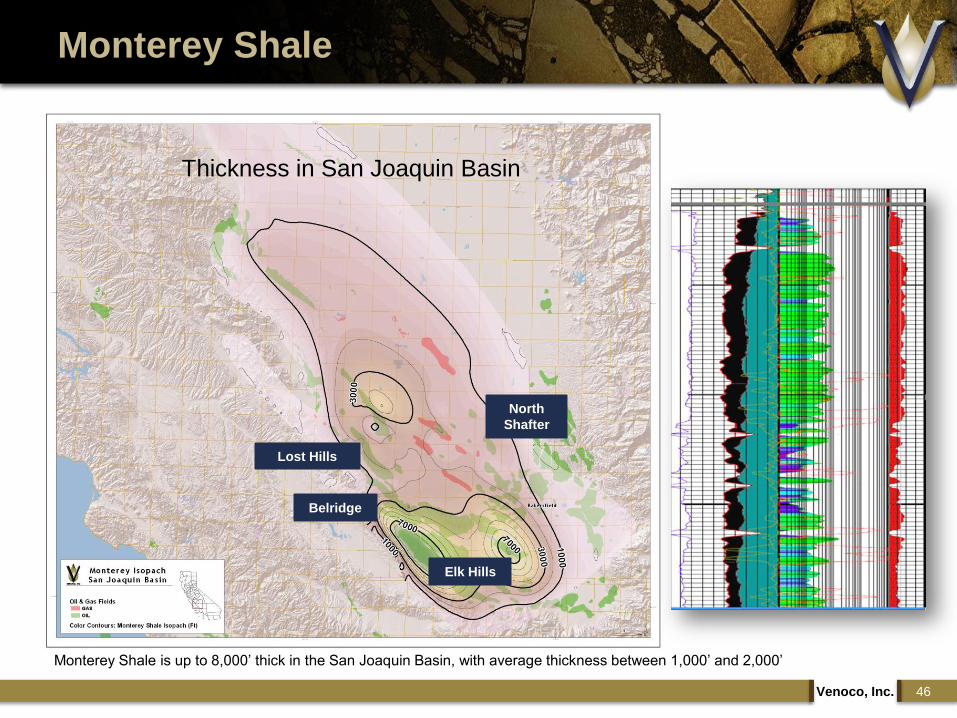
Monterey Shale
Venoco, Inc. 46
Monterey Shale is up to 8,000‟ thick in the San Joaquin Basin, with average thickness between 1,000‟ and 2,000‟
Thickness in San Joaquin Basin
Lost Hills
Belridge
Elk Hills
North
Shafter
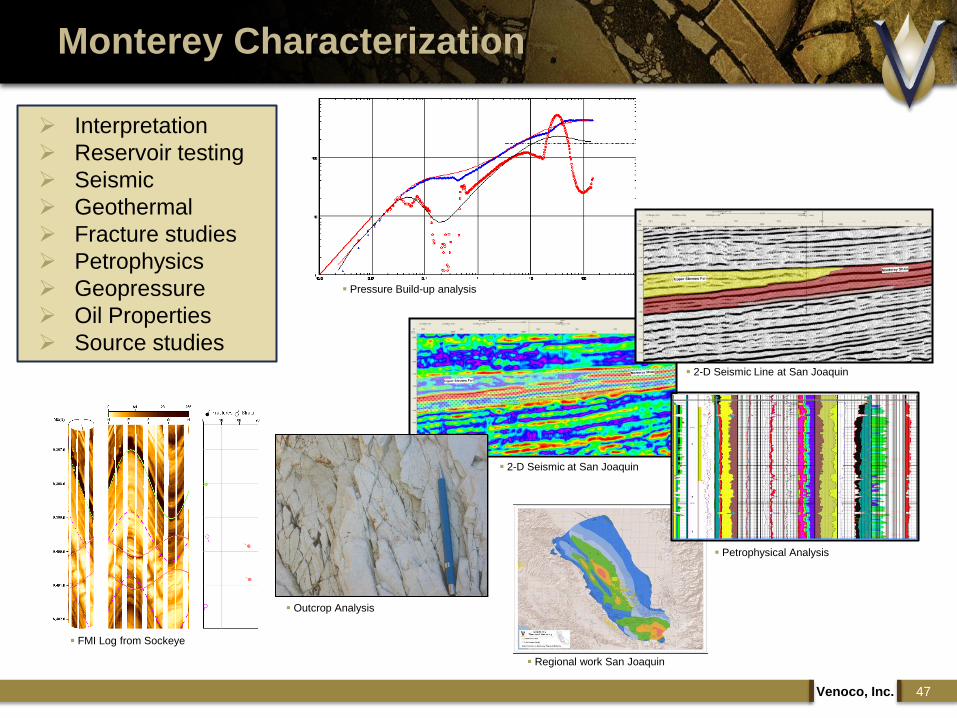
Monterey Characterization
Venoco, Inc. 47
Outcrop Analysis
FMI Log from Sockeye
Regional work San Joaquin
Petrophysical Analysis
2-D Seismic Line at San Joaquin
2-D Seismic at San Joaquin
Pressure Build-up analysis
Interpretation
Reservoir testing
Seismic
Geothermal
Fracture studies
Petrophysics
Geopressure
Oil Properties
Source studies

Characterizing Monterey Production
Mike Wracher
Vice President, Exploration

Fracture Dominated Monterey
Majority of Production from natural fractures
Micro (Elk Hills) or Macro (South Ellwood)
Matrix contribution to some extent
Matrix Dominated Monterey
Minimal natural fracture network
Stimulation required – historically, propped fracs
Some immature silica phase (SE Lost Hills, South Belridge)
Dual Porosity Monterey (Fracture & Matrix)
Optimal Monterey Reservoir
Natural fractures = high initial rates & recoveries
Matrix system feeds fracture network
Highest recovery factors
Best of both Worlds!
Venoco, Inc. 49
Monterey Reservoir Types
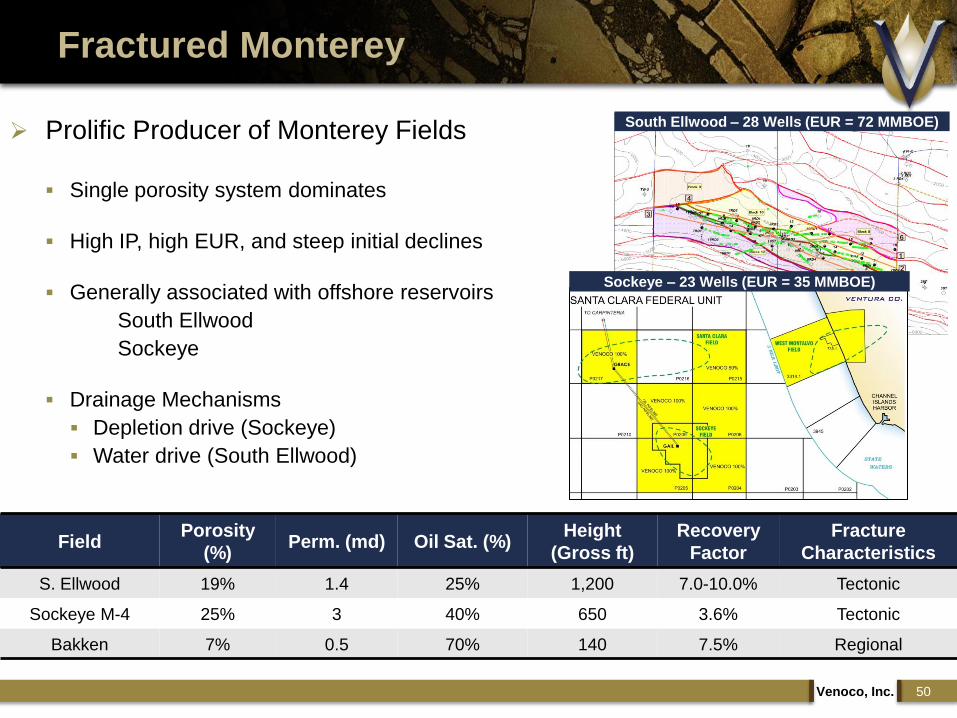
South Ellwood – 28 Wells (EUR = 72 MMBOE) Prolific Producer of Monterey Fields
Single porosity system dominates
High IP, high EUR, and steep initial declines
Generally associated with offshore reservoirs
South Ellwood
Sockeye
Drainage Mechanisms
Depletion drive (Sockeye)
Water drive (South Ellwood)
Venoco, Inc. 50
Fractured Monterey
Sockeye – 23 Wells (EUR = 35 MMBOE)
FieldPorosity
(%)Perm. (md) Oil Sat. (%)
Height
(Gross ft)
Recovery
Factor
Fracture
Characteristics
S. Ellwood 19% 1.4 25% 1,200 7.0-10.0% Tectonic
Sockeye M-4 25% 3 40% 650 3.6% Tectonic
Bakken 7% 0.5 70% 140 7.5% Regional

Venoco, Inc. 51
Fractured Monterey – South Ellwood
28 productive wellbores
Exponential decline
Large contribution from natural
fractures
Aquifer support
Average South Ellwood well
IP = 410 BOPD
EUR = 2.3 MMBO
Field-wide EUR = 72 MMBO
Cum production = 56 MMBOE
Trend Analysis
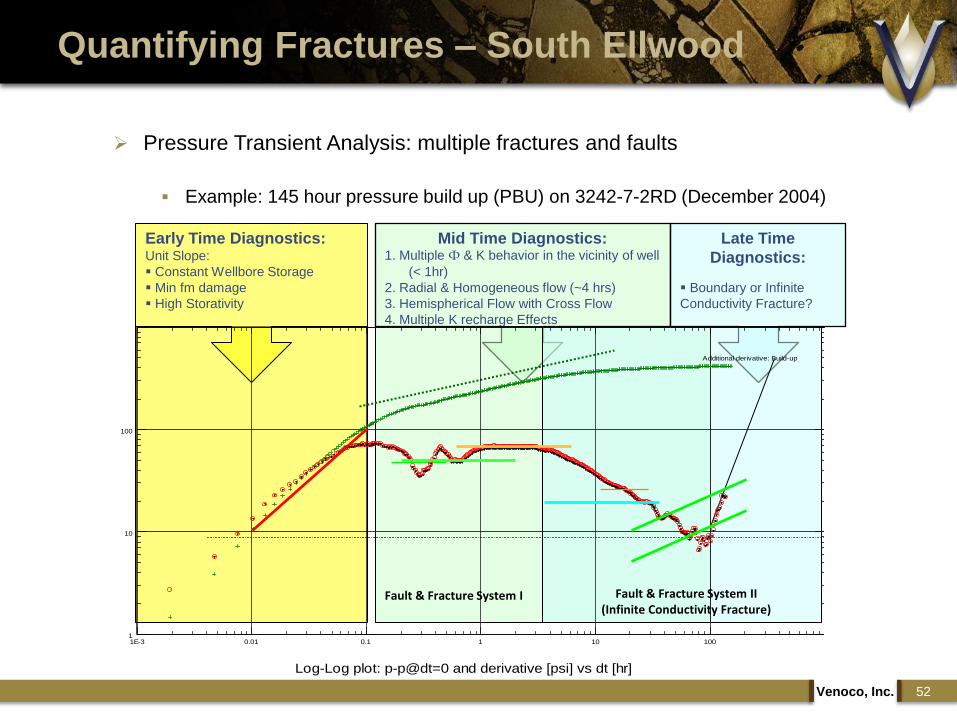
Pressure Transient Analysis: multiple fractures and faults
Example: 145 hour pressure build up (PBU) on 3242-7-2RD (December 2004)
Venoco, Inc. 52
Quantifying Fractures – South Ellwood
Mid Time Diagnostics:1. Multiple Ф & K behavior in the vicinity of well
(< 1hr)
2. Radial & Homogeneous flow (~4 hrs)
3. Hemispherical Flow with Cross Flow
4. Multiple K recharge Effects
Late Time
Diagnostics:
Boundary or Infinite
Conductivity Fracture?
Early Time Diagnostics:Unit Slope:
Constant Wellbore Storage
Min fm damage
High Storativity
Fault & Fracture System I Fault & Fracture System II (Infinite Conductivity Fracture)
1E-3 0.01 0.1 1 10 1001
10
100
Additional derivative: Build-up
Log-Log plot: p-p@dt=0 and derivative [psi] vs dt [hr]

Extensive Core Data Set
Why Characterize? Mapping, prediction, simulation – Depletion Planning!
Reservoir Categorization – 3 dominant fracture sets in the Monterey
i. Fracture Type II – High Perm & Porosity – Primary Reservoir Contributor
ii. Fracture Type III – High Perm & Low Porosity.
iii. Fracture Type IV – Minimal
Venoco, Inc. 53
Quantifying Fractures – South Ellwood
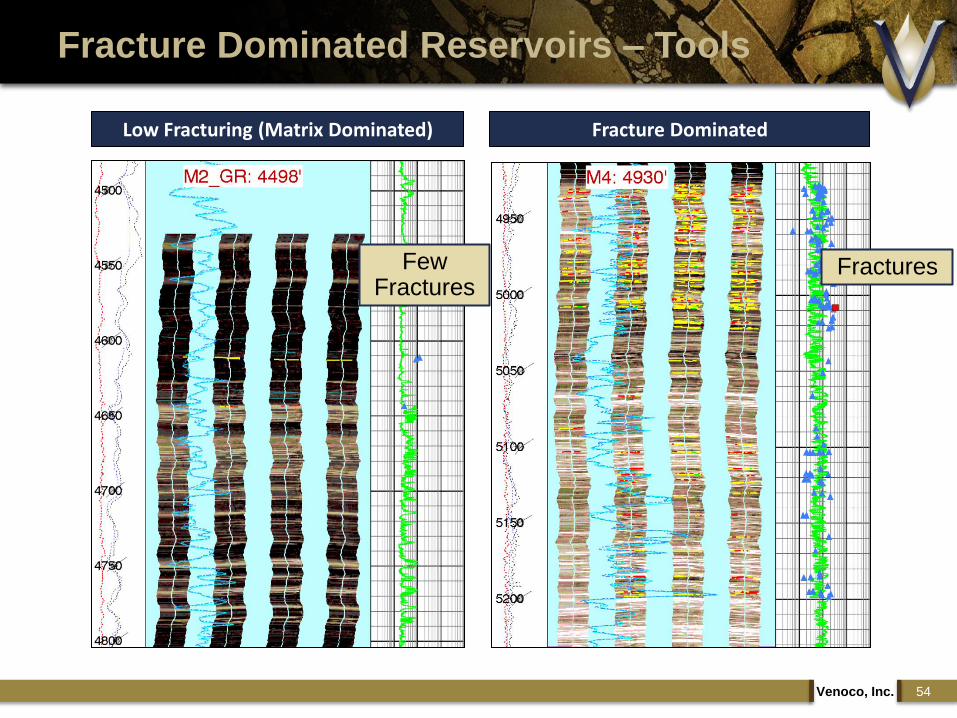
Fracture Dominated Reservoirs – Tools
Venoco, Inc. 54
Low Fracturing (Matrix Dominated) Fracture Dominated
Few Fractures
Fractures
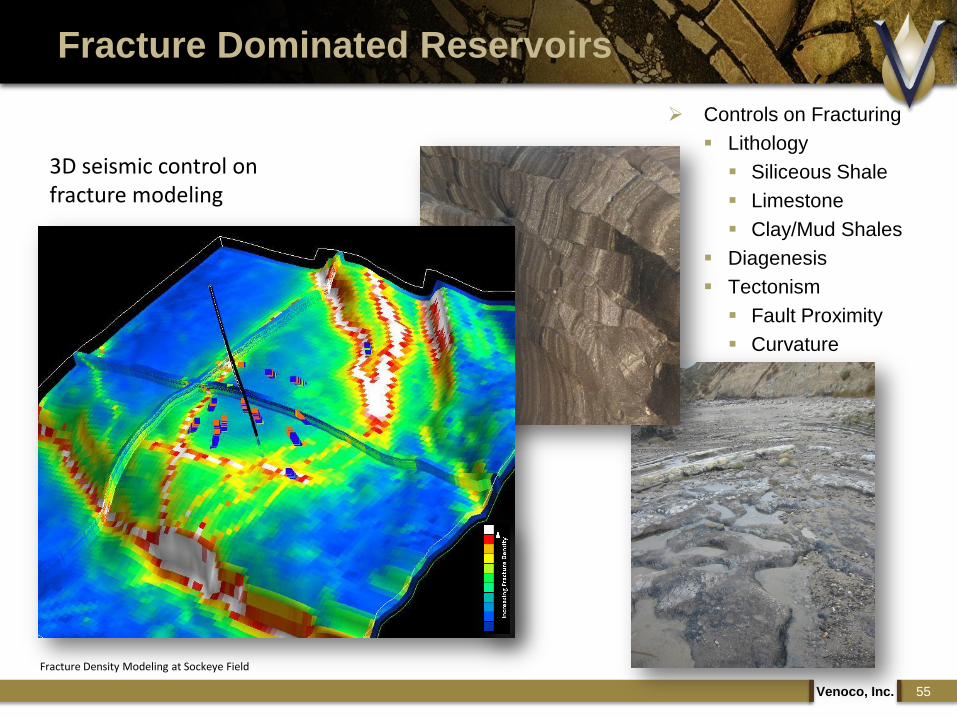
Fracture Dominated Reservoirs
Venoco, Inc. 55
Controls on Fracturing
Lithology
Siliceous Shale
Limestone
Clay/Mud Shales
Diagenesis
Tectonism
Fault Proximity
Curvature
Fracture Density Modeling at Sockeye Field
3D seismic control on fracture modeling
Venoco, Inc. 56
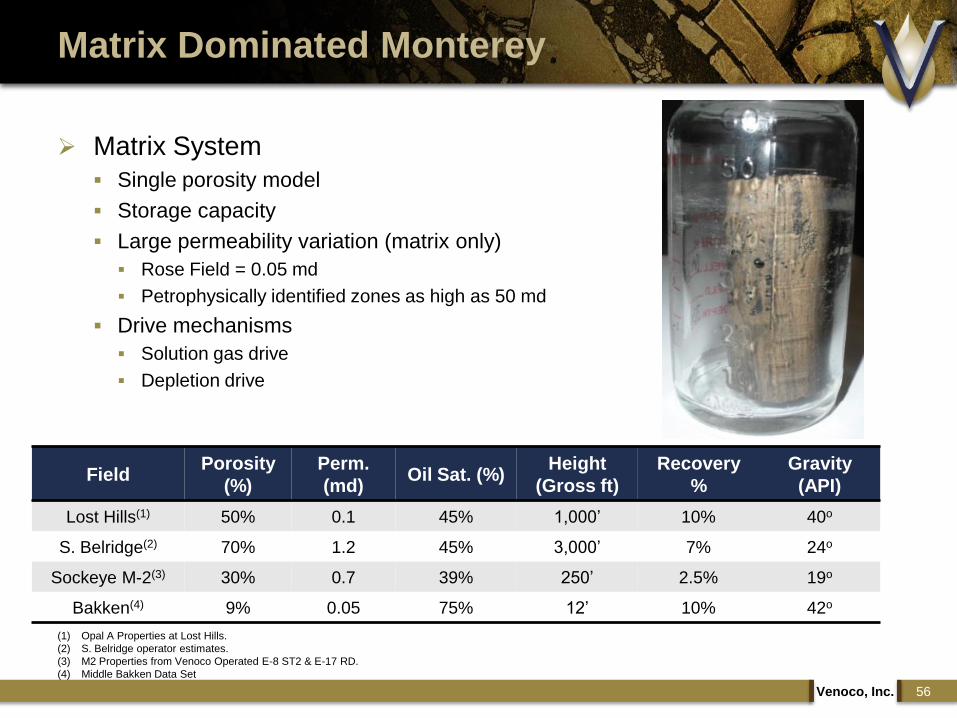
Matrix Dominated Monterey
(1) Opal A Properties at Lost Hills.
(2) S. Belridge operator estimates.
(3) M2 Properties from Venoco Operated E-8 ST2 & E-17 RD.
(4) Middle Bakken Data Set
FieldPorosity
(%)
Perm.
(md)Oil Sat. (%)
Height
(Gross ft)
Recovery
%
Gravity
(API)
Lost Hills(1) 50% 0.1 45% 1,000‟ 10% 40o
S. Belridge(2) 70% 1.2 45% 3,000‟ 7% 24o
Sockeye M-2(3) 30% 0.7 39% 250‟ 2.5% 19o
Bakken(4) 9% 0.05 75% 12‟ 10% 42o
Matrix System
Single porosity model
Storage capacity
Large permeability variation (matrix only)
Rose Field = 0.05 md
Petrophysically identified zones as high as 50 md
Drive mechanisms
Solution gas drive
Depletion drive
Venoco, Inc. 57
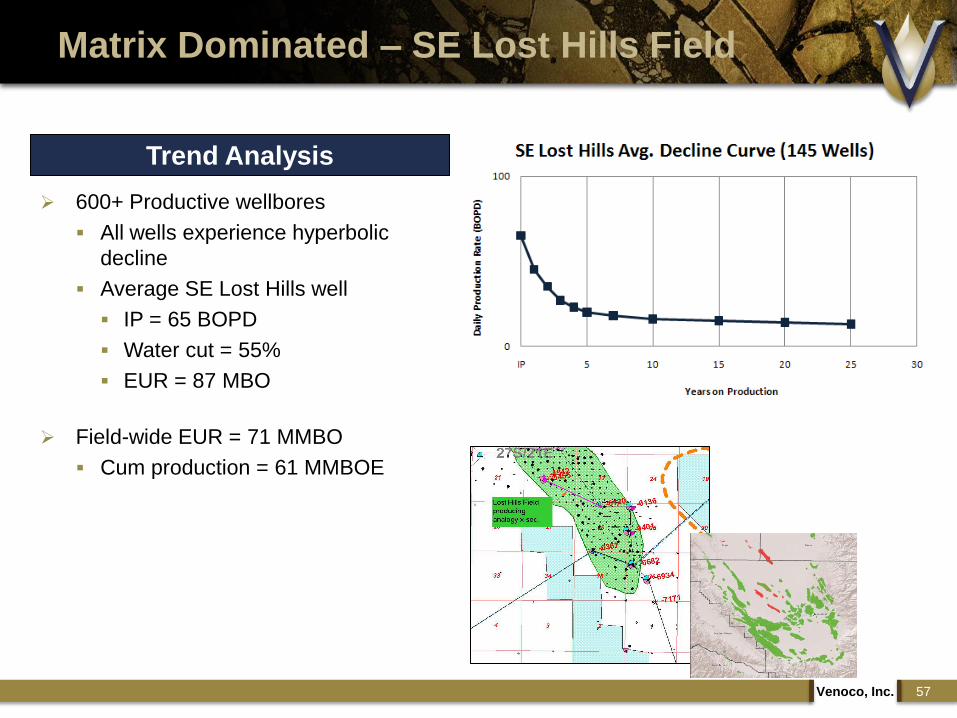
Matrix Dominated – SE Lost Hills Field
600+ Productive wellbores
All wells experience hyperbolic
decline
Average SE Lost Hills well
IP = 65 BOPD
Water cut = 55%
EUR = 87 MBO
Field-wide EUR = 71 MMBO
Cum production = 61 MMBOE
Trend Analysis

Matrix Reservoir Properties
Venoco, Inc. 58
New Scoping Tools

Optimal Reservoir for an Oil Shale
Sugar cube model (dual porosity)
Fractures tap into matrix to drain system
Most common system
Drivers
Phase changes – Rock type
Overprinted by fault & fold set
Combined Monterey Depletion Mechanisms
Solution-gas drive (North Shafter & Rose Fields)(1)
Gravity drainage (Elk Hills – 31S anticline)(2)
Water & gas drive (Elk Hills anticlines)(2)
Combination drive
Solution + gravity (Elk Hills)(2)
Venoco, Inc. 59
Dual Porosity Monterey – Fracture & Matrix
(1) SPE 83501 – Ganong, Hansen, & Connolly.
(2) AAPG Bulletin v. 85, No. 1 - Reid & McIntyre (2001)
(3) Pressure Transient Analysis – Lee (2009)
Dual Porosity Model and Idealized log-log
PTA Graph for various compressibilities(3)

Venoco, Inc. 60
Combination Monterey – Fracture & Matrix
Field Porosity %Perm.
(md)Oil Sat. %
Height (Gross
ft)
Recovery
%Gravity
Fracture
Characteristics
Elk Hills 23% 0.8 55% 500 12.0 35o Tectonic
Shafter 28% 1.2 40% 40 1.4 26o Diagenetic +
Tectonic
Rose 16% 0.05 45% 40 0.8 24o Diagenetic +
Tectonic
Niobrara(1)
14% 1.0 40% 250 22.0 36o Tectonic
(1) SPE 13886 – Hollberg, Dahm, & Bath
Elk Hills – 86 MMBO (88 Wells)
Shafter – 14 MMBO (45 Wells)
Rose – 6.5 MMBO (28 Wells)
Matrix Properties
Conventional measurement (core, petrophysics)
Direct relationship – Higher values = higher recovery
Fracture Properties
Log analysis (FMI, XRMI)
Outcrop studies
Rock mechanical work

Venoco, Inc. 61
Combination Monterey – Elk Hills Field
80 productive wellbores
Exponential decline
Good matrix and fracture network
Steeper decline than South Ellwood
lower aquifer and gravity drainage
support
Average Elk Hills well
IP = 250 BOPD
Water cut = 65%
EUR = 750 MBO
Field Wide EUR = 86 MMBO
Cum production = 78 MMBOE
Trend Analysis
Venoco, Inc. 62
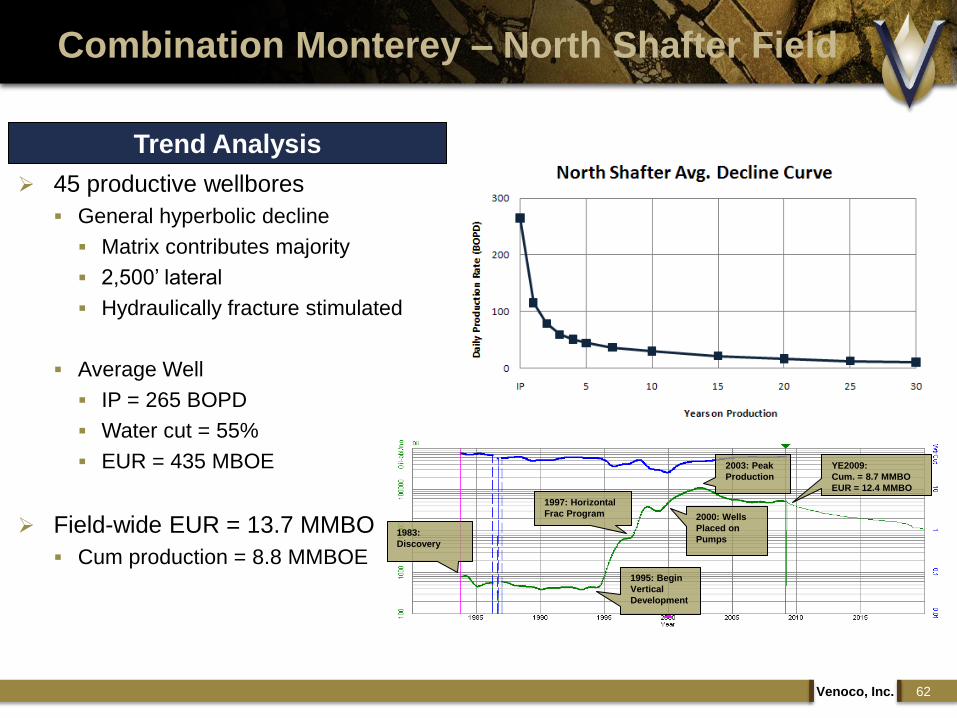
Combination Monterey – North Shafter Field
45 productive wellbores
General hyperbolic decline
Matrix contributes majority
2,500‟ lateral
Hydraulically fracture stimulated
Average Well
IP = 265 BOPD
Water cut = 55%
EUR = 435 MBOE
Field-wide EUR = 13.7 MMBO
Cum production = 8.8 MMBOE1995: Begin
Vertical
Development
1983:
Discovery
1997: Horizontal
Frac Program
2003: Peak
Production
YE2009:
Cum. = 8.7 MMBO
EUR = 12.4 MMBO
2000: Wells
Placed on
Pumps
Trend Analysis
Venoco, Inc. 63
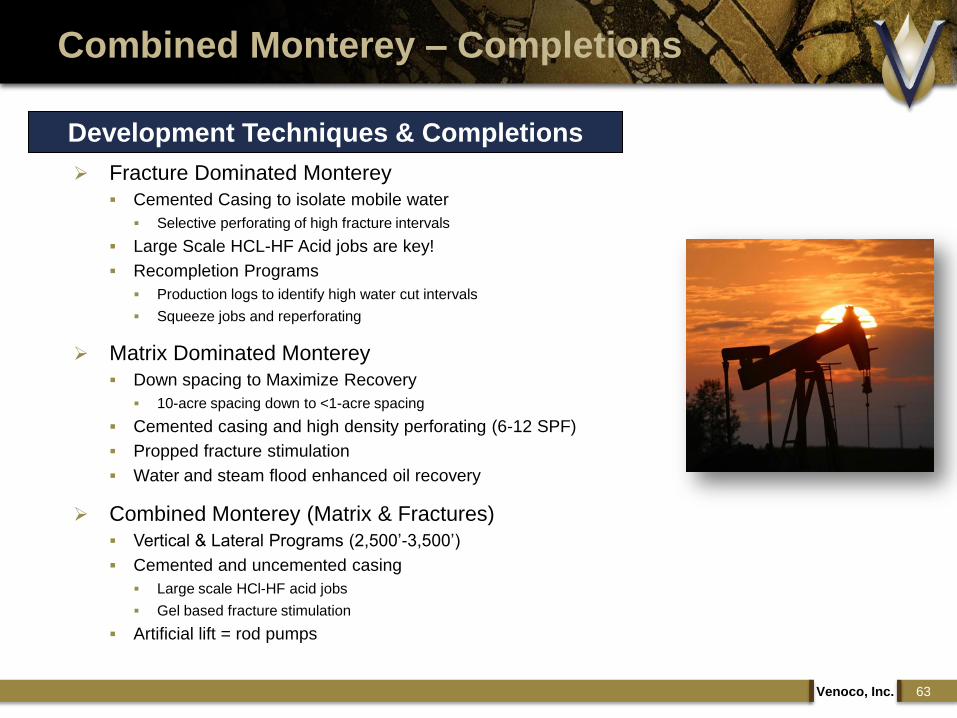
Combined Monterey – Completions
Development Techniques & Completions
Fracture Dominated Monterey
Cemented Casing to isolate mobile water
Selective perforating of high fracture intervals
Large Scale HCL-HF Acid jobs are key!
Recompletion Programs
Production logs to identify high water cut intervals
Squeeze jobs and reperforating
Matrix Dominated Monterey
Down spacing to Maximize Recovery
10-acre spacing down to <1-acre spacing
Cemented casing and high density perforating (6-12 SPF)
Propped fracture stimulation
Water and steam flood enhanced oil recovery
Combined Monterey (Matrix & Fractures)
Vertical & Lateral Programs (2,500‟-3,500‟)
Cemented and uncemented casing
Large scale HCl-HF acid jobs
Gel based fracture stimulation
Artificial lift = rod pumps
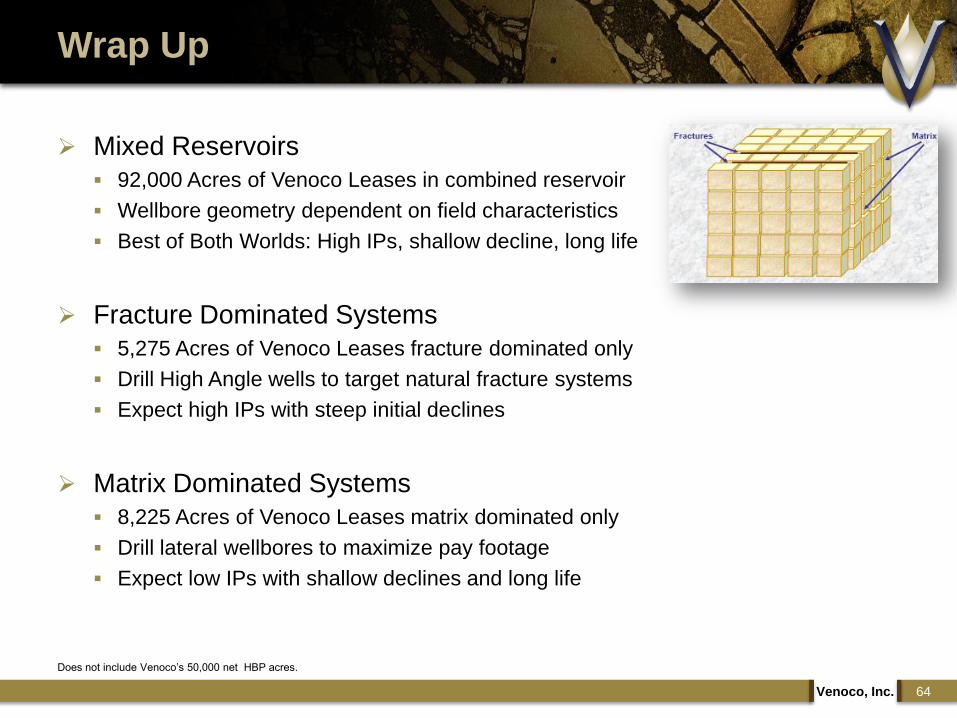
Mixed Reservoirs
92,000 Acres of Venoco Leases in combined reservoir
Wellbore geometry dependent on field characteristics
Best of Both Worlds: High IPs, shallow decline, long life
Fracture Dominated Systems
5,275 Acres of Venoco Leases fracture dominated only
Drill High Angle wells to target natural fracture systems
Expect high IPs with steep initial declines
Matrix Dominated Systems
8,225 Acres of Venoco Leases matrix dominated only
Drill lateral wellbores to maximize pay footage
Expect low IPs with shallow declines and long life
Venoco, Inc. 64
Wrap Up
Does not include Venoco‟s 50,000 net HBP acres.

Operations and Development
www.venocoinc.com
Ed O‟Donnell
Sr. Vice President, Southern California

Turning Opportunity into Value
Venoco, Inc. 66
Venoco
155,000 net acres in multiple
basins
350,000 total net acre target
20+ Billion bbls OOIP
30 evaluation areas being
worked
Large database
Well depths 6,000‟-14,000‟
Formation thickness 500‟-6,000‟
Multiple reservoir targets
Light, sweet oil
Experienced team
Favorable oper. environment
Nearby infrastructure & market
Acquire prime acreage Be early, be quick, be cost effective
Screen for light oil, structural components, natural fractures, moderate depths, and well data
Understand the rock and prioritize areas of interest
Evaluate priority areas Drill vertical pilot wells
Acquire data
Conventional coring
Petrophysics
Production
Test zones of interest and validate analytical techniques
Stimulate wells with targeted applications
Correlate and integrate various data
Characterize reservoir & development potential
Transition to exploitation team
Venoco, Inc. 67
The Value Creation Process
Acquisition and Evaluation
Expand talented, multi-disciplinary team
Continue to increase acreage position in hand-off areas
Acquire 3D seismic
Define development plan
Acquire permits and build well locations
Drill a variety of high-angle and horizontal wells
Optimize well type, completions & stimulation techniques
Design and construct facilities
Develop “conveyor belt” process to reduce costs and increase NPV
Venoco, Inc. 68
The Value Creation Process
Exploitation and Development
2010 – Year of Science Transition three project areas to exploitation
Initiate 10-12 well drilling program
Acquire additional acreage
Shoot 3D seismic
Permit future well locations
Design generic production facility
Expand organization
2011 – Year of Optimization Transfer additional areas to exploitation
Ramp up to 3-4 drilling rigs
Drill 30-40 delineation and development wells
Reach 350,000 total net acre leasehold goal
Optimize completion and stimulation techniques
Venoco, Inc. 69
The Value Creation Process
Near-Term Plans
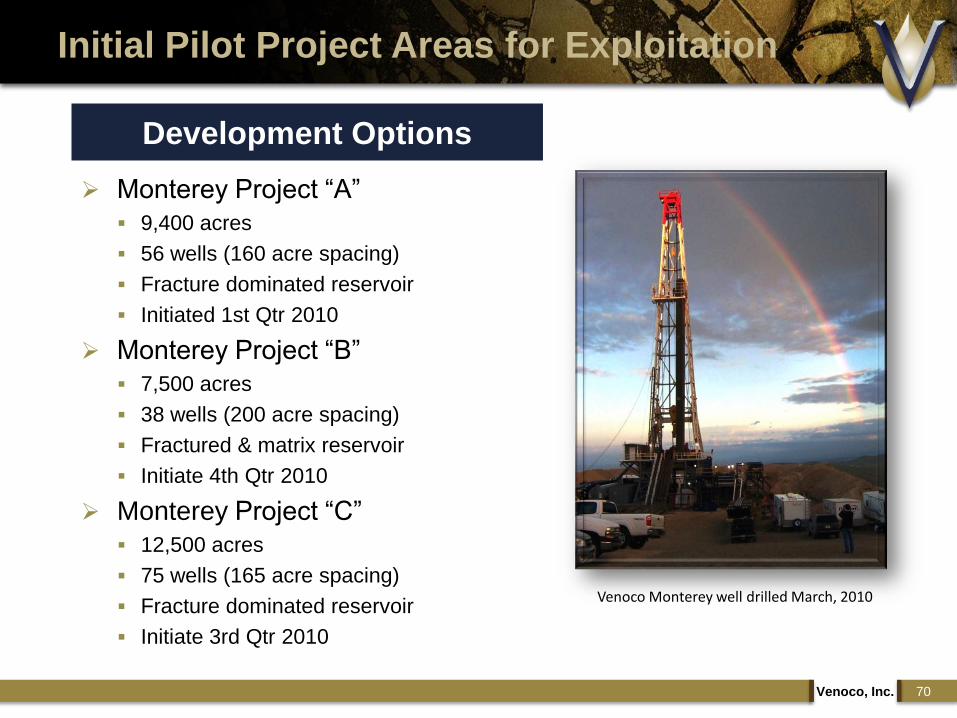
Initial Pilot Project Areas for Exploitation
Venoco, Inc. 70
Venoco Monterey well drilled March, 2010
Development Options
Monterey Project “A”
9,400 acres
56 wells (160 acre spacing)
Fracture dominated reservoir
Initiated 1st Qtr 2010
Monterey Project “B”
7,500 acres
38 wells (200 acre spacing)
Fractured & matrix reservoir
Initiate 4th Qtr 2010
Monterey Project “C”
12,500 acres
75 wells (165 acre spacing)
Fracture dominated reservoir
Initiate 3rd Qtr 2010
Vertical Well History
5 wells drilled in the 1980‟s – initial rates averaged 70 BOPD
Assortment of stimulation techniques
Venoco drilled well in 2008 – initial rate of 250 BOPD
High gravity oil – 31 to 38 degree API
Old wells were uneconomic at 1980‟s oil prices
Horizontal Well Projections
Initial rates of 350 BOPD
Reserves of 525,000 barrels per well(1)
Application of Modern Technology
Proprietary petrophysical analysis
Modern completion & stimulation techniques
Development Plan
Pilot program of 5 delineation wells
51 development wells
Venoco, Inc. 71
Monterey Project “A” – Overview
(1) Internal estimate of unrisked reserve potential. See “Net Asset Value & Unrisked Resource Estimates.”

Project “A” – Early Test Results
72Venoco, Inc.
Venoco Vertical Well
250 BOPD, 31.4°
Flowed 83 BOPD, 340
Gas lifted 115-139 BOPD Pumped 44 BOPD, 38°
Pumped 79 BOPD, 36.40
½ billion barrel oil field
Area of
Development

Project “A” – Type Curve
Vertical vs. Horizontal Type Wells(1)
Vertical Summary• Capital Cost = $2.0 MM
Water Hauling = $6.00 / BW ($18.00 / BO)
LOE = $5.50 / BO
• EUR = 150 MBO
IP = 150 BOPD
• NPV10 = $1.5 MM
Flat Pricing: $80/BO & $5/MCF
• P/I = +0.72
Venoco, Inc. 73
Horizontal Summary• Capital Cost = $3.0 MM
Water Hauling = $6.00 / BW ($18.00 / BO)
LOE = $5.50 / BO
• EUR = 525 MBO
IP = 350 BOPD
• NPV10 = $8.7 MM
Flat Pricing: $80/BO & $5/MCF
• P/I = +3.45(1) Based on deterministic volumetrics, inferred drainage areas, and analogous production profiles. See “Net Asset Value & Unrisked Resource Estimates” and “Cautionary Statement
Regarding Forward Looking Information.” Excludes costs such as capitalized G&A, land acquisition, and interest expense. Type well assumes 100% WI and 80% NRI.

Venoco, Inc. 74
Project “A” – Unrisked Model(1)
Total Project "A" 5-Year Cash Flows ($M)
2010 2011 2012 2013 2014
Wells Drilled 0 2 6 12 24
Cumulative Wells 0 2 8 20 44
Gross Production (BO/day) 0 304 1,405 3,344 7,231
Net Production (BO/day) 0 243 1,124 2,675 5,785
Net Revenue 0 6,426 29,673 70,632 152,758
Lease Operating Expenses 0 (2,409) (11,121) (26,472) (57,253)
G&A Burden 0 (369) (1,704) (4,055) (8,771)
Severance / Ad Valorem 0 (264) (1,218) (2,900) (6,273)
Total Expenses 0 (3,041) (14,044) (33,428) (72,297)
Net Operating Cash Flow 0 3,385 15,629 37,204 80,461
Cash Based Taxes 0 0 0 0 0
Development CapEx(2) 0 (6,000) (18,000) (44,000) (72,000)
Free Cash Flow $0 ($2,615) ($2,371) ($6,796) $8,461
(1) All data shown is “unrisked,” meaning that it is not discounted to reflect the risk of production impediments, unsuccessful development activity, permitting issues, cost increases and other potential problems. Our
ability to achieve the results shown is subject to a wide variety of risks, as discussed in “Cautionary Statement Regarding Forward-Looking Information” and the “Risk Factors” section of our 2009 annual report
on Form 10-K. See also “Net Asset Value & Unrisked Resource Estimates” and “Cautionary Statement Regarding Forward Looking Information.” Type well assumes 100% WI and 80% NRI.
(2) Capital expenditures exclude costs such as capitalized G&A and land acquisition.
0
2,000
4,000
6,000
8,000
Avg
. Pro
du
ctio
n (
BO
PD
)
Project "A" Daily Production Averages
Economic Assumptions
Development Wells:
CapEx = $3.0 MM
IP = 350 BOPD
EUR = 525 MBO
Water Cut = 75%
GOR = 500 CF/BO
Lease Operating Expenses:
Well Operations = $5.50/BO
Water Hauling = $6.00/BW ($18.00/BO)
Differential = -$4.00/BO
Flat Pricing Deck
Oil = $80/BO
Gas = $5.00/MCF
100% WI; 80% NRI
Economic Output
NPV = $307 MM
Pay Out = 4.49 years
ROR = 100+%
Gross EUR = 29.4 MMBOE
P/I = +2.54
Drilling History
Three vertical wells drilled since 2000 – data pilot holes
Two horizontal wells – initial rates of 95-125 BOPD
High gravity oil – 27 degree API
Less than optimal completion techniques
Horizontal Well Projections
Initial Rates of 500 BOPD
Reserves of 750,000 barrels per well(1)
Application of Modern Technology
Opportunities to apply modern completion techniques to existing wells
Development Plan
38 development wells
Venoco, Inc. 75
Monterey Project “B” – Overview
(1) Internal estimate of unrisked reserve potential. See “Net Asset Value & Unrisked Resource Estimates.”

125 BOPD
95 BOPD
Project “B” - Early Test Results
Venoco, Inc. 76
Area of
Development
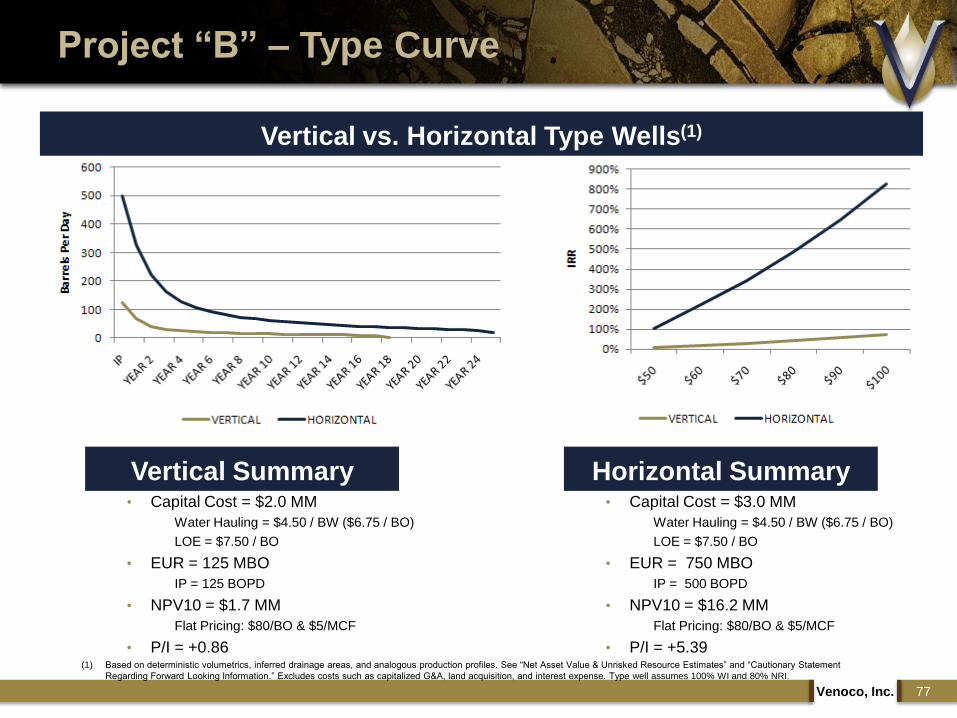
Project “B” – Type Curve
Venoco, Inc. 77
Vertical vs. Horizontal Type Wells(1)
Vertical Summary• Capital Cost = $2.0 MM
Water Hauling = $4.50 / BW ($6.75 / BO)
LOE = $7.50 / BO
• EUR = 125 MBO
IP = 125 BOPD
• NPV10 = $1.7 MM
Flat Pricing: $80/BO & $5/MCF
• P/I = +0.86
Horizontal Summary• Capital Cost = $3.0 MM
Water Hauling = $4.50 / BW ($6.75 / BO)
LOE = $7.50 / BO
• EUR = 750 MBO
IP = 500 BOPD
• NPV10 = $16.2 MM
Flat Pricing: $80/BO & $5/MCF
• P/I = +5.39(1) Based on deterministic volumetrics, inferred drainage areas, and analogous production profiles. See “Net Asset Value & Unrisked Resource Estimates” and “Cautionary Statement
Regarding Forward Looking Information.” Excludes costs such as capitalized G&A, land acquisition, and interest expense. Type well assumes 100% WI and 80% NRI.
Venoco, Inc. 78
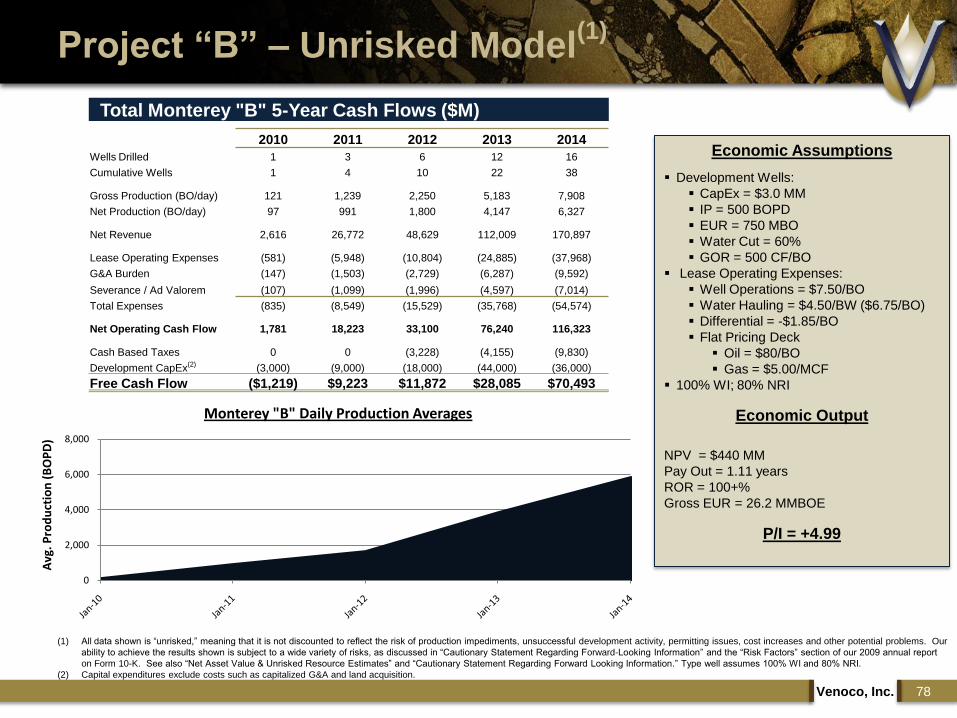
Project “B” – Unrisked Model(1)
Total Monterey "B" 5-Year Cash Flows ($M)
2010 2011 2012 2013 2014
Wells Drilled 1 3 6 12 16
Cumulative Wells 1 4 10 22 38
Gross Production (BO/day) 121 1,239 2,250 5,183 7,908
Net Production (BO/day) 97 991 1,800 4,147 6,327
Net Revenue 2,616 26,772 48,629 112,009 170,897
Lease Operating Expenses (581) (5,948) (10,804) (24,885) (37,968)
G&A Burden (147) (1,503) (2,729) (6,287) (9,592)
Severance / Ad Valorem (107) (1,099) (1,996) (4,597) (7,014)
Total Expenses (835) (8,549) (15,529) (35,768) (54,574)
Net Operating Cash Flow 1,781 18,223 33,100 76,240 116,323
Cash Based Taxes 0 0 (3,228) (4,155) (9,830)
Development CapEx(2) (3,000) (9,000) (18,000) (44,000) (36,000)
Free Cash Flow ($1,219) $9,223 $11,872 $28,085 $70,493
(1) All data shown is “unrisked,” meaning that it is not discounted to reflect the risk of production impediments, unsuccessful development activity, permitting issues, cost increases and other potential problems. Our
ability to achieve the results shown is subject to a wide variety of risks, as discussed in “Cautionary Statement Regarding Forward-Looking Information” and the “Risk Factors” section of our 2009 annual report
on Form 10-K. See also “Net Asset Value & Unrisked Resource Estimates” and “Cautionary Statement Regarding Forward Looking Information.” Type well assumes 100% WI and 80% NRI.
(2) Capital expenditures exclude costs such as capitalized G&A and land acquisition.
0
2,000
4,000
6,000
8,000
Avg
. Pro
du
ctio
n (
BO
PD
)
Monterey "B" Daily Production Averages
Economic Assumptions
Development Wells:
CapEx = $3.0 MM
IP = 500 BOPD
EUR = 750 MBO
Water Cut = 60%
GOR = 500 CF/BO
Lease Operating Expenses:
Well Operations = $7.50/BO
Water Hauling = $4.50/BW ($6.75/BO)
Differential = -$1.85/BO
Flat Pricing Deck
Oil = $80/BO
Gas = $5.00/MCF
100% WI; 80% NRI
Economic Output
NPV = $440 MM
Pay Out = 1.11 years
ROR = 100+%
Gross EUR = 26.2 MMBOE
P/I = +4.99
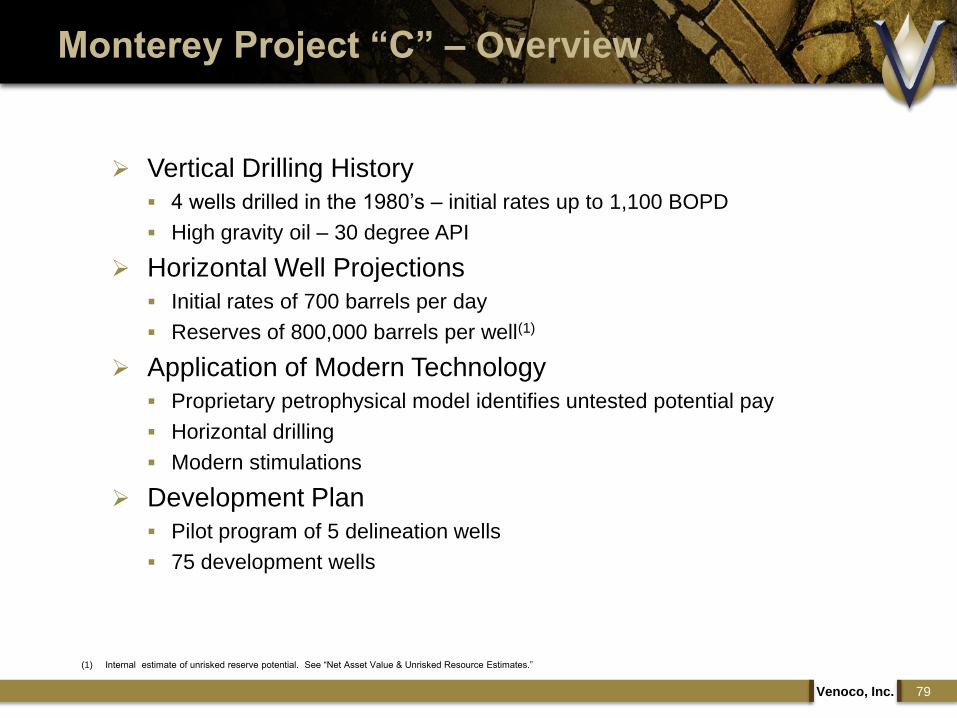
Vertical Drilling History
4 wells drilled in the 1980‟s – initial rates up to 1,100 BOPD
High gravity oil – 30 degree API
Horizontal Well Projections
Initial rates of 700 barrels per day
Reserves of 800,000 barrels per well(1)
Application of Modern Technology
Proprietary petrophysical model identifies untested potential pay
Horizontal drilling
Modern stimulations
Development Plan
Pilot program of 5 delineation wells
75 development wells
Venoco, Inc. 79
Monterey Project “C” – Overview
(1) Internal estimate of unrisked reserve potential. See “Net Asset Value & Unrisked Resource Estimates.”

Venoco, Inc. 80
Project “C”– Early Test Results
59 BOPD, 45% cut
1,118 BOPD, 20% cut
409 BOPD, 55% cut
458 BOPD, 76% cut
Area of
Development

Project “C” – Type Curve
Vertical vs. Horizontal Type Wells(1)
Vertical Summary
Venoco, Inc. 81
Horizontal Summary Capital Cost = $2.0 MM
Water Hauling = $3.00 / BW ($6.00 / BO)
LOE = $6.35 / BO
EUR = 100 MBO
IP = 100 BOPD
NPV10 = $1.2 MM
Flat Pricing: $80/BO & $5/MCF
P/I = +0.60
Capital Cost = $2.5 MM
Water Hauling = $3.00 / BW ($6.00 / BO)
LOE = $6.35 / BO
EUR = 800 MBO
IP = 700 BOPD
NPV10 = $21.9 MM
Flat Pricing: $80/BO & $5/MCF
P/I = +8.74
(1) Based on deterministic volumetrics, inferred drainage areas, and analogous production profiles. See “Net Asset Value & Unrisked Resource Estimates” and “Cautionary Statement
Regarding Forward Looking Information.” Excludes costs such as capitalized G&A, land acquisition, and interest expense. Type well assumes 100% WI and 80% NRI.
Venoco, Inc. 82
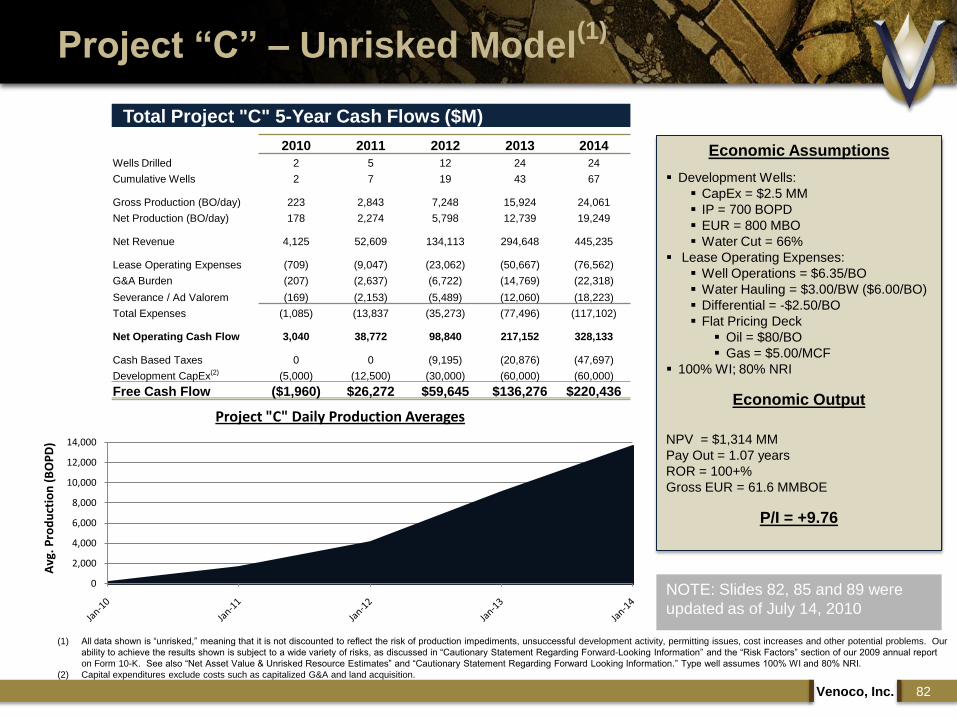
Project “C” – Unrisked Model(1)
Total Project "C" 5-Year Cash Flows ($M)
2010 2011 2012 2013 2014
Wells Drilled 2 5 12 24 24
Cumulative Wells 2 7 19 43 67
Gross Production (BO/day) 223 2,843 7,248 15,924 24,061
Net Production (BO/day) 178 2,274 5,798 12,739 19,249
Net Revenue 4,125 52,609 134,113 294,648 445,235
Lease Operating Expenses (709) (9,047) (23,062) (50,667) (76,562)
G&A Burden (207) (2,637) (6,722) (14,769) (22,318)
Severance / Ad Valorem (169) (2,153) (5,489) (12,060) (18,223)
Total Expenses (1,085) (13,837 (35,273) (77,496) (117,102)
Net Operating Cash Flow 3,040 38,772 98,840 217,152 328,133
Cash Based Taxes 0 0 (9,195) (20,876) (47,697)
Development CapEx(2) (5,000) (12,500) (30,000) (60,000) (60,000)
Free Cash Flow ($1,960) $26,272 $59,645 $136,276 $220,436
(1) All data shown is “unrisked,” meaning that it is not discounted to reflect the risk of production impediments, unsuccessful development activity, permitting issues, cost increases and other potential problems. Our
ability to achieve the results shown is subject to a wide variety of risks, as discussed in “Cautionary Statement Regarding Forward-Looking Information” and the “Risk Factors” section of our 2009 annual report
on Form 10-K. See also “Net Asset Value & Unrisked Resource Estimates” and “Cautionary Statement Regarding Forward Looking Information.” Type well assumes 100% WI and 80% NRI.
(2) Capital expenditures exclude costs such as capitalized G&A and land acquisition.
Economic Assumptions
Development Wells:
CapEx = $2.5 MM
IP = 700 BOPD
EUR = 800 MBO
Water Cut = 66%
Lease Operating Expenses:
Well Operations = $6.35/BO
Water Hauling = $3.00/BW ($6.00/BO)
Differential = -$2.50/BO
Flat Pricing Deck
Oil = $80/BO
Gas = $5.00/MCF
100% WI; 80% NRI
Economic Output
NPV = $1,314 MM
Pay Out = 1.07 years
ROR = 100+%
Gross EUR = 61.6 MMBOE
P/I = +9.76
0
2,000
4,000
6,000
8,000
10,000
12,000
14,000
Avg
. Pro
du
ctio
n (
BO
PD
)
Project "C" Daily Production Averages
NOTE: Slides 82, 85 and 89 were
updated as of July 14, 2010

Infrastructure and Markets
Venoco, Inc. 83
Extensive midstream
and downstream
network
Access to multiple
markets
Strong profit margins
New upstream facilities
Generic design
Modular, skid-mounted
Scalable
Los Angeles
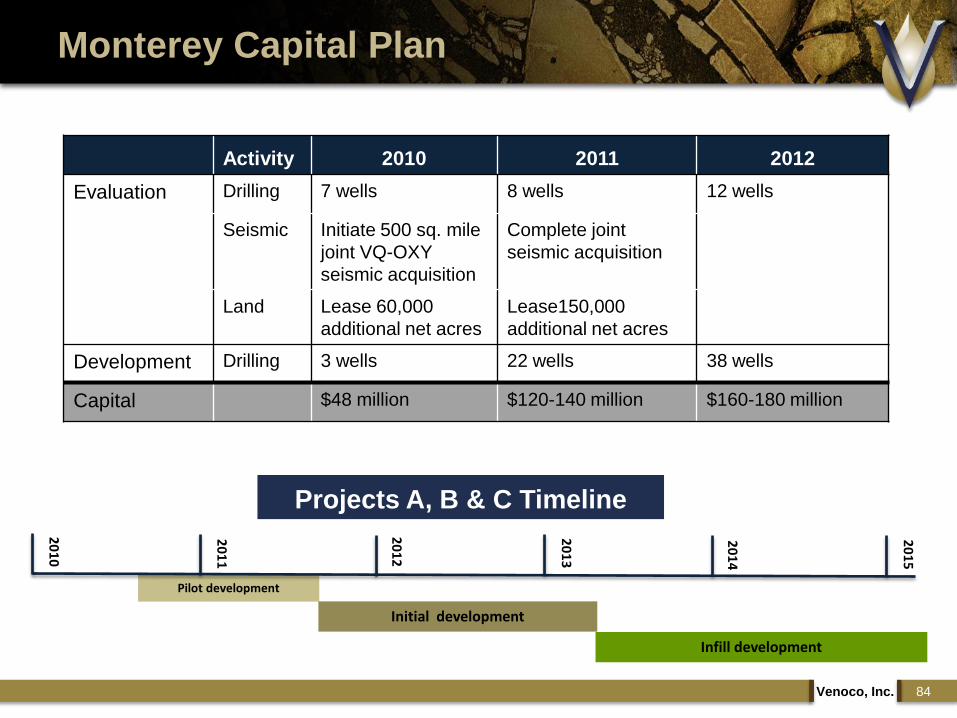
Monterey Capital Plan
Venoco, Inc. 84
Infill development
Pilot development
Initial development
20
10
20
11
20
12
20
13
20
14
20
15
Projects A, B & C Timeline
Activity 2010 2011 2012
Evaluation Drilling 7 wells 8 wells 12 wells
Seismic Initiate 500 sq. mile
joint VQ-OXY
seismic acquisition
Complete joint
seismic acquisition
Land Lease 60,000
additional net acres
Lease150,000
additional net acres
Development Drilling 3 wells 22 wells 38 wells
Capital $48 million $120-140 million $160-180 million

Project “A”, “B”, & “C” Unrisked Forecast(1)
Venoco, Inc. 85
Project "A", "B", & "C" 5 Year Unrisked Cash Flow ($M)
2010 2011 2012 2013 2014
Total Wells Drilled per Year 3 10 24 48 64
Cumulative wells 3 13 37 85 149
Total Gross Production (MBOE) 126 1,601 3,979 8,924 14,308
Total Net Production (MBOE) 100 1,281 3,184 7,139 11,447
Net Daily net production (BOE/d) 275 3,509 8,722 19,560 31,360
Net revenue 6,741 85,808 212,415 477,288 768,890
Lease operating expense (1,291) (17,403) (44,987) (102,024) (171,783)
G&A burden (354) (4,509) (11,156) (25,111) (40,680)
Severance / ad valorem taxes (276) (3,516) (8,703) (19,557) (31,510)
Total Expenses (1,920) (25,428) (64,846) (146,693) (243,973)
Net Operating Cash Flow 4,821 60,380 147,569 330,596 524,916
Cash taxes 0 0 (11,508) (24,521) (55,326)
Total Capital Expenditures(2) (8,000) (27,500) (66,000) (148,000) (168,000)
Free cash flow $(3,179) $32,880 $70,061 $158,074 $301,590
(1) All data shown is “unrisked,” meaning that it is not discounted to reflect the risk of production impediments, unsuccessful development activity, permitting issues, cost increases and other potential problems. Our
ability to achieve the results shown is subject to a wide variety of risks, as discussed in “Cautionary Statement Regarding Forward-Looking Information” and the “Risk Factors” section of our 2009 annual report
on Form 10-K. See also “Net Asset Value & Unrisked Resource Estimates” and “Cautionary Statement Regarding Forward Looking Information.” Type wells assume 100% WI and 80% NRI.
(2) Capital expenditures exclude costs such as capitalized G&A and land acquisition.
0
5,000
10,000
15,000
20,000
25,000
Avg
. Pro
du
ctio
n (
BO
PD
)
Unrisked Net Daily Production for Projects "A", "B", & "C"
NOTE: Slides 82,
85 and 89 were
updated as of
July 14, 2010
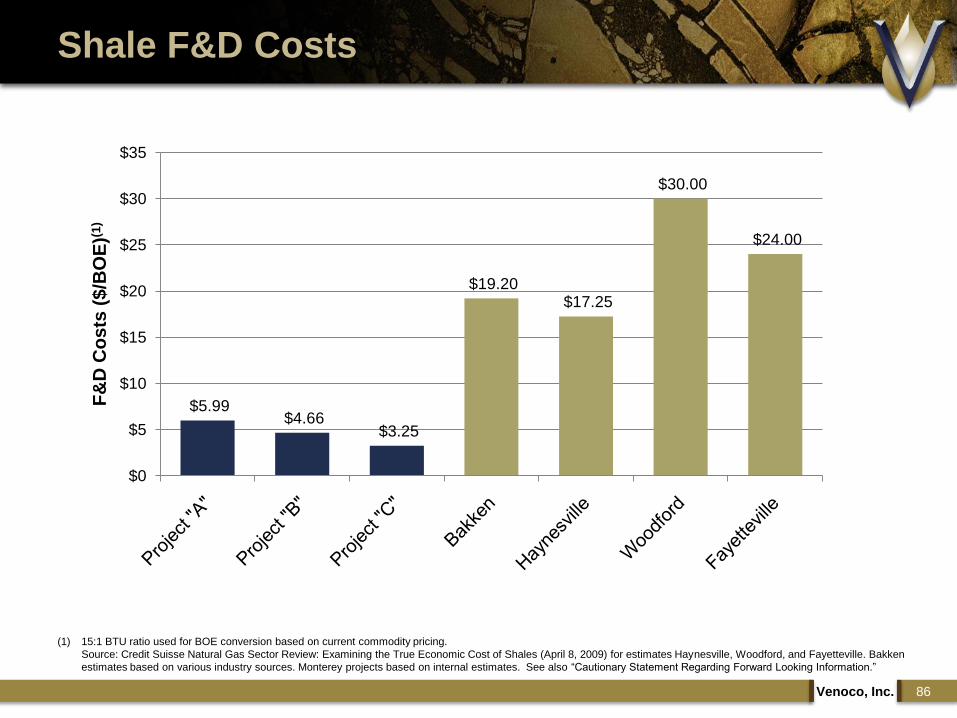
Shale F&D Costs
Venoco, Inc. 86
(1) 15:1 BTU ratio used for BOE conversion based on current commodity pricing.
Source: Credit Suisse Natural Gas Sector Review: Examining the True Economic Cost of Shales (April 8, 2009) for estimates Haynesville, Woodford, and Fayetteville. Bakken
estimates based on various industry sources. Monterey projects based on internal estimates. See also “Cautionary Statement Regarding Forward Looking Information.”
$5.99 $4.66
$3.25
$19.20 $17.25
$30.00
$24.00
$0
$5
$10
$15
$20
$25
$30
$35
F&
D C
os
ts (
$/B
OE
)(1)
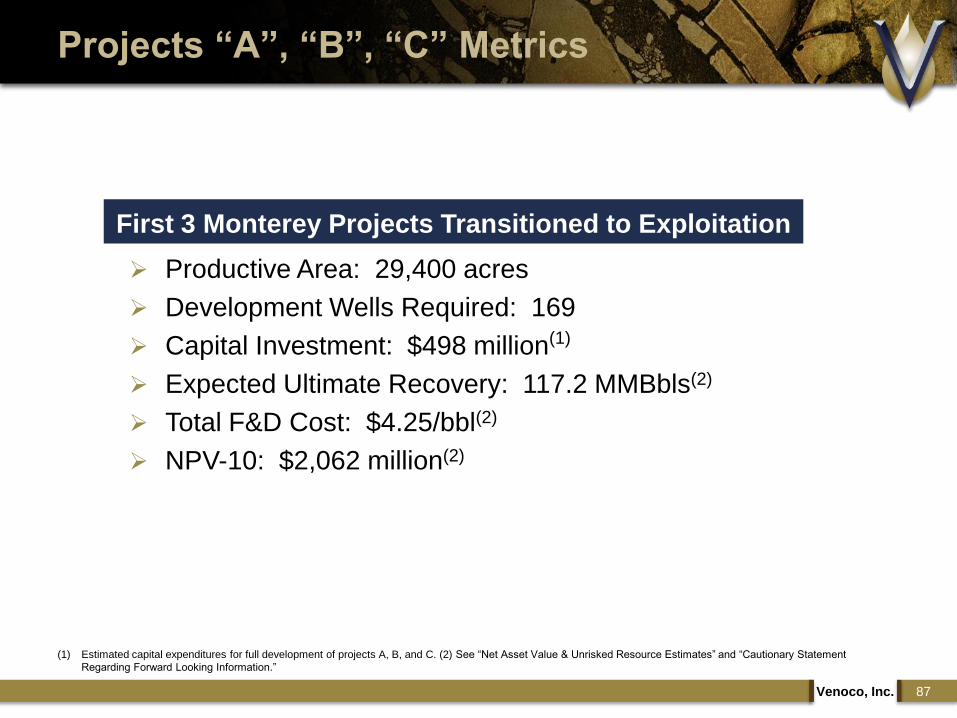
Productive Area: 29,400 acres
Development Wells Required: 169
Capital Investment: $498 million(1)
Expected Ultimate Recovery: 117.2 MMBbls(2)
Total F&D Cost: $4.25/bbl(2)
NPV-10: $2,062 million(2)
Venoco, Inc. 87
Projects “A”, “B”, “C” Metrics
First 3 Monterey Projects Transitioned to Exploitation
(1) Estimated capital expenditures for full development of projects A, B, and C. (2) See “Net Asset Value & Unrisked Resource Estimates” and “Cautionary Statement
Regarding Forward Looking Information.”

Financial Summary & Wrap Up
www.venocoinc.com
Tim Marquez

Monterey 5-Year Forecast(1)
Venoco, Inc. 89
Unrisked Venoco Monterey Acreage Position 5-Year Cash Flows ($M)
2010 2011 2012 2013 2014
Drilling
Monterey "A-C” 3 10 24 48 64
Other Monterey 0 12 14 40 74
Evaluation Wells 7 8 12 12 12
Total Annual Wells Drilled 10 30 50 100 150
Cumulative wells 10 40 90 190 340
Net production (Mboe)
Monterey "A-C" 100 1,281 3,184 7,139 11,447
Other Monterey 0 601 1,411 3,487 7,423
Evaluation Wells 0 0 0 0 0
Total Net Production (Mboe) 100 1,881 4,595 10,626 18,869
Total Net Daily production (Boe/d) 275 5,155 12,588 29,112 51,697
Net revenue 6,741 123,873 301,841 698,241 1,239,272
Lease operating expense (1,291) (25,677) (64,762) (151,135) (276,482)
G&A burden (354) (6,417) (15,638) (36,186) (64,260)
Severance / ad valorem taxes (276) (5,074) (12,364) (28,600) (50,762)
Total Expenses (1,920) (37,168) (92,763) (215,922) (391,505)
Net Operating Cash Flow 4,821 86,705 209,078 482,319 847,767
Cash Based Taxes 0 0 0 (13,677) (41,175)
Capital expenditures
Monterey "A" 0 (6,000) (18,000) (44,000) (72,000)
Monterey "B" (3,000) (9,000) (18,000) (44,000) (36,000)
Montetey "C" (5,000) (12,500) (30,000) (60,000) (60,000)
Other Monterey 0 (38,250) (45,500) (145,000) (270,500)
Evaluation Wells (28,000) (32,000) (48,000) (48,000) (48,000)
Other(2) (12,000) (32,250) (10,500) (10,000) (10,000)
Total Capital Expenditures (48,000) (130,000) (170,000) (351,000) (496,500)
Free cash flow $ (43,179) $ (43,295) $ 39,078 $ 117,642 $ 310,093
Financing the Monterey
Cash flow shortfall for
first few years as we
ramp up activity
Will fund this shortfall
through
Cash flow from other
operations
Selective asset sales
Potential JVs within
our Monterey portfolio
Capital markets
(1) All data shown is “unrisked,” meaning that it is not discounted to reflect the risk of production impediments, unsuccessful development activity, permitting issues, cost increases and
other potential problems. Our ability to achieve the results shown is subject to a wide variety of risks, as discussed in “Cautionary Statement Regarding Forward-Looking
Information” and the “Risk Factors” section of our 2009 annual report on Form 10-K. Type wells assume 100% WI and 80% NRI.
(2) Land, G&G, and seismic capital expenditures.
NOTE: Slides 82, 85 and 89 were
updated as of July 14, 2010.

Venoco, Inc. 90
Monterey Net Asset Valuation (NAV)(1)
Area Acreage EUR Well Count Capital NPV10 Discounted P/I
Project “A” 9,400 29.4 MMBO 56 $176 MM $307 MM +2.54
Project “B” 7,500 26.2 MMBO 38 $122 MM $440 MM +4.99
Project “C” 12,500 61.6 MMBO 76 $200 MM $1,315 MM +9.76
Other MontereyProjects
82,000 339 MMBO 800 $2,674 MM $3,905 MM +2.76
Total(2) 105,000 456 MMBO 1,090 $3,172 MM $5,967 MM +4.6
Net Asset Valuation assumptions(1)
100% WI; 80% NRI
Gross EUR:
Project “A” = 525 MBO; IP = 350 BOPD; So = 25%
Project “B” = 750 MBO; IP = 500 BOPD; So = 40%
Project “C” = 800 MBO; IP = 700 BOPD; So = 33%
Flat prices of $80.00 / BBO and $5.00 / MCF
Per field differentials based on Buena Vista Benchmarks and
inclusive of marketing expenses
Severance / ad valorem taxes = 4.0%
Capital Expenditures (D&C):
Project “A” & “B” = $3.0 MM
Project “C” = $2.5 MM
Other Project Areas = $3.25 MM
Per Field LOE & Water Disposal Based off Nearby Data
Does not include costs other than as described above (i.e., excludes
costs such as G&A, land acquisition and interest expense).
Unrisked Scenario based on P50 Probabilistic Volumetrics and
Projected MY2010 Venoco Acreage Position
(1) Includes internal estimates of unrisked reserve potential. See “Net Asset Value & Unrisked Resource Estimates.”
(2) Includes $204 MM to drill 51 evaluation wells from 2010-2014 (no production associated with test wells).

Potential Net Asset Value(1)
91Venoco, Inc.
PV-10 (3)/
NAV ($MM)
Risk
Factor(8)
Risked
Value(8)
Proved Reserves(3) 101.3 MMBOE $1,670 100% $1,670
Probable Reserves(4)
Southern California (excluding South Ellwood) 5.5 MMBOE $133 80% $107
South Ellwood 14.6 MMBOE $270 90% $243
Sacramento Basin 5.4 MMBOE $33 100% $33
West Hastings - CO2 Flood (3rd Party Reserves - Phases 1-4) 17.7 MMBOE $225 50% $113
Additional Unrisked Resources(4)
West Montalvo Development 11.0 MMBOE $166 40% $67
Sac Basin 20-acre Infill Drilling / Frac / Recompletions 46.0 MMBOE $436 70% $305
Sac Basin 10-acre Infill Drilling 39.2 MMBOE $211 70% $148
Hastings - CO2 Flood (East Hastings & Addt'l Upside on Phases 1-4) 11.5 MMBOE $257 10% $26
Onshore Monterey Shale(9) 456.0 MMBOE $5,967 30% $1,790
Potential Asset Value(5)708.3 MMBOE $9,369 $4,501
(as of 3/31/10)
Total Debt ($715.2) ($715.2)
Cash $0.6 $0.6
Net Debt ($714.6) ($714.6)
Fair Value of Commodity Derivatives $54.7 $54.7
Fair Value of Interest Rate Derivative ($31.4) ($31.4)
Net Balance Sheet Items ($691.3) ($691.3)
Fully Diluted Shares Outstanding(6)57.61 57.61
Total Potential Asset Value per fully diluted share (7) $150.63 $66.13
Commodity Price Assumption: 5-Year Strip as of 12/31/09(2)
(1) Does not include estimates of final proceeds from Texas asset sale. (2) On
12/31/09, the 5-year strip averaged $87.04/Bbl and $6.43/Mcf, ranging from an
average of $81.16/Bbl and $5.79/Mcf in 2010 to $91.09/Bbl and $6.84/Mcf in
2014. Average 2014 prices were used for future years. (3) See Appendix for a
definition of PV-10 and the relevant GAAP reconciliation. (4) See “Net Asset
Value & Unrisked Resource Estimates.“ (5) Amounts other than 12/31/09 PV-10
values of proved and probable reserves at 5-year strip pricing are based on
internal estimates of unrisked reserve potential. See “Net Asset Value &
Unrisked Resource Estimates.“ (6) Common stock equivalents do not assume
application of treasury stock method. (7) Potential Net Asset Value or Proved
Reserves less net debt and the estimated fair value of interest rate and
commodity derivatives included in the balance sheet at 3/31/10. NAV per share
based on shares outstanding and common stock equivalents at 3/31/10. (8) Risk
factor figures are intended to be illustrative of internal estimates of the relative
riskiness of the company‟s projects, but do not purport to reflect all risks
associated with the development of the projects , production of the associated
oil and natural gas or receipt of proceeds therefrom. For example, the risk
factor of 100% for the company‟s proved reserves is intended to show that the
development of those reserves is expected to be less subject to risk than the
other projects described, not that there are no risks associated with that
development. See “Cautionary Statement Regarding Forward Looking
Information.” Similarly, risked value figures do not purport to represent the fair
market value of the projects shown for reasons described in “Net Asset Value &
Unrisked Resource Estimates.”
Total Proved Reserves per fully diluted share(6) = $16.99
(9) NAV at flat $80 oil and $5 natural gas prices. Assumes approximately 1,000 wells with estimated per well recovery of
approximately 400 MBbls. See Monterey development and economic assumptions outlined within the “Operations & Development” and
“Financial Summary” sections of this presentation. Exploitation & development contemplates an evaluation drilling program to help
understand the potential on the company‟s acreage and determine what development plans may be economic. The number of
locations makes assumptions about the proportion of the acreage which may meet our economic criteria. The actual development
plan could vary significantly from our estimates in terms of timing, cost and extent of activity and results obtained.
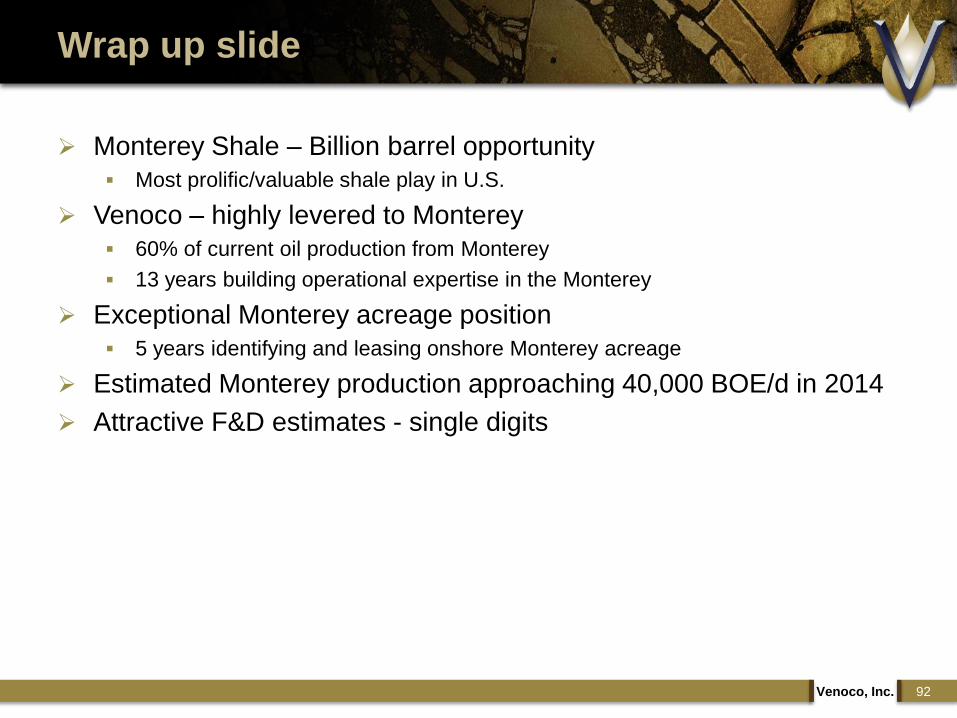
Monterey Shale – Billion barrel opportunity
Most prolific/valuable shale play in U.S.
Venoco – highly levered to Monterey
60% of current oil production from Monterey
13 years building operational expertise in the Monterey
Exceptional Monterey acreage position
5 years identifying and leasing onshore Monterey acreage
Estimated Monterey production approaching 40,000 BOE/d in 2014
Attractive F&D estimates - single digits
Venoco, Inc. 92
Wrap up slide

APPENDIX
www.venocoinc.com
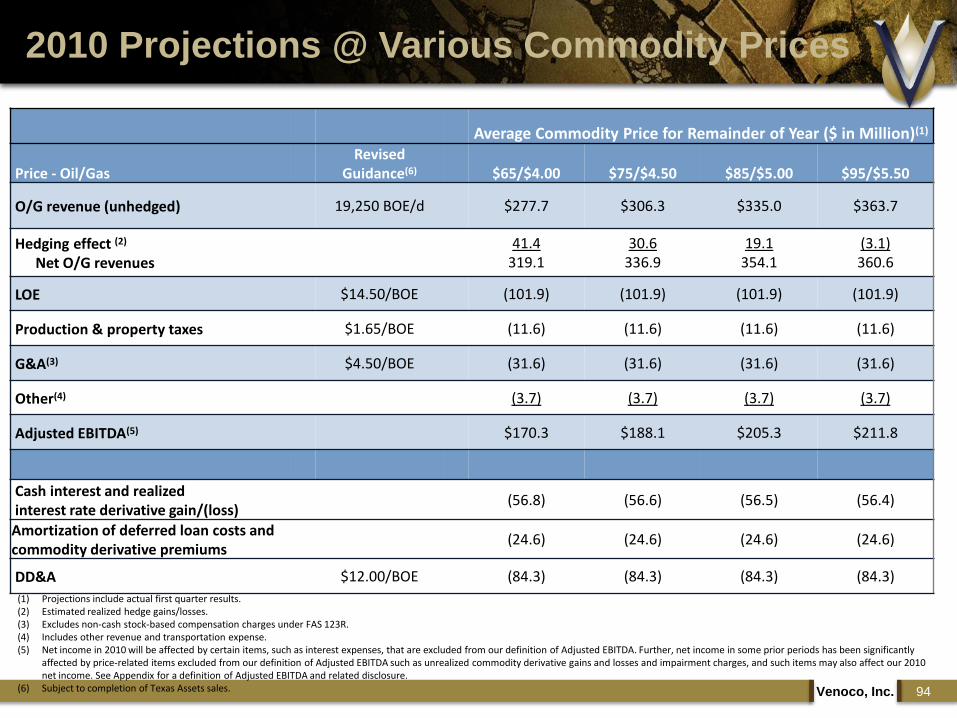
2010 Projections @ Various Commodity Prices
94Venoco, Inc.
(1) Projections include actual first quarter results.(2) Estimated realized hedge gains/losses. (3) Excludes non-cash stock-based compensation charges under FAS 123R.(4) Includes other revenue and transportation expense.(5) Net income in 2010 will be affected by certain items, such as interest expenses, that are excluded from our definition of Adjusted EBITDA. Further, net income in some prior periods has been significantly
affected by price-related items excluded from our definition of Adjusted EBITDA such as unrealized commodity derivative gains and losses and impairment charges, and such items may also affect our 2010 net income. See Appendix for a definition of Adjusted EBITDA and related disclosure.
(6) Subject to completion of Texas Assets sales.
Average Commodity Price for Remainder of Year ($ in Million)(1)
Price - Oil/GasRevised
Guidance(6) $65/$4.00 $75/$4.50 $85/$5.00 $95/$5.50
O/G revenue (unhedged) 19,250 BOE/d $277.7 $306.3 $335.0 $363.7
Hedging effect (2)
Net O/G revenues41.4
319.130.6
336.919.1
354.1(3.1)360.6
LOE $14.50/BOE (101.9) (101.9) (101.9) (101.9)
Production & property taxes $1.65/BOE (11.6) (11.6) (11.6) (11.6)
G&A(3) $4.50/BOE (31.6) (31.6) (31.6) (31.6)
Other(4) (3.7) (3.7) (3.7) (3.7)
Adjusted EBITDA(5) $170.3 $188.1 $205.3 $211.8
Cash interest and realizedinterest rate derivative gain/(loss)
(56.8) (56.6) (56.5) (56.4)
Amortization of deferred loan costs and commodity derivative premiums
(24.6) (24.6) (24.6) (24.6)
DD&A $12.00/BOE (84.3) (84.3) (84.3) (84.3)
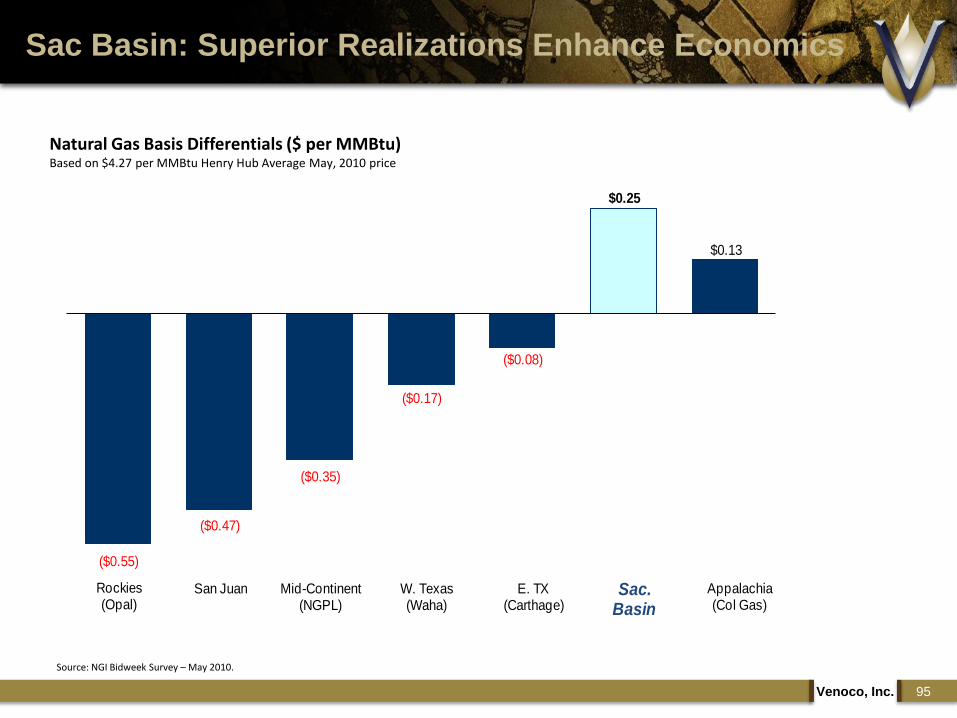
Sac Basin: Superior Realizations Enhance Economics
95Venoco, Inc.
($0.55)
($0.47)
($0.35)
($0.17)
($0.08)
$0.25
$0.13
Rockies(Opal)
San Juan Mid-Continent(NGPL)
W. Texas(Waha)
E. TX (Carthage)
Sac. Basin
Appalachia (Col Gas)
Source: NGI Bidweek Survey – May 2010.
Natural Gas Basis Differentials ($ per MMBtu)Based on $4.27 per MMBtu Henry Hub Average May, 2010 price

Historical Operating Data
96Venoco, Inc.
Years Ended December 31Three Months
Ended March 31,
2005 2006 2007 2008 2009 2010
Production (BOE/d) 11,555 15,882 19,535 21,674 20,622 19,384
Oil component 70% 59% 56% 52% 45% 45%
Oil & Gas Sales ($000) $191,772 $268,822 $373,155 $555,917 $268,865 $82,501
LOE per BOE $12.44 $14.18 $15.05 $16.86 $12.65 $11.95
Production & Property Taxes per BOE
$0.37 $0.91 $1.69 $1.98 $1.35 $1.27
G&A per BOE $3.79 $4.88 $4.46 $5.43 $4.91 $5.39
Interest Expense per BOE (2) $3.66 $9.09 $9.00 $8.52 $8.28 $8.78
Adjusted EBITDA (1) ($000) $100,455 $146,173 $210,397 $299,810 $192,863 $53,181
Realized Prices per Unit:
Oil, Excl Hedges (BBL) $45.66 $55.92 $64.06 $89.69 $51.10 $69.29
Gas, Excl Hedges (MCF) $7.45 $6.04 $6.61 $8.21 $3.84 $5.34
Blended, Excl Hedges (BOE) $45.47 $46.37 $52.34 $70.08 $35.72 $47.28
Blended, Excl Hedges (Mcfe) $7.58 $7.73 $8.72 $11.68 $5.95 $7.88
(1) See Appendix for reconciliation of Adjusted EBITDA to net income (loss). (2) Includes interest expense, realized (gain) loss on interest rate swap and amortization of deferred loan costs.

Derivative Transactions
Current Crude Oil Deliveries for Production BBLs/Day
Weighted
Avg Prices BBLs/Day
Weighted Avg
Prices
May 1 - Dec 31, 2010 8,000 56.22$ 6,150 83.32$
Jan 1 - Dec 31, 2011 7,000 50.00$ 5,000 140.40$
Jan 1 - Dec 31, 2012 3,000 60.00$ 3,000 121.10$
Current Natural Gas Deliveries for Production MMBtu/Day
Weighted
Avg Prices
MMBtu/Day
Weighted Avg
Prices
May 1 - Dec 31, 2010 58,900 6.48$ 27,900 7.25$
Jan 1 - Dec 31, 2011 60,000 6.31$ 12,000 7.65$
Jan 1 - Dec 31, 2012 37,300 6.16$
Floor Cap
Floor Cap
Note: Hedges are based on NYMEX WTI (oil) and NYMEX Henry Hub (natural gas). Natural gas prices above reflect our use of basis swaps to fix the differential between the NYMEX Henry Hub price and the PG&E Citigate price on a portion of our expected production. Positions shown are as of May 1, 2010.
97Venoco, Inc.
Net Asset Value & Unrisked Resource Estimates
References in this presentation to Asset Value or Net Asset Value (NAV) reflect the present value of estimated future revenues to be generated from the production associated with the asset or project in question, net of estimated production and future development costs and future plugging and abandonment costs, using indicated prices and costs without future escalation, and without giving effect to hedging activities, non-property related expenses such as general and administrative expenses, debt service and depreciation, depletion, amortization and impairment and income taxes, and discounted using an annual discount rate of 10%.
While we believe that our NAV estimates are illustrative of the potential value of the projects and assets described, they do not purport to represent current or future market values of those assets or projects. The factors that could cause our estimates of NAV to be higher than market values include the following:
-- the NAV estimates are "unrisked," while estimates of current market value would take production, geologic and other risks into account, especially in the case of estimates that relate to existing or potential resources that do not meet the definition of proved reserves. See "Unrisked Resource Estimates" below and "Cautionary Statement Regarding Forward-Looking Information."
-- the NAV estimates assume that the development activities in question commence or have commenced as of the date of the estimate. In fact, many of these activities will not be commenced until some time in the future. Estimates of current market value would take this into account.
-- as noted above, the NAV estimates use indicated oil and natural gas prices and do not take into account our hedging activities; our actual future cash flows will be affected by subsequent changes in oil and natural gas prices and by our hedging activities.
Unrisked Resource EstimatesIncluded in this presentation are certain internal estimates of potential reserves we may develop in the future that are "unrisked," meaning that they are not discounted to reflect the risk of production impediments, unsuccessful development activity, permitting issues, cost increases and other potential problems. Our ability to obtain these potential reserves, and to produce the associated oil and natural gas, is subject to a wide variety of risks, as discussed in "Cautionary Statement Regarding Forward-Looking Information" and the "Risk Factors" section of our 2009 annual report on Form 10-K. Unrisked estimates of potential reserves are significantly more uncertain than estimates of proved reserves.
Probable ReservesReferences in this presentation to probable reserves refer to third-party estimates prepared in accordance with the Petroleum Resources Management System (PRMS) approved by the Society of Petroleum Engineers, the World Petroleum Council, the American Association of Petroleum Geologists and the Society of Petroleum Evaluation Engineers. Such estimates may not be identical to estimates prepared in accordance with the new SEC rules.
98Venoco, Inc.

GAAP Reconciliations – Adjusted EBITDA
(in thousands) 2005 2006 2007 2008 2009
Three Months Ended
3/31/10
Net Income (Loss) $ 16,110 $ 23,951 $ (73,372) $ (391,132) $ (47,298) $ 43,988
Interest, Net 13,673 48,795 60,115 54,049 40,984 10,124
Realized Interest Rate Derivative (Gains) Losses - 96 (135) 10,231 18,479 4,509
Income Taxes 10,300 15,650 (46,200) 11,200 (14,400) (200)
Amortization of Deferred Loan Costs 1,755 3,776 4,197 3,344 2,862 677
DD&A 21,680 63,259 98,814 134,483 86,226 19,974
Accretion of Asset Retirement Obligation 1,752 2,542 3,914 4,203 5,765 1,585
Ceiling Test Impairment - - - 641,000 - -
Loss on Extinguishment of Debt - - 12,063 - 8,493 -
Share-based Payments - 3,050 3,278 3,064 2,824 1,323
Amortization of Derivative Premiums and
Other Comprehensive Loss 4,701 8,181 11,546 7,694 24,985 5,657
Unrealized Commodity Derivative (Gains) Losses 32,236 (21,079) 122,779 (184,459) 71,511 (39,471)
Unrealized Interest Rate Derivative (Gains)
Losses - 494 17,312 10,336 (1,803) 5,015
Adjusted EBITDA $ 102,207 $ 148,715 $ 214,311 $ 304,013 $ 198,628 $ 53,181
We use Adjusted EBITDA, as a supplemental measure of our performance that is not required by, or presented in accordance with, GAAP. We define
Adjusted EBITDA as net income (loss) before the effect of the items below. We present Adjusted EBITDA because we consider it to be an important
supplemental measure of our performance. Because the use of Adjusted EBITDA facilitates comparisons of our historical operating performance on a
more consistent basis, we use this measure for business planning and analysis purposes, in assessing acquisition opportunities and in determining
how potential external financing sources are likely to evaluate our business.
Adjusted EBITDA is not a measurement of our financial performance under GAAP and should not be considered as an alternative to net income
(loss), operating income or any other performance measure derived in accordance with GAAP, as an alternative to cash flow from operating activities
or as a measure of our liquidity. You should not assume that the Adjusted EBITDA amounts shown are comparable to Adjusted EBITDA or similarly
named measures disclosed by other companies. In evaluating Adjusted EBITDA, you should be aware that it excludes expenses that we will incur in
the future on a recurring basis. We compensate for these limitations by relying primarily on our GAAP results and using Adjusted EBITDA only on a
supplemental basis.
99Venoco, Inc.

GAAP Reconciliations
Present Value of future net cash flows The present value of future net cash flows (PV-10) is a non-GAAP measure because it excludes income tax effects. Management believes that before-tax cash
flow amounts are useful for evaluative purposes since future income taxes, which are affected by a company's unique tax position and strategies, can make
after-tax amounts less comparable. We derive PV-10 based on the present value of estimated future revenues to be generated from the production of proved
reserves, net of estimated production and future development costs and future plugging and abandonment costs, using prices and costs as of the date of
estimate without future escalation, without giving effect to hedging activities, non-property related expenses such as general and administrative expenses, debt
service and depreciation, depletion, amortization and impairment and income taxes, and discounted using an annual discount rate of 10%. Management also
believes that the PV-10 based on the NYMEX 5-year strip pricing is useful for evaluative purposes since the use of a strip price provides a measure based on
current market perception. The following table reconciles the standardized measure of future net cash flows to PV-10 (in thousands):
December 31,
2009
Standardized measure of discounted future net cash flows $ 692,805
Add: Present value of future income tax discounted at 10% 108,248
PV-10 at year-end SEC prices $ 801,053
Add: Effect of NYMEX 5-year strip at December 31, 2009 868,916
PV-10 at NYMEX 5-year strip at December 31, 2009 $ 1,669,969
100Venoco, Inc.