vendor performance and relationship management (vprm… · vendor performance and relationship...
TRANSCRIPT

Vendor Performance and Relationship Management
(VPRM) System
A Major Qualifying Project Report
Submitted to the Faculty
Of the
Worcester Polytechnic Institute
In partial fulfillment of the requirements for the
Degree of Bachelor of Science
By
Derek Carey, MIS
Evan Doyle, MIS
Dennis Leung, MIS
Date: March 11, 2013
Sponsored by:
Communispace
Project Advisor:
Professor Eleanor T. Loiacono

Table of Contents Table of Figures ................................................................................................................................. ix
Table of Tables .................................................................................................................................. xi
Abstract ............................................................................................................................................. xii
Executive Summary ......................................................................................................................... xiii
Authorship Statement ...................................................................................................................... xiv
Acknowledgements .......................................................................................................................... xvi
Letter from Sponsors ...................................................................................................................... xvii
Chapter 1: Introduction ....................................................................................................................... 1
Communispace ................................................................................................................................ 1
Problem Statement .......................................................................................................................... 2
Project Overview ............................................................................................................................ 3
Project Objectives ........................................................................................................................... 4
Chapter 2: Literature Review .............................................................................................................. 5
Communispace ................................................................................................................................ 5
Market Segments ............................................................................................................................ 5
User Interface Design ..................................................................................................................... 8
Consistency ................................................................................................................................. 8
Exploit prior knowledge .............................................................................................................. 9
Organization ................................................................................................................................ 9
Project Methodology Options ....................................................................................................... 11
Systems Development Life Cycle ................................................................................................. 17
Planning Phase .......................................................................................................................... 19
Analysis Phase ........................................................................................................................... 21
Design Phase ............................................................................................................................. 23
Implementation Phase ............................................................................................................... 24
Chapter 3: Methodology ................................................................................................................... 26
Development Plan ..................................................................................................................... 26
Planning ........................................................................................................................................ 27
Staffing Plan .............................................................................................................................. 29
Timeline .................................................................................................................................... 30

Planning and Analysis................................................................................................................... 31
Stakeholder List and Roles ........................................................................................................... 33
Feasibility Analysis ....................................................................................................................... 34
Organizational Feasibility ......................................................................................................... 34
Technical Feasibility ................................................................................................................. 35
Economic Feasibility ................................................................................................................. 38
Risk Assessment ........................................................................................................................... 42
Risk Mitigation ............................................................................................................................. 43
Conclusion .................................................................................................................................... 44
Chapter 4: Analysis and Design........................................................................................................ 46
Analysis......................................................................................................................................... 46
Development ................................................................................................................................. 47
Analysis Strategy .......................................................................................................................... 48
Requirements Analysis Techniques .............................................................................................. 48
Requirements Gather Techniques ................................................................................................. 48
Requirements Definition ........................................................................................................... 49
Target Audience ........................................................................................................................ 49
Requirements Determination..................................................................................................... 50
Functional Requirements ........................................................................................................... 50
Non-Functional Requirements .................................................................................................. 51
Use Cases and Systems Models .................................................................................................... 51
Use Cases ...................................................................................................................................... 52
Process 1 .................................................................................................................................... 52
Process 2 .................................................................................................................................... 53
Process 3 .................................................................................................................................... 53
Process 4 .................................................................................................................................... 54
Process 5 .................................................................................................................................... 54
Process 6 .................................................................................................................................... 55
Process 7 .................................................................................................................................... 55
Process 8 .................................................................................................................................... 55
Process 9 .................................................................................................................................... 56

Process 10 .................................................................................................................................. 56
Process 11 .................................................................................................................................. 57
Process 12 .................................................................................................................................. 57
Process 13 .................................................................................................................................. 58
Data Flow Diagram ....................................................................................................................... 59
Entity Relationship Diagram ......................................................................................................... 60
Storyboard of First Iteration.......................................................................................................... 63
VPRM Main Menu .................................................................................................................... 64
View Vendor and Contact Information ..................................................................................... 64
View Vendor and Contact Information ..................................................................................... 65
View Project Performance Report ............................................................................................. 65
Search Performance by Vendor ................................................................................................. 66
Search Performance by Vendor Type and Tag ......................................................................... 67
Search Performance by Project ................................................................................................. 68
Iterations and Weekly Demo Meetings ......................................................................................... 69
Demo Meeting 1/16/2013 .......................................................................................................... 71
Demo Meeting 1/23/2013 .......................................................................................................... 72
Demo Meeting 1/30/2013 .......................................................................................................... 73
Demo Meeting 2/06/2013 .......................................................................................................... 74
Demo Meeting 2/13/2013 .......................................................................................................... 75
Benefits of an Iterative Approach ............................................................................................. 76
Chapter 5: Implementation ............................................................................................................... 78
Migration Plan .............................................................................................................................. 78
Documentation & Training ........................................................................................................... 78
Documentation & Training Value ............................................................................................. 82
Storyboard of Final Iteration ......................................................................................................... 83
VPRM Main Menu .................................................................................................................... 84
Add New Vendor ...................................................................................................................... 85
Add New Contact Information .................................................................................................. 86
Add a New Project .................................................................................................................... 87
Add Vendor Tag ........................................................................................................................ 88

Add New Type to Existing Vendor ........................................................................................... 89
Add Project Tags ....................................................................................................................... 90
Add Vendor Project Performance Data ..................................................................................... 91
Search Project Performance by Vendor .................................................................................... 92
Search Performance by Project ................................................................................................. 93
Search Vendors by Type ........................................................................................................... 94
Search Vendor by Tag ............................................................................................................... 95
View Vendor Project Performance ........................................................................................... 96
View Vendor and Contact Information ..................................................................................... 97
View Project Information .......................................................................................................... 98
Significance of Storyboarding ................................................................................................... 98
Contingency Plan .......................................................................................................................... 99
System Specification ..................................................................................................................... 99
Hardware and Software Specification ......................................................................................... 100
Implementation Conclusion ........................................................................................................ 101
Chapter 6: Recommendations & Conclusions ................................................................................ 102
Error Checking ........................................................................................................................ 102
Ambiguity ................................................................................................................................ 102
Accidental Duplicates ............................................................................................................. 103
Editing Controls ...................................................................................................................... 103
Layout ...................................................................................................................................... 103
Conclusions & Reflections ......................................................................................................... 103
Appendices ..................................................................................................................................... 106
Appendix A – Systems Request .................................................................................................. 106
Appendix B – Communispace Notes: ......................................................................................... 108
Notes for Communispace Workday: 10/24/2012 .................................................................... 108
Appendix C – Vendor Types and Tags ....................................................................................... 109
Vendor Types: ......................................................................................................................... 109
Vendor Tags (Initial): .............................................................................................................. 109
Appendix D – Tables .................................................................................................................. 110
Project Sponsors and Stakeholders ......................................................................................... 110

Functional and Non-Functional Requirements ....................................................................... 112
Economic Feasibility Tables ................................................................................................... 113
Appendix E – Detailed Individual Staffing Information ............................................................ 115
Derek Carey ............................................................................................................................. 115
Evan Doyle .............................................................................................................................. 115
Dennis Leung .......................................................................................................................... 115
Appendix F – Use Cases ............................................................................................................. 117
Appendix G – Weekly Demo Meeting Minutes ......................................................................... 130
Demo Meeting 1/16/2013 ........................................................................................................ 130
Demo Meeting 1/23/2013 ........................................................................................................ 131
Demo Meeting 1/30/2013 ........................................................................................................ 132
Demo Meeting 2/06/2013 ........................................................................................................ 133
Demo Meeting 2/13/2013 ........................................................................................................ 134
Appendix H - End-User Help Document .................................................................................... 135
VPRM Main Menu .................................................................................................................. 135
Add New Vendor .................................................................................................................... 136
Add New Contact .................................................................................................................... 137
Add New Project ..................................................................................................................... 138
Add Vendor Tags .................................................................................................................... 139
Add New Type to Existing Vendor ......................................................................................... 140
Add Project Tags ..................................................................................................................... 141
Add Vendor Project Performance Data ................................................................................... 142
View Vendor Project Performance ......................................................................................... 143
View Vendor and Contact Information ................................................................................... 144
View Project Information ........................................................................................................ 145
Search Project Performance By Vendor And Tag .................................................................. 146
Search Vendor Performance By Project .................................................................................. 148
Search Vendors By Type ......................................................................................................... 149
Search Vendors By Tag ........................................................................................................... 150
Appendix I - Technical Form Breakdown Documentation......................................................... 151
Form 1: VPRMS Dashboard ................................................................................................... 151

Form 2: frmAddVendor .......................................................................................................... 151
Form 3: frmAddContacts ........................................................................................................ 151
Form 4: frmAddProjects .......................................................................................................... 152
Form 5: frmAddVendorTag .................................................................................................... 153
Form 6: frmCopyVendor ......................................................................................................... 153
Form 7: frmAddProjectTags ................................................................................................... 154
Form 8: frmInputVendorPerformance .................................................................................... 155
Form 9: frmViewAndEditVendorPerformance ....................................................................... 156
Form 10: frmViewVendorInfoAndContacts ........................................................................... 156
Form 11: frmViewProjectInfo ................................................................................................. 157
Form 12: frmVendorSearch .................................................................................................... 158
Form 13: frmVendorSearchWithTagsResults ......................................................................... 159
Form 14: frmSearchVendorsByProject ................................................................................... 160
Form 15: frmProjectSearchWithTagsResults .......................................................................... 161
Form 16: frmSearchVendorsByTypeAndTag ......................................................................... 161
Form 17: frmSearchVendorsByTag ........................................................................................ 162
Appendix J – Contact Information .............................................................................................. 164
Appendix K – MQP Meeting Minutes – With Professor Loiacono ........................................... 165
MQP Agenda: 10/25/2012 ...................................................................................................... 165
MQP Agenda: 10/30/2012 ...................................................................................................... 166
MQP Agenda: 11/06/2012 ...................................................................................................... 167
MQP Agenda: 11/13/2012 ...................................................................................................... 168
MQP Agenda: 11/20/2012 ...................................................................................................... 169
MQP Agenda: 11/27/2012 ...................................................................................................... 170
MQP Agenda: 12/04/2012 ...................................................................................................... 171
MQP Agenda: 12/11/2012 ...................................................................................................... 172
MQP Agenda: 1/15/2013 ........................................................................................................ 173
MQP Agenda: 1/24/2013 ........................................................................................................ 174
MQP Agenda: 1/31/2013 ........................................................................................................ 175
MQP Agenda: 2/07/2013 ........................................................................................................ 176
MQP Agenda: 2/14/2013 ........................................................................................................ 177

Appendix L – Letter of Acknowledgement ................................................................................ 178
Glossary of Terms .......................................................................................................................... 179
Bibliography ................................................................................................................................... 181

Table of Figures Figure 1 - Windows Print Menu (Taken from Microsoft Office 2010) ............................................ 10
Figure 2 - Parallel Development Methodology (Taken from Dennis, Wixom & Roth, 2012) ........ 12
Figure 3 - V-Model Development Methodology (Taken from Dennis, Wixom & Roth, 2012) ...... 13
Figure 4 - Iterative Development Methodology (Taken from Dennis, Wixom & Roth, 2012) ....... 14
Figure 5 - System Prototyping Development Methodology (Taken from Dennis, Wixom & Roth,
2012) ................................................................................................................................................. 15
Figure 6 -Throwaway Prototyping Development Methodology (Taken from Dennis, Wixom &
Roth, 2012) ....................................................................................................................................... 16
Figure 7 - Development Methodology Strengths & Weaknesses (Taken from Dennis, Wixom &
Roth, 2012) ....................................................................................................................................... 17
Figure 8 - AtTask Gantt Chart .......................................................................................................... 31
Figure 9: Context Diagram ............................................................................................................... 59
Figure 10: Level 1 Diagram .............................................................................................................. 60
Figure 11: Backend Database ERD .................................................................................................. 62
Figure 12 – Initial VPRM Storyboard Main Menu .......................................................................... 64
Figure 13 – Initial VPRM Storyboard Vendor and Contact Information ......................................... 65
Figure 14 – Initial VPRM Storyboard Project Performance Report ................................................ 66
Figure 15 – Initial VPRM Storyboard Vendor Performance Search ................................................ 66
Figure 16 – Initial VPRM Storyboard Vendor Performance Report ................................................ 67
Figure 17 – Initial VPRM Storyboard Search Performance by Vendor Type and Tag.................... 67
Figure 18 – Initial VPRM Storyboard Vendor Type and Tag Performance Report ......................... 68
Figure 19 – Initial VPRM Storyboard Search Performance on a Project ......................................... 68
Figure 20 – Initial VPRM Storyboard Project Performance Report ................................................ 69
Figure 21 - VPRM System Error Trap ............................................................................................. 72
Figure 22 - VPRM System Null Value ............................................................................................. 73
Figure 23 - VPRM System Search Performance by Project ............................................................. 73
Figure 24 - VPRM System View Project Performance .................................................................... 74
Figure 25 - VPRM System Add New Contact Information ............................................................. 74
Figure 26 - VPRM System Add a New Vendor ............................................................................... 75
Figure 27 - VPRM System Add a New Project ................................................................................ 76
Figure 28 - Iterative Development Methodology (Taken from Dennis, Wixom & Roth, 2012) ..... 77
Figure 29 - User-End Support Documentation ................................................................................. 80
Figure 30 - Program Code Documentation....................................................................................... 81
Figure 31 - Technical Form Breakdown Documentation ................................................................. 82
Figure 32 - Final VPRM Storyboard Main Menu ............................................................................ 84
Figure 33 - Final VPRM Storyboard Add a New Vendor ................................................................ 85
Figure 34 - Final VPRM Storyboard Add New Contact Information .............................................. 86
Figure 35 - Final VPRM Storyboard Add a New Project ................................................................. 87
Figure 36 - Final VPRM Storyboard Add Vendor Tag .................................................................... 88

Figure 37 - Final VPRM Storyboard Add New Type to Existing Vendor ....................................... 89
Figure 38 - Final VPRM Storyboard Add Project Tags ................................................................... 90
Figure 39 - Final VPRM Storyboard Add Vendor Project Performance Data ................................. 91
Figure 40 - Final VPRM Storyboard Search Project Performance by Vendor ................................ 92
Figure 41 - Final VPRM Storyboard View Vendor Performance by Project ................................... 92
Figure 42 - Final VPRM Storyboard Search Performance by Project ............................................. 93
Figure 43 - Final VPRM Storyboard View Vendor Project Performance ........................................ 93
Figure 44 - Final VPRM Storyboard Search Vendor by Type ......................................................... 94
Figure 45 - Final VPRM Storyboard Search Vendor by Tag ........................................................... 95
Figure 46 - Final VPRM Storyboard View Vendor Performance on Project ................................... 96
Figure 47 - Final VPRM Storyboard Vendor Contact Information .................................................. 97
Figure 48 - Final VPRM Storyboard Project Information ................................................................ 98
Figure 49 - VPRM Help Document Main Menu ............................................................................ 135
Figure 50 - VPRM Help Document Add New Vendor .................................................................. 136
Figure 51 - VPRM Help Document Add New Contact .................................................................. 137
Figure 52 - VPRM Help Document Add New Project ................................................................... 138
Figure 53 - VPRM Help Document Add Vendor Tags .................................................................. 139
Figure 54 - VPRM Help Document Add New Type To Existing Vendor ..................................... 140
Figure 55 - VPRM Help Document Add Project Tags ................................................................... 141
Figure 56 - VPRM Help Document Add Vendor Project Performance Data ................................ 142
Figure 57 - VPRM Help Document View Vendor Project Performance ....................................... 143
Figure 58 - VPRM Help Document View Vendor and Contact Information ................................. 144
Figure 59 - VPRM Help Document View Project Information ...................................................... 145
Figure 60 - VPRM Help Document Search Project Performance By Vendor and Tag 1 .............. 146
Figure 61 - VPRM Help Document Search Project Performance By Vendor and Tag 2 .............. 147
Figure 62 - VPRM Help Document Search Vendor Performance By Project 1 ............................ 148
Figure 63 - VPRM Help Document Search Vendor Performance By Project 2 ............................ 148
Figure 64 - VPRM Help Document Search Vendors By Type ...................................................... 149
Figure 65 - VPRM Help Document Search Vendors By Tag ........................................................ 150

Table of Tables Table 1 -Systems Development Life Cycle ...................................................................................... 18
Table 2- Deliverable Timeline .......................................................................................................... 33
Table 3 - WPI MQP Team Analysis ................................................................................................. 39
Table 4 - Outside Consultant Analysis ............................................................................................. 40
Table 5 - Internal Employee Analysis .............................................................................................. 41
Table 6 - ROI and Break-Even Point View ...................................................................................... 41
Table 7 - Risk Assessment................................................................................................................ 43
Table 8 - Stakeholders List and Roles ............................................................................................ 111
Table 9 - Functional and Non-Functional Requirements ............................................................... 112
Table 10 - WPI MQP Team Analysis ............................................................................................. 113
Table 11 - Outside Consultant Analysis ......................................................................................... 113
Table 12 - Internal Employee Analysis .......................................................................................... 113
Table 13 - ROI and Break-Even Point View .................................................................................. 114
Abstract This Major Qualifying Project (MQP), prepared for Communispace, documents the prototype for a
vendor performance management system. To bring efficiency to the vendor selection process, the
WPI team provided a multifunctional interface that allows for vendor searching based on previous
performance and specific demographical tagging. The Vendor Performance and Relationship
Management (VPRM) system was developed using the SDLC methodology. The needs and
requirements for this system were gathered through stakeholder interview sessions, Joint
Application Design (JAD) sessions and analysis of the as-is system. Documentation has been
provided to assist in the learning process of the new system, as well as the implementation plan to
mitigate the risks in adoption. This prototype was built in Microsoft Access with live connections
to Communispace’s existing SQL Database.

Executive Summary
The curriculum at Worcester Polytechnic Institute provides students with the opportunity to learn
theories and skills in the classroom and apply them to actual businesses. Our project sponsor has
provided us with the opportunity to provide insight and a solution to a business need.
At Communispace, this MQP team will apply the systems development life cycle (SDLC) to
assess the opportunities for the improvement of the vendor management system. Beginning with
the planning phase, we gathered information from major stakeholders and the potential users of the
system. Though interviews, we were able to gather the project requirements and analyze possible
resolutions to the problem.
In the analysis phase, we consolidated the information from the interview sessions and analysis of
the as-is system to develop a systems request that outlines the major points of interest of the
project. This request was passed between major stakeholders to ensure that the request outlined all
of the issues that need attention. With a consensus of the requirements we will enter the design
phase to produce iterative prototypes that can be improved upon in phases and version.
The design phase and implementation phase incorporate most of the physical development and
deployment of our business system. By providing both a prototype, as well as documentation for
the system, users will face a smaller learning curve. User manuals, as well as documentation of all
code will be provided to allow for continued improvements after our final deliverable.
Communispace was able to see the best return on investment and breakeven point by selecting an
MQP team when compared to choosing an outside consultant or a Communispace employee.
These tangible benefits illustrate that an MQP team would provide the best value and resource
allocation.
Authorship Statement
Abstract: Dennis Leung
Executive Summary: Dennis Leung
Acknowledgements: Dennis Leung
Chapter 1, Introduction: Dennis Leung
Chapter 2, Literature Review: Dennis Leung
Chapter 3, Methodology:
Development Plan: Derek Carey
Planning: Derek Carey, Evan Doyle
Scope: Derek Carey
Deliverable Timeline: Derek Carey
Project Methodology Options: Derek Carey
Staffing Plan: Derek Carey, Evan Doyle, Dennis Leung
Stakeholders and Roles: Derek Carey
Feasibility Analysis: Derek Carey, Evan Doyle
Risk Assessment: Evan Doyle
Conclusion: Evan Doyle
Chapter 4, Analysis and Design:
Development: Dennis Leung
Analysis Strategy: Dennis Leung
Requirements Analysis Techniques: Dennis Leung
Requirements Gather Techniques: Evan Doyle, Dennis Leung
Use Cases: Derek Carey
Data Flow Diagram: Evan Doyle
User Interface Diagram: Evan Doyle, Dennis Leung
Story-Board: Derek Carey
Chapter 5, Implementation
Documentation & Training: Derek Carey, Evan Doyle, Dennis Leung
Prototyping and Weekly Demo Meetings: Evan Doyle, Dennis Leung

Migration Plan: Evan Doyle, Dennis Leung
Contingency Plan: Derek Carey, Evan Doyle, Dennis Leung
System Specifications: Derek Carey
Hardware and Software Specification: Derek Carey
Chapter 6, Recommendation & Conclusions:
Recommendations: Evan Doyle, Dennis Leung
Conclusions and Reflections: Evan Doyle
Appendices: Derek Carey, Evan Doyle, Dennis Leung

Acknowledgements
Our MIS project team would like to thank and show our appreciation for our Project Sponsor, Mrs.
Laura Naylor, for providing us the opportunity to apply our systems analysis and design principles
and knowledge to a real-life situation. Furthermore, we would like to show our appreciation
towards Sean Burke for his efforts in initially introducing the idea of this project, and ultimately
getting our team on-site at Communispace.
We would also like to thank Jack Bergersen and Dave Rosenberg for providing us with guidance
and assisting us in getting acquainted with the environment at Communispace, and also providing
us with his wealth of knowledge relating to the company. We would like to show our gratitude and
thank our project advisor, Professor Eleanor Loiacono, for her continued support, feedback and
guidance throughout this capstone project.
Finally, we would also like to acknowledge and thank all those who provided valuable feedback
and input into the development process of the VPRM system. Thanks to Mark Digiammarino,
Michelle Fisher, John Keeter, Shiny Kalapurakkel, and Haven Polk for their continuous effort
during the development process. Without this valuable feedback from these individuals, we would
not be able to develop a system that provides such vital functionality.

Letter from Sponsors
March 5, 2013
Dr. Eleanor T. Loiacono
Associate Professor of MIS
School of Business
Worcester Polytechnic Institute
100 Institute Road
Worcester, MA 01609-2280
Dear Professor Loiacono, The purpose of this letter is to summarize my evaluation of the Major Qualifying Project (MQP) conducted by Derek Carey Dennis Leung, and Evan Doyle during their work with my group at Communispace Corporation. The basic goal of the project was to establish an application that would allow us to centrally capture and report on information about various projects and the associated vendors we utilized to conduct the work. More specifically we wanted to be able to capture, track and manage the vendor options and performance for our member recruiting efforts. Until this point we have been capturing that information in a detailed manner via individual Excel files for each project making it difficult to view performance across projects. Our entire group was very pleased with this team and the work they did. They worked together as a team, were very respectful, diligent and thoughtful in their questions and approach. They were regularly here at Communispace every Wednesday working on this project and sometimes, additional days, particularly when they were conducting interviews and finishing application development. The first part of their project involved interviews with different employees across the group. We were very impressed with how quickly they grasped many of the business issues and data challenges we contend with in operating with a project focus. They worked out detailed recommended approaches for handling different views or the data and were incredibly patient and effective at getting our organization to make decisions on metrics and approaches to standardizing them. One of the most challenging parts of this project were that adjustments required to the data views once we got to the prototype stage. They were professional and collaborative in outlining implications for the suggested alterations and we worked through the level of effort and benefit to make decisions together. In summary, we were very pleased with this team and the work they accomplished. We would never have been able to accomplish this work during this time frame without their assistance and were all impressed with their level of commitment and professionalism. I believe that what we accomplished with this project will help Communispace to be more efficient, reduce risk associated with employee turnover, and allow us to scale and collaborate globally with our member recruitment efforts. If you have any questions, please feel free to contact me. I look forward to working with you on future MQP projects. It was an absolute delight. Sincerely, Laura Naylor Senior VP, Member Experience and Operations, Client Services Communispace Corporation Communispace | 290 Congress Street, 7th Floor | Boston, MA 02210 | T: 617-316-4000 | F: 617-316-4200 | communispace.com

1
Chapter 1: Introduction
The WPI curriculum provides the opportunity for students to participate in a Major Qualifying
Project (MQP) often sponsored by a third-party company. This experience enables student the
ability to apply learned theories from the WPI curriculum to real life practices in organizations
operating in the public and private sectors.
Vital to the learning experience, MQP’s provide opportunities for both students and the sponsoring
company to gain valuable insight. Striving to produce a function solution to a business information
system, project teams can apply class room theory, to real business practices. MQP’s address
various business aspects such as database systems design and development, decision support
systems and e-commerce applications.
As a component in our WPI curriculum, it is a part of our graduation requirements. We are
fortunate enough to be sponsored by Communispace Corporation to develop a Vendor
Performance and Relationship Management System (VPRM) that will create reports regarding
vendor performance. In the following section, Communispace is discussed to facilitate the
understanding of the VPRM.
Communispace
Communispace Corporation, founded in 1999, is a subsidiary of Diversified Agency Services, Inc.,
(a division of Omnicom Group Inc.). It specializes in providing consumer and marketing insight
for organizations to reveal specific market segment trends. With over 12 years of expertise,
Communispace is a leading provider of market research solutions to help organizations increase
brand recognition. To help promote growth in respective brands, Communispace offers

2
organizations the ability to reach specific market segments, especially those segments affected by
branding strategies (Communispace, 2012).
With offices in Atlanta, Boston, Chicago, London, New York, San Francisco, Shanghai and
Sydney, Communispace serves clients on six continents and builds relationships worldwide
through a customer-focused organization (Communispace, 2012).
The main objective at Communispace is to provide their clients with market research solutions. For
example, an organization, such as ExxonMobil, would want to conduct a survey of a specified
market segment, such as stay-at-home dads with 2 children. Communispace would proceed to
reach out to various vendors to find members of this market segment. Furthermore, through a
proprietary software tool, known as Catalyst, consumer communities interact with clients and
provide answers to questions which can be easily analyzed and reported. These reports potentially
offer ideas and strategies to capitalize on trends and innovation.
With an understanding of the business operations at Communispace, there are certain issues
regarding the tracking of vendor specialties and experience. Such information would be beneficial
for the Sourcing Team to reduce the time it takes to select vendors, as well as reduce the
expenditure of funds when developing community groups.
Problem Statement
Though Communispace operates effectively in sourcing community members from vendors, a
system developed to track metrics relating to vendors performance would be beneficial for the
sourcing team. The system will make sourcing community members from vendors more efficient
by reducing the chance that a vendor performs poorly. As Communispace has grown into a
worldwide corporation, various measures have been overlooked in expansion of the company.

3
Currently, Communispace lacks the ability to effective track the success of vendors with regards to
each demographic. With over 200 communities (Communispace, 2012), the ability to report
vendor performance statistics would provide the sourcing team with a valuable tool. The team
would be able to determine the strengths of each vendor, increasing the probability of a
successfully constructed community.
To develop this problem statement, our project team conducted interviews with several members
of the CORE and Sourcing team to gain a better understanding of the company’s operations.
Please refer to Appendix B for detailed notes gathered.
With the insight of various members of the Communispace community, our project team will be
able to address issues within the as-is system, and provide a prototype system that will assist in
vendor performance tracking.
Project Overview
The project sponsor at Communispace is Mrs. Laura Naylor (Senior Vice President, Member
Experience and Operations). Other main contacts are Mr. Jack Bergersen (CORE Operations
Manager Business Analysis & Data Automation), Mr. David Rosenberg (Director of Member
Services Operations) and Mr. Sean Burke (Business Data Analyst). For a detailed list of
stakeholders, please see Appendix C.
While keeping community blends as optimal as possible, Communispace strives to provide quick
turnaround times for clients. Using the VPRM, the souring team will be able to cut down on time
in the vendor selection process. To ensure that client goals and expectations are met from a
community sourcing point of view, we will be creating a dashboard system to assist them in
determining the best vendor(s) based on target audiences, as well as provide a medium for analysis

4
of vendor’s statistics and community blends.
Project Objectives
To ensure smooth operations at Communispace, it is critical to design a system that allows for
improved vendor management. This system will allow users to quickly access data from projects
containing summaries and statistics on vendors. Important information that this system will capture
include vendor metrics and specific demographics that each vendor is highly successful in
sourcing. The vendor metrics will be discussed later in the document. By providing a system that
users can access to determine vendor statistics, they will be able to make educated decision on
vendor selections based on the reporting system which consolidates vendor metrics.
This document will focus on the steps involved in the development of the VPRM system. We
include a literature review section that contains an overview of topics pertinent to the
understanding of the VPRM system and Communispace as a whole. Also, to justify our approach
in developing the system, we included a breakdown of the different project methodologies and
systems development life cycle. This information lays the foundations of knowledge to understand
how each of these phases fit with our project. This documentation will include a complete view of
the project methodology, the iterative approach taken and provide documentation for
implementation and conclude with our reflections on the project and the lessons learning though-
out the whole systems development lifecycle of the VPRM system.

5
Chapter 2: Literature Review
In the next section, we provide details regarding topics in which we found pertinent to the
understanding of operations at Communispace and our methodology in designing the VPRM
system.
Communispace
Communispace provides market research solutions for organizations. Market segmentation is an
important topic to address when dealing with Communispace. To understand the operations, a
discussion regarding market segmentation would reveal how segments apply to operations in the
company. The application of market segmentation in a reporting system would benefit the sourcing
team by uncovering vendor strengths. We address topics relating to user interface design in the
following section. In the process of assessing the needs of Communispace, we applied to systems
development life cycle and considered several methodologies in developing the prototype. The
SDLC and methodologies will be outlined in the following sections.
Market Segments
Market segmentation is critical at Communispace, as well as many other organizations operating in
the public and private sectors. It outlines the differences of preferences of various groups given
certain geographical areas, demographics, psychographics, behaviors and even occasions (Ferrell,
2011). Given these measureable metrics, individuals can be grouped into categories to establish
key demographics and provide companies with the ability to reach a larger group of clients and/or
customers.
By establishing a specific segment of individuals to target, advertising campaigns and distribution

6
channels can be developed to cater to relating needs and wants and increase the chance of attract
them as clients/customers. This contributes to the main function of the development of market
segments, which is to gain a better understanding of how individuals behave. The next section goes
into further details regarding segmentation.
To understand how individuals behave, general segmentation factors, such as geographic and
demographic segmentation provide a broad insight into market strategies for the needs of those in
certain geographic locations. Given geographic information, marketers can understand the needs of
that particular geographic area. For example, the need for snow tires on vehicles in cold and snowy
areas, such as Alaska, would be higher than the need for snow tires in areas more temperate, such
as Florida and Southern California. Moreover, retail marketers can market warm clothing to areas
with colder weather. Food marketers can advertise food items, such as lobster from Maine, to
geographic locations that lack the ability to catch lobsters. In terms of demographics, market
segments such as family size, age, gender, occupation, education, religion, race and nationality
provide insight on behavior patterns. For example, markets specializing in whole foods are often
placed in areas with higher household income. This phenomenon occurs partly due to the increase
of disposable income that is able to be spent on organic food which is often sustainably more
costly than food found in traditional supermarkets.
Psychographic and behavioral segmentation touches upon similar aspects of behavior as those
address in geographic and demographic segmentation. This form of segmentation outlines
differences in lifestyle, personality, values and even social class of individuals. For example,
individuals with an athletic lifestyle would more than likely require athletic wear, such as
windbreakers, running shorts and sweat-wicking attire. Along with these examples, various
consumer items, such as branded items, such as sports jerseys markets to individuals who are
attracted to certain players and teams. This example overlaps with some ideals of geographic

7
segmentation.
Occasions provide another market segment. With regards to occasions, such as holidays, certain
item can be produced and sold to consumers at a higher rate than during other parts of the year. For
example, fireworks and United States branded items are popular during the July 4th
holiday.
Moreover, Christmas provides another market that encompasses more than just Christmas items.
During the Christmas season, consumers tend to make gift purchases for friends and family. The
market segments targeted by Communispace vary drastically. By understanding the various market
segments, Communspace can provide more appealing rewards for community members, given
their market segment.
To develop effective market segments, a certain criteria must be met. The primary three criteria
can be outlined as identifiable segments, accessible segments, and unique segments. To understand
these criteria, it is important to understand what these three terms mean. Let’s take the market
segment of individuals who listen to music as an example. Many market segments can be branched
off of this major segment. A very identifiable, accessible and unique segment would be American
teenagers that listen to country music. This segment is more viable in these aspects than a market
segment that addresses American individuals between the ages of 50 – 60 who listen to Chinese
folk music. This segment would lack accessibility and would be hard to identify. Creating market
segments that are broad is more viable than creating narrow segments. The creation of narrow
segments is necessary in many situations.
Communispace’s sourcing team encounters situations when they must address many different
market segments. Both broad and narrow segments must be addressed, for example, the segment of
brain surgeons would be difficult to develop. The team uses many vectors of developing segment
communities. One method is to use vendors that are specialized in finding such individuals. This

8
method would be more efficient if the sourcing team could record quality metrics for each vendor
for different market segments. By understanding how market segments are efficiently created, the
implementation of a market segment tag would make vendor sourcing more efficient by increasing
the likelihood of using the correct vendor.
User Interface Design
User interface design and human computer interactions are sciences that are ever-changing with
the advancements of technology. However, there are basic principles that remain constant that
guide developers when creating user interfaces. Metrics considered by developers when creating
interfaces include: time to learn, speed of performance, rate of error by users, retention over time
and subjective satisfaction.
To address these metrics, developers consider human diversity and how each individual may be
different than others with respects to what they expect to see and how they interact with an
interface. The following principles will be discussed in further detail in the following section,
Consistency, Exploit prior knowledge, and Organization (Jarret, Stone & Minocha, 2005).
Consistency
By keeping a user interface consistent, users are able to develop an understanding of an interface
quicker and reduce the time it takes to learn and navigate an interface. For example, keeping
terminology, commands, buttons, colors and formats consistent, users are able to interact with the
interface fluidly by developing an understanding of grouping and the general layout of an
interface. An example of this can be seen on the layout of the Amazon.com homepage. After using
the interface of Amazon.com, individuals can find that the layout of the top and side bars do not
change substantially and can be found in the same position no matter what page you are on,

9
allowing users to learn the layout without having to rely on memory.
Exploit prior knowledge
This principle relates to the principle of consistency previously stated. When developing an
interface, exploiting prior knowledge would allow a developer to use standards set in the past. For
example, the method used to close a window is normally clicking an “X” on the top right hand
corner of a window. There is usually a menu bar below the top window bar. These objects are
consistently used in Microsoft Windows. By using templates of currently used reporting
techniques and dashboards, we can develop an interface that does not pose a significant learning
curve.
Organization
When dealing with a user interface is important to consider organization because it helps users
visually understand the layout of an interface. Different operations on an interface, such as related
buttons, are grouped together to show relation. There are different styles of organization, such as
proximity: how close various icons and button are to each other, similarity: how similar icons and
buttons appear, closure: how separated buttons and icons are, and symmetry: how aligned icons
and buttons are (Jarret, Stone & Minocha, 2005). Figure 1 is an example of intuitive organization
in an interface.

10
Figure 1 - Windows Print Menu (Taken from Microsoft Office 2010)
Proximity: This aspect can be seen in the tab system on the top of the print menu. Also, Printing
Shortcuts are located in close proximity. Each of these tabs is close to each other, indicating
relation.
Similarity: The dropdown options on the right side of the interface display similarity. They are all
the same length and provide a brief description above each field.
Closure: Closure is illustrated in the Print Shortcuts window. These options are enclosed in a menu
that is scrollable.
Symmetry: This aspect is displayed in the alignment of the right side of the interface. The
dropdown menus are all aligned.
Grouping is very significant because it requires no text to convey relationship and organization. In
developing our dashboard interface, we will incorporate these principles to produce an intuitive
interface. Creating an interface requires a purpose, through the SDLC, requirements and needs for
the interface is gathered.

11
Project Methodology Options
There are seven primary project management methods available when working through the
Systems Development Lifecycle (Dennis, Wixom & Roth, 2012). These methodologies known as
Waterfall, Parallel, V-Model, Iterative, Agile Development, System Prototyping and Throwaway
Prototyping. In the section below, we will detail each of these methodologies.
In Waterfall development, users and analysts proceed sequentially from one phase of the SDLC to
the next. The key deliverables involved with each phase tend to involve large volumes of
documentation and paperwork with highly structured approval processes. Waterfall methodology
is ideal for complex, reliable, projects with clear user requirements and familiar technology. At
Communispace, user requirements are well known due to the small number of sourcing and CORE
employees that the vendor management system is targeted for. The technology is also easy to work
with. However, the short timetable and relatively low complexity of the project make waterfall
methodology too stringent for effective use. Being able to move backwards may also be critical
due to the high visibility and feedback that is possible.
Two variants of waterfall methodology also exist in the form of Parallel and V-Model
development. Parallel development methods cut down on the time of waterfall development by
breaking down projects into associated sub-projects. These sub-projects are completed in parallel
with a final integration of all the pieces to complete the overarching system. While quicker,
parallel development creates too many separate deliverables and design processes for a system
with relatively low complexity. Time would be wasted breaking the project into smaller
components and performing redundant processes. Figure 2 illustrates the parallel development
model (Dennis, Wixom & Roth, 2012).

12
Figure 2 - Parallel Development Methodology (Taken from Dennis, Wixom & Roth, 2012)
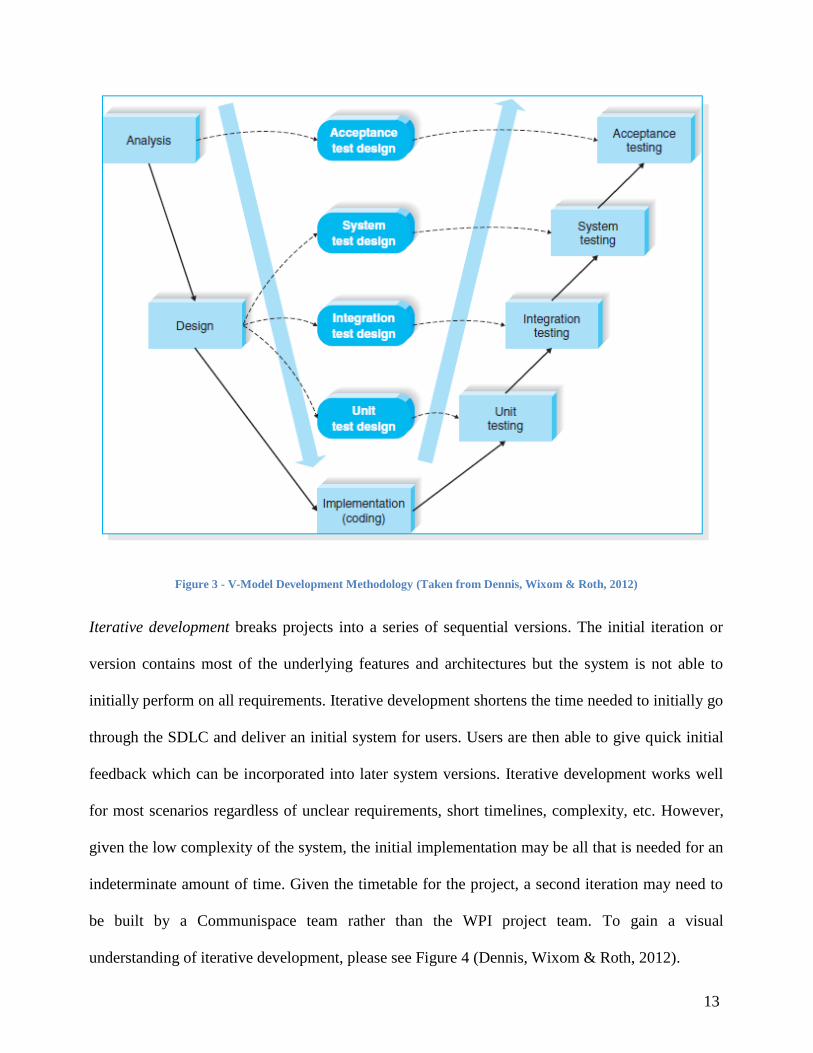
The V-model development methodology places primary emphasis on testing throughout the SDLC.
Before implementation, acceptance testing, system testing, integration testing, and unit testing
must occur. The V-model is very effective for developing systems that are reliable and complex
but falls short on timeliness. Given the availability of users to provide feedback and input on the
project throughout its lifecycle, user acceptance and other forms of testing do not need to be as
rigid. Figure 3 is an illustration of the V-model (Dennis, Wixom & Roth, 2012).
13
Figure 3 - V-Model Development Methodology (Taken from Dennis, Wixom & Roth, 2012)
Iterative development breaks projects into a series of sequential versions. The initial iteration or
version contains most of the underlying features and architectures but the system is not able to
initially perform on all requirements. Iterative development shortens the time needed to initially go
through the SDLC and deliver an initial system for users. Users are then able to give quick initial
feedback which can be incorporated into later system versions. Iterative development works well
for most scenarios regardless of unclear requirements, short timelines, complexity, etc. However,
given the low complexity of the system, the initial implementation may be all that is needed for an
indeterminate amount of time. Given the timetable for the project, a second iteration may need to
be built by a Communispace team rather than the WPI project team. To gain a visual
understanding of iterative development, please see Figure 4 (Dennis, Wixom & Roth, 2012).

14
Figure 4 - Iterative Development Methodology (Taken from Dennis, Wixom & Roth, 2012)
Agile Development closely relates to iterative development but involves rapidly going through the
SDLC for each new iteration. Typically, each new version is brought through the SDLC in about
one to four weeks. Agile development is ideal for short time schedules and non-complex projects.
Agile development results in the same concerns as iterative development since agile iterations
require continuous development.
System and Throwaway prototyping are also two options for building the vendor management
system. System prototyping is a ‘quick and dirty’ method of development where the phases of the
SDLC are performed concurrently. Feedback, reaction, and criticism from end users are then used
for reanalysis, design, and implementation of the end system. System prototyping is not ideal for

15
projects that involve a lot of complexity and a necessity for risk avoidance to avoid reliability.
However, prototyping allows end users to have a high degree of input on the implementation
processes for the project and also allows for smoother recovery in the event of mistakes or need to
backtrack. These benefits could potentially be critical given the lack of experience of the project
team in developing systems for a work environment. Figure 5 below outlines the System
prototyping method (Dennis, Wixom & Roth, 2012).
Figure 5 - System Prototyping Development Methodology (Taken from Dennis, Wixom & Roth, 2012)
Throwaway prototyping uses prototypes primarily to test design considerations rather than for use
as the actual end system. Throwaway prototyping addresses some of the reliability concerns of
systems prototyping by providing plenty of opportunities for testing before final implementation.
Throwaway prototyping also works well for unclear requirements, complex systems, and
unfamiliar technology. However, the low complexity of the vendor management project mitigates
the benefits associated with throwaway prototyping. In all likelihood, throwaway prototyping
would result unnecessary time allocation and work as prototypes would only be used to test out
key concepts. Figure 6 below illustrates throwaway prototyping (Dennis, Wixom & Roth, 2012).

16
Figure 6 -Throwaway Prototyping Development Methodology (Taken from Dennis, Wixom & Roth, 2012)
Based on the requirements, timeline, complexity, and other project factors, developing a system
using an iterative approach would best serve the team and key stakeholders. The WPI project team
can quickly build a prototype system that can be reviewed and tested by the end users. Feedback
from the end users can then quickly be incorporated into the system with the end result being a
system that best matches the needs of Communispace.
Each type methodology for systems development outlined previously has strengths and
weaknesses given certain circumstances. In a situation with unclear requirements, it would not be
recommended to use the waterfall, parallel or V-model development types. This is because these
models incorporate less interaction between stakeholders and the designers. This can lead to a
deliverable that does not completely compliment the requirements. In situations where
requirements are unclear, iterative, systems prototyping, throwaway prototyping and agile
development are recommended. These models allow for an increase in collaboration. See Figure 7
below for a clear description of each methodology and their respective strengths and weaknesses
(Dennis, Wixom & Roth, 2012).

17
Figure 7 - Development Methodology Strengths & Weaknesses (Taken from Dennis, Wixom & Roth, 2012)
The development methodology choice for our system will follow the iterative methodology. This
choice was made early in the planning phase during the requirements gathering phases. An
iterative approach allows us as developers to address all the requirements of the system we will
produce. By have several iterations, we can collaborate with major stakeholders regarding the
various functions of our business system. This will ensure that all requirements are addressed. The
development process also does not necessarily end after our final deliverable. By including
documentation, the CORE team at Communispace will be able to make additions to our program
design to address future needs.
The SDLC relates to each of the previously mentioned methodologies but are incorporated in
differing manners. In the next section, the SDLC is broken down to detail the inputs that are
involved in each of the phases.
Systems Development Life Cycle
The following section details each phase of the SDLC. Each phase occurs in each type of
methodology. The focus and order of each phase is the main difference of each methodology.

18
The SDLC is outlined in Table 1 and provides a breakdown of each phase and step, outlined
above. The table also shows the techniques applied by our team and the deliverables in which we
will be providing.
Table 1 -Systems Development Life Cycle
Phase Step Technique Deliverable
Planning Identify The Problem Speak to Sourcing Team for
Requirements
Introduction
Gather Background
Information
Research Communispace; history,
business type, etc.
Literature Review
Examine Feasibility Three types: organizational,
technological, economic
Feasibility Analysis
Create a Timeline Identify all tasks, estimate time
requirements
Timeline (Gantt Chart,
AtTask)
Staff the project WPI Student Team Staffing Plan
Manage and Execute the
Project
Clarify Project Scope and potential risks Project Scope, Risks, and
Constraints
Analysis Collect business/ system
requirements
Interview employees, document business
processes
System requirements,
system definition
Create various use cases Develop use case analysis Use Cases
Model system processes Diagram data flows for processes Process Models
Model data/information Create entity relationship model,
normalize data
Data Models
Design Design System
Architecture
Select software, select database format System, Architecture report
Design user interface Consider use scenarios, then structure
interface
Interface Design
Build initial prototype Develop prototype structure and data
contents
Alpha prototype
Test user interactions Usability testing, evaluate heuristics Prototype improvements
Build final prototype Apply prototype improvements Final Prototype
Implementation Generate training
materials
User processes, data definitions, etc. User Training manual
Project off-hand Set up for addition of new processes, etc. A compiled system
information documents

19
Planning Phase
The planning phase is where the SDLC begins. This phase can be broken down into six steps, 1.)
Identifying the Problem, 2.) Gathering Background Information, 3.) Examining Feasibility, 4.)
Creating a Timeline, 5.) Staffing of Project, 6.) Management and Execution (Dennis, Wixom &
Roth, 2012).
Identifying the Problem
The process begins by identifying the problem that will be addressed with the development of the
system. There are many ways to determine the problem, an effective way to determine the problem
is to speak with major stakeholders. Major stakeholders, such as the project sponsor, would have a
detailed understanding of the problem in which the project team has been contracted to address. In
this step, the business needs and requirements are determined. With this understanding, the team
can move to the next step, which would be to gather pertinent background information.
Gathering Background Information
This step involves research of topics vital to the understanding of the operations of a business. For
example, an analysis team would benefit from the understanding of pregnancy if their project was
related to the development of an application that provided information to mothers during
pregnancy. Moreover, a detailed outline of the SDLC would provide the analysis team, as well as
the recipient of the final deliverable with a guide to how the project was approached. This
background information can be found in the Literature Review section. After this section is
completed, the team will determine feasibility and move on to create a timeline to provide the
stakeholders with a project timetable and deliverable deadlines.
Examining Feasibility
In examining feasibility, the project team will address three major types of feasibility,

20
organizational, technological and economic. These three points provide the stakeholder with an
explanation regarding how the project will fit within the organization. First, an organizational
feasibility analysis determines if an organization would be likely to adopt the proposed system.
Through an analysis of the skills, competency and resources of the organization, the team would be
able to determine the adoptability of the proposed system.
A technological feasibility analysis determines if the organization would benefit from the proposed
system. An analysis of technological capabilities and familiarities would allow the stakeholders to
gauge how well the organization would be able to integrate the system. From this, we will be able
to understand if the system would ultimately be compatible with the organization.
The compatibility of a system would not provide justification for a project if a project was not
economically feasible. There are normally always costs involved in the development of a system.
Through hiring a consulting group, using in house employees or contracting a project team, there
will always be costs. An economic feasibility analysis allows stakeholders to determine which
route is the best choice. A cost-benefit analysis outlines the advantages and disadvantages of each
route. In this cost benefit analysis, the project team will outline the time in which the organization
would break-even based on the route they choose. Also, with the determination of the return on
investment, the team can provide an evaluation on the efficiency of an investment. The feasibility
analysis provides many projections and estimates which provide an educated estimate on the
outcomes of the project. The feasibility analysis allows the team to develop an educated timeline to
outline deliverable dates.
Creating a Timeline
By developing a timeline, the stakeholders and the project team can accurately gauge the how the
project will be developed. Though this timeline is subject to change, it helps the project team

21
distribute the workload to ensure that deadlines can be met. Furthermore, major stakeholder and
project sponsors can determine their availability for major meetings and interviews to schedule
accordingly to ensure that they will be able to be present. The use of Gantt Charts shows a detailed
outline of the time distributions and the start and end dates of major milestones.
Staffing of Project
By providing details of the staff of a project, stakeholders can be reassured that the skillsets of the
project team are adequate for the task. It also outlines major roles and positions of each member of
the team so that if stakeholders have questions, they can determine who to direct their issue to.
Management and Execution
This step allows the team to determine the scope, constraints and any risks in a project. To
determine the scope and constraints, the major stakeholders and project sponsor determine the
primary goal the project team needs to address. The scoping of a project is constrained by the
timetable and the skill level of the project team. By addressing potential risks of a project, the team
can help stakeholders understand any causes of timetable changes and project adjustments. This
section concludes the planning phase and moves us on to the analysis phase where we begin to
develop the business system and determine the requirements needed to address the initial problem
proposed.
Analysis Phase
The Analysis phase is the second phase of the SDLC. There are four major steps involved, 1.)
Collecting business/system requirements, 2.) Creating Use Cases, 3.) Modeling System Processes,
and 4.) Modeling Data/Information (Dennis, Wixom & Roth, 2012).

22
Collecting business/systems requirements
This step takes many aspects collected in the Planning Phase and translates them into technical
requirements that can be addressed with a technological system. Through discussions and
interviews with employees, the team can understand the flow information and the business
processes involved within an organization. With this information, the project team can move on to
determine major use cases for a system. These use cases help the project team understand how
employees will be able to use and benefit from a system.
Creating Use Cases
This step allows the project team to develop a case in the use of a system. These use cases detail
how actors use a system to achieve a goal. In each use case, the steps an actor, or user, takes to
achieve a goal is documented in detail so that the project team can fully understand how a business
operates. These use cases help determine the flow of data in system processes.
Modeling System Processes
The modeling of system processes takes into account use cases and the flow of information within
an organization. This graphical representation of the flow of data assists in the understanding of
the inputs and outputs from a system. This step includes a deliverable called the data flow diagram,
which displays in the flow of data, where this data goes and where it is stored. This step helps with
the development of a data model, which is outlined in the next step.
Modeling Data/Information
The data model is a technical look into the method of data storage implemented within an
organization. An entity relationship diagram is developed to model a database. It is vital to
understand this concept in the development of business systems because databases hold the
majority of vital information within a company. This information, through views and reports,

23
becomes very informative and require an understanding of relationships to be created. Through the
analysis phase, the project team gains an understanding of the operations within a business and can
begin to technically develop a prototype to benefit the organization.
Design Phase
The design phase is the third phase in the SDLC. This phase is where the programming of the
business system takes place, incorporating all of the information gathered in the two proceeding
phases. This step involves five steps that are not independent of each other. Each step helps build
upon the next and are modified to suit the needs of the business. These steps are, 1.) Designing
System Architecture, 2.) Designing User Interface, 3.) Building Prototype, 4.) Test User
Interactions, and 5.) Build Final Prototype (Dennis, Wixom & Roth, 2012).
Designing System Architecture
The design of a system must take into account potential software and formats. For example, when
developing a system, by using software and formats are ready utilized would increase the
adoptability of a system.
Designing User Interface
As with the design of system architecture, it is important to keep business systems within an
organization consistent. This step develops the physical layout of the user interface. By developing
a system based on the interface of an implemented system, the new interface would require less
time to learn and adopt. This step provides stakeholders with a view into how the interface appears
before the prototype is fully functional. The functionality of the prototype will be developed in the
next step.

24
Building Prototype
The development of a system prototype addresses the system requirements provided by the
stakeholders and the project sponsor. By addressing all the system needs and requirements, the
prototype will be able to provide a functional interface that can be improved upon after user
testing.
Test User Interactions
User testing helps gauge how well the alpha prototype preforms and can help determine if any
needs or requirements were left out. The testing step can be repeated until the prototype is ready to
be delivered as a final, working interface.
Build Final Prototype
By applying information gathered from user testing, the final prototype can be developed to
include the entire scope of the project initially proposed in the planning phase. The final prototype
is designed to address all aspects of needs and requirements. To effectively implement this
prototype, the team will provide various forms of user documentation.
Implementation Phase
The project comes to a close during this fourth and final phase of the SDLC. This phase
incorporates many forms of documentation and possibly provides the opportunity for continued
development after the project hand off. This phase has two steps, 1.) Generating Training
Materials, and 2.) Project Hand-off (Dennis, Wixom & Roth, 2012).
Generation Training Materials
A user manual is developed to provide a detailed explanation on how to effectively use the system.
An outline of user processes is developed to increase learnability. Also data definitions are

25
provided to reduce any confusion users might have. This step is provided to the general users of
the system, next we will address documentation provided to the technically oriented team that the
system will be handed off to.
Project Hand-off
After the project has been completed, it will be handed off to a team that will integrate the system
completely. This team will be able to make any adjustments needed within the programming or
code of the system. This code will be documented in such a way that provides for easy
collaboration through notes. This will allow individuals to make improvements in the future as
they see fit.

26
Chapter 3: Methodology
Our methodology, an iterative approach, allowed us to develop a system that can be improved
through subsequent versions. The development process does not end until all requirements are
addressed. These requirements were given in the form of a systems request. An iterative approach
allows our team to address the requirements that were proposed to us. Since we took an iterative
approach, other requirements were determined through feedback from individuals during demo
meetings. This allowed us to further refine the VPRM system to provide a variety of
functionalities. Through an iterative approach, we developed a complex and reliable system to
address the vendor performance and relationship management issues.
Development Plan
Following the System Development Life Cycle (SDLC) is the best practice for any project that has
an end goal of developing a new system. Even projects that are revamping a current system should
also follow the SDLC. The goal of utilizing the SDLC is to produce a final system that, at
minimum, meets the expected needs of the customer, but aims to exceed them. The SDLC is
comprised of four phases: planning, analysis, design, and implementation. Not one of these
sections is more important than another, the collaborations of following these steps in the correct
order and executing these phases carefully will produce a desired result. For the purposes of this
project our team followed the SDLC as a way to direct ourselves through the creation of the
VPRM tool for Communispace. For a detailed explanation of the SDLC, please refer to the
“Systems Development Life Cycle” section in Chapter 2. Our methodology, based on the SDLC,
began with the Planning Phase.

27
Planning
The planning phase of the SDLC is the first phase in the cycle. For our team, it began with weekly
meetings with our project advisor, Professor Eleanor Loiacono, to begin the initial process of
obtaining a project. Before we came to an agreement with Communispace, we began developing
our literature review regarding the SDLC and project methodologies. During this period of time,
we were officially contracted by Communispace to develop a system to assist in their operations.
The requirements were not made clear until the first day in which we were onsite.
During our first day onsite, the problem in which our team is addressing is revealed. We entered
Communispace with only a general of the business and their practices. Communispace is a firm
that provides market research solutions. We determined that it is necessary to understand the
dynamics of market segmentation because it plays a major role community sourcing. We also
applied user interface design principles in our development of our system, which will ultimately
feature a user-facing dashboard. Interface design principles, such as consistency, allow us to
develop a system that lowers the learning curve posed by a new system.
Communispace provided us with a systems request that detailed the issues in which the VPRM
system will ultimately address. The system will be developed to streamline vendor selection and
performance management processes that will save time for Communispace employees. This
system will feature a dashboard that is easy to navigate and will allow users to narrow down
vendors by selecting tags that will be assigned to each vendor. These tags can be found in
Appendix C. Also, the system will allow users to search past vendor performance to determine if
that vendor is the best fit for that particular category. This system will allow users to simply
manage vendors and project information. This will provide Communispace with the ability to
quickly select vendors knowledgeably based on vendor performance metrics consolidated in the

28
VPRM system. For more details on the Systems Request, please refer to Appendix A.
With an understanding of Communispace’s activities, we moved on to determine if the system is
feasible technically, organizationally and economically.
In our feasibility analysis, we were able to break down each category of feasibility. From the
technical aspect, we addressed the capabilities of Communispace, which we determined to be quite
broad. By analyzing the capabilities, familiarity, and scope regarding the project, teams can
uncover many obstacles in feasibility. With an IT team and a CORE team familiar with Microsoft
Access, a system developed in Access will pose no serious issues. When dealing with
organizational feasibility, we addressed any resistance to the system in which we will create.
Resistance sometimes comes in different forms. Often it is due to lack of support from employees
and also leaders within the company. As we are developing this system from requirements
gathered from individuals who will be benefiting from the system, we determined that
organizational feasibility is not an issue.
Economic feasibility provided an insight into the return on investment and break-even point
figures. We analyzed the benefits of hiring outside consultants, tasking employees and contracting
a project team for the development of a system. From a cost-benefit analysis, we were able to
determine that the project team would be the most cost effective. This analysis gives the
stakeholders and the company a view on the economic benefits and risks involved with the
production of a system. The feasibility of our proposed system will be discussed in further detail
later in this section.
With a feasibility analysis, our team was able to determine the timetable for the project. Given
certain time constraints such as the WPI seven week term system, winter break, and five day work
weeks, we had determined a way to work around it. We take into account the scoping and staffing

29
of the project when developing a timeline for the project.
Scope
Communispace is pursuing a solution to its problem of vendor management by implementing a
new system for tracking vendor performance. Included in the scope is the ability to view vendor
performance by project level or by a given classification or tag. This allows for the ability to view
a vendor’s performance based on a given target classification. The system should also facilitate
recommendations and tracking of vendors that are not often or have never been used. What we
recommend to include, though out of scope, is the ability to pull information from historic
information. This proved to be difficult and costly to implement as this information exists in
different locations which are not normalized. The scope was developed with the team’s skill sets
and abilities. With the determination of the team’s skills and potential, the scope is developed in an
educated manner. This ensures that the scope can be completely addressed.
Staffing Plan
The following section reviews the project-related skills and experience that each team member
has amassed through years of hard work and dedication, to the date of this report. This section
also provides the project sponsors with confidence that the project will be completed (at the very
least) to their expectations.
This project team has completed the graduation requirements to obtain a Bachelors of Science in
Management Information Systems (MIS). The MIS curriculum touches upon principles of
accounting, marketing, business law, supply chain operations, leadership, human computer
interactions, database management, computer programing, and most importantly, systems analysis
and design. All of these topics can be applied to organizations such as Communispace.

30
When applying the theories introduced in the curriculum at WPI to Communispace, the most
important topics would be marketing, accounting, human computer interactions, database
management, computer programming and systems analysis and design. Since Communispace
operates as a marketing solutions provider, it is important to understand the principles of marketing
and market segmentation. Moreover, accounting topics, such as return on investments, break-even
points, balance sheets and income statements, allow us as a team to provide economic projections
to justify the VPRM investment. The human computer interactions course provided an
understanding of effective interface design principles that will be applied out dashboard for the
VPRM system. Data is stored in relational databases similar to those applied in course work. With
that understanding, are able to comprehend the database structure of the Communispace data
storage system. For this dashboard we will use computer programming techniques gathered from
various computer programing courses. Most importantly, the systems analysis and design
principles instilled at WPI will allow us to effectively plan, analyze, design, and implement our
proposed system. This course has provided us with a strong foundation to develop a valuable
business system. For a detailed individual description of team members, please refer to Appendix
E.
Timeline
A timeline and staffing plan provides insight on individual skills and a look into the scheduling of
the project development. The use of a Gantt chart is common when illustrating timelines. The
following Gantt chart is created in AtTask, Communispace’s project management solution, in
order to facilitate work progress. The tool is used by members of Communispace to track the
progression of projects within the company. AtTask will be used for the purposes of helping the
WPI project team better understand the project tools used by Communispace, as well as provide
time and work management benefit. Below is a snapshot of the Gantt chart developed in AtTask.

31
Figure 8 - AtTask Gantt Chart
The planning phase develops the project scope, risks and constraints. This step allows for the clear
determination of the problem. With a clear problem determined, the scope of the project can be
developed to create project boundaries. In the development of the timeline, we assessed various
risks involved in the project.
Planning and Analysis
The analysis phase potentially overlaps the planning phase, as it is difficult to determine many
aspects in planning without the understanding of the problem proposed. This phase features
extensive interviews with stakeholders and members who will be using the completed system. This
allows us to confirm any suspicions and solidifies our understanding of Communispace. Moving
on from interviews, use cases outlining the specific tasks of the VPRM are created to complement
the understanding of business practices. We applied much of the information gathered in the
planning phase to step us forward. Data flow diagrams were also developed to visualize the flow of
data within the company. An entity relationship model was created to understand the technical
nature of the databases in place.

32
We documented approximately eight key metrics which are necessary for vendor performance
tracking. THIS SECTION HAS BEEN REDACTED.
In order to understand the key data sources, we identified various sources of data within the
company and all related attributes to fully understand all business processes. Then, we researched
all company project methods so that all processes were accounted for. From the meetings with the
departments we were able to understand the requirements from the business perspective on what
information they use currently, and how they would prefer the system to be displayed. On the
technical aspect of the project, we met on a weekly basis with Mr. Jack Bergersen to discuss the
technical requirements and feasibility of the project. From discussions with Mr. Jack Bergersen,
we were able to develop a timetable for deadlines for deliverables.
Deliverables and Timetable
The following is a rough timeline of the key deliverables for the WPI project team. Deliverable
deadlines were subject to change but are used as a point of reference for gauging progress. A bulk
of the planning and analysis occurred prior to the end of B term at WPI or before the end of 2012.
In order to ensure the initial proposal was fully developed and ready for approval from
Communispace, the stakeholders and our team determined that it would be best to detail a proposal
before the year’s end. Design, implementation, documentation, and systems migration was set as a
goal for January 2013 and beyond.
Providing deadlines for certain milestones ensures that the development of a system is going as
planned. Major milestones, outlined below in Table 2, provide our MQP with deadlines to produce
deliverables.

33
Table 2- Deliverable Timeline
Deliverable (for both Communispace and MQP) Deadline Process Documentation and Flows
Interview various employees about their processes
Create process flow diagrams and review with
aforementioned
employees
Compile pre-requisite form and process flows onto the project
SharePoint site
November 25, 2012
Proposal Presentation December 5, 2012 Prototype of Tool
Exhibit a few use scenarios
Ensure all sections of the database and SharePoint site are
intuitive to use
Conduct user-testing to gain feedback on potential bugs or
problem areas
Revise tool based on user comments
February 13, 2013
User and Technical Manuals
Will include: step-by-step guide for previously discussed use scenarios,
SQL/VBA code for easy transition to other universe if desired,
Screenshots to aid visually in execution of various tasks
February 21, 2013
Final Draft (MQP Paper) February 27, 2013 Final Presentation February 27, 2013
Stakeholder List and Roles
The timetable in the prior section allowed us to determine the best method to schedule meetings
with various stakeholders for interviews and clarification of issues. A successful project is
measured by the real value added from the perspective of the project stakeholders. In this
circumstance, a stakeholder is anyone that contributes to or is affected by the project. The most
notable stakeholders are the project sponsors, the WPI student team, the faculty advisor, and the
future users of the tool which fall largely under CORE sourcing.
The primary stakeholder in this case is Mrs. Laura Naylor, the Senior Vice President of Member
Experience and Operations. As the project sponsor, she assisted in developing and clarifying the
project requirements and the project scope. Mrs. Laura Naylor provided us with the need of
Communispace, a system that allowed from vendor performance tracking. From an organizational
point of view, Mrs. Laura Naylor provides us with the best insight into the company. When

34
addressing technical issues, we were in contact with Mr. Jack Bergersen, a CORE Manager who
has a great understanding of the technical aspect of Communispace with regards to the flow of data
and data storage. Mr. Jack Bergersen provided us with clarifications regarding the project
requirements and scoping regarding technical issues and assisted us in setting up meetings.
Other stakeholders, such as Ms. Haven Polk, Mr. John Keeter and Mr. Mark DiGiammarino,
provided us with insight on important metrics used to track vendor performance. Through
walkthroughs of the current system, we were given a first-hand account of inefficiencies in the
current system of vendor tracking. Please refer to Appendix D for a complete list of stakeholders.
From these stakeholders we were able to provide guidance and details when develop the feasibility
analysis. The feasibility analysis is outlined in the following sections.
Feasibility Analysis
The feasibility analysis outlines the technical, organizational and economic feasibility (Dennis,
Wixom & Roth, 2012). Technical feasibility displays the ability for an organization to adopt and
utilize a developed reporting system regarding technological barriers. Organizational feasibility
outlines the ability for a company to implement the proposed system given organizational and
hierarchical barriers, such as managerial resistance. Finally, economic feasibility provides an
educated estimate for the return on investment and the break-even point. These figures justify the
development method of a business system.
Organizational Feasibility
Organizational feasibility is highly important because this analysis allows us to see if the proposed
system fits with the company. A system that allows for quick and reliable reporting and views of
information regarding vendor statistics is a very adoptable system that makes vendor sourcing

35
more efficient. For users, the learning curve may pose the largest obstacle since new interfaces
may need time to get accustomed to. The benefits of a system listed that tracks vendor statistics
greatly reduces the time it takes to gather all pertinent data from various spreadsheets. Users will
be able to save valuable time, thus increasing productivity.
The project sponsor, in this case, Mrs. Laura Naylor, possesses significant influence here at
Communispace as the Senior Vice President of Member Experience and Operations. As the project
sponsor, Mrs. Laura Naylor has provided us with specific guidelines, project objectives and goals
which provides with a strong basis to successfully produce a system that can be, in the future,
integrated into the operations at Communispace. From both a managerial and organizational
standpoint, our proposed system is feasible and potentially implementable with little to no
resistance. After this analysis is completed, a technical analysis of feasibility can gauge how well
the proposed system fits with the technological environment.
Technical Feasibility
This portion of the feasibility analysis is divided into five sections. The main point of each of these
five sections is to answer the question set forth in Dennis, Wixom & Roth, (2012). That question is
“Can we build it?” This question assesses the risks of developing a solution for a project and helps
clarify technical risks of a project. The sections encompassed by the technical feasibility are
technological capability, application capability, technological familiarity, compatibility, and
project size.
Technological Capability
Communispace uses many applications and programs in their day to day business operations.
These programs, such as AtTask, Salesforce.com, Microsoft Suits, SQL Database, and Visual
Basic provide functionality that Communispace needs. In reference to our specific project the use

36
of SQL Server, Visual Basic, and possible Microsoft Access will be used in the final product. The
services provided by AtTask will be used to track the progress of our project.
Application Familiarity
The CORE Group at Communispace uses the programs described above on a daily basis. Some use
more facets of the programs than others, and others do not use many of the programs listed above.
Even though there are varying user types, we expect that all members will be able to use the front
end dashboard we create for our project as we will be providing proper documentation to
accompany it.
Technological Familiarity
The Business Analyst group within the CORE Group at Communispace is comprised of trained
experts in the technology currently being used at Communispace. It is within the scope of our
project that we provide a simple and elegant user interface that is well documented for the
Business Analyst Group to take control of at the end of our project.
Compatibility
The system that our team has developed is compatible with the current system in place at
Communispace. Our project will include a detailed user manual and information about the system
for the final project administrators.
Project Size
The WPI project team was able to develop a system given the scope of the project set forth in the
beginning of the team’s time at Communispace. Once the prototype was completed, the vendor
dashboard was handed over to the control of Mr. Jack Bergersen, CORE Operations Manager

37
Business Analysis and Data Automation, and Mr. Burke, Business Data Analyst. Given this detail
the project team expects to finish the project on time and transition the necessary information to
Mr. Jack Bergersen and Mr. Sean Burke seamlessly. Given front-end, back-end and technical
documentation, they will be able to apply the VPRM system to current processes completed at
Communispace.

38
Economic Feasibility
The Communispace project sponsors have expressed a mixture of tangible and intangible benefits
that they hope to derive from the creation of a vendor performance management system. Intangible
benefits based on business requirements include the ability to better select vendors or keep track of
and test out vendors who have yet to be used with regular or any frequency. The ability to track a
vendor’s performance niche is also ranked highly among the system requests and requirements.
Intangible benefits of the project are limited to the amount of time saved by employees with
implementation of the system. To calculate the benefits associated with time saved, a cost of building
and maintaining the system has to be subtracted from a calculation of the monetary value of the time
saved for employees. For fair comparison, this cost/benefit analysis should take into account various
scenarios which include building with system using a WPI project team, building the system using a
consultant, and building the system using a current employee. The following cost benefit analysis
looks at return on investment and break-even point for a variety of assumptions and scenarios. For
the cost-benefit analysis and break-even point, the most common formulas were used. The two
formulas are:
The assumptions for each scenario are based off information provided by Mr. Jack Bergersen and
research on costs associated with employees and consultant work as well as well as a conservative
viewpoint on the benefits obtained through project completion.

39
Cost-Benefit Analysis
WPI Project Team
Building the vendor performance management system using the WPI project team results in the
lowest overall cost and highest project return on investment. WPI is charging Communispace
approximately $10,000 for the WPI project team, which consists of three senior students and one
professor, acting as an advisor. With an average of 15-20 hours invested by each student over the
course of a minimum of 14 weeks, Communispace receives the best value per hour. The team-based
project team offers a broad skill-set and has quality control in the form of the advising professor,
allowing for results comparable to that of a professional consultant or employee. Also worth noting is
the low break-even point for WPI projects due to the lower cost in comparison to other alternatives.
The break-even point for the WPI project team is determined to be about half a year, while the return
on investment is 1116% during a four year time span. You can reference this table in Appendix D.
Table 3 - WPI MQP Team Analysis
THIS SECTION HAS BEEN
REDACTED.
Outside Consultant
If an outside consultant is chose to be contracted, the costs in developing the system would be higher

40
and the return on investment would be lower. In addition to paying for the consultant’s hourly wage,
the company would also be paying an overhead to the company that assigns them to the role of
building the system. The project would be too costly to do with more than one consultant assigned to
the project factoring in only tangible benefits. However, only using one consultant slows down
project completion and allows for no peer-review. Return on investment is 973% during a four year
time span with a break-even point of ten monts. You can reference this table in Appendix D.
Table 4 - Outside Consultant Analysis
THIS SECTION HAS BEEN
REDACTED.
Communispace Employee
Having the vendor performance management system created by an internal employee would help
keep the system in compliance with Communispace norms and standards. Additionally, the system
would be built with greater understanding of employee needs. However, unless the project is the
primary duty of the employee, it would take a substantially longer amount of time to create the
system. Additionally, the cost per hour to develop the system would be higher in comparison to a
WPI project team. Allowing a current employee to take on this new project is also a concern. The
return on investment of this option is approximately 693% with a break-even of a little over seven
months. You can reference this table in Appendix D.

41
Table 5 - Internal Employee Analysis
THIS SECTION HAS BEEN
REDACTED.
ROI and Break-Even Point
Each method of developing the VPRM system, the WPI project team, outside consultant and internal
employee, has different costs associated with them. The WPI team provides the best return on
investment figures and the best break-even point. From an economic standpoint, the WPI team would
best the best economic investment, given that skill levels are similar. The table below details the
calculated figures that portray return on investment and break-event point. You can reference this
table in Appendix D.
Table 6 - ROI and Break-Even Point View
WPI MQP Team Outside
Consultant
Internal Employee
ROI(4 year) 1116% 973% 693%
Break-Even Point .5 Years .8 Years .6 Years
Project Worth
Communispace has determined that the worth of the project once completed would be in the vicinity
of $20,000. This number is derived from the value of Mr. Sean Burke and Mr. Jack Bergersen’s time
to the company. The direct labor cost would come out to around $15,000 for about a month and a half

42
for Mr. Jack Bergersen and Mr. Sean Burke. Additionally they would add in $5,000 to anticipate
delays and project scope changes and creep.
Assumptions
Some assumptions were made in creating the cost/benefit analysis for the three project scenarios.
Based on the information provided by Mrs. Laura Naylor, Mr. Jack Bergersen, Ms. Haven Polk, Mr.
John Keeter, and Mr. Mark DiGiammarino, the WPI project team is assuming that the system will
save the average employee responsible for managing vendors approximately one hour per week.
Given that this amounts to less than 15 minutes saved per day, this goal is entirely possible. THIS
SECTION HAS BEEN REDACTED.
Risk Assessment
In the following section, we analyze the major risks we will potentially face during the course if the
project. These risks impact our approach to the project and can cause delays in deliverables. The risks
involved in this project include review delay, scheduling conflicts and the first generation project.
Professor Eleanor Loiacono, our project advisor, provides us with guidance regarding how we should
approach the project and provides feedback on our deliverables. Timely feedback is important to
keep on track for deliverable deadlines and it would be detrimental if this feedback occurs behind
schedule. Deliverables could potentially be flawed without feedback and critique from our advisor.
In terms of scheduling conflicts, meetings and interviews with stakeholders are essential to develop
an understanding of the operations at Communispace. On both fronts, a missed meeting would be a
waste of resources and would have to be rescheduled for a later time. This wastes company resources
due to loss of productivity of employees and our project team. Also, a scheduling conflict could

43
potentially push our deadline dates back.
Finally, the risk of first generation addresses the problem of having an untested approach to a project
at Communispace. Mrs. Laura Naylor, our project sponsor, as well as stakeholders are uneducated in
the dynamics of an MQP project. This introduces a learning curve into the company.
This following table outlines each of these risks and assigns a rating for risk level and impact. The
next section provides details on how these risks are mitigated.
Table 7 - Risk Assessment
Risk Risk Level Impact Description
Professor Review Delay Medium Medium Professor Loiacono must review our deliverables
periodically throughout the project’s entirety and that
delay must me account for.
Scheduling Conflicts Medium Low The availability of the stakeholders may not always
match up and this risk needs to be accounted for.
First Generation Medium Medium This is the first generation of MQP happening at
Communispace and there is a learning curve for WPI
and Communispace that must be accounted for
Risk Mitigation
The risks listed above have all been assigned mitigation plans. They are listed below.
Professor Review Delay
To reduce the risk of the professor delay we kept Professor Eleanor Loiacono informed with the
status of our deliverables. Each week she knew what the team wanted to discuss in regards to
sections of our document so she had plenty of time to review those sections. We determined a regular
time to meet weekly to ensure that there are no scheduling conflicts. By utilizing telecommunication
resources, such as conference calls and web-based meetings, we can mitigate any issues on this front
44
if meets are not possible in person.
Scheduling Conflicts
To completely avoid scheduling conflicts our team plans to announce presentation dates and
meetings time far in advance. We will also send out requests to stakeholders that need to be present
for the presentation to mark that time on their calendars ahead of time. Moreover, by having updated
schedules available on Microsoft Outlook, we are able to determine when individuals are available to
meet. Then, by sending an invitation to a meeting, we can determine if they accept or decline the
meeting time proposed.
First Generation
This is the first MQP that Communispace has been involved in and that itself provides a risk. To
mitigate this risk our team will attempt to keep Communispace informed throughout the entirety of
the project. We also have laid out the normal aspects of an MQP to them so they know what to expect
without any surprises.
Conclusion
The WPI Project team has determined that building the vendor management system for
Communispace will result in positive monetary return on invest with a break-even point of less than
two years under conservative estimates. Using the WPI project team is a cheaper and more efficient
alternative than the use of a private consultant or internal employee. More importantly, the project
stakeholders within Communispace are very receptive and supportive of a vendor management
system and intend on using it if it addresses all functional and non-functional requirements. However,
the final system must be designed as a scalable entity in order to adapt to a broader range of

45
stakeholder requests.

46
Chapter 4: Analysis and Design
Through the analysis of the information gathering the planning phase and analysis phase, were able
to assess system requirements and draft a development strategy. As we determine the system
requirements, use cases of common tasks and actions provided us with an in-depth understanding of
how users interact with the VPRM system. This helped outline data-flows for the development of
Entity Relationship Diagram (ERD) and data-flow diagrams. These diagrams illustrate visually the
dynamics of data and storage within Communispace, which will then lead us to the design phase.
The design phase began with determining the design architecture of the system. The software needed
to develop the system is determined, in this case, Microsoft Access. This program is used extensively
already; therefore it creates little to no learning curve. With consideration of the use scenarios and
interface design principles, we begin to design the interface. The initial prototype is developed to
address the specific requirements given earlier and is tested by users to ensure that functional
requirements are met. After testing, we addressed any issues determined in the system and deliver a
final product.
Analysis
Communispace has established vendor and community tracking techniques that have been
implemented, but had not scaled to accommodate high volumes of vendors and communities. THIS
SECTION HAS BEEN REDACTED.
Given such a large number of communities, it is difficult to measure the performance of vendors
relative to each community, given each particular market need. The CORE team, along with the
Sourcing team lacks the ability to determine which particular vendor to use for each community. The
CORE and Sourcing teams currently gather members for each community currently without complete

47
knowledge of which vendor is optimal for various market segments.
Communities often require members recruited from several vendors, each with different levels of
experience with certain demographics. While each vendor can recruit members, different vendors
have different pools in which they can recruit members of varying market segments. To ensure
optimal member recruitment from the best matching member pool, information regarding each
vendor and their recruitment pool needed to be consolidated.
The consolidation of vendor performance relative to niche markets provides many advantages. First,
clients will be able to see faster turnaround times due to the reduction of time in recruiting. To allow
for faster turnaround times, better alignment of vendors to projects based on past performance must
be accounted. Next, weight of reliance on individual memory and recollection can be reduced with
the centralization of vendor contact information, as well as other vendor information, such as
specialties. This in turn reduces possible training costs and time spent.
Development
The first step in development was to determine the design of the system. We used information
gained from documentation to create an Entity Relationship Diagram (ERD) for a database to house
the data. Once our first draft was complete, we met with Kim Killeen to confirm entities and
attributes were accurate, and revised the ERD as necessary. Upon completion of the ERD we created
sample interfaces using sketched screenshots to display the intended functionality of the database and
the linked SharePoint site. For the ERD diagram, please refer to later in this chapter. Before building
the prototype, we completed a cost-benefit analysis of our linked system to portray the value that our
system will add to the company. After this step is completed, we will complete the initial prototype
for further refinement.

48
Analysis Strategy
The analysis strategy implemented in the development process is outlined in the section below. The
practices utilized in the analysis phase include initial interviews and then JAD sessions with
stakeholders and the target audiences.
Requirements Analysis Techniques
This section outlines our method of analysis regarding the requirements. JAD sessions with various
stakeholders provided insight into Communispace we would not have gotten otherwise. Demo
meetings showcased weekly iterations for the VPRM system and uncovered requirements that were
not specified in the initial systems request.
Requirements Gather Techniques
In efforts to gather requirements, interviews with the stakeholders were conducted to gain a better
understanding of the processes within Communispace. These interviews facilitated the initial
understanding of operating practices.
Through informal Joint Application Design sessions (JAD), we were able to confirm our
understanding of Communispace that we obtained from the initial interviews conducted. JAD
Sessions are intended to be very structured and formal. To save time and resources, we modified the
process to our needs. These sessions allowed the project team to meet project sponsors and
stakeholders to determine project objective and limitations through probing questions and open ended
questions. JAD sessions commonly include the clarification of the ERD diagram, data flow diagram
and workflows that help determine inefficiencies within a system (Dennis, Wixom & Roth, 2012). In
our case, walkthroughs of current processes are included to help bridge the bridge the gap of

49
knowledge between the project team and Communispace. JAD sessions not only broadened the
understanding we had of Communispace, but also assisted in the requirements gathering process.
During the JAD session process, we interviewed members of various departments, including CORE
and Sourcing to understand the operational activities at Communispace. Through interviews with our
project sponsor, Mrs. Laura Naylor, was able to outline the scope of our project through interviews.
As the project sponsor, she understands aspects of Communispace that, as students at WPI, we do not
have full comprehension of. Furthermore, she was able to direct us into the direction in which we
should develop our business application relative to scoping and requirements.
Requirements Definition
To understand the business processes and applications at Communispace, it’s vital to gather specific
requirements from all stakeholders and members of the target audience. Communication is vital in
ensuring that the development of a business tool is directed down the correct path and encompasses
all the needs and requirements of intended tool. Moreover, when creating a tool that extracts data
from different vectors, it is vital to understand what information is intended to be extracted and that
none of this information is missing.
Target Audience
The proposed requirements are determined by members of the target audience at Communispace.
They include:
Project Sponsor/Project Manager
CORE Team – Community Operations & Recruitment Excellence team that is tasked to efficiently
source members for communities.

50
Sourcing Team – Team that is tasked with putting out requests for bids to vendors for specific
demographics and then selecting which bids to entertain.
Member Services – Team tasked with ensuring members fit correctly in each community.
Individuals involved with vendors and vendor tracking
Individuals involved with project management
For a detailed description of these members, please refer to Appendix D for more details on the
project sponsors and stakeholders.
Requirements Determination
Based on meetings between Mrs. Laura Naylor, Mr. Jack Bergersen, and the sourcing and CORE
teams, the following requirements determination was created in order to outline the various
functional and non-functional requirements of the project. As needs change, the requirements may
need to be updated.
Functional Requirements
Functional requirements detail the process-oriented and information-oriented functions of a system.
These points outline how data flows and how data is stored within the VPRM system. The VPRM
system is developed to allow users to import vendor data from projects and view vendor performance
based on that data. Also, the system tracks vendor performance based on demographics and
community types. Also, the system provides both past and potential vendor options for projects based
on performance. The informational functionality of this system imports data from summary sheets
and tracks all key data points determined by stakeholders. All this data is found in the project
summary sheets.

51
Non-Functional Requirements
Non-functional requirements detail the operational aspects, as well as performance, security and
cultural requirements of the proposed system. Operational requirements relate to how the system will
run, what software and hardware it will utilize and compatibility. The VPRM system will be utilized
on the Communispace network, which has computer terminals running on Windows 7. Also, the
system use software such as Microsoft Excel, Access and Visual Basic. The system must also be
compatible with the current format of project tracking in Microsoft Excel.
Performance requirements for the system include requirements for data importation and interaction
lag times. To ensure that this system is beneficial, lag time must be limited to 2 seconds and data
importation time must be limited to 2 minutes. Also, to ensure that all employees can use this system,
the VPRM system must allow for multiple users at a time.
In terms of security requirements, the system must not take confidential data off the Communispace
network and only allow users authorized to edit data. Also, the system must be backed up. Cultural
and political requirements dictate how the system will benefit Communispace. The system must not
conflict with existing processes and work norms. Furthermore, personal information must be
protected in compliance to the Data Protection Act and incorporate the same look and feel of current
interfaces and dashboards utilized at Communispace.
Please refer to Appendix D for a table detailing the requirements determined from stakeholders.
Use Cases and Systems Models
Use cases are a list of steps, in order, of the completion of a certain process. Usually these steps are
a relationship of two interactions of a role within a system. These can be extremely helpful because

52
use cases define the needs of the users for the design team. Based on the use cases our team knows
what needs to be in the final design and how important each aspect of the design is based on the user
defined preferences and priorities.
Use Cases
Based on systems requirements and information gathered through interviews and demo meetings,
we were able to determine major use cases that define the flow of the final system. The use cases
allow for slow building and refinement of the system storyboard and future iterations of the system.
The following thirteen processes are detailed in their corresponding use cases. Our team has
identified these thirteen processes as the main processes that will occur within the dashboard. Please
refer to Appendix F for formal use case diagrams.
Process 1
Process 1 outlines the functionality of the VPRM system that allows the user to add a vendor to the
system. This process is triggered by clicking the button on the dashboard labeled “add a vendor to
the VPRM System. The major input involved in this process is the vendor identifiers that are
sourced from the SQL database vendor table. The major output is stored data into the VPRM
system.
First, a user inputs the vendor identifiers based on the SQL database vendor table. Next, the user is
prompted to input secondary information of the vendor, such as the city, state, description,
recruitment capabilities, type and status. These pieces of information are then saved into the system.

53
Process 2
Process 2 outlines the how the user adds a new contact into the VPRM system relating to a certain
vendor. This information provides the user with up to date information on a point of contact within a
vendor. This allows for efficient lookup if the case arises that a vendor needs to be contacted. This
process occurs when the user clicks the “add new contact” button on the VPRM system dashboard.
The major input involved in this process is the user contact information provided by the vendor. The
major output is the information stored into the system.
The user steps through the process of adding a new contact by inputting the name, contact
information and email of the vendor contact provided by the vendor. The information is then stored
into the database which can then be queried by vendor.
Process 3
Process 3 outlines how a user adds a new project to the VPRM system. This process is a highly
important as it ultimately allows for querying of project information. This process begins when the
user clicks the “add a new project to VPRM system” button. The major inputs to this process are the
vendor summary data that is found on the project summary sheets. This piece of information
provides the key metrics for each project. Also, the project unique identifier is inputted into the
process. The major output of this process is the stored information in the VPRM system.
The user beings this process by inputting the vendor metrics into the system. A record is created for
a new project in the projects table. This project is specified and attached to a vendor which allows
for querying of data in later processes.

54
Process 4
Process 4 outlines the functionality of the VPRM system that allows the user to attach vendor tags to
a vendor. This is triggered by clicking the button on the dashboard named “add vendor tag.” This
process is highly important because these vendor tags enable a reporting capability within the
VPRM system shows a view of vendor performance based on tags. THIS SECTION HAS BEEN
REDACTED. These pieces of information are sourced from the project summary sheet, sourcing
specialist and systems vendor table respectively. The major output of this process is the stored
information into the system.
The first step in this process is to attach vendor information to the vendor. First, a vendor is selected
to have a tag attached to specify vendor type. Then a describing tag is attached which enables the
system to report by vendor tag.
Process 5
Process 5 outlines how a user attaches a project tag to a project in the VPRM system. The user
triggers this process by clicking the button labeled “add project tag.” The major input of this process
is the project identifiers and project tag sourced from the projects table and sourcing specialist
respectively. The major output of this system is the stored information in the VPRM system.
To complete this process, the user beings by specifying the project in which to attach a tag. This
requires the user to select a client and community. This then narrows down to projects under these
two data points. Next, the user selects a tag to attach to the project. The information is then stored
into the database.

55
Process 6
Process 6 outlines how a user inputs project performance information in the VPRM system. The
user triggers this process by selecting the button on the dashboard labeled “add project performance
information.” This process requires six major inputs sourced from various tables that have been
inputted in previous process. THIS SECTION HAS BEEN REDACTED. The information is then
stored into the system, allowing for querying and reporting capabilities.
THIS SECTION HAS BEEN REDACTED.
Process 7
Process 7 outlines how a user searches for project performance information queried by vendor and
tag. The user triggers this by selecting the dashboard button labeled “search project performance by
vendor and tag.” THIS SECTION HAS BEEN REDACTED. This major output is the report of stored
information based on the vendor and tag specified.
This process begins with the user selecting a vendor from the dropdown menu. Then, a tag is
specified and the projects under a vendor with that specified tag appears in a menu. These projects
are then displayed, along with performance information of these projects.
Process 8
Process 8 outlines how a user searches for vendor performance by project and is triggered by
selecting the button on the dashboard labeled “search vendor performance by project.” The inputs

56
required in this process are information on the client, community and project. This information is
sourced from the client table, community table and projects table. The output of this process is a
report of stored information that matches the criteria selected.
To initiate the steps involved with process, the user specifies project information to narrow down the
final report at the end on this process. The user selects a client, community and project. These pieces
of information then are inputted into the system and a report is generated that matches the criteria.
Process 9
Process 9 outlines how a user will search for vendor performance based on a specified vendor type
and have similarities to process eight. This process is triggered by the user when he selects the
dashboard button labeled “search vendor performance by vendor type.” This process requires inputs
from the client table and community table that specify vendor type and vendor name. The output of
this process is the report of stored information.
The process is begins with the user specifying a vendor type via dropdown menu. This narrows
down the potential vendors listed in the next dropdown. The user then selects a vendor that is listed
with that specified vendor type. Upon submitting this information, a report is generated that displays
vendor performance information based on the vendor type selected.
Process 10
Process 10 outlines how a user searches for vendor performance based on vendor tag. This is
triggered by the user when the dashboard button labeled “search vendor performance by vendor tag”

57
is selected. This process differs from process nine only in the fact that vendor tag is specified, rather
than vender type. The major inputs into this system are vendor tag, additional vendor tags and
vendor information. The output seen in this process is the stored information displayed in the form
of a report.
This process is initiated by the user and begins when the user selects a specific tag to query by.
Additional tags can be selected but is not required. Next, vendors who have these tags attached
appear in the next dropdown. A vendor is selected by the user and a report is then generated.
Process 11
Process 11 outlines the functionality of the VPRM system that allows users to view vendor project
performance. This process is triggered by the user when selecting the corresponding button labeled
“view vendor project performance.” The major inputs of this process are client information,
community information and project information. These pieces of information are pulled and used to
generate a report on project performance.
The user begins this process by selecting the client, community and projects each from dropdown
menus. As the user selects each item from the dropdown menu, the system automatically narrows
down the selections on the next dropdown menu. Next, the system generates a report for project
performance based on the information inputted by the user.
Process 12
Process 12 outlines the functionality of the VPRM system that allows for the viewing and editing of
58
project information. This process allows a user to view and edit, but not delete entries into the
database. The process is triggered by selecting the button on the dashboard that is labeled “view/edit
project information.” This process requires major inputs such as project information and contract
name. The outputs of this process is the report in which is generated from these inputs.
The user begins this process by selecting a project from the dropdown. With this project selected,
the contacts of the project appear in the next dropdown. After selecting a contract, a report is
generated that display performance metrics for each project. If needed, the ability for the user to edit
this information is provided. The user is unable to delete entries, but information within entries can
be edited. Changes are tracked and a log of all changes is created in case of errors.
Process 13
Process 13 illustrates how the user of the VPRM system views and edits vendor information. This is
triggered by the user selecting the dashboard button labeled “view/edit vendor information.” This
process allows for the user to both view and edit vendor information, similar to the process
illustrated in process twelve. The major inputs of this process are vendor name and contract name;
these two pieces of information are used to generate a report of vendor information.
The user begins this process by specifying vendor information. Vendor information and contract
information is inputted into the system via dropdown menu. This information is then used by the
system to generate the views of performance metrics for vendors. This view has editing capabilities
that are recorded and tracked to ensure the integrity of the database and the VRPM system.

59
Data Flow Diagram
Building on the use cases, the data flow diagram (DFD) and context flow diagram (CFD) illustrate
how information flows into and out of the VPRM system. The DFD and CFD are valuable tools
that are helpful when visualizing the flow of information within a system. This helps our team
decide how certain aspects of our backend database will interact with each other. The context level
illustrates the flow of data in a broader sense while the level 1 diagram shows the flow of
information from a detailed view.
THIS SECTION HAS BEEN REDACTED.
Figure 9: Context Diagram
Figure 10 below illustrates the level 1 diagram. THIS SECTION HAS BEEN REDACTED.

60
Figure 10: Level 1 Diagram
Entity Relationship Diagram
An initial entity relationship diagram was created for the purpose of further refinement and
creation of an initial storyboard. The ERD diagram may be used in the creation of the system and
for possible use in expanding or modifying the current SQL database to improve normalization and
data efficiency. Figure 11 displays the ERD for our project. Parts of this ERD already exist in
Communispace’s SQL database that is monitored by Mr. Jack Bergersen and Mr. Burke; parts are
also newly added by our team.
The existing backend database ERD is displayed on the bottom portion of Figure 11. THIS

61
SECTION HAS BEEN REDACTED.
In our proposed addition to the current ERD, shown in the top portion of Figure 11, we gathered
from interviews and feedback from stakeholders THIS SECTION HAS BEEN REDACTED.

62
Figure 11: Backend Database ERD

63
Storyboard of First Iteration
Based on the interviews and brainstorming sessions with the stakeholders of the VPRM system, we
developed a set of storyboards that will illustrate how the VPRM system will address the business
needs of Communispace.
Figures 12 through 20 illustrate how the first iteration of the VPRM system will address the needs
proposed in the systems request. The storyboard was created for review by Communispace
stakeholders in order to further refine business requirements, nail down user interface
recommendations, and work out initial technical concerns. THIS SECTION HAS BEEN
REDACTED.

64
VPRM Main Menu
Figure 12 below showcases a screenshot of the main dashboard which facilitates each of the use
cases. Users can view projects, vendor information, do searches on multiple parameters, and also
perform basic menu functions like exiting the program or receiving help.
Figure 12 – Initial VPRM Storyboard Main Menu
View Vendor and Contact Information
Figure 13 below showcases a screenshot of the vendor contact cards as mentioned in the use
cases. Users can search vendors by ID and name and pull a list of contacts associated with that
vendor.

65
View Vendor and Contact Information
Figure 13 below showcases a screenshot of the vendor contact cards as mentioned in the use
cases. Users can search vendors by ID and name and pull a list of contacts associated with that
vendor.
Figure 13 – Initial VPRM Storyboard Vendor and Contact Information
View Project Performance Report
Figure 14 showcases a screenshot which shows the project list as part of the menu. The project list
is searchable by project id and a shorthand name for reference purposes. Average vendor metrics
are listed at the top of the form with information for each specific vendor listed below. Future
revisions of the project will contain highlighting of fields that fall below or above certain
thresholds.

66
Figure 14 – Initial VPRM Storyboard Project Performance Report
Search Performance by Vendor
Illustrated in Figure 15, users can search performance on multiple conditions. THIS SECTION
HAS BEEN REDACTED.. The report, illustrated in Figure 16, shows a performance average and
the projects for that vendor based on relevant tags.
Figure 15 – Initial VPRM Storyboard Vendor Performance Search

67
Figure 16 – Initial VPRM Storyboard Vendor Performance Report
Search Performance by Vendor Type and Tag
The next search utility is searching for vendor performance based on projects, vendor types, and up
to 3 vendor tags, shown in Figure 17. A summary of vendor performance is once again shown at
the top of the form with specific vendor information at the bottom of the page, shown in Figure 18.
Figure 17 – Initial VPRM Storyboard Search Performance by Vendor Type and Tag

68
Figure 18 – Initial VPRM Storyboard Vendor Type and Tag Performance Report
Search Performance by Project
The next search utility is searching for vendor performance based on only type and up to 3 vendor
tags, illustrated in Figure 19. A summary of vendor performance is once again shown at the top of
the form with specific vendor information at the bottom of the page, illustrated in Figure 20.
Figure 19 – Initial VPRM Storyboard Search Performance on a Project

69
Figure 20 – Initial VPRM Storyboard Project Performance Report
Further revisions will come as we receive feedback from the stakeholders and create the full
functionality in the VPRM prototype system. Feedback and recommendations were received
during several different points in the development process. This storyboard will be used to assist
with the implementation phase of the systems development life cycle as it serves as our first
iteration of the VPRM system. Through weekly demo meetings with stakeholders, we will receive
feedback and recommendations regarding the functionality of the system as a whole. The next
section details the design process which includes several iterations of the VPRM system.
Iterations and Weekly Demo Meetings
Throughout the proposal process our team recorded many aspects of feedback, including testing
and weekly demo meetings with stakeholders that enabled us to follow an iterative approach when
developing the VPRM system. We plan to use this feedback constructively and adapt the project to
the feedback as much as possible. We also still plan on recording more feedback from users and
stakeholders and adapt throughout the entire implementation portion of the project.

70
The section that follows will discuss several factors involved in the iterative design phase. They
include weekly demo meetings that enabled us to iterate a new prototype and showcase a new
protoype on a weekly basis. This section will be followed by our plan for migration that includes
weekly demos as well as user documentation. To address issues that still may arise after during and
after our migration plan, we will detail our contingency plan is any issues do arise. Finally,
specification of hardware, software and the VPRM system as a whole will conclude the
implementation process documentation.
Using the Systems Development Life Cycle, we developed a methodology that enabled us to
accurately develop a system that catered to the visible needs, as well as some invisible needs
that were uncovered during demo meetings. Our group and sponsor company decided that
prototyping and an iterative would be our best option. This way we could refine the system
after each feedback session. We would use the feedback from our weekly demo meetings
which can be found in the minutes from in Appendix G and used that to determine how to
refine our tool and what to focus on next. After we have refined it enough to a point where we
believe it is a sturdy tool we will move it to the testing phase and then the implementation
phase. This entire process will culminate in a hand off to the stakeholders at Communispace.
With the guidance of Mr. Jack Bergersen, we came to the agreement to give weekly demo
presentations for the VPRM Tool to the stakeholders of the project. Each meeting had Mrs.
Laura Naylor, Mr. Dave Rosenberg, and Mr. Jack Bergersen present. At these weekly
meetings we would demo the functionality of the tool and compare it from the week before.
Our main tactic for completing the tool was to have a few functioning forms each week until
the entire tool was completed. This worked out very well in our project. The VPRM system’s
functionality was completed in a timely manner and the status of our progress was clearly

71
displayed to the stakeholders at each of these meetings. This way the stakeholders could see
the tool in action each week.
We also learned throughout the process what to add and change each week. Our team is very
grateful to have these weekly meetings because it was helpful if we were steering in the
incorrect direction for a week then we would be corrected at these meetings without too much
impact on our project or too much time lost. We would like to thank the stakeholders at
Communispace for taking time out of their busy schedules each Wednesday to have this
meeting with us. The following sections outline how each demo meeting allowed us to modify
the VPRM system on a weekly basis, thus stepping though an iterative process. Detailed
below are the notes and information gathered at each demo meeting. Please refer to Appendix
G for notes taken at each demo meeting.
Demo Meeting 1/16/2013
The demo meeting that occurred on January 16, 2013 allowed us to showcase the initial design of
the VPRM system based on feedback and recommendations from the proposal presentation.
During this demo meeting, Mr. Jack Bergersen, Mrs. Laura Naylor and Mr. Dave Rosenberg were
given a demonstration that outlined the following points.
THIS SECTION HAS BEEN REDACTED.
Figure 21 below displays the message box that occurs if performance metrics are inputted with an
error.

72
Figure 21 - VPRM System Error Trap
Demo Meeting 1/23/2013
The demo that occurred on January 23, 2013 displayed the next iteration of the system. This
iteration incorporated the notes taken during the last demo meeting. During this demo meeting, we
discussed the following issues that arose:
THIS SECTION HAS BEEN REDACTED.
In Figure 22 below, we illustrate how a null value is shown in the VPRM system.

73
Figure 22 - VPRM System Null Value
Demo Meeting 1/30/2013
This demo meeting showcased additional functionality of the VPRM system. Key functions, listed
below were incorporated in this iteration.
THIS SECTION HAS BEEN REDACTED. Figure 23 below showcases a screenshot of the Search
Performance by Project functionality.
Figure 23 - VPRM System Search Performance by Project
Figure 24 displays the search function in action, after selecting the “Search Performance” button
along the top bar, the search is performed, as shown.

74
Figure 24 - VPRM System View Project Performance
This demo meeting also addressed issues that arose during the creation of this iteration. We sought
to address:
THIS SECTION HAS BEEN REDACTED.
Demo Meeting 2/06/2013
The demo meeting on February 6, 2013 showcased a near-complete iteration of the VPRM system.
The functions added during this iteration are as follows:
THIS SECTION HAS BEEN REDACTED.
Figure 25 - VPRM System Add New Contact Information

75
Figure 26 - VPRM System Add a New Vendor
Vendor Contact Information form was added and showcased. Per request of Mrs. Laura Naylor,
we determined that we may have to include the ability to add vendors that feature multiple vectors
of sourcing. Upon further investigation, we determined that this function would not be necessary
because there are only a small number of vendors that fall into that category. Also, this issue
would be resolved with the implementation of vendor types.
THIS SECTION HAS BEEN REDACTED.
Demo Meeting 2/13/2013
The demo meeting that occurred on February 13, 2013 showcased a functional iteration of the
VPRM system. Real data was still required to be inputted into the system to test the functionality
of metric calculations. This would test if the calculations in the system matched the calculations
done by the methods used in the past.
THIS SECTION HAS BEEN REDACTED.

76
Figure 27 - VPRM System Add a New Project
In a discussion on a type of vendor, specifically list brokers, we determined that they could be split
up into several categories. THIS SECTION HAS BEEN REDACTED.
Benefits of an Iterative Approach
The VPRM system followed an iterative approach that allowed us to generate a new iteration each
week based on recommendations and feedback from stakeholders during the demo meetings
mentioned in the previous section. These meetings were very beneficial and played a critical role
in the development of a system. The iterative approach is shown in Figure 28 below.
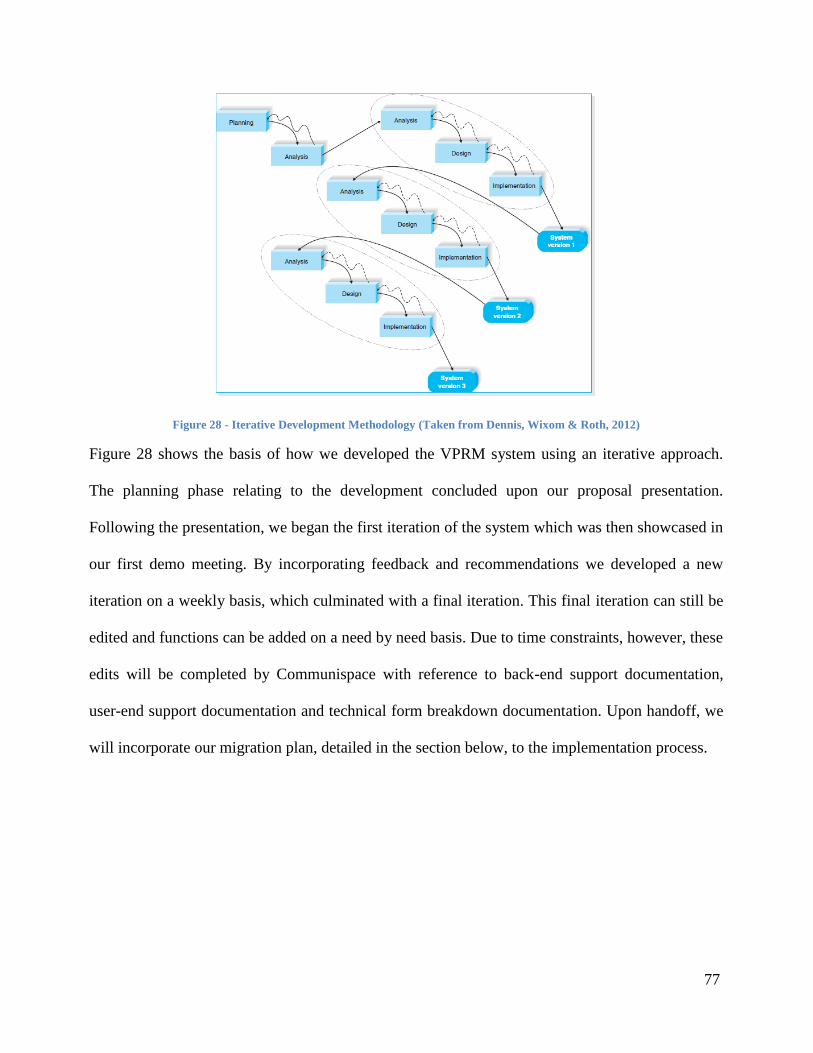
77
Figure 28 - Iterative Development Methodology (Taken from Dennis, Wixom & Roth, 2012)
Figure 28 shows the basis of how we developed the VPRM system using an iterative approach.
The planning phase relating to the development concluded upon our proposal presentation.
Following the presentation, we began the first iteration of the system which was then showcased in
our first demo meeting. By incorporating feedback and recommendations we developed a new
iteration on a weekly basis, which culminated with a final iteration. This final iteration can still be
edited and functions can be added on a need by need basis. Due to time constraints, however, these
edits will be completed by Communispace with reference to back-end support documentation,
user-end support documentation and technical form breakdown documentation. Upon handoff, we
will incorporate our migration plan, detailed in the section below, to the implementation process.
78
Chapter 5: Implementation
Migration Plan
The migration plan outlines the conversion strategy that will be used to successfully hand- off
and introduce the system at Communispace. The conversion strategy is primarily focused on the
conversion style, conversion location, and the conversion modules with deciding factors of risk,
cost, and time.
When migrating from the prototype to the system, we currently recommend a direct conversion
from the prototype to the system since the prototype has been tested by the project team and will
also be tested by the MIS team at Communispace before it goes live. Not doing a direct
conversion would imply that the MIS team at Communispace would utilize portions of the
system and the prototype simultaneously.
We foresee a smooth transition from the prototype designed by the project team to a system
maintained by the MIS team at Communispace since the concepts used in Access can be quickly
and easily transferred to any new SQL environment. We expect the future system to provide
more functionality and reliability while preserving the main structure of the prototype.
Furthermore, to supplement the migration plan, we will include documentation that will assist in
the training of members using the VPRM system.
Documentation & Training
To mitigate risks involved with learnability and adoption of the VPRM system, reference
documentation that touches upon all ends of the system will be provided upon hand off. Since we
were developing the prototype and then handing it off to the MIS team at Communispace, it is
79
beneficial to provide them with descriptions of how to perform business tasks within the system.
We were expecting each item in the user-end support documentation to guide the user through
tasks that will require several steps that are unique to our system. Reference documents and
tutorials will also be included to supplement this user-end help manual to reduce the time it takes
for developers to learn how processes are coded.
Specifically, our team plans on handing the entire MQP document over to Mr. Jack Bergersen and
along with that we plan to hand over our help documentation on the dashboard as well. Also our
final presentation will be included in our deliverables. Documentation for end user support and
back-end support will be also provided to ensure the functionality of VPRM system upon handoff.
In the sections that follow, we describe the types of documentation that will be provided along
with the VPRM system.
User-end Support Documentation
A factor that ensures the success of any migration and/or implementation plan is the effectiveness
of the user-end support documentation. As the primary users of the VPRM system, it is critical to
understand had to effectively utilize all functions included within the system. Below is an example
of one function and its description from the user-end support documentation.

80
Figure 29 - User-End Support Documentation
User-end support documentation not only reduces the time it takes for a user to familiarize
themselves with a system, but also it helps a user understand all functions within a system. The full
capabilities of the VPRM system will be detailed using screenshots followed by a description of
each function. For the complete user-end support documentation, please refer to Appendix H.
Back-End Support Documentation
Upon hand off of this system, all system code will be documented to mitigate program
comprehension issues. By providing notes within the code, each functional process will be outlined
so that modifications can be made efficiently as needed for future iterations of the VPRM system.
Figure 30 below provides a view of how notes are provided within the code. They often are
denoted within code when a string begins with “ ‘ ”.
Vendor Information
In the screen capture below we have selected “THIS SECTION HAS BEEN REDACTED.” as our vendor. Now you can
see the information about that vendor, such as Vendor ID, Vendor Type, and Status.

81
Figure 30 - Program Code Documentation
It is common practice for programmers to provide notes within their program code to assist others
in comprehension. For each snippet or process developed, a brief description is provided.
Complete documentation of code will be redacted from this document for privacy and security
reasons, however, documentation of code will be provided to Communispace upon handoff of the
project.
Technical Form Breakdown Documentation
Along with notes provided within the code, technical descriptions will be provided for each form
view within the dashboard. Users who were not closely involved with the development of the
system will be able to use the technical breakdown documentation as a reference to gain an initial
understanding the system as a whole. An example of how a form is broken down is provided
below.
THIS SECTION HAS BEEN REDACTED.

82
Figure 31 - Technical Form Breakdown Documentation
This documentation provides description of each form used and referred to within the VPRM
system. For each form, a list of referenced queries is provided so that the user can refer if the need
arises. Also, key variables for each form are listed providing the user with a reference point for the
critical variables. These variables are called upon on these forms to provide the criteria for
querying and reporting functionality. Finally, suggested future improvements are provided as
recommendations for future iterations. Please refer to Appendix I for the complete Technical Form
View Documentation.
Documentation & Training Value
The physical documentation detailed above and also provided in the Appendix H and I
complement the demo meetings perfectly. We strived to address common functionality and critical
processes with descriptions that inform the users of both the front-end and back-end processes
involved with each function of the system. During our demo meetings, we provided walk-throughs
of weekly iterations of the system. This allowed us to convey how to navigate and utilize functions
within the system so that it is not foreign to them. However, not all users of this system were
present for these meetings due to time constraints and other priorities. For these individuals, the
physical documentation provided will serve as the learning materials for the system. Naturally,
Form 3: frmAddContacts Description: Adds a new contact to the contacts table. References: Two Queries:
qryGetNewContactID – Gets fresh contactID for use by incrementing the highest in Contacts
qryAddContacts - Populates information from frmAddContacts into Contacts
Key Variables:
inputAddContactsVendorID – Row source is a SQL list of the vendors in tblVendors. Control allows users to select a vendor
that the contact should be put under in the system. Resets all information on form after each update of VendorID. btnAddContact – On Click Action – When the user hits this button, the form is checked for any noticeable errors. The user is
prompted if not all required contact information is entered. If optional fields are not entered, the user can still submit but is
warned. The user is still asked to confirm if all fields are included. After confirmation, the query qryAddContacts is executed to populate the Contacts table
Suggested Improvements: Improved Error Checking – Checking for more incorrect values
Making some of the form properties less ambiguous to lower the chance of errors
Finding ways to lower the potential for accidental duplicate entries aside from message boxes
83
reading documentation is less valuable compared to a walk-though of the system by the developer.
We concluded that by providing precise documentation and a point of contact if an issue arises is
sufficient. Complementing the documentation detailed in this section, the storyboard in the
following section helps a user visualize the system as a whole.
Storyboard of Final Iteration
The final iteration of the VPRM system, upon handoff, is outlined in the storyboard below. The
functionalities that were originally proposed during the proposal presentation have all been
incorporated. From the initial storyboard developed in the first iteration, changes due to feedback
and recommendations during demo meetings have been implemented as the scope of the project
allows.

84
VPRM Main Menu
Figure 32 - Final VPRM Storyboard Main Menu
Figure 32 above showcases the main page of the dashboard used to access all functions within the
VPRM system. The functions are grouped in add, search and view options. The help menu for
Front-end user documentation is also accessible from this dashboard.

85
Add New Vendor
Figure 33 - Final VPRM Storyboard Add a New Vendor
Figure 33 above showcases the form in which users will use to add a new vendor to the database.
Users will be able to input pertinent vendor information such as vendor name, recruitment
capabilities and type of vendor.

86
Add New Contact Information
Figure 34 - Final VPRM Storyboard Add New Contact Information
Figure 34, shown above, illustrates the form in which is used to add new contact information for a
vendor. The required fields in this form are first name, last name, job title and email. These pieces
of information at needed for all vendor contacts, the remaining input options vary in availability on
a vendor by vendor basis.

87
Add a New Project
As seen in Figure 35 below, the form to add a new project allows the user to input a new project
that is linked to a client and community. The user is required to input all the fields shown in the
figure below except end on date and description.
Figure 35 - Final VPRM Storyboard Add a New Project

88
Add Vendor Tag
Figure 36 - Final VPRM Storyboard Add Vendor Tag
The “Add Vendor Tags” form shown in Figure 36 above allows the user to attach a new tag to a
vendor. This form blocks the ability for users to add the same tag to a vendor using back-end
coding.

89
Add New Type to Existing Vendor
Figure 37 - Final VPRM Storyboard Add New Type to Existing Vendor
Figure 37 above showcases a screenshot of the form that is used to attach a new type to an existing
vendor. This form is similar to the form to add a vendor tag. The user selects a vendor and then
selects a vendor type from the second dropdown menu. The system does not allow for duplicate
vendor types to be attached to a vendor.

90
Add Project Tags
Figure 38 - Final VPRM Storyboard Add Project Tags
Figure 38 above displays a screenshot of the form that attaches a project tag to a project. The user
is prompted to select a client and community to narrow down the project list. Then the user is able
to select a project and a tag that has not already been attached.

91
Add Vendor Project Performance Data
Figure 39 - Final VPRM Storyboard Add Vendor Project Performance Data
Figure 39 above showcases a screenshot of the form used to add vendor project performance data
to the VPRM system. The user uses dropdown menus to narrow down to a vendor. Then the user
inputs the data for that project and vendor into the system.

92
Search Project Performance by Vendor
Figure 40 - Final VPRM Storyboard Search Project Performance by Vendor
Figure 40 above showcases the form that is used to search for a vendor using tag filters. The user is
ultimately able to search a particular vendor using tag filters to narrow down the project list.After
the user inputs the vendor information and the tag filters, the user is then able to view specific
project metrics, shown in Figure 41 below.
Figure 41 - Final VPRM Storyboard View Vendor Performance by Project

93
Search Performance by Project
Figure 42 - Final VPRM Storyboard Search Performance by Project
Figure 42 above illustrates the functionality of the VPRM system that allows the user to search
performance by project. The user inputs information that narrows down to a project.
Upon searching for performance, the system brings the user to the report generated, illustrated
below in Figure 43. The user can view general information, basic metrics, advanced metrics,
project notes and average project performance.
Figure 43 - Final VPRM Storyboard View Vendor Project Performance

94
Search Vendors by Type
Figure 44 - Final VPRM Storyboard Search Vendor by Type
In Figure 44 above, users are able to search vendors by specifying a certain vendor type. This
allows the user to view vendor and contact information of the specified vendor. From this page,
there is a link on the top banner to quickly access the “Search performance by vendor” form.

95
Search Vendor by Tag
Figure 45 - Final VPRM Storyboard Search Vendor by Tag
In figure 45 above, the system allows users to select a tag to narrow down the selection of vendors.
Upon selection of a vendor, the user can view vendor and contact information. From this page,
there is a link on the top banner to quickly access the “Search performance by vendor” form.

96
View Vendor Project Performance
Figure 46 - Final VPRM Storyboard View Vendor Performance on Project
Figure 46 above showcases a screenshot of the form used to view vendor performance of a project.
The user first selects a client and community. This narrows down the available projects to select,
which narrows down the possible vendors to select. The user is then able to view the performance
metrics for each project based on the vendor selected.

97
View Vendor and Contact Information
Figure 47 - Final VPRM Storyboard Vendor Contact Information
Figure 47 above showcases a screenshot of the form used to search vendors for vendor information
and contact information. The user selects a vendor from the dropdown menu and then selects
contact information for that vendor.

98
View Project Information
Figure 48 - Final VPRM Storyboard Project Information
Figure 48 above illustrates the functionality of the VPRM system that allows a user to search for
project information. The user must input a client, community and project to pull information.
Significance of Storyboarding
Storyboards provide a brief description of each view within a system. In the case of the VPRM
system, the storyboard displays a static view of all functions and helps the user understand the flow
of information. Furthermore, storyboards complement user documentation and helps lower the
learning curve of a system. In the next section, we will discuss the mitigation strategy of issues that
may arise with the hand off and implementation of the VPRM system.

99
Contingency Plan
Unfortunately, we will not be able to collaborate with any system maintenance after the project is
finalized. We expect the documentation, training and migration plan to be resources where the
MIS team at Communispace can find answers for frequently asked questions or solve
possible questions that may arise after our departure. We strongly believe that the team at
Communispace has the skillset in-house to be able to solve any problem with the system,
either technical or usability, that they may encounter. The WPI Team also plans to be available
after the completion of the project by email or phone. We have added a contact sheet in Appendix
J.
System Specification
The software and hardware specifications for a successful implementation of the
prototype the project team developed are described in this section. This section will complement
the non-functional requirements gathered in Chapter 3 by linking the prototype of the Process
Documentation Repository to the existing system architecture at Communispace.
Architecture Report
After analyzing the system requirements for the prototype, the project team believes that a client-
server based architecture is the most practical for the future system since it is broadly utilized
at Communispace and it can be easily implemented.
We suggest that the server should host the data storage and the data access logic. We envision
the system as a tool that can be used by many users, and having the data stored in a server
facilitates that concept. The security of the data can be ensured through permissions to the server

100
for selected users. The data should only be accessed by employees of the MIS team at
Communispace. Any other users will be able to see the information pertinent to them on
Datapedia. The database should allow multiple users to search for data simultaneously, however
only one user should be editing a certain instance of an entity at once.
On the other hand, the client hosts the application and presentation logic. It makes the most
sense to have the client computer be the one performing the searches and communicating to the
server to extract the relevant data for the user. By hosting the presentation logic in the client
computer we are complementing the application logic, since it should be the client computer the
one to display to information on the users monitor.
Hardware and Software Specification
A SQL server containing key community, client, and contract information is currently in use by
Communispace. It is likely that the end system will require expanding or updating the SQL
database to include additional or even revised tables. The front-end of the system is restricted to
currently available technologies which includes Microsoft Access, Visual Basic, and AtTask. If
possible, the end system should pull information from AtTask to simplify updating.
No other hardware or software is needed to implement the system. Developers at
Communispace will only need to follow the documentation and implement the system in their
desired environment. Additionally, the client PCs for the MIS team at Communispace will require
access to the SQL server and possibly a dump of the data. Users of the system will need basic
access to the system as well through a front end utility such as Microsoft Access or Visio.

101
Implementation Conclusion
The implementation process wraps up with the hand off of the system. Due to time constraints,
some functionality that was deemed out of scope were not included in the final iteration
completed. Future iterations will be developed by the MIS team at Communispace to provide more
functionality within the system itself. As a whole, the VPRM system provided more than what
Communispace expected in terms of functionality and completeness upon hand off. Functionalities
that will be added to this system in the future include weighted views of performance metrics,
which can be considered a minor addition. The core functionality of the VPRM system originally
proposed prior to the first iteration has been all addressed. Functionalities that were added based
on feedback during demo meetings were addressed, though not all could be completed due to the
scope of our project, as well as the time constraints posed.
The next chapter, Recommendations & Conclusions, focuses on future improvements that can be
made to the VPRM system that were not addressed in the final iteration upon handoff. These
recommendations aim to improve the usability of the system by making minor edits such as layout
changes and error checking.

102
Chapter 6: Recommendations & Conclusions
In this final section, we discuss our recommendations for the final system based on our discussion and
analysis throughout this report. We also discuss some conclusions that we have drawn from the project
experience as a whole.
Recommendations
The following recommendations will provide the MIS team at Communispace with guidelines on
system specifications to implement the actual system based on the prototype the MQP team
built and an additional option to facilitate the comparison of the process flows. Below are some
key elements that we recommend be modified in subsequent iterations on the VPRM system. They
include error checking, ambiguity, accidental duplicates, editing controls and layout.
Error Checking
The VPRM system, as it stands upon hand off, still has error checking functionalities that have not
been completely implemented and built. One major error checking flaw in the system is that there
is no lockdown for phone numbers. The an issue that arises with this respect lies in that there are
several different formats for phone numbers depending on the country of origin. Furthermore,
human error is common when inputting data into a form. By having values that are automatically
determined to be an error, such as a negative number, would mitigate the risk of this sort of error.
Ambiguity
Some form properties and names may be seen as too ambiguous. Though these names were given
to us by the stakeholders, they may require tweaking to improve the learnability of the system in
the long term. By providing tool tips, ambiguous names can be further explained if needed.

103
Accidental Duplicates
An accidental duplicate entry into projects, vendors, or client tables is a current flaw in the VPRM
system. To address this issue, we recommend that in future iterations, a lockdown for duplicate
entries be created.
Editing Controls
Editing control issues arise when dealing with certain forms that require the lockdown of editing
capability. We recommend that forms that have editing capabilities include a form of
authentication so that no unauthorized changes are made in the system that may cause instability.
This authentication is recommended to be a simple username and password combination that is
shared amongst users. This will ensure that changes, if made, are done by users who completely
understand the VPRM system.
Layout
The current layout of the VPRM system provides the more functional views of each dashboard
item. Also, we limited each form to fit on the top fold of the screen. To do this, we rearranged
boxes in a manner that may impede workflow. It is recommended that, after testing, boxes be
rearranged to improve the user’s experience.
Conclusions & Reflections
A vendor performance management system is very important for Communispace’s business
model. The project team was given the opportunity to take on a challenging project related to
vendor management and dashboards at Communispace. It is a necessity to be able to manage and
process the flow of vendor data and information to remain competitive in the industry.

104
The project team was tasked with assisting the CORE sourcing team and the MIS team at
Communispace in their efforts to identify high impact, value added investments that clearly
align and support business priorities, and identify and quantify current business opportunities
that have clear efficiency payback, by documenting reporting processes consistently and
designing a tool that facilitated searching for data overlap and redundancies. During our initial
research for the feasibility analysis, the project team learned of many tools used for data storage
and analytics and of their core functionalities. Also, through extensive usage of the systems
analysis and design guidelines, we have become more familiar with the necessary steps to take
when introducing a new system to a company.
When we started this project we were excited to even have a project after a long and stressful
situation that unfolded throughout A Term with many different potential project sponsors. We first
set forth think we had a project set in stone but when that collapsed in front of us we were without
hope for a small portion of time. We then got lucky with Communispace, and we hope
Communispace got lucky with us.
Communispace welcomed us with open arms and high expectations. Day one of our project here at
Communispace we were introduced to so many wonderful employees who helped us understand
what Communispace provides to its customers and the wonderful values of the company. The
project needs were laid out in front of us from day one. We did do some digging but nothing was
hard to find or get at. Everyone was very accommodating for our interviews as well. The project
sponsors and stakeholders were extremely helpful and supportive through the process. For a letter
of acknowledgment, please refer to Appendix L. Communispace has been very grateful for our
effort.
Not only did we, as students, learn about the value of information and technology in the business
105
world but we also were able to learn about the corporate culture as well. Through interviews and
simple daily interactions, we met many employees from the company’s most critical
departments. Aside from asking them questions regarding our project, we are able to gain
additional insight into how a data and marketing based company operates and creates strategic
advantage over competitors.
In its entirety, the MQP project experience is a great learning experience. Although it is a chance to
obtain valuable work experience, apply theoretical concepts in a corporate environment, and also
expand professional networks. This project experience will assist the WPI project team with
success in future academic work and the professional world long after completion.

106
Appendices
Appendix A – Systems Request
Project Name: Membership Vendor & Performance Management (A.K.A MVP Management)
Project Sponsor: Communispace
Name: Laura Naylor Senior Vice President, Member Experience and Operations
Department: Community Operations & Recruitment Excellence (CORE)
Phone: THIS SECTION HAS BEEN REDACTED.
Business Need: This project was initiated to organize options for member recruitment, streamline
vendor selection and performance management processes by creating a database with a dashboard
where employees of Communispace can easily navigate through the vendors (both potential and
experienced) to find the best matches, as well as manage vendor metadata (contact info, etc.)
Business Requirements: Using a dashboard interface, employees will be able to sort through
vendors using common metrics and built in queries. The specific functionality of the system will
include:
Sort vendors by categories/tags THIS SECTION HAS BEEN REDACTED.
Report by community/client past performance (an MSC/Sourcing team member can simply run a
report that shows the past performance on the account they are reviewing (all stats for all vendors
that is provided in the standard summary sheet overall summary)
Report by community dimensions/attributes THIS SECTION HAS BEEN REDACTED.
Allow new records to be created and existing records to be edited.
Allow new category attributes/tags to be added.
Allow for a comment section with a Vendor in order to record a note.
Sort vendors by prioritized THIS SECTION HAS BEEN REDACTED. rolled up total averages and
total expenditure with date filters, and filterable by community dimensions.
Create customized reports on vendor data.
Include a user manual.
Include technical documentation including code commenting, and architecture map to allow for
future enhancements
Business Value: We expect that Communispace will save many hours of time by enabling the
CORE Group to utilize this vendor dashboard. We expect to save money by more efficiently
selecting which vendors to use on a project to project basis. We expect to save even more time by

107
creating a familiarity factor within the CORE Group members that use the vendor dashboard.
Better alignments of vendors to projects based on past performance factors will reduce time spent
on each recruiting event for both Sourcing and Member Service Consultants and reduce turnaround
times for clients. Easy access to vendor cost and performance stats will allow for stronger
negotiating positions and will surface quality/expectation issues while providing supporting data.
Furthermore, the organization of current vendors as well as potential vendors allows for
management of full options in a scalable manner, replacing the current reliance on individual
memory and recall. Centralizing vendor contact information and other metadata will allow for
more scalability and coverage. By saving hours of time with the vendor dashboard, we are able to
reduce future training costs.
Special Issues or Constraints:
Some of the knowledge needed to create this database of vendors in scattered throughout many
different sources, including files stored locally on computers and within certain employee’s
memory.
Integrity of data needs to be assessed before we can import from Excel into database.
To ensure adoption of the new system, data updating must be easy, quick and not require intrusive
processes – roles and automation level of this effort TBD

108
Appendix B – Communispace Notes:
Notes for Communispace Workday: 10/24/2012
THIS SECTION HAS BEEN REDACTED.

109
Appendix C – Vendor Types and Tags
Vendor Types:
THIS SECTION HAS BEEN REDACTED
Vendor Tags (Initial):
THIS SECTION HAS BEEN REDACTED

110
Appendix D – Tables
Project Sponsors and Stakeholders
Names Title, Department Project Role Responsibilities
Laura Naylor SVP – Member
Experience and
Operations
Project Sponsor Project Reporting
Provide high-level
requirements
Review status throughout
duration
Jack Bergersen CORE Operations
Manager,
Business Analysis
& Data
Automation
Project Sponsor Project Reporting
Review status throughout
duration
Assist with arranging
meetings with project
stakeholders
Verify Project Requirements
Follow-up on secondary
project objectives
David
Rosenberg
Director, Member
Services
Operations
Project Sponsor Project reporting
Provide high level
requirements
Review status throughout
duration of project
Sean Burke Business Data
Analyst
Project Assistant Provide information on
Communispace SQL Server
Architecture and Structure
Answer technical questions
Forward helpful
documentation or resources
Professor
Loiacono
WPI MQP Team
Advisor
Faculty Advisor to
project team Keep track of team progress
Provide guidance throughout
process
Review all deliverables
Haven Polk CORE Sourcing
Specialist
Sourcing Employee Provide information on
project summary
data sheets
Feedback on user interface
Michelle
Fisher
Senior Projects
Consultant
Employee, Member
Recruitment
Specialty
Provide information on
project summary data sheets
and member recruitment
process
Shiny
Kalapurakkel
CORE Traffic
Coordinator
Employee, AtTask
user Provide information on
vendor master sheet.

111
Act as reference for AtTask
questions
John Keeter Sourcing
Manager, Member
Services
Sourcing Employee Provide information on
vendor bid procedures
Advocate for additional
project goals and objectives
Feedback on User Interface
Mark
DiGiammarino
CORE Sourcing
Coordinator
Sourcing Employee Provide information on
project summary data sheets
Feedback on User Interface
Provide information on
newer recruiting avenues
Derek Carey,
Evan Doyle,
Dennis Leung
WPI MQP Team Project Managers,
Project Team Documentation of various
business processes
Create process flow diagrams
Build connections between
vendor summary data for
meta statistics
Develop user-friendly tool
for helping employees to
choose vendors.
Table 8 - Stakeholders List and Roles

112
Functional and Non-Functional Requirements
Table 9 - Functional and Non-Functional Requirements

113
Economic Feasibility Tables
Table 10 - WPI MQP Team Analysis
THIS SECTION HAS BEEN
REDACTED.
Table 11 - Outside Consultant Analysis
THIS SECTION HAS BEEN
REDACTED.
Table 12 - Internal Employee Analysis
THIS SECTION HAS BEEN
REDACTED.
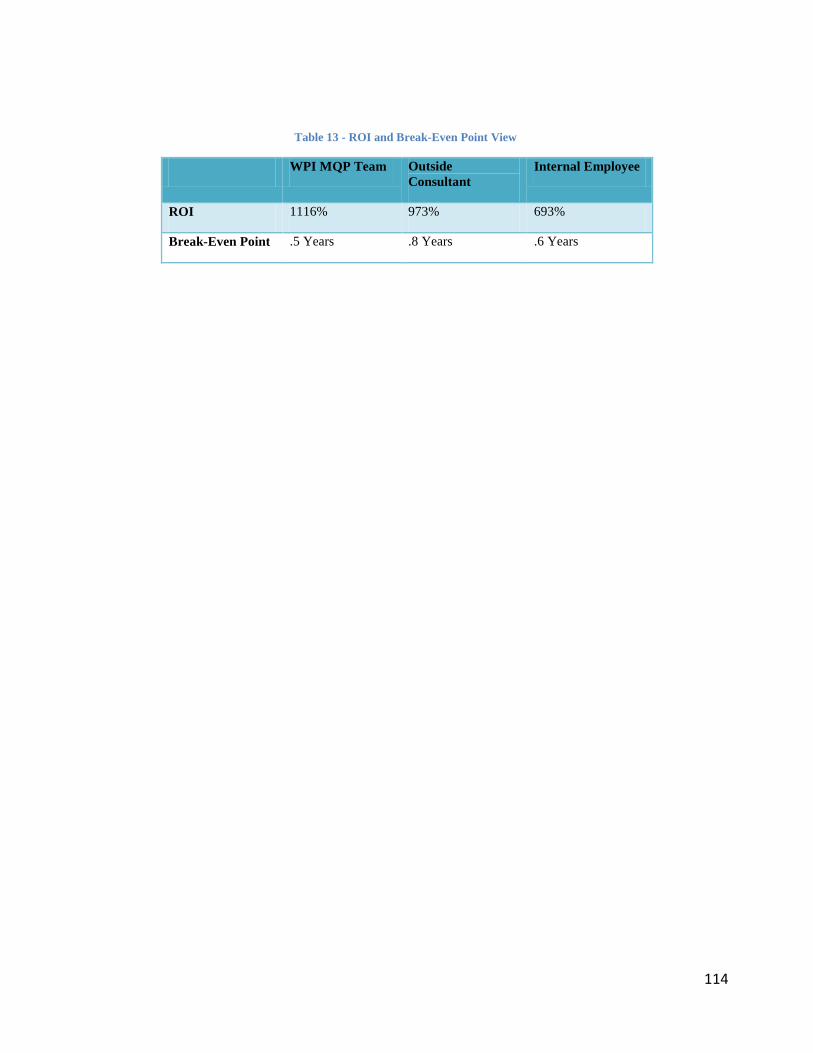
114
Table 13 - ROI and Break-Even Point View
WPI MQP Team Outside
Consultant
Internal Employee
ROI 1116% 973% 693%
Break-Even Point .5 Years .8 Years .6 Years

115
Appendix E – Detailed Individual Staffing Information
Derek Carey
Derek Carey is majoring in Management Information Systems and is minoring in
Computer Science. Courses taken include Business Data Management, IT Strategy and Policy,
and Systems Analysis and Design, which all provide technical skills in addition to understanding
of the systems development lifecycle. He has experience working with SQL, Visual Basic,
Microsoft Excel and Access, and the C programming language. Derek is employed by GE
Energy, working for Measurement and Control in the Boston center in Billerica Massachusetts.
His job responsibilities include acting as gatekeeper for GE Oil & Gas IT purchase requests,
acting as an administrator for the company’s MozyPro cloud backup solution among other
projects.
Evan Doyle
Evan Doyle is Management Information Systems major and a Computer Science minor.
Courses completed by Evan include Object Oriented Design Object, Human Computer
Interaction, and Data Analysis for Decision Making gives him the skills to efficiently design a
user interface for the dashboard and understand the underlying data structure. Evan is also
employed at Brookfield Renewable Energy Group, which operates one of the largest publically
traded, pure-play renewable platforms in the world. This experience has provided a real life
scenario for Evan to use his skillset that he has obtained through experiences at WPI.
Dennis Leung
Dennis Leung is Management Information Systems Major. He processes an
understanding of the systems development life cycle and how it applies to situations in the world
through the project based learning foundation at WPI. Not only has he experienced applications
of the SDLC, but also applications of SQL, Microsoft Excel and Microsoft Access. At his

116
internship during the Spring and Summer at Gallagher Koster Insurance, he worked with the IT
team using SQL to query databases and develop user interfaces and websites targeting college
students to educate them regarding insurance plans. With an understanding of human computer
interactions, Dennis provides value to this team, building on the MIS foundation.

117
Appendix F – Use Cases
Process 1
Use case name: Add a vendor to the VPRM System
Process ID: 1 Importance Level: High
Primary Actor: System Custodian
Short description: This use case describes how to store basic information on a new vendor.
Trigger: System custodian inputs new vendor into database
Type: External
Major Inputs Major Outputs
Description Source Description Source Vendor Identifiers SQL Database Vendor Table Stored Information System
Major Steps Performed Information for Steps
1. Input new vendor
1.1 Input vendor Unique Identifier based on
SQL Vendor Table
← SQL Database
1.2 Add supplemental vendor information
(City, state, desciption, recruitment
capabilities, type, status)
← Sourcing Specialist
1.3 Exit if complete ← Stored Information

118
Process 2
Use case name: Add New Contact
Process ID: 2 Importance Level: High
Primary Actor: System Custodian
Short description: This use case describes how to input new contact information into the
database.
Trigger: System custodian inputs new vendor into database
Type: External
Major Inputs Major Outputs
Description Source Description Source Contact Data Vendor Stored Information System
Major Steps Performed Information for Steps
1. Input contact data
1.1 Input fields for vendor information.
(Name, contact information, e-mail)
← Vendor
2. Input contact to Database
2.1 Add contact to database ← Sourcing Specialist
2.2 Exit if complete ← Stored Information

119
Process 3
Use case name: Add a new project to VPRM System
Process ID: 3 Importance Level: High
Primary Actor: System Custodian
Short description: This use case describes how to store information on a project in the database.
This enables the user to query the database specifically for vendor performance information.
Trigger: System custodian inputs new project into database
Type: External
Major Inputs Major Outputs
Description Source Description Source Vendor Summary Data Project Summary Sheet Stored Information System
Project Unique Identifier System Projects Table
Major Steps Performed Information for Steps
1. Input vendor metrics
1.1 Create record of new project in projects table
← Project Summary Sheet
1.2 Create new records in vendor performance
table based on imported data and
project/vendor unique identifiers
← Projects Table
← Vendors Table
← Project Summary Sheet
2.2 Exit if complete ← Stored Information

120
Process 4
Use case name: Attach a vendor tag to vendor in the VPRM System
Process ID: 4 Importance Level: High
Primary Actor: System Custodian
Short description: This use case describes how to add a vendor tag to a vendor. This allows users
to search vendors by tags.
Trigger: System custodian attaches a vendor tag to a vendor
Type: External
Major Inputs Major Outputs
Description Source Description Source Vendor Summary Data Project Summary Sheet Stored Information System
Vendor Tag Sourcing Specialist Vendor Unique Identifier System Vendors Table
Major Steps Performed Information for Steps
1. Input vendor metrics
1.1 Select vendor to attach a tag ← Vendor Table
1.2 Select a tag to add to vendor ← Tags Table
2. Attach tag to vendor
2.1 Add describing tag to vendor ← Sourcing Specialist
2.2 Exit if complete ← Stored Information

121
Process 5
Use case name: Attach a project tag to a project in the VPRM System
Process ID: 5 Importance Level: High
Primary Actor: System Custodian
Short description: This use case describes how to add a project tag to a project. This allows users
to search projects by tags.
Trigger: System custodian attaches a project tag to a project
Type: External
Major Inputs Major Outputs
Description Source Description Source Project Identifiers Projects Table Stored Information System
Project Tag Sourcing Specialist
Major Steps Performed Information for Steps
1. Specify project by inputting project information
1.1 Select a client from the dropdown ← Client Table
1.2 Select a community from the dropdown ← Community Table
1.3 Select the project in which the tag will be
assigned ← Projects Table
2. Attach tag to project 2.1 Add describing tag to project ← Tag Table 2.2 Exit if complete ← Stored Information

122
Process 6
Use case name: Input Project Performance Information in the VPRM System
Process ID: 6 Importance Level: High
Primary Actor: System Custodian
Short description: This use case describes how to add project performance information to the
VPRM system. This allows users to simply view project performance information.
Trigger: System custodian inputs project performance information.
Type: External
Major Inputs Major Outputs
Description Source Description Source Client Information Client Table Stored Information System
Community Information Community Table Project Information Projects Table Vendor Information Vendor Table Performance Metrics Project Summary Sheet
Major Steps Performed Information for Steps
1. Specify project by inputting project information
1.1 Select a client from the dropdown ← Client Table
1.2 Select a community from the dropdown ← Community Table
1.3 Select a project to input performance
metrics ← Projects Table
1.4 Select the vendor to input performance
metrics ← Vendor Table
2. Input Performance Metrics 2.1 Record performance metrics for each
vendor ← Project Summary Sheet
2.2 Exit if complete ← Stored Information

123
Process 7
Use case name: Search Project Performance by Vendor and Tag
Process ID: 7 Importance Level: High
Primary Actor: System Custodian
Short description: This use case describes how a user will search for project performance by
vendor and tag, allowing the user to filter through vendors by tags.
Trigger: System custodian searches for project performance by vendor and tag
Type: External
Major Inputs Major Outputs
Description Source Description Source Client Information Client Table Stored Information System
Community Information Community Table Project Information Projects Table Vendor Information Vendor Table Performance Metrics Project Summary Sheet
Major Steps Performed Information for Steps
1. Specify project by inputting project information
1.1 Select a vendor from the dropdown ← Vendor Table
2. View queried information 2.1 View information queried on a project and
tag ← Temporary Query Table
2.2 Exit if complete ← Stored Information

124
Process 8
Use case name: Search Vendor Performance by Project
Process ID: 8 Importance Level: High
Primary Actor: System Custodian
Short description: This use case describes how a user will be able to view vendor performance
by project.
Trigger: System custodian searches for vendor performance by project.
Type: External
Major Inputs Major Outputs
Description Source Description Source Client Information Client Table Stored Information System
Community Information Community Table Project Information Projects Table
Major Steps Performed Information for Steps
1. Specify project by inputting project information
1.1 Select a client from the dropdown ← Client Table
1.2 Select a community from the dropdown ← Community Table
1.3 Select a project to input performance
metrics ← Projects Table
2. View Performance Metrics 2.1 View performance metrics for each
vendor ← Project Summary Sheet
2.2 Exit if complete ← Stored Information

125
Process 9
Use case name: Search Vendor Performance by Vendor Type
Process ID: 9 Importance Level: High
Primary Actor: System Custodian
Short description: This use case describes how a user will be able to view vendor performance
by specific vendor types
Trigger: System custodian searches for vendor performance by vendor type.
Type: External
Major Inputs Major Outputs
Description Source Description Source Vendor Type Client Table Stored Information System
Vendor Name Community Table
Major Steps Performed Information for Steps
1. Specify project by inputting vendor and type of vendor
1.1 Select a vendor type ← Vendor Table
1.2 Select a vendor listed ← Community Table
2. View Performance Metrics 2.1 View performance metrics for vendor
selected ← Project Summary Sheet
2.2 Exit if complete ← Stored Information

126
Process 10
Use case name: Search Vendor Performance by Vendor Tag
Process ID: 10 Importance Level: High
Primary Actor: System Custodian
Short description: This use case describes how a user will be able to view vendor performance
by specific vendor tag
Trigger: System custodian searches for vendor performance by vendor tag.
Type: External
Major Inputs Major Outputs
Description Source Description Source Vendor Tag Tag Table Stored Information System
Additional Vendor Tag Tag Table Vendor Information Vendor Table
Major Steps Performed Information for Steps
1. Specify tag
1.1 Select a tag from the dropdown ← Tag Table
1.2 Select additional tag if needed ← Tag Table
1.3 Select a vendor from the dropdown ← Vendor Table
2. View Performance Metrics 2.1 View queried information on vendor
performance ← Project Summary Sheet
2.2 Exit if complete ← Stored Information

127
Process 11
Use case name: View Vendor Project Performance
Process ID: 8 Importance Level: High
Primary Actor: System Custodian
Short description: This use case describes how a user will be able to view vendor performance
by project.
Trigger: System custodian searches for vendor performance by project.
Type: External
Major Inputs Major Outputs
Description Source Description Source Client Information Client Table Stored Information System
Community Information Community Table Project Information Projects Table
Major Steps Performed Information for Steps
1. Specify project by inputting project information
1.1 Select a client from the dropdown ← Client Table
1.2 Select a community from the dropdown ← Community Table
1.3 Select a project to view project
information ← Projects Table
2. View Performance Metrics 2.1 View performance metrics for each
vendor ← Project Summary Sheet
2.2 Exit if complete ← Stored Information

128
Process 12
Use case name: View/Edit Project Information
Process ID: 9 Importance Level: High
Primary Actor: System Custodian
Short description: This use case describes how a user will be able to view project information, as
well as edit project information
Trigger: System custodian selects View and Edit Vendor Information Button
Type: External
Major Inputs Major Outputs
Description Source Description Source Project Name Vendor Table Stored Information System
Contract Name Project Table
Major Steps Performed Information for Steps
1. Specify project by inputting project information
1.1 Select a project from the dropdown ← Project Table
1.2 Select a contract from the dropdown ← Project Table
2. View/Edit information 2.1 View performance metrics for each
vendor ← Project Summary Sheet
2.3 Edit performance metrics for each vendor
if needed ← Project Summary Sheet
2.2 Exit if complete ← Stored Information

129
Process 13
Use case name: View/Edit Vendor Information
Process ID: 9 Importance Level: High
Primary Actor: System Custodian
Short description: This use case describes how a user will be able to view vendor information, as
well as edit vendor information
Trigger: System custodian selects View and Edit Vendor Information Button
Type: External
Major Inputs Major Outputs
Description Source Description Source Vendor Name Vendor Table Stored Information System
Contract Name Project Table
Major Steps Performed Information for Steps
1. Specify vendor by inputting vendor information
1.1 Select a vendor from the dropdown ← Vendor Table
1.2 Select a contract from the dropdown ← Project Table
2. View/Edit information 2.1 View performance metrics for each
vendor ← Project Summary Sheet
2.3 Edit performance metrics for each vendor
if needed ← Project Summary Sheet
2.2 Exit if complete ← Stored Information

130
Appendix G – Weekly Demo Meeting Minutes
Demo Meeting 1/16/2013
THIS SECTION HAS BEEN REDACTED.

131
Demo Meeting 1/23/2013
-THIS SECTION HAS BEEN REDACTED.

132
Demo Meeting 1/30/2013
THIS SECTION HAS BEEN REDACTED.

133
Demo Meeting 2/06/2013
THIS SECTION HAS BEEN REDACTED.

134
Demo Meeting 2/13/2013
THIS SECTION HAS BEEN REDACTED.

135
Appendix H - End-User Help Document
VPRM Main Menu
Figure 49 displays the main menu of the VPRM Tool. You can clearly see that the menu is
divided into four sections. The sections are Add New Information, this is for inputting data into
the database, View/Edit Information, this section is for viewing vendor or project information,
Performance Search, and this section allows the user to search through the vendors, project,
types, and tags. Finally in the bottom right quadrant there is the Help and Exit Program buttons.
Figure 49 - VPRM Help Document Main Menu

136
Add New Vendor
The Add New Vendor form within the VPRM Tool allows the user to input a new vendor into
the database. The user must enter in the Vendor Name and Vendor Type at a minimum, but a
secondary warning will ask the user to complete as many fields as possible. When the user is
finished he or she can click the “Add Vendor” button in the top right to complete the addition of
the vendor to the database. If the user would like to add tags to that vendor then he or she can
click the “Add Vendor Tags” button in the top right section of the form. There is also a “Go
Back to Menu” button in the top right.
Figure 50 - VPRM Help Document Add New Vendor

137
Add New Contact
In this form the user has the ability to look up a vendor form the first drop down menu. Once
that vendor is selected the form will automatically show the rest of the field in the form. These
fields will be empty; this is where the user enters the vendor contact information. To complete
the process the user clicks “Add Contact” in the top right of the form after the information has
been entered. The required fields are Contact First Name, Contact Last Name, Contact Job Title
and Contact Email. There is also a “Go Back to Menu” button in the top right. NOTE: the image
below is after the user has selected a vendor from the “Choose A Vendor” drop down menu.
Figure 51 - VPRM Help Document Add New Contact

138
Add New Project
In this form the user has the ability to add a new project into the database. The first field the user
sees is the “Select a Client:” drop down menu. From here the user can select any client within
the database. Once the client has been selected the user then sees the “Select a Community:”
drop down appear. In this drop down only the communities associated with that client will
appear. The user then selects the Community that he or she would like to add a project under.
Once this is done the input fields for a new project will appear. Out of these fields Project
Reference Number, Project Name, Project Start Date, and Project Status are the only required
fields. Once these fields have been completed at a minimum the user can add the project by
clicking the “Add Project” button in the top right of the form. There is also a “Go Back to
Menu” button in the top right.
Figure 52 - VPRM Help Document Add New Project
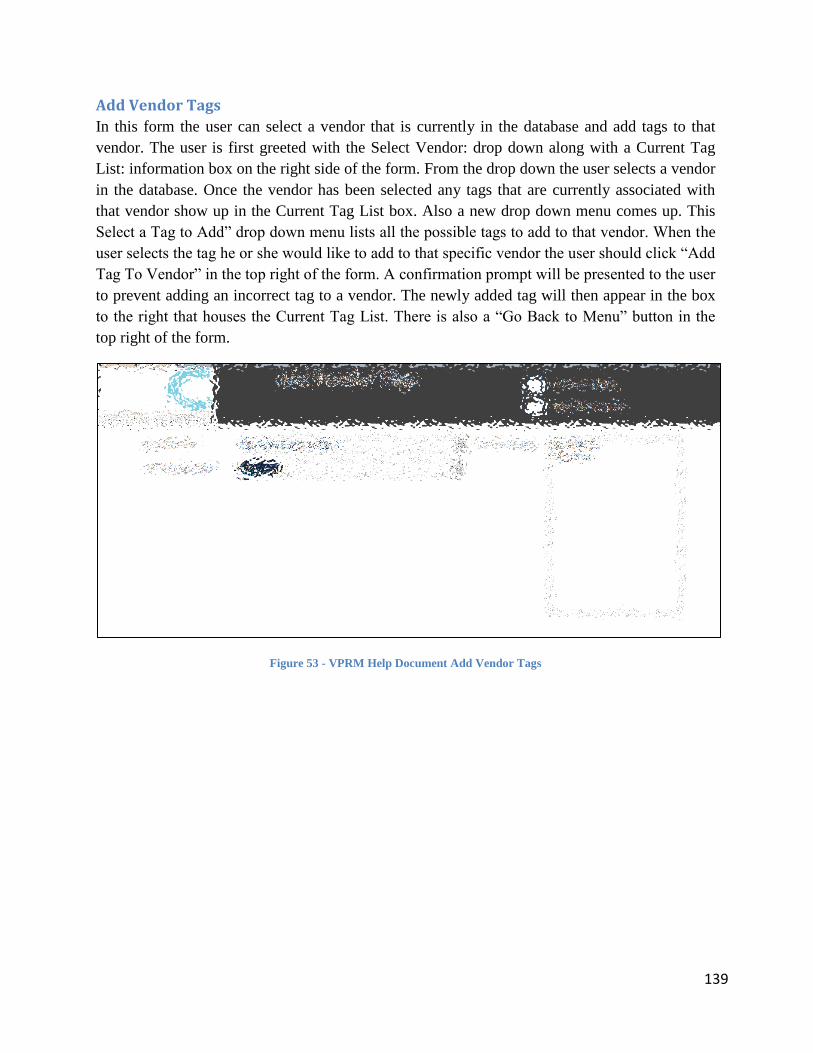
139
Add Vendor Tags
In this form the user can select a vendor that is currently in the database and add tags to that
vendor. The user is first greeted with the Select Vendor: drop down along with a Current Tag
List: information box on the right side of the form. From the drop down the user selects a vendor
in the database. Once the vendor has been selected any tags that are currently associated with
that vendor show up in the Current Tag List box. Also a new drop down menu comes up. This
Select a Tag to Add” drop down menu lists all the possible tags to add to that vendor. When the
user selects the tag he or she would like to add to that specific vendor the user should click “Add
Tag To Vendor” in the top right of the form. A confirmation prompt will be presented to the user
to prevent adding an incorrect tag to a vendor. The newly added tag will then appear in the box
to the right that houses the Current Tag List. There is also a “Go Back to Menu” button in the
top right of the form.
Figure 53 - VPRM Help Document Add Vendor Tags

140
Add New Type to Existing Vendor
In this form the user can add a new type to an already existing vendor. In the end this will create
a new vendor with the same name as the selected vendor, but with a different type. These same
vendors that can be multiple types are treated as separate entities for the purposes of the VPRM
Tool. Once the user selects the Vendor from the drop down another drop down arises, this one is
named “Type:” The user then selects the new type to add and when this is done a “Add Vendor”
button becomes live in the top right of the form. There is also an “Add Vendor Tags” button in
the top right for the situation where the user would like to tag the new vendor. It is important to
note that the user cannot add tags to the vendor until the vendor has been added. When the user
is ready to add the new vendor type he or she clicks the “Add Vendor” button in the top right.
This will be followed by a confirmation popup. Once this is confirmed the new vendor is added
to the database.
Figure 54 - VPRM Help Document Add New Type To Existing Vendor

141
Add Project Tags
This form allows the user to add certain tags to a certain project. The user first selects a client,
then a community within that client, then a project within that community. Once this is done the
user can add a tag to the project. The box on the right labeled “Project Tags:” shows the current
tags, if any, of the project. When the user has selected the tag he or she would like to add to the
project the user clicks “Add Tag to Project”. This will be followed by a confirmation prompt.
Once confirmed the tag will be added. You can see this in Figure 55. There is also a “Go Back to
Menu” button in the top right.
Figure 55 - VPRM Help Document Add Project Tags

142
Add Vendor Project Performance Data
This form allows the user to drill down to a certain project and add performance information for
a certain vendor on that project. The user first selects a client, then a community within that
client, then a project within that community. Once this is done the user can select a new vendor
to add to that project. When the vendor has been selected from the drop down all of the
performance data input fields appear. Here the user enters in the performance data, all of the
fields are mandatory besides Notes. When the user is ready to submit the data he or she will
click the “Submit Vendor Performance Form” button in the top section of the form. This will
once again bring up a confirmation prompt. Once confirmed, the data will be entered into the
database. The user can then select whether or not he or she would like to add more vendor
performance data for this project. If yes, then the form will reset to the point where the user has
to select a vendor for the specific project. There is a “Reset Form” button in the top right as well.
Along with this is the “Go Back to Menu” button.
Figure 56 - VPRM Help Document Add Vendor Project Performance Data

143
View Vendor Project Performance
This form allows the user to drill down to a certain project and view the performance metrics on
the vendor level. The user will select a Client from the drop down menu; only clients that have
projects will be shown in this list. Then the user will select a community within that client, then
a project within that community. Once the project has been selected a drop down menu with all
the vendors on that project will appear. The user then selects which vendor they want to view the
performance of on that project. With this the user can see tabs for General Information, Basic
Metrics, Advanced Metrics, and Project Notes for that vendor on that specific project. Figure 57
displays this well.
Figure 57 - VPRM Help Document View Vendor Project Performance

View Vendor and Contact Information
In this form the user can select a vendor and see the tags associated with that vendor, as well as the contacts associated with that
vendor. After the user selects the vendor the information will auto-populate. The basic information of the vendor will be displayed on
the left, the Contact Cards for the Vendor in the middle, and the Vendor Tags on the right. It is important to note the Total Project
field in the bottom right of the form. Also the Project Count Field on the tags, this shows how many times each tag has been used for
that vendor. You will also see the “Go Back to Menu” button on the top of the form.
Figure 58 - VPRM Help Document View Vendor and Contact Information

145
View Project Information
This form allows the user to view basic information about a project. The user selects a client,
then a community within that client, then a project within that community. The information for
that project will then be displayed as you can see in Figure 59. The Project Tags for that project
will also be displayed. You can also see the “Go Back to Menu” button on the top right of the
form.
Figure 59 - VPRM Help Document View Project Information

Search Project Performance By Vendor And Tag
This search form allows the user to search for performance by a vendor and then the tags that are associated with that vendor. The user selects
a vendor then the optional fields of selecting tags will appear. The user can search by up to three tags but as little as zero. The second drop
down, named “Tag Filter 1 (Optional):” will only show tags that have been associated with the vendor selected above. If the user selects a tag
in filter 1 then a “Tag Filter 2 (Optional):” will only show tags for that vendor that are also associated with the tag in Filter 1. Figure 60
shows this.
Figure 60 - VPRM Help Document Search Project Performance By Vendor and Tag 1
Once these have been selected the user clicks “Search Performance” and this will bring the user to a list of projects that use that vendor and
have those tags associated with it. In this view the user can see that tabs General Information, Basic Metrics, Advanced Metrics, and Project
Notes. The user can also see Average Project Performance on the right side. There are “Reset Form, Exit Program, and Go Back to Menu”
buttons on the top of the form.

Figure 61 - VPRM Help Document Search Project Performance By Vendor and Tag 2

148
Search Vendor Performance By Project
This form allows the user to search by a specific client’s project. The user selects a client, then a
community within that client, and then a project within that community. Once this is down the
user sees a “Search Performance” button appear below the “Go Back to Menu” button on the top
of the form. Figure 62 shows the form before the “Search Performance” button is clicked.
Figure 62 - VPRM Help Document Search Vendor Performance By Project 1
After the search is performed the user is presented with drop down menu of which vendors were
used on that project. Then the user can select a vendor and see the information pertaining to that
vendor’s performance on that project. This is displayed in Figure 63.
Figure 63 - VPRM Help Document Search Vendor Performance By Project 2
Search Vendors By Type
This form allows the user to select a type on the first drop down. From this selected type the second drop down will show all the vendors that
have been assigned that type and count of the projects they have worked on. When the user selects the vendor the basic information, contact
cards, and vendor tags will populate. There will also be a button on the top of the form that allows the user to search this vendor’s
performance fright from this screen. There is also a “Reset Form” button and a “Go Back to Menu” button on the top of the form.
Figure 64 - VPRM Help Document Search Vendors By Type

Search Vendors By Tag
This form allows the user to search for a vendor by tags. The user selects a tag and then another drop down menu will appear that will allow
the user to select a vendor based on the tag selected before. There is also another drop down to select a second tag, this is optional. Figure 65
shows the screen after a vendor has been selected. You have basic information on left, contact information in the middle and vendor tags and
project count on right. At the top of the form you have the buttons “Search Performance by Vendor”, “Reset Form”, and “Go Back to Menu.”
Figure 65 - VPRM Help Document Search Vendors By Tag

151
Appendix I - Technical Form Breakdown Documentation
Form 1: VPRMS Dashboard
Description: Main dashboard of the VPRMS system. Contains links to all first level forms.
Form 2: frmAddVendor
Description: Adds a new vendor to the tblVendors table.
References: Two Queries:
qryGetNewVendorID – Gets a fresh vendorID for use by incrementing the highest in tblVendors.
qryAddVendor - Populates information from frmAddVendor into tblVendors.
Key Form Controls & Variables:
InputAddVendorVendorID – Has NewVendorID as a control source taken from
qryGetNewVendorID.
btnAddVendor – On Click Action – When the user hits this button, the form is checked for any
noticeable errors. The user is prompted if not all required vendor information is entered. If optional
fields are not entered, the user can still submit but is warned. The user is still asked to confirm if all
fields are included. After confirmation, the query qryAddVendor is executed to populate the
tblVendors table.
Suggested Improvements:
Improved Error Checking – Checking for more incorrect values, especially on the phone number
Making some of the form properties less ambiguous to lower the chance of errors
Finding ways to lower the potential for accidental duplicate entries aside from message boxes
Form 3: frmAddContacts
Description: Adds a new contact to the contacts table.
References: Two Queries:
qryGetNewContactID – Gets fresh contactID for use by incrementing the highest in Contacts
qryAddContacts - Populates information from frmAddContacts into Contacts
Key Variables:

152
inputAddContactsVendorID – Row source is a SQL list of the vendors in tblVendors. Control
allows users to select a vendor that the contact should be put under in the system. Resets all
information on form after each update of VendorID.
btnAddContact – On Click Action – When the user hits this button, the form is checked for any
noticeable errors. The user is prompted if not all required contact information is entered. If optional
fields are not entered, the user can still submit but is warned. The user is still asked to confirm if all
fields are included. After confirmation, the query qryAddContacts is executed to populate the
Contacts table
Suggested Improvements:
Improved Error Checking – Checking for more incorrect values
Making some of the form properties less ambiguous to lower the chance of errors
Finding ways to lower the potential for accidental duplicate entries aside from message boxes
Form 4: frmAddProjects
Description: Adds a new project to the tblProjects table.
References: One Query:
qryAddProjects - Populates information from frmAddProjects into tblProjects
Key Variables:
btnAddProject – On Click Action – When the user hits this button, the form is checked for any
noticeable errors. The user is prompted if not all required project information is entered. If optional
fields are not entered, the user can still submit but is warned. The user is still asked to confirm if all
fields are included. After confirmation, the query qryAddProjects is executed to populate the
tblProjects table.
inputAddProjectsClient – Row source is a SQL list of the clients in the Clients table. Control allows
users to select a client to find communities. Resets all information on form after each update .
inputAddProjectsGUID – Row source is a SQL list of the communities in the Communities table
filtered by only those under the specified project from inputAddProjectsClient. Control allows users
to select a community to find projects. Resets all information on form after each update.
Suggested Improvements:
Improved Error Checking – Checking for more incorrect values
Making some of the form properties less ambiguous to lower the chance of errors

153
Finding ways to lower the potential for accidental duplicate entries aside from message boxes
Form 5: frmAddVendorTag
Description: Users can specify a vendor and choose from a list of tags to add to that vendor.
References: One Query:
qryAddVendorTag - Populates information from frmAddVendorTag into tblVendorTags.
Key Variables:
inputAddVendorTagVendorID – Row source is a SQL list of all vendors (including each type
instance) in the tblVendors table. Control allows users to select a vendor. The control updates row
source of inputAddvendorTagTags to include only tags that have yet to be attributed to a vendor.
The control also after-updates lstAddVendorTagTag to include a list of all tags currently attributed
to the specified vendor. Resets following form properties on change as well.
inputAddVendorTagTag – Row source is a SQL list of all tags currently not attributed to the vendor
specified from inputAddVendorTagVendorID.
inputAddVendorTag On Click Action – When the user hits this button, the user is prompted
whether they would like to confirm the adding of the new tag. After confirmation, the query
qryAddVendorTag is executed to populate the tblVendorTags table. Regardless of response, the
form will tell the user if data has or has not been submitted and lstAddVendorTagTag is updated to
demonstrate this.
Suggested Improvements:
Improved Error Checking – Form rejects a Null tag but will still give the user a message box saying
data has been entered
Form 6: frmCopyVendor
Description: Users can specify a vendor and choose from of vendor types. When the user submits
the form, a replicate entry for that vendor with the new type is created.
References: Three Queries
qryGetNewVendorID – Gets a fresh vendorID for use by incrementing the highest in tblVendors.
qryAddVendorTypeFromCopy - Populates information from qryCopyVendor into tblVendors.
qryCopyVendor – Takes Vendor provided from frmCopyVendor and creates a copy of all generic
fields for use by qryAddVendorTypeFromCopy in copying a vendor with a new type.
Key Variables:

154
inputCopyVendorVendorID – Has NewVendorID as a control source taken from
qryGetNewVendorID.
inputCopyVendorVendor - Row source is a SQL generated list of all vendors in the tblVendors
table. Includes all type variants of vendors.
inputCopyVendorType – Row Source is a SQL generated list of all vendor types in the
tblVendorTypeList table.
inputCopyVendor – On click, user is prompted to confirm adding of duplicate vendor with new
vendor type. Upon confirmation, the tblVendors table is updated through the qryCopyVendor and
qryAddVendorTypeFromCopy queries.
Suggested Improvements:
Improved Error Checking – Need a way of eliminating the ability for a user to submit duplicate
records of the same vendor and type. Also need to address possibility of Null type submissions.
Form 7: frmAddProjectTags
Description: Users can specify a project and a list of non-attributed tags. When the user submits the
form, a the selected tag is attributed to the selected project.
References: One Query
qryAddProjectTag - Populates information from frmAddProjectTags into tblProjectTags.
Key Variables:
inputAddProjectTagsClient – Row source is a SQL generated list of all clients with communities
and projects in the system. On update, the control updates the row source of
inputAddProjectTagsCommunity with a list specific to the chosen client.
inputAddProjectTagsCommunity – Row source is a SQL generated list of all communities under the
client specified in inputAddProjectTagsClient. On update, the control updates the row source of
inputAddProjectTagsProject with a list specific to the chosen community.
inputAddProjectTagsProject - Row source is a SQL generated list of all Projects under the
community specified in inputAddProjectTagsCommunity. On update, the control updates the row
source of inputAddProjectTagsTag with a list specific to the chosen Project.
inputAddProjectTagsTag – Row source is a SQL generated list of all tags not currently attributed to
the specified project from inputAddProjectTagsProject.
inputAddProjectTag - When the user hits this button, the user is prompted whether they would like
to confirm the adding of the new tag. After confirmation, the query qryAddProjoectTag is executed
to populate the tblProjectTags table. Regardless of response, the form will tell the user if data has or

155
has not been submitted and lstAddProjectTagTag is updated to demonstrate this.
Suggested Improvements:
Improved Error Checking – Form rejects a Null tag but will still give the user a message box saying
data has been entered
Form 8: frmInputVendorPerformance
Description: Users can specify a project and vendor combination in order to enter performance
information for that relationship. Any values of -1 are treated as Null.
References: One Query
qryAddProjectPerformance – Populates information from frmInputVendorPerformance into the
tblVendorPerformance table.
Key Variables:
inputAddVendorPerformanceClient – Row source is a SQL generated list of all clients with
communities and projects in the system. On update, the control updates the row source of
inputAddVendorPerformanceCommunity with a list specific to the chosen client.
inputAddVendorPerformanceCommunity– Row source is a SQL generated list of all communities
under the client specified in inputAddVendorPerformanceClient. On update, the control updates the
row source of inputAddVendorPerformanceProject with a list specific to the chosen community.
inputAddVendorPerformanceProject - Row source is a SQL generated list of all Projects under the
community specified in inputAddVendorPerformanceCommunity. On update, the control updates
the row source of inputAddVendorPerformanceVendor with only vendors that are not yet associated
with that project.
inputAddVendorPerformanceVendor – Row source is a SQL generated list of all vendors not yet
associated with the project specified in inputAddVendorPerformanceProject. On update, the form
allows for entering of the remaining form metrics.
btnSubmitInputVendorPerformanceForm - When the user hits this button, form is checked to make
sure no values are left blank. The form does not allow Null values or values less than 0. The
exception is -1 which is treated as a “Null value” for the purpose of letting users purposely exclude
non-relevant metrics. If error checking passes, the user is prompted whether they would like to
confirm the adding of the performance information. After confirmation, the query
qryAddProjectPerformance is executed to populate the tblVendorPerformance table. Regardless of
response, the form will tell the user if data has or has not been submitted. Users will be asked if they
want to add more performance information on a project or reset the form completely.
Suggested Improvements:

156
Improved Error Checking – The form still allows users to submit entries containing null values. A
fix has not been found yet.
Form 9: frmViewAndEditVendorPerformance
Description: Users can select a project and a vendor and view project performance information
related to how that vendor did on that project.
References: One Subform
frmVendorPerformanceDetails – Used by several forms including
frmViewAndEditVendorPerformance to display performance information taken from a filtered
view of tblVendorPerformance.
Key Variables:
inputViewVendorPerformanceClient – Row source is a SQL generated list of all clients with
communities and projects in the system. On update, the control updates the row source of
inputViewVendorPerformanceCommunity with a list specific to the chosen client.
inputViewVendorPerformanceCommunity– Row source is a SQL generated list of all communities
under the client specified in inputViewVendorPerformanceClient. On update, the control updates
the row source of inputViewVendorPerformanceProjectwith a list specific to the chosen
community.
inputViewVendorPerformanceProject- Row source is a SQL generated list of all Projects under the
community specified in inputAddVendorPerformanceCommunity. On update, the control updates
the row source of inputViewVendorPerformanceVendor with only vendors that are not yet
associated with that project.
inputViewVendorPerformanceVendor– Row source is a SQL generated list of all vendors not yet
associated with the project specified in inputAddVendorPerformanceProject. On update, the form
allows for entering of the remaining form metrics.
btnSubmitInputVendorPerformanceForm - When the user hits this button, the row source for
frmVendorPerformanceDetails is updated to that of the entry in the tblVendorPerformance table
matching both the project and vendor specified in inputViewVendorPerformanceProject and
inputViewVendorPerformanceVendor.
Suggested Improvements:
Editing Controls – The form currently has editing locked down. How this is controlled has been
suggested before with some sort of authentication but has not been implemented yet.
Form 10: frmViewVendorInfoAndContacts
Description: Users can select a project and a vendor and view project performance information

157
related to how that vendor did on that project.
References: Two Subforms
frmContactInfoSubform - When updated, this form contains all information relevant to a specific
contact from Contacts.
frmVendorInfoSubform – When updated, this form contains all information relevant to a specific
vendor from tblVendors.
Key Variables:
inputViewVendorInfoAndContactsVendorID – Row source is a SQL statement of all vendors.
When updated, frmVendorInfoSubform’s record source is updated to show all vendor information
related to the specified vendor.
inputViewVendorInfoAndContactsContactID - Row source is a SQL statement of all vendors.
When updated, frmContactInfoSubform’s record source is updated to show all vendor information
related to the specified vendor.
Suggested Improvements:
Editing Controls – The form currently has editing locked down. How this is controlled has been
suggested before with some sort of authentication but has not been implemented yet.
Layout and Presentation – May not be an efficient layout depending on the screen size.
Form 11: frmViewProjectInfo
Description: Users can select a project view project information.
References: One Subform
frmProjectInfoSubform – When updated, this form contains all information relevant to a specific
project from tblProjects.
Key Variables:
inputViewProjectInfoClient - Row source is a SQL generated list of all clients with communities
and projects in the system. On update, the control updates the row source of
inputViewProjectInfoCommunity with a list specific to the chosen client.
inputViewProjectInfoCommunity - Row source is a SQL generated list of all communities under the
client specified in inputViewProjectInfoClient. On update, the control updates the row source of
inputViewProjectInfoCommunity a list specific to the chosen community.
inputViewProjectInfoProject - Row source is a SQL generated list of all Projects under the

158
community specified in inputViewProjectInfoCommunity. On update, frmProjectInfoSubform
record source is updated to show all project information related to the specified project.
Suggested Improvements:
Editing Controls – The form currently has editing locked down. How this is controlled has been
suggested before with some sort of authentication but has not been implemented yet.
Layout and Presentation – May not be an efficient layout depending on the screen size.
Form 12: frmVendorSearch
Description: Users can select a vendor and a list of tags in order to search for aggregate and project
specific performance information matching that vendor and the tagging criteria.
References: One form – Seven Queries
frmVendorSearchWithTagsResults – Form that is opened after user clicks on the search button for
the form.
qrySearchVendorNoTags – Searches for all projects on a given vendor where no tag filters are
provided. Search results stored in the tblTempSearchStorage table.
qrySearchVendorOneTag - Searches for all projects on a given vendor where one tag filter is
provided. Search results stored in the tblTempSearchStorage table.
qrySearchVendorTwoTags - Searches for all projects on a given vendor where two tag filters are
provided. Search results stored in the tblTempSearchStorage table.
qrySearchVendorThreeTags - Searches for all projects on a given vendor where three tag filters are
provided. Search results stored in the tblTempSearchStorage table.
tempTable-Delete – Deletes the entirety of tblTempSearchStorage in order for one of the search
queries to accurately perform a new performance search.
qryDelTblAverage – Deletes the entirety of tblAverage in order for qryAverage to accurately
perform a new calculation for the latest search.
qryAverage – Averages the calculated fields being stored in tblTempSearchStorage for display on
frmVendorSearchWithTagsResults.
Key Variables:
inputSearchByVendorVendorID – Row source is a SQL list of all vendors that have any projects
under them. Updates inputSearchByVendorTag1’s row source after update and will make
qrySearchVendorNoTags the new search query used.
159
inputSearchByVendorTag1 – Row source is a SQL list of all tags for a given vendor where there is
at least one project matching that tag and the vendor. Updates inputSearchByVendorTag2 row
source after update and will make qrySearchVendorOneTag the new search query used.
inputSearchByVendorTag2 - Row source is a SQL list of all tags for a given vendor where there is
at least one project matching inputSearchByVendorTag1, the newly specified tag, and the vendor.
Updates inputSearchByVendorTag3 row source after update and will make
qrySearchVendorTwoTags the new search query used.
inputSearchByVendorTag3 - - Row source is a SQL list of all tags for a given vendor where there is
at least one project matching inputSearchByVendorTag1, inputSearchByVendorTag1, the newly
specified tag, and the vendor. Updates will make qrySearchVendorTwoTags the new search query
used.
VendorSearch1 – Runs one of the four search queries depending on what the user searches by in the
form to alter the tblTempSearchStorage table. The qryAverage query is also run and the form
frmVendorSearchWithTagsResults is opened.
Suggested Improvements:
Workflow/Search Structure – Separating the search and results into two different forms may not be
ideal. It may be better to keep the workflow and results on one continuous form to make searching
quicker and less of a hassle
Form 13: frmVendorSearchWithTagsResults
Description: Users can view results of the search conducted from frmVendorSearch on a aggregate
and project level.
References: Two subforms
frmPerformanceDetailsSubform – Form displays project performance on the various projects a
vendor has performed on matching search criteria. This form is updated as users scroll through the
project list from tblTempSearchStorage
frmPerformanceAverageSubform – Form displays average project performance of a vendor on
search criteria. This form’s values are influenced by the tblAverage table.
Key Variables:
inputVendorSearchWithTagsResultsProject – Row source is a SQL list of all projects in the
tblTempSearchStorage table reflecting a match on the search criteria. On update, the
frmVendorPerformanceDetails is displayed with an updated record source specific to that project.
Suggested Improvements:
Layout and Presentation – May not be an efficient layout depending on the screen size.

160
Form 14: frmSearchVendorsByProject
Description: Users select one specific project from a list of all projects with some performance
information. When users click the search button, they are directed to another form containing
vendor performance for all vendors on that given project.
References: One form – Four Queries
frmProjectSearchWithTagsResults – Form containing the results of the search performed by the
user in frmSearchVenorsByProject
qrySearchProjectNoTags – Searches for all vendors and their project performance on one specific
project.
tempTable-Delete – Deletes the entirety of tblTempSearchStorage in order for one of the search
queries to accurately perform a new performance search.
qryDelTblAverage – Deletes the entirety of tblAverage in order for qryAverage to accurately
perform a new calculation for the latest search.
qryAverage – Averages the calculated fields being stored in tblTempSearchStorage for display on
frmVendorSearchWithTagsResults.
Key Variables:
inputSearchVendorsByProjectClient - Row source is a SQL generated list of all clients with
communities and projects in the system with performance information. On update, the control
updates the row source of inputViewProjectInfoCommunity with a list specific to the chosen client.
inputSearchVendorsByProjectCommunity - Row source is a SQL generated list of all communities
under the client specified in inputSearchVendorsByProjectClient. On update, the control updates the
row source of inputSearchVendorsByProjectProject to a list specific to the chosen community.
inputSearchVendorsByProjectProject - Row source is a SQL generated list of all Projects under the
community specified in inputSearchVendorsByProjectCommunity.
btnSearchVendorsByProject - Runs the search query qrySearchProjectNoTags and also
qryAverage to populate the tblTempSearchStorage and tblAverage tables with search results. This
control also opens the frmProjectSearchWithTagsResults form with the results.
Workflow/Search Structure – Separating the search and results into two different forms may not be
ideal. It may be better to keep the workflow and results on one continuous form to make searching
quicker and less of a hassle.

161
Form 15: frmProjectSearchWithTagsResults
References: Two subforms
frmPerformanceDetailsSubform – Form displays project performance on the various vendors a that
performed on the project matching search criteria. This form is updated as users scroll through the
vendor list from tblTempSearchStorage
frmPerformanceAverageSubform – Form displays average vendor performance on a project
specified from the search criteria. This form’s values are influenced by the tblAverage table.
Key Variables:
inputSearchPerformanceByProjectVendor - Row source is a SQL list of all vendors in the
tblTempSearchStorage table reflecting a match on the search criteria. On update, the
frmVendorPerformanceDetails is displayed with an updated record source specific to that vendor.
Suggested Improvements:
Layout and Presentation – May not be an efficient layout depending on the screen size.
Form 16: frmSearchVendorsByTypeAndTag
Description: Users can select a type and view vendors and their contacts that match that criteria.
The form also displays a list of tags with a project count for those vendors.
References: Two Subforms – Two Queries
frmContactInfoSubform - When updated, this form contains all information relevant to a specific
contact from Contacts.
FrmVendorInfoSubform – When updated, this form contains all information relevant to a specific
vendor from tblVendors.
qrySearchVendorByTypeCountProjects – Counts the number of projects that a vendor has
participated in. A union is created with qrySearchVendorByTypeGetRemaining to get a full list of
vendor tags with accurate project counts.
qrySearchVendorByTypeGetRemaining – Used to get tags attributed to a vendor where no projects
have been performed. Combined with qrySearchVendorByTypeCountProjects to get accurate tag
listing.
Key Variables:
inputSearchVendorsByTypeAndTagVendorType– Row source is a SQL statement of all vendor

162
types. When updated, inputSearchVendorsByTypeAndTagVendorID is updated with vendors
matching that tag.
inputSearchVendorsByTypeAndTagVendorID– Row source is a SQL statement of all vendors.
When updated, frmVendorInfoSubform’s record source is updated to show all vendor information
related to the specified vendor. Also updates tag lists to reflect tags attributable to the specific
vendor.
inputSearchVendorsByTypeAndTagContactID- Row source is a SQL statement of all vendors.
When updated, frmContactInfoSubform’s record source is updated to show all vendor information
related to the specified vendor.
Suggested Improvements:
Layout and Presentation – May not be an efficient layout depending on the screen size.
Form 17: frmSearchVendorsByTag
Description: Users can select up to three tags to filter by and view vendors and their contacts that
match that criteria. The form also displays a list of tags with a project count for those vendors.
References: Two Subforms – Two Queries
frmContactInfoSubform - When updated, this form contains all information relevant to a specific
contact from Contacts.
FrmVendorInfoSubform – When updated, this form contains all information relevant to a specific
vendor from tblVendors.
qrySearchVendorByTagCountProjects – Counts the number of projects that a vendor has
participated in. A union is created with qrySearchVendorByTagGetRemaining to get a full list of
vendor tags with accurate project counts.
qrySearchVendorByTagGetRemaining – Used to get tags attributed to a vendor where no projects
have been performed. Combined with qrySearchVendorByTagCountProjects to get accurate tag
listing.
Key Variables:
inputSearchVendorsByTagTag1 - Row source is a SQL statement of all vendor tags attributed to
some vendor. When updated, inputSearchVendorsByTagVendorID is updated with vendors
matching that tag.
inputSearchVendorsByTagTag2 - Row source is a SQL statement of all vendor tags attributed to
some vendor that also have the tag specified in inputSearchVendorsByTagTag1. When updated,
inputSearchVendorsByTagVendorID is updated with vendors matching that tag.

163
inputSearchVendorsByTagTag3 - - Row source is a SQL statement of all vendor tags attributed to
some vendor that also have the tags specified in inputSearchVendorsByTagTag1 and
inputSearchVendorsByTagTag2. When updated, inputSearchVendorsByTagVendorID is updated
with vendors matching that tag.
inputSearchVendorsByTagVendorID - Row source is a SQL statement of all vendors. When
updated, frmVendorInfoSubform’s record source is updated to show all vendor information related
to the specified vendor. Also updates tag lists to reflect tags attributable to the specific vendor.
inputSearchVendorsByTagContactID - Row source is a SQL statement of all vendors. When
updated, frmContactInfoSubform’s record source is updated to show all vendor information related
to the specified vendor.
Suggested Improvements:
Layout and Presentation – May not be an efficient layout depending on the screen size.

164
Appendix J – Contact Information
Derek Carey
THIS SECTION HAS BEEN REDACTED.
Evan Doyle
THIS SECTION HAS BEEN REDACTED.
Dennis Leung
THIS SECTION HAS BEEN REDACTED.

165
Appendix K – MQP Meeting Minutes – With Professor Loiacono
MQP Agenda: 10/25/2012
Time: 1:30 PM – 2:30 PM
Meeting Attendees:
Derek Carey
Evan Doyle
Professor Loiacono
Dennis Leung
• Project background
• Overview of Activities from Communispace visit on 10/24/2012
• Employee Interviews
• Required WPI/Communispace Paperwork
• MQP Paper
Action Items for Next Meeting:
• Start MQP Paper (Sections: Introduction, Project Overview, LIT Review, and Project

166
MQP Agenda: 10/30/2012
Time: 11:00 AM – 12:00 PM 10/30/2012
Meeting Attendees:
Derek Carey
Evan Doyle
Professor Loiacono
Dennis Leung
Old Business:
Project background
Overview of Activities from Communispace visit on 10/24/2012
Employee Interviews
Required WPI/Communispace Paperwork
MQP Paper
New Business:
Agenda for Wednesday Communispace Trip:
o Activity: Short Write-up of Project Scope and Goals from our current perspective
o Pull documents to analyze As-Is system (Look for Diagrams)
o More interviews to be arranged by Jack
Action Items for Next Meeting:
MQP Draft #1 to include initial work on:
o Intro
o Problem Statement
o Goals & Objectives
o Lit Review
o Methodology
o Alternatives
o Meeting Minutes
To submit by Thursday (The regularly scheduled date for updating paper)

167
MQP Agenda: 11/06/2012
Time: 11:00 AM 11/06/2012
Meeting Attendees:
Derek Carey
Evan Doyle
Professor Loiacono
Dennis Leung
Old Business:
Project background
Overview of Activities from Communispace visit on 10/31/2012
MQP Draft #1 to include initial work on
o Intro (Drafted)
o Problem Statement (Drafted)
o Stakeholders (Drafted)
o Project Plan (Progressing)
o Goals & Objectives (Progressing)
o Lit Review (Progressing)
o Methodology (Progressing)
o Alternatives
New Business:
Discussion with Laura Naylor regarding Scope
Employee Interviews o Marcia- At Task (Gantt Chart/Task Tracking)
o Michelle- Excel Spreadsheets
Agenda for Wednesday Communispace Trip:
o Continue MQP Draft #1
o Pull documents to analyze As-Is system (Look for Diagrams)
o More interviews to be arranged by Jack
Proposal Date?
Low-Fidelity Prototyping
Action Items for Next Meeting:
Continue work on MQP Draft #1
Low-Fidelity Prototyping

168
MQP Agenda: 11/13/2012
Time: 11:00 AM 11/13/2012
Meeting Attendees:
Derek Carey
Evan Doyle
Dennis Leung
Professor Loiacono
Old Business:
MQP uploaded to At-Task
New Business:
Proposal Day Confirmed: December 05, 2012
Economic Feasibility 1st draft (awaiting for feedback)
Systems Request for Vendor Management & Performance (Feedback received)
Functional/ Non-Functional Requirements Determination
Define As-Is System / Evaluate the Visio diagram of tables
Action Items for Next Meeting:
Continue work on MQP Write up

169
MQP Agenda: 11/20/2012
Time: 11:00 AM 11/20/2012
Meeting Attendees:
Derek Carey
Evan Doyle
Dennis Leung
Professor Loiacono
Old Business:
Systems Request Drafted
Feasibility Analysis Drafted
Proposal Day Confirmed: December 05, 2012
Parking Garage: 125 Lincoln Street Boston, MA. Beach Street Entrance
New Business:
Work on developing “Tags” for each vendor
Use Cases
Data Flow Diagram
Entity Relation Diagram
User Interface/ Story Boarding
o Literature Review
Risk Assessment
User Interface Diagram/ Storyboard
Action Items for Next Meeting:
MQP write-up paper finalized

170
MQP Agenda: 11/27/2012
Time: 11:00 AM 11/27/2012
Meeting Attendees:
Derek Carey
Evan Doyle
Dennis Leung
Professor Loiacono
Old Business:
Data Flow Diagrams
User Cases
Entity Relation Diagram
Literature Review
Storyboard
List of tags for vendors from Mark
New Business:
Use Cases review
Data Flow Diagram review
Entity Relation Diagram review
w/ Jack on Wednesday
Complete the Storyboard
Literature Review completion
Action Items for Next Meeting:
Presentation for December 05, 2012
Finalize Write-up Flow

171
MQP Agenda: 12/04/2012
Time: 11:00 AM 12/4/2012
Meeting Attendees:
Derek Carey
Evan Doyle
Dennis Leung
Professor Loiacono
Old Business:
Data Flow Diagram Finalization
Storyboard feedback from Stakeholders
Presentation for Proposal
New Business:
Review document changes
Presentation changes
Storyboard completion
Action Items for Next Meeting:
Submit write up.
Record feedback on proposal presentation.

172
MQP Agenda: 12/11/2012
Time: 2:30 PM 12/11/2012
Meeting Attendees:
Derek Carey
Evan Doyle
Professor Loiacono
Old Business:
Story board completion
Presented Proposal
New Business:
Review submitted document.
Any other comments on presentation.
Deliverable over break.
Action Items for Next Meeting:
Signed Proposal sheet.

173
MQP Agenda: 1/15/2013
Time: 4:00 PM 1/15/2013
Meeting Attendees:
Derek Carey
Evan Doyle
Dennis Leung
Professor Loiacono
Action Items
Discuss Communispace on site scheduling issues
Paper revision
Working Demo of VPRM prototype
Action Items for Next Meeting:
Assess progression of VPRM prototype and paper

174
MQP Agenda: 1/24/2013
Time: 11:00 AM 1/24/2013
Meeting Attendees:
Derek Carey
Evan Doyle
Dennis Leung
Professor Loiacono
Action Items:
o Demo Meetings Progress
Progress on Forums
Feedback from Sponsors is very positive
o Paper Revisions
Started going through mistakes
o Scheduling Presentation
Jack would like to set a date as early as possible.
Action Items for Next Meeting:
o Keep showing progress of switchboard.
o Set Dates for all deadlines by next week.
o Jack will be out of the office Feb 13th
week.

175
MQP Agenda: 1/31/2013
Time: 11:00 AM 1/31/2013
Meeting Attendees:
Derek Carey
Evan Doyle
Dennis Leung
Professor Loiacono
Action Items:
o Discuss how Demo Meeting went.
Waiting on information about Tagging to proceed
o Began user documentation for VPRM Tool.
o Work on documenting Demo Meeting Minutes into paper.
Example?
Action Items for Next Meeting:
o Finish user documentation for Forms already completed in VPRM.
o Work on template for adding in Demo Meeting Minutes in paper.

176
MQP Agenda: 2/07/2013
Time: 11:00 AM 2/07/2013
Meeting Attendees:
Derek Carey
Evan Doyle
Dennis Leung
Professor Loiacono
Action Items:
o Started Help Manual, implementing within Access as well.
o Finished Forms
Action Items for Next Meeting:
o Think about Presentation layout
o Work on missing paper parts

177
MQP Agenda: 2/14/2013
Time: 11:00 AM 2/14/2013
Meeting Attendees:
Derek Carey
Dennis Leung
Professor Loiacono
Action Items:
o Feb 27th
@ 10AM Final Presentation
o Showing CORE Group some screenshots today
o Added adding forms for info and tags
Action Items for Next Meeting:
o Confirm date with Professor and Stakeholders
o Add in Actionable and Testable Data
o Draft of final paper

178
Appendix L – Letter of Acknowledgement
Derek, Dennis, and Evan,
Thank you so much for your efforts over the last few months in helping us with our Vendor
Management Application. The entire team did great work in getting up to speed on our business
model, how & where we are currently managing data, and in creating a solution to standardize this
data in a centralized repository. Some great progress was also made in creating a friendly &
intuitive user interface, as well as thorough documentation of your work on the project.
Your work has helped us get a handle on our vendor data, and has surely laid the foundation to
help us scale this aspect of our business.
Regards,
Jack Bergersen
CORE Operations Manager, Business Analysis & Data Automation

179
Glossary of Terms THIS SECTION HAS BEEN REDACTED.
Break-even point – Account term that describes the point in which there is a balance between
profits and losses in an investment.
THIS SECTION HAS BEEN REDACTED.
Community – A term coined by Communispace to describe the market segment and demographic
mix needed by various customers. Communities are given access to Catalyst to provide marketing
input.
THIS SECTION HAS BEEN REDACTED.
THIS SECTION HAS BEEN REDACTED.
Gantt Chart – Developed by Henry Gantt, Gantt charts physically display project scheduling and
clearly display start and end dates for milestones.
JAD Session – Acronym for Joint Application Design Session. Session in which project sponsors,
stakeholders and the project team meet to determine project objective and limitations. Also
outlined is the feasibility of a project and the deadlines for project deliverables. JAD sessions
commonly include the clarification of the ERD diagram, data flow diagram and workflows. Also,
in our case, walkthroughs of current processes are included to help bridge the bridge the gap of
knowledge between the project team and Communispace.
THIS SECTION HAS BEEN REDACTED.
Market Segmentation- Refers to the differences in consumer preference given factor such as
geographical areas, demographics, psychographics, behaviors and occasions.
Member Appreciation- Community members are given incentives, such as gift cards, to provide
accurate and thoughtful market information.
Methodology- Refers to the various project methodologies associated with the systems
development life cycle. They include waterfall, Prototyping, iterative, parallel, v-model and agile
methods.
MQP- Acronym for major qualifying project. This project serves at the senior capstone project in
the WPI curriculum.
THIS SECTION HAS BEEN REDACTED.
ROI- Acronym for return on investment. Accounting term that measures the efficiency of an
investment. Calculated as (return of investment)/ (cost of investment)
SDLC- Acronym for systems development life cycle. Phased systems analysis approach to the
180
development of a value added system. Occurs in 4 phases, planning, analysis, design and
implementation.
Sourcing- Sub-division of CORE team. Responsible for construction of communities using
various vectors, such as vendors, list vendor and online resources.
Summary Sheet- Excel sheet this is created for each project to capture key metrics and
performance. These sheets provide details on a project basis but lack the ability to display vendor
performance based on several projects.
Use Case- Provides a view into a case of use of a system by outlining actions by the user and the
reactions of the system.
THIS SECTION HAS BEEN REDACTED.
VPRM- Acronym for Vendor Performance and Relation Management System. This system
provides users with the ability consolidate vendor performance metrics to determine suitable
vendors for a project.

181
Bibliography
"Communispace, The Leader in Online Consumer Insights Communities." Communispace, The
Leader in Online Consumer Insights Communities. N.p., n.d. Web. 1 Dec. 2012.
Dennis, Alan, Barbara Wixom, and Roberta Roth. Systems Analysis and Design. Hoboken: John
Wiley & Sons, 2012. Print.
Ferrell, O. C., and Michael D. Hartline. Marketing Strategy. Mason, OH: South-Western Cengage
Learning, 2011. Print.
Stone, Debbie, Caroline Jarrett, Mark Woodroffe, and Shailey Minocha. User Interface Design
and Evaluation. San Francisco: Morgan Kaufmann, 2005. Print.