velocity measurements within an elbow type draft tube of a
TRANSCRIPT
10th Pacific Symposium on Flow Visualization and Image Processing Naples, Italy, 15-18 June, 2015
Paper ID:34 1
Velocity measurements within an elbow type draft tube of a Kaplan turbine
Kaveh Amiri1,*, Berhanu Mulu2, Mehrdad Raisee3, Michel Cervantes1,4
1Department of Engineering Science and Mathematics, Luleå University of Technology, Luleå, Sweden
2Vattenfall Research and Development, Älvkarleby, Sweden 3Mechanical Engineering Department, University of Tehran, Tehran, Iran
4Department of Energy and Process Engineering, Water Power Laboratory, Norwegian University of Science and Technology, Trondheim, Norway
*corresponding author: [email protected] *corresponding author: [email protected]
Abstract Flow condition in a Kaplan turbine draft tube is investigated using particle image velocimetry. The draft tube is composed of a conical diffuser, an elbow and a straight diffuser. The three velocity components were measured after the elbow at two different locations across the straight diffuser; after the draft tube bend and at the draft tube outlet. The objective is to investigate the effect of the swirl living the runner on the flow asymmetry in the straight diffuser. The results are presented at three operating points of the turbine. The swirl strength at the draft tube inlet and the centrifugal force induced by the elbow, forming Dean vortices, are found to be the main parameters affecting the flow condition and performance of the straight diffuser. The flow condition after the draft tube bend was shown to be highly dependent on the vortex structures within the straight draft tube; namely Dean vortices and the main swirl entering the draft tube. At operating points with high flow rates and low swirl, Dean vortices dominate the upstream swirl; hence, a symmetric flow resembling flow after a pipe bend forms inside the straight diffuser. However, at part load operating points with high swirl and low flow rate, the flow after the bend is dominated by the upstream swirl resulting in asymmetric flow within the draft tube. About 80% of the draft tube is occupied by strong vortices inducing centrifugal force to the flow. This results in formation of low axial velocity region where the swirling flow exists while the major part of the flow rate passes through the other part of the draft tube because of the centrifugal force. Keywords: Kaplan turbine, Draft tube, Particle image velocimetry, Dean vortices, Swirl
1. Introduction
Draft tube is an important part of reaction turbines. It is a diffuser converting the kinetic energy of the flow leaving the runner to pressure and increasing the effective head of the turbine. It is usually composed of a conical diffuser, an elbow and a straight diffuser, see Fig. 1b. Most of the pressure recovery, about 70%, occurs in the conical diffuser also named draft tube cone. The elbow has usually a converging cross section to avoid separation on its inner section due to the centrifugal forces induced to the flow by the elbow curvature. A straight diffuser follows the elbow ejecting the flow to the tailrace water.
In low head reaction turbines, i.e., propeller and Kaplan, the turbine efficiency is significantly affected by the performance of the draft tube because the kinetic energy leaving the runner represents a substantial part of the turbines available energy [13]. At the same time, numerical and experimental investigation of the flow inside the draft tubes is a challenge for researchers due to the flow complexity. Adverse pressure gradient, highly unsteady large scale vortices, turbulence, separation and swirling flow are the main challenges. Also, the presence of the runner hub in the middle of the draft tube inlet as a rotating bluff body affects the flow condition inside the draft tube. The large dimensions of the prototypes and even the industrial scaled models are another challenge for performing measurements and numerical simulations.
Different measurement techniques have been used to analyse the flow inside the draft tube of reaction turbines. Draft tube wall pressure measurements may be referred as the oldest method for draft tube flow analysis. The pressure recovery and pulsations of turbine models at different operating conditions are the main issues addressed in such studies [6,9,13,14,16,17]. An extensive work was performed by Arpe and Avellan [1] to characterize the pressure fields on the draft tube walls of a Francis turbine model. Special attentions have been

10th Pacific Symposium on Flow Visualization and Image Processing Naples, Italy, 15-18 June, 2015
Paper ID:34 2
given to the draft tube surge phenomenon and the formation of the rotating vortex rope (RVR). Nishi et al. [15] characterized the draft tube surge phenomenon by performing five-hole probe measurements in a draft tube component test. Duquesne et al. [2] used a fast response five-hole probe to measure unsteady pressure distribution inside the draft tubes of a pump turbine and a Francis turbine. However, most of the studies focused on the draft tube cone located upstream of the draft tube bend as most of the pressure recovery occur in this region.
Optical based velocity measurement techniques, laser Doppler velocimetry (LDV) and particle image velocimetry (PIV), have also been used to investigate flow condition within draft tubes. Kirschner and Ruprecht [11] performed PIV measurements inside a draft tube cone of a pump turbine. Although PIV measurements have been performed in elbow-type draft tubes, most of the previous studies focused on the flow just below the runner; i.e. the draft tube cone installed upstream of the draft tube bend [4,6,7,12]. LDV measurements were mainly performed inside the draft tube cone, too. Gagnon et al. [3] performed LDV measurements at the entrance of the draft tube cone investigating the velocity fluctuations at the runner outlet of a propeller turbine. Flow development along the draft tube cone of a Kaplan turbine was investigated at on design [13] and off design operating points [9]. Iliescu et al. [8] performed 3D-PIV and LDA measurements at the outlet of an elbow-type piered draft. The study showed non-uniformity in the flow exiting the draft tube and the presence of secondary flows at this measurement section. Gubin et al. [5] showed that the asymmetry in the axial velocity is function of the swirl entering the draft tube. The results indicated that in the case of a positive swirl, most the turbine discharge enters the left side of the straight diffuser. A larger portion of the discharge enters the right side of the draft tube when a negative swirl is imposed to the flow at the draft tube entrance. The greater the swirl at the draft tube entrance was, the greater the discharge non-uniformity was over the cross section of the draft tube.
As draft tube are more important in low head machine, the flow pattern in the straight diffuser has a larger influence on the turbine overall efficiency. A clear understanding of the vortical structures and flow asymmetry in the diffuser function of the draft tube inlet swirl and elbow curvature may allow the design of will-performed turbines, especially at part load.
The flow asymmetry inside the straight draft tubes is reported in different studies; however, the mechanism behind this physical phenomenon is not addressed yet. The current study presents the results of 2D PIV measurements performed inside the draft tube of a Kaplan turbine. The three velocity components were obtained at 2 different locations across the straight diffuser; downstream of the draft tube bend and at the draft tube outlet, see figure1b. Three operating points were selected to investigate the effects of the turbine operating condition and the draft tube bend on the draft tube performance. The results shed light on the physical phenomena resulting in asymmetric flow after the draft tube bend of reaction turbines captured in the previous studies by Gubin et al. [5] and Iliescu et al. [8].
2. Experimental setup
2.1. Model specification and operating conditions
Velocity measurements were performed in the draft tube of a 1:3.1 scaled model of a Kaplan turbine called Porjus U9. The model runner diameter is D=0.5 m and its hub to tip ratio is 0.52. The operational net head during all measurements was H=7.5 m. The penstock, having a 90º elbow to mimic the prototype, supplies the water to the spiral casing with a distributor consisting of 20 guide vanes and 18 stay vanes, see Fig. 1a. The flow rate through the turbine can be controlled by changing the guide vanes angle while the turbine operates in off-cam mode; i.e. the runner blades angle is constant. Another effect of changing guide vanes angle under this situation is variation in the swirl at the draft tube entrance. The runner is composed of 6 blades. An elbow type draft tube is installed after the runner for pressure recovery purposes. The runner rotational speed during the measurements was N=696.3 rpm. The arrangement of the guide vanes, runner and the draft tube is illustrated in Fig. 1b.

10th Pacific Symposium on Flow Visualization and Image Processing Naples, Italy, 15-18 June, 2015
Paper ID:34 3
a) b)
Fig. 1 a) Top view of the spiral casing and distributor. b) Schematic of the draft tube with the measurement sections (the green areas show the PIV measurement sections).
The model was investigated at the best efficiency point (BEP) of the turbine. Velocity measurements
were also performed at two operating points with higher and lower flow rates than the one at the BEP, namely high load (HL) and part load (PL), respectively. The operating parameters at each operating point are shown in Table 1. The presented parameters in the table are defines as:
𝑛𝐸𝐷 =𝑛𝐷�𝑔𝐻
(1)
𝑄𝐸𝐷 =𝑄
𝐷2�𝑔𝐻
(2)
𝑅𝑒 =𝜋𝑁𝐷2
60𝜗 (3)
𝜂 =𝑃𝑚
𝜌𝑔𝐻𝑄 (4)
𝑆𝑤 =∫ 𝑈𝑉𝑟2𝑑𝑟𝑅0
𝑅 ∫ 𝑈2𝑟𝑑𝑟𝑅0
(5)
𝐷𝑒 =4𝜌𝐷𝑏𝑄𝜋𝜇𝐷𝑏2
�𝐷
2𝑅𝑐
(6)
The swirl numbers in Table 1 are the results of the LDA measurements performed at a section close to the entrance of the draft tube reported by Jonsson et al. [9]. Decreasing the flow rate through the turbine, by closing the guide vanes, increases the swirl at runner entrance and consequently at the draft tube inlet, see Table 1. Conventional definition for the Dean number, De, was not possible in the current case due to the complexity of the bend geometry; i.e. the flow passage area changes from a circular section at the bend entrance to a rectangular cross section at its outlet and the center of curvature of the inner and outer wall of the bend do not coincide. The presented numbers in Table 1 are based on the bend inlet diameter and the average of the curvature radius of the inner and outer wall of the bend.
Downstream window
Upstream window

10th Pacific Symposium on Flow Visualization and Image Processing Naples, Italy, 15-18 June, 2015
Paper ID:34 4
Table 1. Operating condition parameters
Operating point Part Load BEP High Load Guide vane angle αGV (deg) 20 26.5 32 Volume flow rate Q (m3s-1) 0.62 0.71 0.76 Reduced flow rate QED (-) 0.281 0.322 0.345 Reduced speed nED (-) 0.676 0.676 0.676 Reynolds number Re (-) 9.11×10⁶ 9.11×10⁶ 9.11×10⁶ Relative efficiency to BEP 𝜂 − 𝜂𝐵𝐸𝑃 (%) -5.6 0.0 -1.6 Swirl Sw (-) 0.642 0.255 0.130 Dean number De (-) 9.68×10⁶ 1.11×10⁶ 1.18×10⁶
2.2. Test Rig
The model measurements were performed in Vattenfall R&D model test facility at Älvkarleby, Sweden. The test rig is a closed loop system designed for testing of Kaplan, bulb and Francis turbines. Fig. 2 shows the sketch of the test rig while Porjus U9 model is installed between the upstream and downstream pressure tanks. The uncertainty in the flow rate and hydraulic efficiency measurements are ±0.05% and ±0.18%, respectively. The head of the turbine model is set by adjusting the pumps rotational speed, the pressure in the upstream high pressure tank and downstream low pressure tank. The possibility to independently adjust the pressure in the upstream and downstream tanks makes it possible to perform the measurements either with or without cavitation. The current measurements were performed under cavitation free condition.
Fig. 2 Side and top view of the test rig with installed Porjus U9 model.
2.3. Instruments and measurement techniques
PIV measurements were performed after the bend of the draft tube as well as at the draft tube outlet. The measurement sections are shown with green hatched areas in Fig. 1. The PIV measurements at each section were performed on a net formed by three horizontal planes and five vertical planes covering an area of 1270 mm×375 mm (lateral and vertical direction) in the upstream window and 1270 mm×485mm in the downstream window. Each horizontal measurement plane was divided into eleven sub-windows measuring the axial and lateral velocities. The vertical measurement planes were also each divided into three sub-windows measuring the axial and vertical velocities. This results in 96 PIV measurements at each operating point.

10th Pacific Symposium on Flow Visualization and Image Processing Naples, Italy, 15-18 June, 2015
Paper ID:34 5
PIV system from Dantec was used during the measurements. Two Nd:YAG 400 mJ/pulse lasers were used to generate pulsed light sheets with thickness of ~3mm. The pulse duration was 4 ns. The illuminated area was visualized by a CCD FlowSense EO 4M camera with resolution of 2048×2048 pixels. The time between the paired images was set to 200-300 μs. The seeding particles consisted of Expancel 461 WU 20 powder with an average diameter of 6 µm.
3. Data Analysis
The commercial PIV software, DynamicsStudio, from Dantec dynamics was used for image processing and PIV data analysis. Adaptive correlation scheme with two refinement steps and 50% overlap between the adjacent windows was applied on the acquired data after performing calibration. Although the draft tube optical accesses were composed of flat glasses with parallel surfaces, 2D calibration target was used for calibration to compensate for the perspective effects on the acquired images. Each PIV measurement section was divided to 48 measurement windows composed of 33 horizontal windows and 15 vertical ones as discussed in Section 2.3. All the results from the measurement windows were stitched together to present the flow condition inside the draft tube. The resulting velocity contour plots consist of the results of 96 PIV measurements stitched together.
4. Results and Discussion
This section presents the three velocity components acquired at the two measurement sections for each operating point. The velocities are made dimensionless with respect to the reference velocity calculated from the volume flow rate at the corresponding operating point and the runner diameter. All the dimensions are made dimensionless with respect to the runner diameter. The dimensionless velocities and dimensions are marked with superscript (*) in the following sections.
4.1. High load
Fig. 4 presents the axial velocity distribution inside the draft tube at the HL operating point. This operating point has the minimum swirl (Sw=0.13) and maximum flow rate (Q=0.76 m3/s) between the investigated operating points, see Table 1. Illustrated in the figure, the regions with higher axial velocities, in the upstream window, are located close to the draft tube walls and the low axial velocity region is located close to the centre of the straight diffuser and inner part of the bend. This resembles the flow condition after a bend in a swirl-free pipe flow where two counter rotating vortices of similar strength, called Dean vortices, form after the bend. The elbow curvature induces a centrifugal force on the flowing fluid, pushing the high velocity fluid towards the pipe outer walls [10]. Dean vortices formed after the bend in a circular pipe flow without swirl at the entrance of the bend are symmetrical with the same vortex strength. This results in symmetrical velocity fields in the axial, lateral and vertical directions after the bend. Fig. 4a and b present the lateral and vertical flow velocities inside the draft tube, respectively. Fig. 4c is the sketch of the large vortices deduced from parts a and b of the figure. The results show the existence of the Dean-like vortices formed after the draft tube bend. However, flow asymmetry is present after the bend for all velocity components indicating that the Dean vortices are perturbed. Fig. 4a and c show that the right vortex is stronger than the left one and pushes it back towards the left wall. The zero lateral velocity point, expected to be at Y*=0 under now swirl at the draft tube entrance, is moved to Y*=0.28 in the upstream window. Moreover, unequal amount of the flow passes through the right and left half of the draft tube; 53% through the right half (looking at the flow from the draft tube outlet). The existence of such an asymmetry has previously been reported in other types of turbines; see [5,8].
The mechanism behind formation of such vortical flow structure may be explained by analysing the flow condition downstream a 90º bend pipe of circular and constant cross-section. The effect of the superimposed swirl on the flow in a 90º bend pipe was investigated by Kalpakli and Örlu [10]. They showed that under swirl free condition, Dean vortices form after the bend and the axial velocity increases close to the outer wall. Both axial velocity distribution and the vortices were shown to be symmetrical after the bend. When swirl was induced to the flow upstream of the bend, the symmetry of the Dean vortices was broken and the axial velocity

10th Pacific Symposium on Flow Visualization and Image Processing Naples, Italy, 15-18 June, 2015
Paper ID:34 6
distribution started to become asymmetrical. They showed that when a small swirl (Sw=0.1) was induced to the flow entering the bend, the swirl strength was added to each of the Dean vortices. Hence, the strength of the Dean vortex co-rotating with the upstream swirl was increased and the other one was decreased. The co-rotating vortex dominated the counter-rotating one and pushed it backwards. Under this condition, the high axial velocity region was still located close to the pipe walls. However, the flow passing through the half pipe cross section where the dominating vortex existed was higher.
The velocity distribution after the draft tube bend at HL is qualitatively similar to the simplified case where a weak swirl (Sw=0.1) is imposed to the flow at the entrance of a bend. The imposed swirl strengthens the right vortex which co-rotates with the upstream swirl and decreases the left vortex strength. The high axial velocity regions are located close to the outer walls of the draft tube straight diffuser. The portion of the flow rate passing through the right half of the draft tube is slightly higher than the one passing through the left half.
Fig. 3 Axial velocity contours within the straight diffuser at HL.

10th Pacific Symposium on Flow Visualization and Image Processing Naples, Italy, 15-18 June, 2015
Paper ID:34 7
a)
b)
c)
Fig. 4 Velocity contours within the straight diffuser at HL: a) Lateral velocity; b) Vertical velocity ; c) Schematic of the vortices formed after the draft tube bend.
4.2. Best efficiency point
Velocity distribution after the draft tube bend is also investigated at the BEP presented in Table 1. At the BEP,

10th Pacific Symposium on Flow Visualization and Image Processing Naples, Italy, 15-18 June, 2015
Paper ID:34 8
the flow rate entering the draft tube is lower and the swirl is higher compared with the HL. Hence, Dean vortices with lower strength and higher effect from the upstream swirl is expected at this operating point.
Fig. 5 shows the contour of the axial velocity inside the straight diffuser at the BEP. Moving the turbine operating point from the HL to the BEP increased the flow asymmetry after the draft tube bend; 56% of the flow rate passes through the right half of the draft tube.
Fig. 6a and b presents the contours of the lateral and vertical velocities, respectively. Schematics of large scale vortices after the draft tube bend, deduced from the lateral and vertical velocity contours is presented in Fig. 6c. The Dean vortices still exist after the draft tube bend. However, the larger swirl at the draft tube inlet increased the strength of the right vortex co-rotating with the upstream swirl and decreased the strength of the other vortex counter-rotating with the upstream swirl. The dominant vortex pushes the other one further to the left draft tube wall. The zero lateral velocity line is moved to Y*=0.75 in the upstream window.
Qualitatively similar results are reported in the simplified case of a bend pipe by Kalpakli and Örlü [10] when the swirl strength increases from 0.1 to 0.3. The co-rotating Dean vortex becomes stronger as the upstream swirl increases and the strength of its counter-part decreases. The stronger vortex dominates the other and pushes it further towards the pipe wall. The majority of the flow passes through the half of the pipe where the stronger swirl exists.
Fig. 5 Axial velocity contours within the straight diffuser at the BEP.

10th Pacific Symposium on Flow Visualization and Image Processing Naples, Italy, 15-18 June, 2015
Paper ID:34 9
a)
b)
c)
Fig. 6 Velocity distribution within the straight diffuser at the BEP: a) Lateral velocity; b) Vertical velocity; c) Schematic of the vortices formed after the draft tube bend.
4.3. Part load
The PIV measurement results performed at the PL operating point are presented in this section. Flow rate

10th Pacific Symposium on Flow Visualization and Image Processing Naples, Italy, 15-18 June, 2015
Paper ID:34 10
through the turbine at this operating point is decreased by 13% compared with the BEP. The swirl exiting the runner is increased to 0.642; see Table 1. The strength of the Dean vortices is expected to be decreased at this operating point.
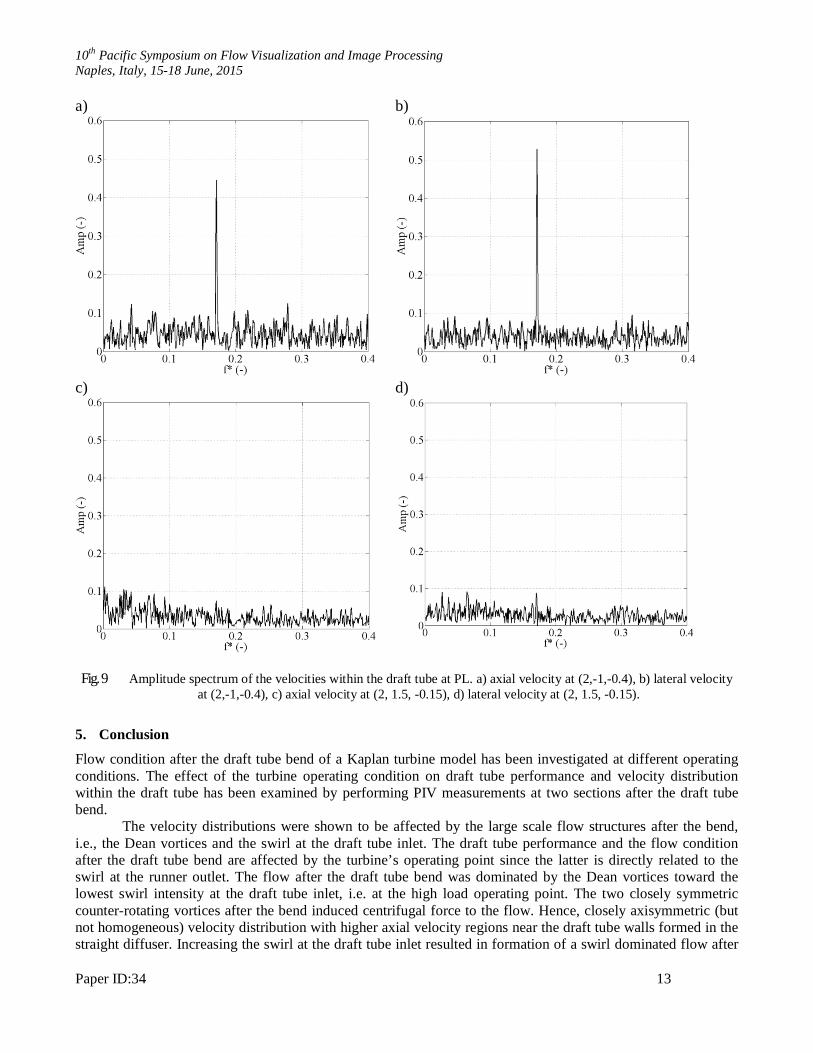
Fig. 8 Fig. 7 shows the axial velocity contour plot within the straight diffuser. The flow asymmetry after the draft tube bend and at the draft tube outlet is larger than the other operating points; 80% of the flow passes through the right half of the draft tube. The axial velocity in the region near the draft tube centreline is close to zero indicating the formation of a dead zone region affecting the pressure recovery of the draft tube. The flow tends to go toward the right wall of the draft tube in the streamwise direction. Nearly 40% of the flow passes through about 15% of the right part in the upstream measurement section while this ratio increases to 53% in the downstream section. This results in a more inhomogeneous flow distribution at the draft tube outlet. The existence of some regions with high local velocities leads to a poor performance of the draft tube.
Fig. 7 Axial velocity contours within the straight diffuser at the PL. Fig. 8 shows the lateral and vertical velocity contours together with the sketch of the large vortices
formed after the draft tube bend. Similar to the previous cases, two counter-rotating vortices are formed after the draft tube bend. Although the vortices resemble the Dean vortices after a bend, their rotational direction is opposite to the expected Dean vortices; i.e., the right vortex rotates in the clockwise direction and the left one rotates counter-clockwise.
The effect of the swirl on the flow after a 90º bend investigated by Kalpakli and Örlu [10] showed that increasing the swirl results in the formation of a swirl dominated flow after the bend. The Dean vortex counter-rotating with the upstream swirl completely disappears and the velocity field after the bend resembles a swirling flow rotating in the same direction as the upstream swirl with the vortex core being geometrically off-axis. The dominating vortex moves towards the pipe centreline with increasing the swirl number and even passes through this line at high swirl numbers. High axial velocity region forms in the other side of the pipe.

10th Pacific Symposium on Flow Visualization and Image Processing Naples, Italy, 15-18 June, 2015
Paper ID:34 11
a)
b)
c)
Fig. 8 Velocity distribution within the draft tube at PL: a) Lateral velocity; b) Vertical velocity ; c) Schematic of the vortices formed after the draft tube bend.
The PIV measurement results acquired after the draft tube bend are qualitatively in agreement with the measurement results of Kalpakli and Örlu [10] with some differences related with the geometrical

10th Pacific Symposium on Flow Visualization and Image Processing Naples, Italy, 15-18 June, 2015
Paper ID:34 12
differences between these two cases. As discussed in Section 4.2, increasing the swirl at the draft tube inlet by moving from HL to the BEP resulted in the formation of a weakened clockwise vortex in the left part of the draft tube. The counter-clockwise vortex formed in the right part of the draft tube dominated the weak vortex and started to move to the left part of the draft tube. By moving to the PL, the clockwise rotating vortex is completely dominated by the counter-clockwise one and disappeared. The strong vortex moves more to the left and settles in the left half of the draft tube which is similar to the flow condition after a pipe bend at high swirl numbers; see Kalpakli and Örlu [10]. The counter-clockwise rotating flow hits the upper draft tube wall at Y*=0.09 and a secondary vortex, counter rotating with the latter, forms on the right half of the draft tube due to the rectangular cross section of the draft tube.
Fig. 9a and b present the amplitude spectrum of the axial and lateral velocities at a point located within the high axial velocity region after the draft tube bend; i.e., at (2, -1, -0.4). The results showed that a peak at f*=0.17 dominates the spectrum in both velocity components. This frequency is related to the rotating vortex rope which was formed inside the draft tube cone of the turbine at the part load operating point. Jonsson et al. [9] showed that vortex breakdown happens inside the draft tube cone at the PL and as a result a rotating vortex rope (RVR) forms. The RVR revolves with a frequency f*=0.17 around the draft tube cone centerline. Frequency analysis of the axial velocity components in the low axial velocity regions showed that the flow oscillations do not exist in such regions. For instance, the amplitude spectrum of the velocity components at (2, 1.5, -0.15) is shown in Fig. 9c and d. Hence, special attention should be paid to the regions with high flow rate during the structural design of draft tube to suppress crack propagation due to the RVR fluctuations which may happen to the machines operated for long periods at PL.
10th Pacific Symposium on Flow Visualization and Image Processing Naples, Italy, 15-18 June, 2015
Paper ID:34 13
a) b)
c) d)
Fig. 9 Amplitude spectrum of the velocities within the draft tube at PL. a) axial velocity at (2,-1,-0.4), b) lateral velocity at (2,-1,-0.4), c) axial velocity at (2, 1.5, -0.15), d) lateral velocity at (2, 1.5, -0.15).
5. Conclusion
Flow condition after the draft tube bend of a Kaplan turbine model has been investigated at different operating conditions. The effect of the turbine operating condition on draft tube performance and velocity distribution within the draft tube has been examined by performing PIV measurements at two sections after the draft tube bend.
The velocity distributions were shown to be affected by the large scale flow structures after the bend, i.e., the Dean vortices and the swirl at the draft tube inlet. The draft tube performance and the flow condition after the draft tube bend are affected by the turbine’s operating point since the latter is directly related to the swirl at the runner outlet. The flow after the draft tube bend was dominated by the Dean vortices toward the lowest swirl intensity at the draft tube inlet, i.e. at the high load operating point. The two closely symmetric counter-rotating vortices after the bend induced centrifugal force to the flow. Hence, closely axisymmetric (but not homogeneous) velocity distribution with higher axial velocity regions near the draft tube walls formed in the straight diffuser. Increasing the swirl at the draft tube inlet resulted in formation of a swirl dominated flow after

10th Pacific Symposium on Flow Visualization and Image Processing Naples, Italy, 15-18 June, 2015
Paper ID:34 14
the bend. The strength of the Dean vortex co-rotating with the main swirl increases when the swirl increases and diminished the other. This results in more asymmetry in the flow after the bend. At the part load operating point, where the swirl intensity was higher than the other operating points, the Dean vortex counter-rotating with the main swirl completely disappeared and was replaced by the co-rotating vortex. The results showed that the major part of the flow passes through 20% of the draft tube cross section area and the draft tube performance is strongly affected.
Acknowledgement
The authors’ gratitude goes to the Swedish Hydropower Center (SVC) for the financial support.
Notation
D = Runner diameter of turbine model (m) H = Head during model test (m) N = Runner rotational speed of the model (rpm) n = Turbine revolving frequency (Hz) 𝑛𝐸𝐷 = 𝑛𝐷
�𝑔𝐻 = Speed factor (-)
Pm = Output mechanical power (kW) 𝑄𝐸𝐷 = 𝑄
𝐷2�𝑔𝐻 = Discharge factor (-)
Q = Model flow rate (m3s-1) r = Radial location (m) R = Radius (m) 𝑅𝑒 = 𝜋𝑁𝐷2
60𝜗= Reynolds number (-)
Sw= Swirl intensity (-) U= Axial velocity (ms-1) u= Fluctuating axial velocity (ms-1) V= Lateral velocity (ms-1) v= Fluctuating lateral velocity (ms-1) W= Vertical velocity (ms-1) w= Fluctuating vertical velocity (ms-1) αGV = Guide vane angle (0) η = Turbine efficiency (-) ν = Kinematic viscosity (m2s-1) ρ = Fluid density (kgm-3)
Superscripts
* = Made dimensionless using reference velocity, runner diameter or runner frequency in case of velocity, dimension or frequency, respectively.
6. References
[1] Arpe J, Avellan F (2002) Pressure wall measurements in the whole draft tube : steady and unsteady analysis. : 593-602

10th Pacific Symposium on Flow Visualization and Image Processing Naples, Italy, 15-18 June, 2015
Paper ID:34 15
[2] Duquesne P, Ciocan GD, Aeschlimann V, Bombenger A, Deschênes C (2013) Pressure probe with five embedded flush-mounted sensors: unsteady pressure and velocity measurements in hydraulic turbine model. Experiments in Fluids 54
[3] Gagnon JM, Aeschlimann V, Houde S, Flemming F, Coulson S, Deschenes C (2012) Experimental investigation of draft tube inlet velocity field of a propeller turbine. Journal of Fluids Engineering 134
[4] Gagnon JM, Deschenes C, Ciocan GD, Iliescu M (2008) Numerical simulation and experimental investigation of the flow in an axial turbine.
[5] Gubin MF, Volshanik VV, Kazennov VV (1974) Investigation of curved draft tubes with long exit cones. Gidrotekhnicheskoe Stroitel'stvo 10: 32-36
[6] Houde S, Iliescu MS, Fraser R, Lemay S, Ciocan GD, Deschenes C (2011) Experimental and numerical analysis of the cavitating part load vortex dynamics of low-head hydraulic turbines.
[7] Iliescu MS, Ciocan GD, Avellan F (2008) Analysis of the cavitating draft tube vortex in a Francis turbine using particle image velocimetry measurements in two-phase flow. Journal of Fluids Engineering 130
[8] Iliescu MS, Ciocan GD, Avellan F (2002) 3D PIV and LDV measurements at the outlet of a Francis turbine draft tube.
[9] Jonsson PP, Mulu BG, Cervantes MJ (2012) Experimental investigation of a Kaplan draft tube – Part II: Off-design conditions. Appl Energy 94: 71-83
[10] Kalpakli A, Örlü R (2013) Turbulent pipe flow downstream a 90° pipe bend with and without superimposed swirl. Int J Heat Fluid Flow 41: 103-111
[11] Kirschner O, Ruprecht A (2007) Velocity Measurement with PIV in a Straight Cone Draft Tube.
[12] Müller A, Bullani A, Dreyer M, Roth S, Favrel A, Landry C, Avellan F (2012) Interaction of a pulsating vortex rope with the local velocity field in a Francis turbine draft tube.
[13] Mulu BG, Jonsson PP, Cervantes MJ (2012) Experimental investigation of a Kaplan draft tube – Part I: Best efficiency point. Appl Energy 93: 695-706
[14] Nicolet C, zobeiri A, Maruzewski P, Avellan F (2011) Experimental Investigations on Upper Part Load Vortex Rope Pressure Fluctuations in Francis Turbine Draft Tube. International Journal of Fluid Machinery and Systems 4: 179-190
[15] Nishi M, Matsunaga S, Okamoto M, Uno M, Nishitani K (1988) Measurements of Three-Dimensional Periodic Flow in a Conical Draft Tube at Surging Condition. Flows in Non-Rotating Turbomachinery Components 69: 81-88
10th Pacific Symposium on Flow Visualization and Image Processing Naples, Italy, 15-18 June, 2015
Paper ID:34 16
[16] Vekve T, Skåre PE (2002) Velocity- and pressure measurements in the draft tube on a model Francis pump turbine.
[17] Vekve T, Brekke H, Skåre PE (2001) Analyzing techniques for dynamic pressure data applied on Francis turbines.