vehicular ad hoc networks: dissemination, data collection
TRANSCRIPT

HAL Id: tel-00919774https://tel.archives-ouvertes.fr/tel-00919774
Submitted on 17 Dec 2013
HAL is a multi-disciplinary open accessarchive for the deposit and dissemination of sci-entific research documents, whether they are pub-lished or not. The documents may come fromteaching and research institutions in France orabroad, or from public or private research centers.
L’archive ouverte pluridisciplinaire HAL, estdestinée au dépôt et à la diffusion de documentsscientifiques de niveau recherche, publiés ou non,émanant des établissements d’enseignement et derecherche français ou étrangers, des laboratoirespublics ou privés.
Vehicular ad hoc networks : dissemination, datacollection and routing : models and algorithms
Ahmed Soua
To cite this version:Ahmed Soua. Vehicular ad hoc networks : dissemination, data collection and routing : modelsand algorithms. Other [cs.OH]. Institut National des Télécommunications, 2013. English. �NNT :2013TELE0028�. �tel-00919774�

� � �
�
��������������������� ��������������� ��������� ��� ���� ������� ��
�� ���
�
�
�����������������������������
�
�
�
�
������������� ��� !���"#�����������!!#��������$�
�
�������%���� ��������������� ������������������ ��� ������ �� ������
�
� �$�������� �
�
&!�%������
��# ��'���� ����( �%��%��
���������������������� ��
�
�
�
�$��#)���&��#��� �$�����$$�!�������*��#��(��������������%��
������$�����%+��$�����(� ��&!�$�
��
��� �� �� ��������������������������������������
�
��,�������-# .���!��$��%�����
�
� ����%����&�!!�%������� � ���� ��# � ���,� $����%��/�# (�(��*� �����,� $�
� ��0�������� ���� ��# � �$���#��1������*����,� $������ �$�23�
�!����� ���"#����4��� �)�!�����# � ���,� $������ �$5�#%�
� ��1#.��������� �)�!�����# � ����*���'� ���� ��� �6�
� ��7 ��8��$������� �)�!�����# � ���#���
� ����#������������ �)�!�����# � � ���"#����# ��
� ����$$�!�7 7 � �� ����# �%���&+$�� ������!��#%�� �$�
� ��9���%�/��5���� ��5����% �# �%���&+$�� ������!��#%�� �$�

Telecom SudParis 2012-2013
Universite Pierre et Marie CurieInstitut Mines-Telecom
Telecom SudParis
Thesis Report
To obtain the degree of
Docteur d’universite
Subjet
Vehicular Ad Hoc Networks: Dissemination, DataCollection and Routing: Models and Algorithms
Presented by
Ahmed SOUA
Thesis Supervisor : Pr.Hossam AFIFIThesis Co-supervisor : Pr.Walid BEN-AMEURHost laboratory : SAMOVAR, Telecom SudParis
Jury
Mr Sidi Mohammed SENOUCI ReviewerMr Ken CHEN ReviewerMme Veronique VEQUE ExaminerMr Guy PUJOLLE ExaminerMr Francois COLET ExaminerMr Paul MUHLETHALER Examiner

Abstract
Each day, Humanity loses thousands of persons on roads when they were traveling towork, to study or even to distract. The financial cost of these injuries is also terrifying:Some statistics evaluate this cost of vehicle accidents at 160 billion Euro in Europeeach year. These alarming figures have driven researchers, automotive companiesand public governments to improve the safety of our transportation systems andcommunication technologies aiming at offering safer roads and smooth driving tohuman beings. In this context, Vehicular Adhoc Networks (VANETs), where vehiclesare able to communicate with each others and with existent road side units, emergeas a promising wireless technology able to enhance the vision of drivers and offer alarger telematic horizon. VANETs promising applications are not only restricted toroad safety but span from vehicle traffic optimization like flow congestion control tocommercial applications like file sharing and internet access.
Safety applications require that the alert information is propagated to the con-cerned vehicles (located in the hazardous zone) with little delay and high reliability.For these reasons, this category of applications is considered as delay sensitive andbroadcast-oriented nature. While classical blind flooding is rapid, its major drawbackis its huge bandwidth utilization.
Thus, in this thesis we are interested on enhancing vehicular communicationsunder different scenarios and optimizations: First, we focus on deriving a new solu-tion (EBDR) to disseminate alert messages among moving vehicles while maintainingit efficient and rapid. Our proposal is based on directional antennas to broadcastmessages and a route guidance algorithm to choose the best path for the packets.Findings confirmed the efficiency of our approach in terms of probability of successand end-to-end delays. Moreover, in spite of the broadcast nature of the proposedtechnique, all transmissions stop very soon after the arrival of a packet to its desti-nation representing a strong feature in the conception of EBDR.
Second, we propose a novel mathematical framework to evaluate the performanceof EBDR analytically. Although most of the proposed techniques present in literatureuse experimental or simulation tools to defend their performance, we rely here onmathematical models to confirm our achieved results. Our proposed framework allowsto derive meaningful performance metrics including the probability of transmissionsuccess and the required number of hops to reach the final destination.
Third, we refine our proposed broadcast-based routing EBDR to provide moreefficient broadcasting by adjusting the transmission range of each vehicle based on its
i

ii
distance to the destination and the local node density. This mechanism allows betterminimization of interferences and bandwidth’s saving. Furthermore, an analyticalmodel is derived to calculate the transmission area in the case of a simplified nodedistribution.
Finally, we are interested on data collection mechanisms as they make inter-vehiclecommunications more efficient and reliable and minimize the bandwidth utilization.Our technique uses Q-learning to collect data among moving vehicles in VANETs.The aim behind using the learning technique is to make the collecting operation morereactive to nodes mobility and topology changes. For the simulation part, we compareit to a non-learning version to study the effect of the learning technique. Findingsshow that our technique far outperforms other propositions and achieves a good tradeoff between delay and collection ratio.
In conclusion, we believe that the different contributions presented in this thesiswill improve the efficiency of inter-vehicle communications in both dissemination anddata collection directions. In addition, our mathematical contributions will enrich theliterature in terms of constructing suitable models to evaluate broadcasting techniquesin urban zones.
Key words: Vehicular Adhoc Networks, safety applications, dissemination pro-tocol, analytical framework, congestion control, transmission power adjustment, datacollection.

Resume
Chaque jour, l’humanite perd des milliers de personnes sur les routes pendant qu’ils serendent a travailer, a etudier ou meme a se distraire. Ce nombre alarmant s’accumuleavec le cout financier terrifiant de ces deces: Certaines statistiques evaluent le couta 160 milliards d’euros par an en Europe. Ces chiffres alarmants ont pousse leschercheurs, les constructeurs des automobiles et les gouvernements publics a ameliorerla securite de nos systemes de transport et des technologies de communication dansle but d’ offrir des routes plus sures et une conduite plus plaisible pour les usagersde la route. Dans ce contexte, les reseaux vehiculaires (VANETs), dans lesquelsles vehicules sont capables de communiquer les uns avec les autres et avec aussiles infrastructures installees sur les routes, emergent comme une technologie sans filprometteuse capable d’ameliorer la vision des conducteurs et ainsi offrir un horizontelematique plus vaste. L’avenement des reseaux vehiculaires laisse entrevoir unemyriade de possibilites, non seulement limitees a la securite routiere, mais allantde la gestion du trafic routier (controle de congestion pour avoir un trafic fluide)jusqu’aux applications de divertissement (partage de fichiers, connexion internet).
Les applications de securite routiere exigent que le message d’alerte soit propagede proche en proche par les vehicules jusqu’a arriver a la zone concernee par l’alertetout en respectant les delais minimaux exiges par ce type d’applications et la grandefiabilite des transmissions. Ces applications sont considerees tres sensibles aux delaisde bout en bout et se basent sur des transmissions en broadcast. Le broadcast aveugleest considere la solution la plus rapide, neanmoins son principal inconvenient residedans son enorme consommation de la bande passante.
Dans cette these, nous nous interessons a l’amelioration de l’efficacite des commu-nications inter-vehiculaires sous differents scenarios: Tout d’abord, nous nous concen-trons sur le developpement d’une nouvelle solution, appelee EBDR, pour disseminerles informations d’alertes dans un reseau vehiculaire tout en assurant des courts delaisde bout en bout et une efficacite pour les transmissions. Notre proposition est baseesur des transmissions dirigees effectuees a l’aide des antennes directionnelles pourla diffusion des messages et un algorithme de guidage d’iterinaire afin de choisir lemeilleur chemin pour le paquet. Les resultats obtenus ont confirme l’efficacite de notreapproche en terme de probabilite de reussite et delai de bout en bout. Par ailleurs,en depit de son fonctionnement en diffusion, les transmissions de notre technique pro-posee s’arretent tres rapidement apres l’arrivee du paquet a la destination finale cequi represente une caracteristique fondamentale dans la conception de EBDR.
iii

iv
Deuxiemement, nous proposons un framework mathematique ayant pour objec-tif l’evaluation des performances de EBDR analytiquement. Sachant que la plupartdes techniques presentes dans la litterature utlisent les simulations ou les tests-bedd’experimentation pour defendre leurs performances, nous nous appuyons ici sur desmodeles mathematiques recursifs pour confirmer les resultats deja obtenus par simu-lation. Nos modeles analytiques permettent de deriver des metriques de performancessignificatives a savoir la probabilite de succes et le nombre de sauts requis pour at-teindre la destination finale.
En outre, nous proposons une amelioration de notre protocole EBDR dans le butde fournir une diffusion plus efficace. Pour cela, nous nous basons sur l’ajustementde la puissance de transmission de chaque vehicule en fonction de la distance qui lesepare de la destination et la densite locale des nœuds. Ce mecanisme de controlede congestion permet de mieux minimiser les interferences et economiser de la bandepassante. En plus, un modele mathematique a ete elabore pour calculer la surface dela zone de transmission dans le cas d’une distribution uniforme des nœuds.
Finalement, nous nous sommes interesses aux mecanismes de collecte de donneesdans les reseaux vehiculaires etant donne leurs implications positives sur l’efficaciteet la fiabilite des communications inter-vehiculaires et la conservation de la bandepassante. Notre approche est basee sur l’utilisation du principe du Q-learning pourla collecte des donnees des vehicules en mouvement. L’objectif de l’utilisation dece mecanisme d’apprentissage est de rendre l’operation de collecte mieux adaptee etmieux reactive a la mobilite des nœuds et le changement rapide de la topologie dureseau. Notre technique a ete comparee a des methodes n’utilisant pas du ”learning”,afin d’etudier l’effet du mecanisme d’apprentissage. Les resultats ont montre quenotre approche depasse largement les autres propositions en termes de performanceset realise un bon compromis entre le taux de collecte et les delais de bout en bout.
Pour conclure, nous pensons que nos differentes contributions presentees toutle long de cette these permettrons d’ameliorer l’efficacite des communications sansfil inter-vehiculaires dans les deux directions de recherches ciblees par cette thesea savoir: la dissemination des messages et la collecte des donnees. En outre, noscontributions de modelisation mathematique enrichirons la litterature en terme demodeles analytiques capables d’evaluer les techniques de transmission des donneesdans un reseau urbain.
Mots cles: Reseaux Vehiculaires, applications de securite routiere, protocolede dissemination, framework analytique, controle de congestion, ajustement de lapuissance de transmission, collecte de donnees.

Thesis Publications
Journal Paper
• Ahmed Soua, Walid Ben-Ameur, and Hossam Afifi, A Focus On Wireless Ve-hicular Multihop Communications Using Directional Antennas: Proposals andAnalysis. Submitted to IEEE Transactions on Mobile Computing.
Conference Papers
• Ahmed Soua, and Hossam Afifi, Adaptive Data collection Protocol using Re-inforcement Learning for VANETs, the 9th IEEE International Wireless Com-munications & Mobile Computing Conference (IWCMC), July, 2013.
• Adel Said, A. Ibrahim, Ahmed Soua, and Hossam Afifi, Dynamic AggregationProtocol for Wireless Sensor Networks, the 27th IEEE International Conferenceon Advanced Information Networking and Applications (AINA), March, 2013.
• Ahmed Soua, Walid Ben-Ameur, and Hossam Afifi, Beamforming-Based Broad-cast Scheme for Multihop Wireless Networks with Transmission Range Adjust-ment, the 10th Annual IEEE/IFIP Conference on Wireless On-Demand NetworkSystems and Services (WONS), 2013.
• Ahmed Soua, Walid Ben-Ameur, and Hossam Afifi, Analysis of informationrelay processing in inter-vehicle communication: A novel visit, the 8th IEEEInternational Conference on Wireless and Mobile Computing, Networking andCommunications (WiMob), 2012.
• Ahmed Soua, Walid Ben-Ameur, and Hossam Afifi, Enhancing broadcast ve-hicular communications using beamforming technique, the 8th IEEE Interna-tional Conference on Wireless and Mobile Computing, Networking and Com-munications (WiMob), 2012.
• Ahmed Soua, Walid Ben-Ameur, and Hossam Afifi, Broadcast-based Direc-tional Routing in Vehicular Ad-Hoc Networks, the 5th joint IFIP Wireless andMobile Networking Conference (WMNC), 2012.
v

Acknowledgement
Throughout my Phd study period in the SAMOVAR laboratory at Telecom SudParis,many people have kindly provided me with their help and unlimited support. It isa pleasure to convey my most profound gratitude to them all and I am particularlyindebted to the following people.
First and foremost, I want to express my deep and sincere gratitude to my su-pervisor, Prof. Hossam Afifi for his continuous support and his constant guidanceduring my PhD study years in the SAMOVAR laboratory. Your encouragement andpersonal guidance have provided a good basis for the present thesis. Your perpetualenergy and enthusiasm in research had motivated me so much. I am very fortunate tohave you as a supervisor. Thank you for everything, it was a truly great experienceworking with you !
Second, I am indebted to my co-supervisor Prof. Walid Ben-Ameur for his warmlyreception and insightful discussions and instructions during my research study. Underhis supervision the quality of my work has constantly improved, not to mention theinvaluable support and countless contributions to this work. Thank you for havingoriented and supported me with patience and encouragements, for your great senseof responsibility and professionalism.
I wish to thank also the members of the dissertation jury for accepting the invita-tion and their valuable time and feedback. My special appreciation goes to Prof. SidiMohammed Senouci, Prof. Ken Chen, Prof. Veronique Veque, Mr. Francois Colet,Prof. Guy Pujolle and Prof. Paul Muhlethaler.
I would like also to thank the staff of Telecom SudParis; particularly Dr. VincentGauthier, Dr. Abdallah M’hamed. Many thanks go to Mme Valerie Mateus whotakes care of my demands on the administrative procedures.
Many thanks to all my colleagues and friends inside Telecom SudParis and alsooutside for the excellent and truly enjoyable ambiance. My warmest thanks goto: Khalifa Toumi, Amira Bradai, Chiraz Houaidia, Mohamed Ibn Kidhr, EmadAbd-Elrahman, Mohamed Abid, Oussama Soualah, Ali Mehdi, Amine Sboui, Na-dia Othman, Wiem Sammoud, Aymen Amri, Mouna Selmi, Sarra ben Frej, Mo-nia Chikhrouhou, Mehdi Bouleimen, Meriem Yahiaoui, Nicolas Gensollen, FereshtehAsgari, Mohamed Boutabia, Mohamed Didi, Farouk, Aziza & Azza Ben Mosbeh,Mohamed-Haykel Zayani, Ines Fakhfakh, Alexis Sultan, and my colleagues in Tunisia:Naourez Mejri, Nour Brinis, Cherifa and Hela Boucetta, Amine Kchich, and ZiedChedhly, I am grateful to all of you, for your prayers, encouragements, support and

vii
for the fun moments I have shared with you !I also gratefully acknowledge the support of my country Tunisia for the contri-
bution to this thesis financing. Thanks for giving me this opportunity to make mydream come true.
Last, I want to express my gratitude to my family for their unconditional love,support, and trust.

To my parents Salem and Souad,
I am especially thankful for your love, your understanding and your continuoussupport. You gave me strengths on weak days and showed me the sun on rainy days.
Thanks for always believing in me.
To my brothers Ridha and Zied, and my sister Marwa,
I am particularly indebted for your unconditional trust and sincere love. Thanks foralways standing by my side during difficult times and for the fun moments I have
shared with you !
In Honor of my grandfathers and grandmothers,
I dedicate this work as a token of my deep love. May ALLAH forgive You and grantYou His Grace and His Mercy.
To all SOUA and BEN KHALIFA family members,
Thanks for your love, kind support and continuous encouragement !
To Fadwa
Thanks for everything :)
Ahmed Soua

Contents
Table of Contents ix
List of Figures xiii
List of Tables xvi
1 Introduction 11.1 Motivations . . . . . . . . . . . . . . . . . . . . . . . . . . . . . . . . 11.2 Contributions . . . . . . . . . . . . . . . . . . . . . . . . . . . . . . . 31.3 Organization of the Thesis . . . . . . . . . . . . . . . . . . . . . . . . 4
2 Vehicular Adhoc Networks: The big picture 62.1 Introduction . . . . . . . . . . . . . . . . . . . . . . . . . . . . . . . . 62.2 Vehicular Networks . . . . . . . . . . . . . . . . . . . . . . . . . . . . 7
2.2.1 Definition . . . . . . . . . . . . . . . . . . . . . . . . . . . . . 72.2.2 General Characteristics . . . . . . . . . . . . . . . . . . . . . . 82.2.3 Related Projects . . . . . . . . . . . . . . . . . . . . . . . . . 102.2.4 Proposed Architectures and Related Protocols . . . . . . . . . 12
2.3 VANETs Applications . . . . . . . . . . . . . . . . . . . . . . . . . . 162.3.1 Safety Applications . . . . . . . . . . . . . . . . . . . . . . . . 172.3.2 Traffic Related Applications . . . . . . . . . . . . . . . . . . . 182.3.3 Infotainment Applications . . . . . . . . . . . . . . . . . . . . 21
2.4 Conclusion . . . . . . . . . . . . . . . . . . . . . . . . . . . . . . . . . 21
3 Broadcast-based Routing technique for VANETs using Directional
Antennas 223.1 Introduction . . . . . . . . . . . . . . . . . . . . . . . . . . . . . . . . 233.2 Dissemination in VANET: Specific Requirements and Prerequisites . . 23
ix

CONTENTS x
3.2.1 Principe and Motivation . . . . . . . . . . . . . . . . . . . . . 233.2.2 Dissemination Related Challenges . . . . . . . . . . . . . . . . 24
3.2.2.1 The Scalability Problem . . . . . . . . . . . . . . . . 243.2.2.2 Traffic Differentiation . . . . . . . . . . . . . . . . . 243.2.2.3 Trust Issue . . . . . . . . . . . . . . . . . . . . . . . 25
3.3 State-of-the Art: Techniques for Information Dissemination in VANETs 253.3.1 Distance-based Broadcast Protocols . . . . . . . . . . . . . . . 26
3.3.1.1 The Improved Greedy Traffic-Aware Routing Protocol 263.3.1.2 Spatial Distribution and Channel Quality Adaptive
Protocol . . . . . . . . . . . . . . . . . . . . . . . . . 273.3.1.3 TRAck Detection Protocol . . . . . . . . . . . . . . . 283.3.1.4 Zone Based Forwarding Protocol . . . . . . . . . . . 283.3.1.5 Highway Multihop Broadcast Protocol (HMB) . . . . 293.3.1.6 Efficient Directional Broadcast Protocol (EDB) . . . 293.3.1.7 Efficient Road-based Directional Broadcast Protocol
(ERD) . . . . . . . . . . . . . . . . . . . . . . . . . . 303.3.2 Probability based Broadcast Protocols . . . . . . . . . . . . . 30
3.3.2.1 Weighted p-persistence Protocol . . . . . . . . . . . . 313.3.2.2 Irresponsible Forwarding Protocol . . . . . . . . . . . 313.3.2.3 AutoCast . . . . . . . . . . . . . . . . . . . . . . . . 32
3.3.3 Neighbor-knowledge-based Protocols . . . . . . . . . . . . . . 323.3.3.1 R-OB-VAN Protocol . . . . . . . . . . . . . . . . . . 323.3.3.2 DV-CAST technique . . . . . . . . . . . . . . . . . . 333.3.3.3 DSP Technique . . . . . . . . . . . . . . . . . . . . . 34
3.4 Proposed Technique: EBDR . . . . . . . . . . . . . . . . . . . . . . . 343.4.1 Directional Antenna Model . . . . . . . . . . . . . . . . . . . 353.4.2 EBDR Conception . . . . . . . . . . . . . . . . . . . . . . . . 36
3.4.2.1 Route Guidance Algorithm . . . . . . . . . . . . . . 363.4.2.2 Broadcasting Technique . . . . . . . . . . . . . . . . 39
3.4.3 Performance Evaluation . . . . . . . . . . . . . . . . . . . . . 423.4.3.1 Simulation Plateform . . . . . . . . . . . . . . . . . . 423.4.3.2 Simulation Results . . . . . . . . . . . . . . . . . . . 45
3.5 Other Application Scenarios of EBDR . . . . . . . . . . . . . . . . . 503.5.1 Protocol Design . . . . . . . . . . . . . . . . . . . . . . . . . . 503.5.2 Results and Analysis . . . . . . . . . . . . . . . . . . . . . . . 50
3.5.2.1 Some Simulation Results . . . . . . . . . . . . . . . . 513.5.2.2 An analytical Model for the Transmission Area . . . 55
3.6 Conclusion . . . . . . . . . . . . . . . . . . . . . . . . . . . . . . . . . 58
4 A Mathematical Framework to Investigate the Performance of EBDR 594.1 Introduction . . . . . . . . . . . . . . . . . . . . . . . . . . . . . . . . 594.2 State of the Art . . . . . . . . . . . . . . . . . . . . . . . . . . . . . . 604.3 Problem Statement . . . . . . . . . . . . . . . . . . . . . . . . . . . . 624.4 Probability of Success . . . . . . . . . . . . . . . . . . . . . . . . . . 63
4.4.1 Analytical Model . . . . . . . . . . . . . . . . . . . . . . . . . 63

CONTENTS xi
4.4.2 Model Validation . . . . . . . . . . . . . . . . . . . . . . . . . 664.5 Average Number of Hops . . . . . . . . . . . . . . . . . . . . . . . . . 69
4.5.1 Analytical Model . . . . . . . . . . . . . . . . . . . . . . . . . 694.5.2 Model Validation . . . . . . . . . . . . . . . . . . . . . . . . . 73
4.6 Conclusion . . . . . . . . . . . . . . . . . . . . . . . . . . . . . . . . . 77
5 Broadcast-based directional Routing scheme for VANETs with Trans-
mission Range Adjustment 785.1 Introduction . . . . . . . . . . . . . . . . . . . . . . . . . . . . . . . . 785.2 Problem Statement . . . . . . . . . . . . . . . . . . . . . . . . . . . . 795.3 State of the Art . . . . . . . . . . . . . . . . . . . . . . . . . . . . . . 805.4 Proposed Technique . . . . . . . . . . . . . . . . . . . . . . . . . . . . 83
5.4.1 Design Goal . . . . . . . . . . . . . . . . . . . . . . . . . . . . 835.4.2 Broadcasting Scheme . . . . . . . . . . . . . . . . . . . . . . . 845.4.3 Transmission Range Adjustment Technique . . . . . . . . . . . 84
5.5 Evaluation Study . . . . . . . . . . . . . . . . . . . . . . . . . . . . . 855.5.1 Proposed Technique in Real Vehicular Road Network . . . . . 865.5.2 Proposed Technique in an Uniform Node Distribution Scheme 90
5.5.2.1 Simulation Results . . . . . . . . . . . . . . . . . . . 915.5.2.2 Analytical Model for the Transmission Area . . . . . 93
5.6 Conclusion . . . . . . . . . . . . . . . . . . . . . . . . . . . . . . . . . 97
6 Adaptive Data Collection Protocol using Reinforcement Learning
for VANETs 986.1 Introduction . . . . . . . . . . . . . . . . . . . . . . . . . . . . . . . . 986.2 State of the Art . . . . . . . . . . . . . . . . . . . . . . . . . . . . . . 996.3 ADOPEL: Proposed Collection Technique . . . . . . . . . . . . . . . 102
6.3.1 System Specifications . . . . . . . . . . . . . . . . . . . . . . . 1026.3.2 Protocol Design . . . . . . . . . . . . . . . . . . . . . . . . . . 103
6.3.2.1 Distributed Qlearning in ADOPEL . . . . . . . . . . 1036.3.2.2 Exploration vs Exploitation: . . . . . . . . . . . . . . 1066.3.2.3 ADOPEL Algorithm Overview . . . . . . . . . . . . 107
6.4 Performance Evaluation . . . . . . . . . . . . . . . . . . . . . . . . . 1106.4.1 Simulation Design . . . . . . . . . . . . . . . . . . . . . . . . . 1106.4.2 Simulation Results . . . . . . . . . . . . . . . . . . . . . . . . 111
6.5 Conclusion . . . . . . . . . . . . . . . . . . . . . . . . . . . . . . . . . 115
7 Conclusion and Ongoing Work 1167.1 Conclusion . . . . . . . . . . . . . . . . . . . . . . . . . . . . . . . . . 1167.2 Future Directions . . . . . . . . . . . . . . . . . . . . . . . . . . . . . 118
Bibliography 118

CONTENTS xii
Appendix 130
A Resume de These 131A.1 Introduction generale . . . . . . . . . . . . . . . . . . . . . . . . . . . 131A.2 Analyses des Contributions de la these . . . . . . . . . . . . . . . . . 134
A.2.1 Approche de dissemination directionnelle basee sur le broadcast 134A.2.1.1 Algorithme de guidage routier . . . . . . . . . . . . . 134A.2.1.2 Approche de diffusion . . . . . . . . . . . . . . . . . 135A.2.1.3 Resultats . . . . . . . . . . . . . . . . . . . . . . . . 135
A.2.2 Framework Analytique pour l’evaluation de EBDR . . . . . . 137A.2.2.1 Probabilite de succes . . . . . . . . . . . . . . . . . . 137A.2.2.2 Nombre de sauts requis . . . . . . . . . . . . . . . . 138
A.2.3 Technique d’ajustement de la puissance de transmission pourEBDR . . . . . . . . . . . . . . . . . . . . . . . . . . . . . . . 140A.2.3.1 Evaluation de performances . . . . . . . . . . . . . . 141
A.2.4 Technique de collecte de donnees dans VANETs . . . . . . . . 142A.3 Conclusion & Perspectives . . . . . . . . . . . . . . . . . . . . . . . . 144

List of Figures
2.1 An overview of a VANET network . . . . . . . . . . . . . . . . . . . . 82.2 Different equipments present on a VANET vehicle . . . . . . . . . . . 82.3 Example of road networks . . . . . . . . . . . . . . . . . . . . . . . . 92.4 VANETs projects . . . . . . . . . . . . . . . . . . . . . . . . . . . . . 112.5 CALM architecture . . . . . . . . . . . . . . . . . . . . . . . . . . . . 132.6 ITS architecture . . . . . . . . . . . . . . . . . . . . . . . . . . . . . . 142.7 WAVE architecture . . . . . . . . . . . . . . . . . . . . . . . . . . . . 152.8 Hazardous location warning scheme . . . . . . . . . . . . . . . . . . . 172.9 Vehicle 2 Vehicle Cooperative Awareness . . . . . . . . . . . . . . . . 182.10 Sign extension alert . . . . . . . . . . . . . . . . . . . . . . . . . . . . 182.11 Road congestion alert . . . . . . . . . . . . . . . . . . . . . . . . . . . 192.12 Merging assistance application . . . . . . . . . . . . . . . . . . . . . . 202.13 VANET comfort applications . . . . . . . . . . . . . . . . . . . . . . 20
3.1 Directional antenna model . . . . . . . . . . . . . . . . . . . . . . . . 363.2 Road map representation . . . . . . . . . . . . . . . . . . . . . . . . . 373.3 Packet structure . . . . . . . . . . . . . . . . . . . . . . . . . . . . . . 383.4 Directional Broadcast in VANETs . . . . . . . . . . . . . . . . . . . . 393.5 Packet propagation mechanism . . . . . . . . . . . . . . . . . . . . . 403.6 Simulation framework . . . . . . . . . . . . . . . . . . . . . . . . . . 423.7 Road topology . . . . . . . . . . . . . . . . . . . . . . . . . . . . . . . 443.8 Implicated Nodes in the transmissions for the 2 approaches . . . . . . 453.9 Simulated values of probability of success . . . . . . . . . . . . . . . . 463.10 Effect of distance on the broadcasting operation . . . . . . . . . . . . 473.11 Ratio of implicated nodes: Comparison overview . . . . . . . . . . . . 483.12 Broadcast delay: Comparison overview . . . . . . . . . . . . . . . . . 483.13 Network topology and distribution of implicated nodes in the trans-
missions . . . . . . . . . . . . . . . . . . . . . . . . . . . . . . . . . . 523.14 Ratio of implicated nodes . . . . . . . . . . . . . . . . . . . . . . . . 523.15 Gain in bandwidth . . . . . . . . . . . . . . . . . . . . . . . . . . . . 533.16 Probability of transmission success (d = 1000m) . . . . . . . . . . . . 543.17 Probability of transmission success (d = 2000m) . . . . . . . . . . . . 54
xiii

LIST OF FIGURES xiv
3.18 Probability of transmission success (d = 3000m) . . . . . . . . . . . . 553.19 Area of transmission . . . . . . . . . . . . . . . . . . . . . . . . . . . 563.20 Comparison between the theoretical and practical values of the impli-
cated nodes ratio for different densities . . . . . . . . . . . . . . . . . 573.21 Relative simulation results . . . . . . . . . . . . . . . . . . . . . . . . 57
4.1 Linear propagation scheme . . . . . . . . . . . . . . . . . . . . . . . . 624.2 One dimension Broadcasting scheme . . . . . . . . . . . . . . . . . . 644.3 Precision of the probability model varying the density of vehicles . . . 674.4 Effect of distance on the broadcasting operation . . . . . . . . . . . . 684.5 Effect of distance on the probability of success . . . . . . . . . . . . . 684.6 Probability of success when varying the parameter b . . . . . . . . . . 694.7 The average number of hops: Simulation vs. analytical results using
Theorem 1 and varying d . . . . . . . . . . . . . . . . . . . . . . . . . 714.8 The average number of hops: Simulation vs. analytical results varying
λ . . . . . . . . . . . . . . . . . . . . . . . . . . . . . . . . . . . . . . 744.9 Precision of the average number of hops model varying the density of
vehicles λ . . . . . . . . . . . . . . . . . . . . . . . . . . . . . . . . . 744.10 The average number of hops: Simulation vs. analytical results varying
d . . . . . . . . . . . . . . . . . . . . . . . . . . . . . . . . . . . . . 754.11 Effect of b variation in the average number of hop model . . . . . . . 764.12 Precision of the average number of hops model varying the parameter
b (d = 2000 m) . . . . . . . . . . . . . . . . . . . . . . . . . . . . . . 76
5.1 Implicated Nodes in the forwarding process for the 2 approaches . . . 875.2 Power transmission gain . . . . . . . . . . . . . . . . . . . . . . . . . 885.3 Ratio of implicated nodes: Comparison overview . . . . . . . . . . . . 895.4 Probability of transmission success: Comparison overview . . . . . . . 905.5 Uniform distribution: Implicated nodes for the 2 approaches . . . . . 915.6 Power transmission gain . . . . . . . . . . . . . . . . . . . . . . . . . 925.7 Effect of d on the the probability of success . . . . . . . . . . . . . . . 925.8 Forwarding shape with dynamic transmission range . . . . . . . . . . 935.9 Similar triangles . . . . . . . . . . . . . . . . . . . . . . . . . . . . . . 945.10 Comparison between the theoretical and practical values of the impli-
cated nodes . . . . . . . . . . . . . . . . . . . . . . . . . . . . . . . . 97
6.1 ADOPEL functioning Overview . . . . . . . . . . . . . . . . . . . . . 1036.2 ADOPEL algorithm overview . . . . . . . . . . . . . . . . . . . . . . 1096.3 ADOPEL Simulation framework . . . . . . . . . . . . . . . . . . . . . 1106.4 The average data collect ratio: ADOPEL vs Non-learning versions . . 1126.5 The average number of hops: ADOPEL vs Non-learning versions . . . 1126.6 Effect of the variation of dcollect on the ratio of collected packets . . . 1136.7 Effect of the variation of dcollect on the number of hops . . . . . . . . 114
A.1 Structure du paquet a transmettre . . . . . . . . . . . . . . . . . . . 134A.2 Diffusion directionnelle dans VANETs . . . . . . . . . . . . . . . . . . 135A.3 Variation de la probabilite de succes en fonction de la densite des nœuds136

LIST OF FIGURES xv
A.4 Impact de la distance sur la propagation du paquet . . . . . . . . . . 136A.5 Regime de propagation lineaire dans VANETs . . . . . . . . . . . . . 137A.6 Precision du modele de probabilite en variant la densite de vehicules . 138A.7 Le nombre moyen de sauts: Simulation vs resultats analytiques en
variant λ . . . . . . . . . . . . . . . . . . . . . . . . . . . . . . . . . 139A.8 Le nombre moyen de sauts: Simulation vs resultats analytiques en
variant d . . . . . . . . . . . . . . . . . . . . . . . . . . . . . . . . . . 140A.9 Gain en puissance de transmission . . . . . . . . . . . . . . . . . . . . 141A.10 Comparaison entre les valeurs theoriques et de simulation des nœuds
impliques . . . . . . . . . . . . . . . . . . . . . . . . . . . . . . . . . 142A.11 Taux moyen de collecte de donnees: ADOPEL vs les versions non-
learning . . . . . . . . . . . . . . . . . . . . . . . . . . . . . . . . . . 143

List of Tables
3.1 Simulation Parameters . . . . . . . . . . . . . . . . . . . . . . . . . . 44
5.1 Simulation Configurations . . . . . . . . . . . . . . . . . . . . . . . . 87
xvi

Chapter 1
Introduction
1.1 Motivations
Since the mists of time, man tries to make his journeys safer and more pleasant.
Today, technical and cultural evolutions do not alter this need for road safety and
smooth driving since human beings travel faster and farther. Therefore, during the
last decades, public authorities and automotive companies have been involved in the
improvement of the safety of our transportation systems by reducing the consequences
of imminent accidents and decreasing the number of injuries on the road.
Nevertheless, most of these preventive measures (if not all) can only provide pas-
sive and limited security since they focus on the stage post accidents. In fact, tools
like airbags and seat-belt tighteners lessen the impact of an accident but do not pre-
vent it. This recognition of the inadequacy of these passive measures has directed
the industrials to new and innovative perspectives that seek to avoid accidents and
detect dangers in advance rather than minimize the damage. Drastic steps are al-
ready taken by automobile manufacturer to offer to drivers a larger telematic horizon
and therefore enhance their range of awareness. If a collision is inevitable, active
safety technology can proactively prepare the vehicle for the impact to reduce in-
juries. For example, sensors, present on the vehicles, are employed to measure and
assess a vehicle’s condition and environment, enabling the issuance of early warnings
to drivers.
On the other hand, a remarkable and similar step in that direction is achieved by
the networking research community by the emergence of vehicular networks, namely
VANETs 1. These adhoc cooperative safety networks leverage wireless communication
1Vehicular Adhoc NETworks
1

1.1 Motivations 2
between vehicle nodes to continuously exchange messages with other moving cars
in their proximity, and hence collect and share pieces of information about their
surrounding environment. Thus, based on this context information and this larger
telematic horizon offered to drivers, potential dangers can be detected in early stages
and appropriate counter-measures can be initiated.
Given the unique capabilities of these smart vehicles and their potential impact on
the road safety and driver awareness, the attention of car manufacturers, governments,
and research institutions is with merit. Actually, many projects of national and
international scale are under way worldwide aiming at developing efficient vehicular
communication solutions for commercial use. VANETs promising applications are
not only restricted to road safety but span from vehicle traffic optimization like flow
congestion control, route optimization to commercial applications like file sharing,
internet access and parking free places reporting.
Most of the applications envisioned for VANETs rely on multihop broadcast-
based approaches to disseminate a message to a specific destination or geographic
zone. Once an emergency situation occurs, it is vital to inform surrounding drivers as
well as those who are farther as soon as possible. This situation needs practically a
multihop forwarding operation of the message. Moreover, data broadcast is not only
needed for road-safety scenarios but also for route and resource discovery services
through periodic beaconing between vehicles.
So far, the topic of vehicle communications and broadcasting has been largely
studied. A large number of dissemination techniques tailored to VANETs have been
carried out. Most of them, are too complex for the context and the purpose of
vehicular safety applications which required a simple conception and implementation
to feet the network performances required by safety vehicular schemes. In addition,
the mathematical aspect has only been studied by a small number of proposals present
in literature in which theoretical-based evaluation performance model has usually
been ignored.
In this thesis, we are interested on enhancing vehicular communications under
different scenarios and optimizations. Our contributions span from broadcast-based
routing technique, to transmission power improvement (MAC congestion control)
and finally data collection schemes. Each of these contributions focus on a particular
research field of the VANET world and tries to address the relevant challenges of
nowadays VANET studies.

1.2 Contributions 3
1.2 Contributions
The main contributions of these thesis are summarized below:
• Broadcast-based Routing technique for VANETs using Directional
Antennas: This part of the thesis focuses on designing a novel broadcast-
based routing technique for VANETs. The main goal is to reduce interferences
between nodes and achieve lower end-to-end delays while remaining at the same
time a simple approach . Therefore, our proposed technique EBDR uses direc-
tional antennas to achieve the broadcast transmission and is based on a route
guidance algorithm to choose the path toward the destination. Simulations re-
sults confirm the efficiency of our proposal in terms of end-to-end delays and the
probability of transmission success. Moreover, in spite of the broadcast nature
of the proposed technique, all transmissions stop very soon after the arrival of
a packet to its destination.
• Analytical framework dedicated to investigate EBDR performances:
The main goal behind this contribution is to investigate the performance of our
proposed broadcast-based routing approach analytically. In fact, most of the
proposed techniques present in literature use experimental or simulation tools
to defend their performance and do not rely on mathematical models to confirm
the achieved results: A phenomenon that explains the scanty efforts made in
analytical modeling field. As a humble effort to enrich these research studies, our
proposed framework allows deriving meaningful performance metrics including
the probability of transmission success as well as the required number of hops
to reach the final destination in the case of a linear propagation.
• Broadcast-based directional Routing scheme for VANETs with Trans-
mission Range Adjustment: Enhancing the communication mechanism pre-
sented in the first contribution is the key purpose of this third effort. For that
purpose, we investigate one of the known MAC layer congestion control mech-
anisms which is the power transmission control. In fact, power control has an
important impact on the number of hidden terminals and the interferences be-
tween adjacent nodes. Hence, this mechanism can increase the reliability of
communications and at the same time preserve the network bandwidth. We
propose here a fully distributed scheme that allows nodes to set their transmis-
sion range based on their local densities and the distance to the destination.

1.3 Organization of the Thesis 4
Furthermore, an analytical model is derived to calculate the transmission area
in the case of a simplified node distribution.
• Adaptive Data Collection Protocol using Reinforcement Learning for
VANETs: As any research field, there is a lot of work being done on data col-
lection techniques since they make inter-vehicle communications more efficient
and reliable and minimize the bandwidth utilization. Nevertheless, our pro-
posal stands as one of the few efforts that use Q-learning technique to collect
data among moving vehicles in VANETs. The aim behind using the learning
technique is to make the collecting operation more reactive to nodes mobility
and topology changes.
1.3 Organization of the Thesis
The thesis is structured in the following way. First, an overview of the special char-
acteristics of vehicular communications and an in-depth description of the standards
and projects dedicated to promote vehicular networks are detailed in chapter 2.
Chapter 3 presents the design of our Enhanced Broadcast-based Routing Protocol
(EBDR) and describes its operating principles. Simulation results are provided to
evaluate the performance of our technique. The content of this work is published
in [1].
A novel mathematical framework to investigate analytically the performance of
broadcast-based routing technique EBDR is presented in Chapter 4. It focuses on
two main metrics: the probability of success for information to travel to a known
destination and the required number of hops. In the models, recursive formulations
are derived for the two previous criteria. Lower and upper bounds for our models are
provided and computed by dynamic programming techniques. A comparison between
simulations and analytical results is provided to confirm the precision of our bounds.
This work was published in [2]
Minimizing the inherent effects of high transmission power in vehicular networks is
studied in chapter 5. We first highlight the related work that addresses the transmis-
sion range assignment techniques on a multihop wireless networks and then provide a
full specification of our transmission range adjustment technique devoted to VANETs.
Our proposal is extensively evaluated in real road network-based simulations. In ad-
dition, the technique is evaluated using a simplified node distribution scheme, suitable

1.3 Organization of the Thesis 5
to mobile adhoc network and an analytical model is derived to calculate the trans-
mission area. Some contents of this chapter are published in [3].
Chapter 6 develops our proposed data collection technique devoted to VANETs.
The first section explores the most relevant strategies for data collection in the context
of VANETs and details the motivation behind the use of such techniques. Then, we
introduce our proposed Q-learning-based approach, present the functionalities and
provide simulation results. The content of this chapter was published in [4]
Chapter 7 concludes the thesis with a discussion of open issues and future work
concerning inter-vehicle communications in VANETs. This is followed by a list of our
publications and the bibliography.
Chapter 2
Vehicular Adhoc Networks: The big picture
Contents
2.1 Introduction . . . . . . . . . . . . . . . . . . . . . . . . . . 6
2.2 Vehicular Networks . . . . . . . . . . . . . . . . . . . . . . 7
2.2.1 Definition . . . . . . . . . . . . . . . . . . . . . . . . . . . . 7
2.2.2 General Characteristics . . . . . . . . . . . . . . . . . . . . 8
2.2.3 Related Projects . . . . . . . . . . . . . . . . . . . . . . . . 10
2.2.4 Proposed Architectures and Related Protocols . . . . . . . 12
2.3 VANETs Applications . . . . . . . . . . . . . . . . . . . . . 16
2.3.1 Safety Applications . . . . . . . . . . . . . . . . . . . . . . . 17
2.3.2 Traffic Related Applications . . . . . . . . . . . . . . . . . . 18
2.3.3 Infotainment Applications . . . . . . . . . . . . . . . . . . . 21
2.4 Conclusion . . . . . . . . . . . . . . . . . . . . . . . . . . . 21
2.1 Introduction
Over the last few years, the continuous advances achieved in wireless communica-
tions technologies have yielded to a plethora of new networking research fields aiming
at extending connectivity to environments where wired solutions are not feasible.
As such, Vehicular Adhoc NETworks (VANETS) stand as one of the most attracting
and promising research field for researchers, automotive companies and public govern-
ments given their commitment to providing safer roads and smooth driving. VANETs
6

2.2 Vehicular Networks 7
promising applications are not only restricted to road safety but span from vehicle
traffic optimization like flow congestion control, route optimization to commercial
applications like file sharing, internet access and parking free places reporting.
We provide in this chapter the concepts of vehicular networks by presenting the
different communication types and the main components of these networks. Then, we
give insight into ongoing worldwide projects which are contributing to the promotion
of VANETs. The last part, will give an overview about the different networking
architectures proposed to support such kind of networks.
2.2 Vehicular Networks
Vehicular adhoc networks are considered as an off-shoot of dynamic multihop wire-
less networks. Indeed, vehicles equipped with wireless radio interfaces are able to
communicate with their direct neighbor provided that these latter are within their
radio transmissions range. In addition, two communicating nodes that are far away
from each other may rely on intermediate nodes to relay messages or may use a set
of stationary units along the road called Road Side Units (RSUs). VANETs share
several characteristics with general MANETs1 [8], however, there are some important
differences. In the following, we detail their characteristics as well as the different
standardization efforts in this field.
2.2.1 Definition
Vehicular networks, or VANETs, are considered as a form of MANETs, deployed to
provide communication within a group of intelligent vehicles (Smart vehicles). Vehi-
cles can communicate either with other moving vehicles using V2V2 communications
or with fixed network nodes placed alongside the road (V2I3 communications), called
road-side units (RSUs) (see Figure 2.1). RSUs provide moving vehicles with access to
an infrastructure network, as well as infrastructure-based services. Road-side units
can be placed next to the road in regular intervals, or be integrated in existing road
infrastructures, e.g. road signs, bridges, or toll gates as shown by Figure 2.1 [21].
To be part of such a network, a vehicle must be equipped with computational tools
(Computing platform), wireless communications devices and geographic positioning
1Mobile Adhoc Network2Vehicle to Vehicle3Vehicle To Infrastructure

2.2 Vehicular Networks 8
Figure 2.1: An overview of a VANET network
systems (GPS4 Positioning System) [5] allowing to handle communication, collect
sensor data, and process incoming and outgoing information. The vehicle can still
ship optional sensors to advertise accidents. Figure 2.2 shows some of the equipments
necessary to deploy such a vehicular network.
Figure 2.2: Different equipments present on a VANET vehicle
2.2.2 General Characteristics
VANETs are similar to MANETs since both of them support adhoc communications
between mobile nodes in dynamic network scenarios. Nevertheless, research studies
and achievements carried out in the field of MANETs can not be directly applied
4Global Positioning System

2.2 Vehicular Networks 9
in the context of vehicular networks since these latter present unique features and
specificities [6] [7]. Here are some properties that distinguish vehicular networks:
• Network topology and density: Unlike adhoc networks, VANETs are char-
acterized by high mobility caused by highly mobile vehicles. In fact, a node
can join and leave the network in a very short time, which makes the topology
changing frequently. In addition, issues of scaling must be included in the solu-
tions because the network can become very large. In addition, network density
in VANETs can vary from a very dense network (urban case) to a sparse node
distribution (rural case, very late night hour). If the connectivity between cars
is guaranteed in the first case, it becomes a rare phenomenon for the latter
case [9] [10]. Thus, VANET protocols have to tackle these density variation
challenges to perform well.
• Mobility model and network distribution: Environments in ad hoc net-
works are often limited to open spaces. In VANETs, the topology is dynamic
but it is not completely random because the distribution of moving vehicles is
generally along roads (streets, highways) as illustrated by Figure 2.3. In fact,
mobility of vehicles is somewhat restricted by predefined roads, as well as the
direction and the number of lanes [11].
Figure 2.3: Example of road networks
The trajectories can be predictable in advance and the environment may be
urban, rural or motorway. The constraints imposed by this type of environment,
namely obstacles, traffic lights and speed limits, affect severely the mobility
model and the variance of vehicles density. Hence, applications and routing
proposals must take into account these specificities.

2.2 Vehicular Networks 10
• Scalability: VANETs have the potential to grow to a very huge scale specially
in urban areas where intersections and multi-lane roads are frequent. Hence,
VANET protocols, especially those based on a dissemination process, have to
face the large number of possible wireless collisions and interferences between
nodes during transmissions [12].
• Processing and energy capacities: In contrast with other nodes in adhoc
networks, moving vehicles supply, generally, sufficiently high electric and com-
puting power. Therefore, the energy consumption, is a secondary factor in
VANETs. In addition, each vehicle is equipped with an on-board unit (OBU)
that executes a single or a set of applications and supports a multitude of
wireless technologies used to communicate such as WIFI5 [13], WiMax6 [14],
GSM7 [15], Bluetooth [16], etc.
• Security and anonymity in the network: Data security and privacy stands
as a major challenging problem in VANETs. Indeed, wireless communication,
which is used in VANETs, is very vulnerable due to the fact that attacks can be
played without requiring physical access to network infrastructure. Therefore,
it is essential to design VANETs as robust as possible and secure them against
attacks [17] [18].
2.2.3 Related Projects
A large number of projects have been driven by institutions from all around the
world. For instance, in 1992, the IVHS8 of United States has committed its industries
as well as the U.S transportation department to develop a national strategic plan to
promote Intelligent Transportation Systems (ITS). Then in 1999, United States FCC9
allocated a bandwidth of 75 MHz for inter-vehicles communications generally referred
as DSRC10. Currently, as shown by Figure 2.4 many research activities, development
and standardization of automotive communication are in progress.
In Europe, many research projects are beginning to form the basis of an intelligent
transportation system.
5Wireless Fidelity6Worldwide Interoperability for Microwave Access7Global System for Mobile Communications8The Intelligent Vehicle Highway System9Federal Communications Commission
10Dedicated Short Range Communications

2.2 Vehicular Networks 11
Figure 2.4: VANETs projects
• Car2Car Consortium [19]: an international project, strongly supported by
the Car to Car Communication Consortium (C2C-CC) and by the European
Telecommunications Standards Institute (ETSI). This project aims at improv-
ing road safety and effectively managing traffic through the use of inter-vehicle
communications. The main tasks of the consortium communication Car2Car
are:
1. Creation of an open European standard for V2V communications based
on wireless devices.
2. Development of V2V prototypes and demonstrator systems for road safety
applications.
3. Deployment strategies and business models for market penetration.
• SAFESPOT [20]: is interested in cooperative systems for road safety to pre-
vent accidents by detecting potentially dangerous situations. The communica-
tion mode uses the future IEEE 802.11p [37].
• CVIS [21]: European research project aiming at designing, developing and
testing the technologies needed to enable cars to communicate with each other
and with the road infrastructure unit present in their neighborhood.
• SeVeCom [22]: This project focuses on the security of future vehicular net-
works, including safety and anonymity of the vehicle-to-vehicle and Vehicle to
Infrastructure communications.

2.2 Vehicular Networks 12
• Projects in Japan: In the late 1980’s, the public research institute of the Min-
istry of Construction launched the development of a Road Automobile Com-
munication System (RACS) [23] jointly with several industrial partners. The
main goal behind this project was to establish a system composed of: a naviga-
tion system, an information system and an individual communication system.
With years, many other projects were launched aiming at providing safer roads.
For example, in 1996, VICS11 [24] demonstrated successfully a dynamic route
guidance technique. In addition, the Ministry of Construction and four express-
way public corporations introduced Electronic Toll Collection (ETC) project in
Japan. This group, initiated in 1995, has as main goal to promote ETC research
studies. On March 30th 2001, with more than 63 tollgates installed in several
areas of the country, the ETC service was functioning and offering its services to
drivers. The main goals of this project are : the alleviation of traffic congestion
near tollgates and eliminating the need to handle cash by drivers.
• Projects in USA: A reference Project in USA was called Automated High-
way System (AHS) [25] in the early 90’s by the National Automated Highway
System Consortium (NAHCS) [26]. The goal was to reduce highway crashes
and their tragic consequences and help drivers avoid congestion roads. Another
project related to cooperative assistance systems was initiated in the years 1998
to 2005 and is called Intelligent Vehicle Initiative (IVI) [27]. It aims at offer-
ing a cooperative active safety between moving vehicles and specially develop
”human-centered” transportation systems. With these latter systems, intelli-
gent vehicles will have the ability to give route directions to drivers and warn
them from imminent collisions. They even aim at being able to take over driving
in some situations.
2.2.4 Proposed Architectures and Related Protocols
Many organizations are involved in the standardization effort of vehicular technologies
and their networking architectures. Communication architectures are usually based
on the layered OSI-model. For VANETs, each category of applications requires dif-
ferent exigences in terms of delay, bandwidth consumption and QoS12. For instance,
safety-critical applications [28] require strict latency and reliability requirements. On
11Vehicle Information and Communication System12Quality of Service

2.2 Vehicular Networks 13
the other hand, infotainment applications are characterized by a huge bandwidth
consumption. This variety of needs and requirements has led to proposing different
new architectures offering different network access technologies, addressing schemes
and protocols.
In the following sections, we will try to give an overview of the various proposed
architectures and related protocols:
• CALM architecture [29]: This architecture is proposed by the worldwide
ISO [30] TC204/WG16 and it stands for Continuous Air-Interface, Long and
Medium Range. The CALM main goal is to develop a standardized networking
protocols stack that is capable of connecting vehicles and roadside systems
continuously and seamlessly. Thus, CALM provides, as described by Figure
2.5, a multitude of communication media such as the cellular (GSM, UMTS13,
etc), mobile, and WIFI networks and the DSRC [31] or infrared (IR [32]).
Figure 2.5: CALM architecture
This reuse of the already existent communication media can be explained by
the fact that CALM wanted to use the predefined standards without resorting
to define new standards (re-usability). For the routing issue, CALM uses IPv6
as a routing protocol with media handover. Several projects are implicated in
the development of the CALM concept such as SAFESPOT and CVIS.
13Universal Mobile Telecommunications System

2.2 Vehicular Networks 14
• ITS architecture [33]: This architecture (see Figure 2.6) is supported and
maintained by the European Telecommunications Standards Institute (ETSI)
[34] aiming at developing standards and specifications for ITS services. This
framework is composed of four vertical layers (application, facilities, networking
& transportation, access to medium) with two vertical planes: management and
safety plans. For the network routing, ITS uses TCP/UDP and the ITS trans-
port protocol which is defined to support the vehicle to vehicle communication
in very dynamic and hostile network like VANET.
Figure 2.6: ITS architecture
Facilities layer is a new paradigm introduced by ETSI and its main functional-
ities are the fusion and maintenance of different collected data. Another task
supported by this block is to continuously update the geographic dynamic map
(LDM14) so that it can be used by applications. This map reflects the dynamic
events occurring on the road.
• WAVE architecture [94]: The IEEE [36] has developed the standards IEEE
P1609.1, P1609.2, P.1609.3 and P.1609.4 for vehicular networks giving birth
to the WAVE architecture (see Figure 2.7). The architectural ideas comes
from the internationally agreed standard Dedicated Short-Range Communica-
tion (DSRC).
14Local Dynamic Map
2.2 Vehicular Networks 15
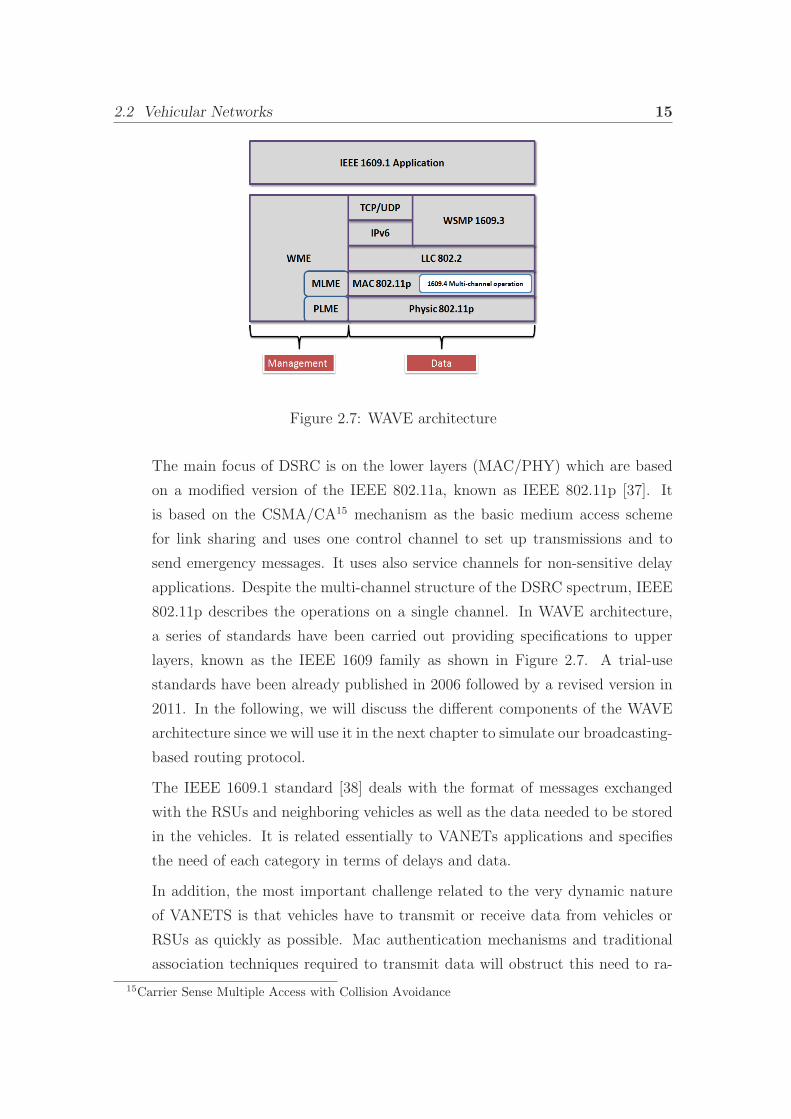
Figure 2.7: WAVE architecture
The main focus of DSRC is on the lower layers (MAC/PHY) which are based
on a modified version of the IEEE 802.11a, known as IEEE 802.11p [37]. It
is based on the CSMA/CA15 mechanism as the basic medium access scheme
for link sharing and uses one control channel to set up transmissions and to
send emergency messages. It uses also service channels for non-sensitive delay
applications. Despite the multi-channel structure of the DSRC spectrum, IEEE
802.11p describes the operations on a single channel. In WAVE architecture,
a series of standards have been carried out providing specifications to upper
layers, known as the IEEE 1609 family as shown in Figure 2.7. A trial-use
standards have been already published in 2006 followed by a revised version in
2011. In the following, we will discuss the different components of the WAVE
architecture since we will use it in the next chapter to simulate our broadcasting-
based routing protocol.
The IEEE 1609.1 standard [38] deals with the format of messages exchanged
with the RSUs and neighboring vehicles as well as the data needed to be stored
in the vehicles. It is related essentially to VANETs applications and specifies
the need of each category in terms of delays and data.
In addition, the most important challenge related to the very dynamic nature
of VANETS is that vehicles have to transmit or receive data from vehicles or
RSUs as quickly as possible. Mac authentication mechanisms and traditional
association techniques required to transmit data will obstruct this need to ra-
15Carrier Sense Multiple Access with Collision Avoidance

2.3 VANETs Applications 16
pidity. Thereby, with WAVE, a vehicle does not require MAC authentication
and association to send/receive messages. It only needs to receive the announce-
ment of a RSU before starting its transmissions. The IEEE 1609.2 standard [39]
describes these security mechanisms needed in a vehicular environment.
The IEEE 1609.3 standard [40] describes the WAVE Short Messages Protocol
(WSMP) which replaces the TCP/IP stack and supports application priorities
which mean that high priority data will be sent with minimum latency. The
special message WSM can be transmitted on both CCH16 and SCH17 channels.
WAVE supports both IP and non-IP based applications. Non safety applications
can use only the service channel SCH.
Mac and physic layers are defined by the IEEE 1609.4 standard [41]. it defines
the multi-channel coordination and describes the prioritization mechanism be-
tween different traffics. It envisions the presence of a single Control CHannel
(CCH), reserved for system control and safety messages, and up to 6 Service
CHannels (SCHs) used to transmit non-safety data messages. According to the
multi-channel coordination mechanism, all vehicles have to monitor the CCH
during common time intervals and to switch to one SCH channel if they want
to transmit non safety messages. Synchronization between nodes is achievable
with the Global Positioning System (GPS) interfaces present in most moving
vehicles.
2.3 VANETs Applications
Vehicular communications offer great potential for increasing road safety and driver
awareness. In fact, according to relevant studies, 60% of accidents can be avoided
if the driver had been alerted half a second before the collision [42]. Nevertheless,
benefits are not restricted to safety standpoint but span to further horizons making use
of a plethora of cooperating technologies. In fact, VANET applications can be divided
into three categories: safety, traffic coordination and infotainment applications. In
the following, we only concentrate on some key schemes of each category.
16Control Channel17Service Channel

2.3 VANETs Applications 17
2.3.1 Safety Applications
These applications aim to minimize accidents and enhance driving safety by provid-
ing drivers and passengers with useful information including collision warning, fatal
outcome, alarm of approaching vehicle, road sign alarms, etc. This category of appli-
cations is time-critical and so imposes strict real-time requirements on the proposed
communications techniques. Among the scenarios belonging to this category, we can
cite:
• Hazardous location warning: This application, as shown by Figure 2.8, pro-
vides information about events and roadway characteristics that are interesting
to vehicles, drivers and passengers for a certain time and a specific area with
sufficient anticipation.
Figure 2.8: Hazardous location warning scheme
These locations generally denote a slippery road, a sharp turn on the road, or a
work zone. RSUs, present on these zone, cluster, prioritize, and distribute alert
messages to vehicles entering the relevant area (the area on which the alert is
valid).
• Vehicle 2 Vehicle Cooperative Awareness: Vehicles share information
by broadcasting or geocasting data to all surrounding neighbors or to vehi-
cles within a geographic region. A Vehicle will execute an algorithm to assess
the threat of other vehicles or passengers.
As illustrated by Figure 2.9, when a critical situation is detected, the algorithm
warns the driver via visual or auditory displays. Thus, the driver will have

2.3 VANETs Applications 18
Figure 2.9: Vehicle 2 Vehicle Cooperative Awareness
enough time to react and avoid the crash. The alert information is relayed from
node to another till the message reaches the geographic zone.
• Sign extension: As a vehicle approaches a traffic sign, it will receive an infor-
mation regarding the location of the traffic light and the signal timing. Hence,
an algorithm can notify the driver of the optimal speed or simply display a
warning for the driver (see Figure 2.10).
Figure 2.10: Sign extension alert
2.3.2 Traffic Related Applications
Applications in this category utilize vehicular communications to share traffic infor-
mation between vehicles present in the street aiming at optimizing traffic flow and

2.3 VANETs Applications 19
enhancing the driver experience. Several scenarios are proposed for this category,
among which we can mention:
• Intelligent traffic flow control: In this use case (see Figure 2.11), the infras-
tructure is monitoring the streets, collecting traffic data and predicting conges-
tion on roadways throughout a specific geographic region. Afterward, the RSU
sends its expected flow situation to the vehicles traveling through its geographic
zone. Vehicles use this information to alert drivers about expected delays or
better routes that are available due to the traffic conditions [43].
Figure 2.11: Road congestion alert
• V2V Merging Assistance: This use case, illustrated by Figure 2.12, allows
vehicles to join a moving traffic without disrupting the flow of the traffic: When
the driver attempts to merge into the roadway, the vehicle communicates with
adjacent traffic and requests specific maneuvers in order to accomplish a non-
disruptive merge.

2.3 VANETs Applications 20
Figure 2.12: Merging assistance application
Figure 2.13: VANET comfort applications

2.4 Conclusion 21
2.3.3 Infotainment Applications
The main goal of this category of applications (see Figure 2.13) is to provide drivers
with information, advertisements and entertainment during their journey. For exam-
ple, such applications can provide Internet access, custom information services, file
sharing and video streaming [44]. Obviously, these applications are not delay sensitive
applications and can tolerate delays since they are about offering luxury services to
drivers.
2.4 Conclusion
The main goal behind this chapter was to present VANETs networks as a new network
paradigm in the research field. Hence, VANETs emerge as a specialized form of
MANETs with specific requirements related to the specific characteristics of such
networks. A large number of research and standardization efforts have been carried
out during last decades and was briefly presented in this chapter. We have also
described the most important architectures dedicated to vehicular networks with a
special focus on WAVE architecture as it was used as a reference networking stack
in the next chapter. Moreover, we classified vehicular applications based on their
impact on the road traffic and the requirements of each category in terms of delays
and services. We presented for each category some key schemes to well understand
the added value of each category. Next chapter will be dedicated to the presentation
of our first contribution devoted to message dissemination in VANETs.

Chapter 3
Broadcast-based Routing technique for
VANETs using Directional Antennas
Contents
3.1 Introduction . . . . . . . . . . . . . . . . . . . . . . . . . . 23
3.2 Dissemination in VANET: Specific Requirements and
Prerequisites . . . . . . . . . . . . . . . . . . . . . . . . . . 23
3.2.1 Principe and Motivation . . . . . . . . . . . . . . . . . . . . 23
3.2.2 Dissemination Related Challenges . . . . . . . . . . . . . . 24
3.3 State-of-the Art: Techniques for Information Dissemi-
nation in VANETs . . . . . . . . . . . . . . . . . . . . . . . 25
3.3.1 Distance-based Broadcast Protocols . . . . . . . . . . . . . 26
3.3.2 Probability based Broadcast Protocols . . . . . . . . . . . . 30
3.3.3 Neighbor-knowledge-based Protocols . . . . . . . . . . . . . 32
3.4 Proposed Technique: EBDR . . . . . . . . . . . . . . . . . 34
3.4.1 Directional Antenna Model . . . . . . . . . . . . . . . . . . 35
3.4.2 EBDR Conception . . . . . . . . . . . . . . . . . . . . . . . 36
3.4.3 Performance Evaluation . . . . . . . . . . . . . . . . . . . . 42
3.5 Other Application Scenarios of EBDR . . . . . . . . . . . 50
3.5.1 Protocol Design . . . . . . . . . . . . . . . . . . . . . . . . . 50
3.5.2 Results and Analysis . . . . . . . . . . . . . . . . . . . . . . 50
3.6 Conclusion . . . . . . . . . . . . . . . . . . . . . . . . . . . 58
22

3.1 Introduction 23
3.1 Introduction
Vehicular networks are promising safer roads and a smooth driving by implementing
a several number of safety applications. These latter require that their alert infor-
mation is propagated to the concerned vehicles (located in the hazardous zone) with
a little delay and a high reliability. For these reasons, this category of applications
is considered as delay sensitive and broadcast-oriented nature. In order to make this
vision coming true, a plethora of multihop broadcast protocols have been proposed
in the VANET literature.
The focus in this chapter is the challenges related to the dissemination process in
vehicular networks and the different approaches developed to implement such kind of
multihop data exchange between vehicles. In addition, we present our own approach
to design a novel broadcast-based routing technique devoted to VANETs denoted
as EBDR. EBDR combines route guidance technique and directional antennas to
route the packet toward the final destination. The first step computes a path to the
destination. The second phase uses directional antennas to broadcast the message
into the chosen roads. Directional antennas with beamforming technique insures a
minimization in wireless interferences as well as bandwidth consumption since only
nodes located on the beamwidth of the antenna will be concerned by the forwarding
transmission. The main goal behind the route guidance algorithm is to find a path for
a packet to reach the destination. The EBDR protocol is extensively evaluated using
a dedicated VANET simulator and real road maps. We compare and investigate the
performance of our new approach with the flooding technique. Results highlight the
efficiency of our proposal.
3.2 Dissemination in VANET: Specific Require-
ments and Prerequisites
3.2.1 Principe and Motivation
Dissemination traffic information in vehicular networks is a known problem. In con-
trast to routing technique, which usually refers to to the unicast data transmission
from a source to a specific destination [45] [46], traffic information in VANETs has a
broadcast-oriented nature. Thus, it delivers an information to all nodes or a group
of nodes within a certain geographic region. To reach the specified zone, the piece

3.2 Dissemination in VANET: Specific Requirements and Prerequisites 24
of information have to be propagated through the network using multihop relaying.
The main advantage of a broadcasting technique is that it does not depend on the
destination ip address or the path to destination node [47] [48]. This weed out the
problems of routing table maintenance, address resolution and topology management
which are considered as major challenges in very dynamic networks such as VANETs.
3.2.2 Dissemination Related Challenges
3.2.2.1 The Scalability Problem
Referring to the definition given by Neuman in [49], the scalability problem can be
defined as the ability of a network to handle the addition of nodes or network size
without being followed by a system failure or increasing the administrative complex-
ity of the system. In a vehicular context, the increasing number of moving vehicles
has a large impact on the network connectivity as well as the probability of packet
collisions and wireless interferences. For example, in an urban area where the density
of vehicles is very huge, information about traffic jam may be simultaneously detected
by several neighboring nodes. Trying to send out the alert message to other nodes, a
big number of forwarders compete to reserve the channel and hence the probability
of collision increases dramatically. In [50], authors investigate the performance of
some existing multihop protocols in terms of this scalability issue. For that purpose,
they selected four broadcast techniques from the most known classes of dissemina-
tion approaches in VANETs, namely: distance-based method, stochastic broadcast,
Multi-Point Relaying (MPR) and finally Advanced Adaptive Gossiping (AAG). For
the simulation part, they used both ideal and real simulators dedicated to vehicular
environment. Findings underline the efficiency and high adaptivity of both stochastic
and distance-based broadcast protocols to node density in comparison to the other
protocols.
Thus, information broadcast techniques in VANETs must deal with such problems
to perform well in such conditions [51]. Most of works focus on adding probabilistic
and timer-based suppression techniques when relaying the message aiming at decreas-
ing the number of forwarders.
3.2.2.2 Traffic Differentiation
VANET applications, as mentioned before, are classified on three main categories.
Each category has its specific requirements on delay, bandwidth and message priority.

3.3 State-of-the Art: Techniques for Information Dissemination in VANETs 25
Hence, a priority mechanism for safety application must be assigned in order to
respect delay times for alert messages when the source vehicle tries to access the
channel. Moreover, even among alert messages, an order must be established since
emergency situations might have different level of urgency. Thus, priority is not only
application-dependent but also a situation-oriented [52].
3.2.2.3 Trust Issue
Vehicular networks are designed essentially to enhance the road safety by information
exchange between moving nodes. One main consequence, is an inherent trust chal-
lenge to the information provided by vehicles to avoid fake alarm situations. In fact,
a malicious driver may inject false warnings with the purpose of causing accidents or
manipulating road traffic flow information to get rapidly to his destination. For that
reason, a trust mechanism, joint to a broadcast technique, is worth considering to
secure VANET communications [53] [54] [55].
3.3 State-of-the Art: Techniques for Information
Dissemination in VANETs
Most of the applications envisioned for VANETs rely on multihop broadcast-based
approaches to disseminate a message to a specific destination or geographic zone.
Once an emergency situation occurs, it is vital to inform surrounding drivers as well
as those who are farther as soon as possible. This situation needs practically a multi-
hop forwarding operation of the message. The basic dissemination technique used to
achieve broadcast-based vehicular communications is the so-called flooding. Within
this scheme, each node rebroadcasts every received message only once. Obviously,
this can lead to a huge amount of redundant transmissions and numerous collisions.
This phenomenon is known in literature as the broadcast storm problem [56]. This
situation may be aggravated with the increase of node density leading to the scala-
bility problem. Therefore, urgent messages requiring little delay are prevented from
accessing the medium and hence drivers are not informed in time. A good multihop
broadcasting protocol must be able to resolve these issues.
In order to increase the efficiency of broadcast-based vehicular communication and
guarantee reliable transmissions, rather sophisticated approaches have been developed
during last years. These so-called ”intelligent flooding” techniques aim at reducing

3.3 State-of-the Art: Techniques for Information Dissemination in VANETs 26
the number of redundant rebroadcast packets. This is typically achieved by selecting
only a set of nodes to relay the urgent information as opposed to letting each vehicle
rebroadcast it.
Basically, these intelligent flooding techniques can be broadly divided into three
main categories: ”distance based”, ”probability based”, and ”neighbor knowledge
based”. In other studies such as [57] [58], authors classify the existing techniques on
other classes: single-hop and multihop broadcasting, or geocast and unicast broad-
casting. In the following sections, we detail in-depth the relevant proposed approaches
for each category.
3.3.1 Distance-based Broadcast Protocols
The distance-based broadcast protocols are a class of protocol exploiting the knowl-
edge of some geographic information about the destination node to improve the effi-
ciency of the relaying operation. Generally, a different waiting delay, prior to rebroad-
casting, is assigned to each node that has received the alert message. The vehicle with
the shortest waiting delay obtains the highest priority in the rebroadcasting opera-
tion [59] [60] [69] [61] [70] [62] [71] [63] [68] [64] [73]. Typically, this waiting delay is
inversely proportional to the distance between the sender and the relaying node. By
doing so, the packet follows usually the path that maximizes the packet progressing
distance. To tackle the problem of redundant transmissions, other vehicles, waiting
to rebroadcast the message, cancel their sending when they hear that the same in-
formation was sent by another node. Obviously, such protocols assume to know the
position of each vehicle to make the relay decision by using GPS receivers.
In the following, we detail a variety of proposed distance-based broadcast ap-
proaches.
3.3.1.1 The Improved Greedy Traffic-Aware Routing Protocol
In [59], authors propose an intersection-based geographical routing technique for ur-
ban VANET, namely GyTAR. To find a suitable route for the packet to reach the
final destination, GyTAR uses three main mechanisms: 1) a traffic density estimation
mechanism which is based on the traffic information exchanged between moving ve-
hicles. This step needs a segmentation of the roads in adjacent cells where the vehicle
density is locally calculated by a cell leader.
Afterwards, 2) A dynamic selection of the intersections through which the messages

3.3 State-of-the Art: Techniques for Information Dissemination in VANETs 27
will be forwarded is triggered. The selection of these intermediate intersections is
based on a score value. This latter is determined based on the traffic density es-
timation in this road and the curve-metric distance to the destination. Hence, the
intersection with the highest score corresponds to the closet intersection to the final
destination with the highest vehicle density. The final phase corresponds to 3) the se-
lection of the next forwarding node. In this step, the closet vehicle to the destination
intersection will be selected as next hop. In addition, GyTAR uses carry and forward
approach in order to recover from the local maximum. This mechanism of intersec-
tion selection offers a maximum connectivity and thus increases the packet delivery
ratio and at the same time decreases the end-to-end delay. Simulations findings have
proven the efficiency of GyTAR compared to others techniques. However, GyTAR
introduced a small overhead when computing the local density values: the protocol
requires an exchange of the cell density packet (CDP) between groups leaders to have
a big picture of the road density. An analytical model to evaluate their technique will
also strengthen the work carried out by authors.
3.3.1.2 Spatial Distribution and Channel Quality Adaptive Protocol
To deal with the effect of node density and wireless channel quality, Slavik and al.
propose a multihop wireless broadcast scheme for vehicular networks called DADCQ
[61]. This protocol uses the distance heuristic method to select forwarding nodes.
In their proposal, they are interested on the distance to the nearest neighbor from
which a node has received the broadcast message. Their method appeals to the basic
intuition that there is no interest for a vehicle, in terms of additional coverage, to
rebroadcast the message if it is received from one node very close to it. If this distance
is greater than a specific threshold value, then the moving node relays the packet.
In addition, they adapt their decision threshold function to three independent input
parameters: the density of nodes, the node clustering factor and the Rician fading
parameter. The goal is to make this threshold function adaptive to the environmental
conditions. The general expression for the threshold function was:
Dc(N) = Dmax − βeαN
where Dmax, β and α are local parameters that depends on external factors such as
node distribution and channel quality.
The downside of this statistical protocol is that it is stochastic in nature and
cannot be proven to always give full reachability. In fact, the performance of this

3.3 State-of-the Art: Techniques for Information Dissemination in VANETs 28
technique depends heavily on several local parameters as well as node density, spatial
distribution pattern and wireless channel quality. Thus, the guarantee of better global
performance is not generally obvious.
3.3.1.3 TRAck Detection Protocol
Sun, Feng and al. in [62] proposed the TRAck Detection protocol (TRADE) which
classifies the neighboring vehicles into three main categories according to their po-
sition on the road; same road-ahead, same road behind and different road. Then,
the algorithm selects nodes from each group in order to forward safety messages; the
farthest vehicles from same road ahead and same road-behind and all vehicles from
different road are chosen to rebroadcast the alert message. The neighbor GPS infor-
mation can be acquired through beacon or periodical short GPS message exchanges.
The main drawbacks of TRADE protocol is that it requires explicit exchanges of
GPS position information between neighboring nodes which still consumes precious
wireless bandwidth. In addition, this technique assumes using very precise GPS
devices to classify the moving nodes in the three categories specified early which is
not always guaranteed.
3.3.1.4 Zone Based Forwarding Protocol
In [63], authors propose a zone forwarding scheme for information dissemination in
VANETs (ZBF). The proposal tackles the problem of retaining the message in the
target zone for the duration of the effect time. Thus, the algorithm divides the effect
area of the alert message into segments of length the transmission range. A forwarder,
a vehicle which is elected in each segment, is assigned the task of broadcasting the
information to other neighboring vehicles. When the forwarder is about to leave the
zone, a new forwarder will be elected. In fact, during broadcast operation, a vehicle
can be in one of three modes: Receive, Forward, or Relay. In the Forwarding mode,
the vehicle is broadcasting alert message to neighboring nodes. When the Forward is
about to leave its zone, it become a Relay and initiates election of a new forwarder.
Vehicles receiving the broadcasted message are in Receive mode.
Nevertheless, this method can only be applied to highway scenarios and requires
very precise positioning system in order to determine in which zone each vehicle
belongs to. In addition, the proposed technique introduces an important overhead
since it uses three type of messages: Info, Query and a Reply messages to implement
the broadcast mechanism.

3.3 State-of-the Art: Techniques for Information Dissemination in VANETs 29
3.3.1.5 Highway Multihop Broadcast Protocol (HMB)
M.Barradi et al. propose in [64] a new vehicular multihop broadcast protocol called
Highway Multihop Broadcast (HMB) that addresses several issues related to vehicular
environment as well as the broadcast storm, hidden node and reliability problems.
To tackle these challenges, authors make use of a mechanism similar to RTS-CTS1
[65] to prevent hidden node problem called Initial Clear to Broadcast (ICTB) and
Forwarded Clear to Broadcast (FCTB). Regarding the reliability factor, a passive
acknowledgment is simply implemented by identifying every frame by its ID, original
MAC ID and the last sender ID. In fact, when forwarding, the relay nodes update
only last-sender ID. The frame sender hears also the forwarded frame and compares
the frame ID and the last sender ID. The decision to retransmit the message or not
is based on the distance from the source, received signal strength and the speed
deviation between sender and forwarder and the priority of received packets.
However, this proposal is only dedicated to highway scenarios and might encounter
several difficulties in urban schemes. In addition, using the handshake mechanism
introduced an additional overhead in the network with each forwarding operation.
3.3.1.6 Efficient Directional Broadcast Protocol (EDB)
EDB [66] is a distance-based multihop broadcast protocol for VANETs where the
furthest receiver is responsible to forward the packet in the opposite direction where
the packet arrives. Furthermore, EDB exploits directional antennas [67] and proposes
that each vehicle be equipped with two directional antennas each with the beamwidth
of 30 degree. The proposal is composed of two phases: directional broadcast on the
road and directional broadcast at intersections. The first phase deals with forwarding
alert messages on roads by selecting the furthest away receiver behind. The delay
waiting time is computed as following :
WT = (1−D
R) ∗MaxWT
Where R is the transmission range and MaxWT is a configurable parameter which
can be adjusted according to the density of vehicles. After the expiration of this
waiting time, the concerned vehicle immediately sends an ACK packet. This is useful
to inform other neighboring nodes to cancel their retransmission task. In addition,
the relay vehicle keeps rebroadcasting the packet if no other node retransmits the
packet within an interval if time equal to MaxWT .
1Request To Send-Clear To Send

3.3 State-of-the Art: Techniques for Information Dissemination in VANETs 30
In the second phase, a non-moving node, namely directional repeater, placed
on intersections and equipped with several directional antennas, is responsible to
retransmit received alert packets on the different intersection segments.
Obviously, the assumption of having vehicles with multiple directional antennas
restricts the use of such approaches.
3.3.1.7 Efficient Road-based Directional Broadcast Protocol (ERD)
To deal with the broadcast issue at road intersections, Tung et al. propose a direc-
tional broadcast protocol, by using precise GPS navigation system, called Efficient
Road-based Directional broadcast (ERD) [68]. It groups vehicles based on their road
segments (single road case, node near an intersection case and node in an intersec-
tion) and selects relay nodes for each group. The protocol improves packet efficiency
significantly but it still depends on a very precise position navigation system and an
accurate road digital map which are not always present on each vehicle.
3.3.2 Probability based Broadcast Protocols
The major shortcoming of position-based broadcast protocols resides on the need of
having information about the network topology or the geographical position of vehi-
cles by using GPS devices. To countermeasure these drawbacks, a different approach
was undertaken by the research community to achieve the same goal of position-based
broadcast protocol without the need for a lot of information exchange. Thus, a prob-
ability based approach was designed to make nodes only retransmit alert packets with
an adjustable probability p computed by each node in a distributed manner:
(i) Probabilistic in the sense that every intermediate node will decide to relay the
packet or not based on a certain probability assignment function PAF ;
(ii) Distributed means that each vehicle makes a rebroadcast decision individually
without coordination with other nodes and usually based on local information.
The aim of this mechanism is to limit the number of retransmissions. One of the main
challenges of these techniques resides on constructing an optimal probability assign-
ment function. Some techniques use a simple pre-defined fixed probability while others
sophisticated approaches adjust this probability function based on some local param-
eters such local density, etc. Next paragraphs review some of the probabilistic-based
multihop broadcast protocols for VANETs.

3.3 State-of-the Art: Techniques for Information Dissemination in VANETs 31
3.3.2.1 Weighted p-persistence Protocol
In [74] and [75], three probability-based broadcast schemes are proposed: weighted p-
persistence, slotted 1-persistence and slotted p-persistence schemes. They are meant
to be used at the network layer and mitigate the broadcast storm problem in well
connected networks. The performance of this technique was evaluated in terms of
packet loss rates, overhead and reachability. In this approach, a node that receives
the emergency message for the first time, computes individually its own forwarding
probability based on its distance progression beside the transmitter. The forwarding
probability can be expressed as follows:
pij =Dij
R
where Dij refers to the distance between node i and node j, and R represents the
transmission range of communicating vehicles. By doing so, the vehicle presenting
the higher progression toward the destination will possess the highest probability to
transmit. Similar approach was undertaken in [76] where the probability function is
proportional to the distance between the source and the receiving node.
3.3.2.2 Irresponsible Forwarding Protocol
In [77] and [78], authors design a probabilistic approach, denoted the Irresponsible
Forwarding protocol (IF), within the retransmission probability function depends on
the distance between the sender and the transmitter and the vehicle local density
(spatial density of its neighbors). The exact expression of the probability follows the
following function:
p = e(−ρs(z−d)
c)
The first observation is that the given probability function is quite different from the
existing approaches where the probability is a linear function of the distance and not
exponential. ρs refers here to the vehicle density, z is the transmission range, d is the
distance between the sender and the vehicle, and finally c represents a tunable coef-
ficient which can be selected to ”shape” the probability of rebroadcasting. The key
idea behind this new expression of the probability function resides on that a candidate
node implicitly evaluates the probability of having another node in the vicinity able
to retransmit the message. If this probability is high, then the node ”irresponsibly”
chooses not to rebroadcast and gives way to the other node to retransmit. As it can
be observed from the probability function given above, this latter decreases as the

3.3 State-of-the Art: Techniques for Information Dissemination in VANETs 32
distance between the sender and the vehicle decreases (the receiving vehicle is very
close to the sender and, therefore, it should let the other node take the responsibility
of rebroadcasting). Moreover, when the network is sparse, the rebroadcast probabil-
ity is important in order to ensure a complete reachability (the vehicle is not well
surrounded by neighbors, thus it have to take the responsibility to rebroadcast).
3.3.2.3 AutoCast
Introducing the impact of local density of vehicles in the retransmission probability
function is the aim behind the approach presented in [79]. In fact, the probability
function follows the expression below:
p =2
Nh × 0.4
where Nh is the number of the surrounding one hop vehicles. We observe that when
the local density of vehicles decreases, the probability to retransmit the emergency
message by the concerned vehicle increases. This mechanism allows a better reacha-
bility for the packets in sparse networks. We can also remark that the above equation
works only for Nh ≥ 5. Authors do not give any details about the behavior of the
probability p when Nh < 5 which relieves a weak point for this effort.
3.3.3 Neighbor-knowledge-based Protocols
These approaches postulate that all moving vehicles know the identity of all their
neighboring nodes. They assume a periodic exchange of messages between vehicles
in order to have a view of their neighborhood and its mobility. A neighbor table is
maintained at each node and is updated periodically to use it to designate the next
forwarder.
The basic example of such kind of protocols is the ”flooding with self pruning”
technique where each node includes the list of its neighbors when broadcasting mes-
sages. Upon receiving such a message, vehicles compare the list with their corre-
sponding neighbors and retransmit the packet if new nodes would be reached. In the
following, we list some works in this category.
3.3.3.1 R-OB-VAN Protocol
Authors in [81] present a reliable opportunistic broadcast technique called R-OB-VAN
that overcomes the problem of message delivery in VANETs while maintaining a low

3.3 State-of-the Art: Techniques for Information Dissemination in VANETs 33
average end-to-end-delay. The proposed protocol is composed of two main compo-
nents: The first functionality consists in the forwarding mechanism that is handled
by the OB-VAN technique [80], while the reliability component aims at ensuring that
blocked vehicles get the emergency message despite shadowing. The first component
that is supported by OB-VAN protocol, selects the vehicle that offers the best pro-
gression toward the destination to act as a relayer. In addition, it uses active signaling
bursts to make this choice: after receiving the packet, each vehicle must transmit a
short acknowledgment made up of signaling bursts and when a vehicle detects a signal
during its any of its listening intervals, it quits the selection process.
The second component (reliability functionality) tries to make sure that even if a
vehicle is unable to receive messages from the selected relays, other vehicles will take
the responsibility to inform them. For that purpose, they developed three solutions to
ensure this functionality. The proposed techniques are based on a two hop neighbor
information in order to solve the problem of shadowing. The first variant is based on
the requirement that vehicles know the number of neighbors that each neighboring
one-hop vehicle has. On the other side, second variant make this decision more dy-
namic by taking into account the density of the network. Finally, the third approach
is based on the requirement that nodes exchange their one-hop neighbor tables with
their surrounding vehicles as well as their locations.
Simulation results have shown that variant 3 is able to maintained a higher delivery
ratio than the other approaches while offering at the same time a lower delay. The
major drawbacks of these techniques is the overhead caused by the periodic exchange
of neighbor tables between vehicles even this overhead is little. In addition, variant
1 and 2 have parameters that can cause them to fail if they are chosen improperly.
The absence of a theoretical model that can validate their proposal still constitutes
a missing point in this good effort.
3.3.3.2 DV-CAST technique
An outstanding example is the DV-CAST technique [82]. The authors focus on high-
way scenarios and implement a distributed protocol, namely DV-CAST, that can
operate in both dense and sparse traffic regimes. Their technique relies on the local
one-hop neighbor information obtained via the use of periodic hello messages aiming
at assisting DV-CAST in determining how the packet should be handled. DV-CAST
protocol concept consists in three main functions: neighbor detection, broadcast sup-
pression and store-carry and forward mechanisms. The first component estimates the

3.4 Proposed Technique: EBDR 34
local topology by monitoring hello updates received from one hop neighboring nodes.
By comparing its GPS information against the neighbors’ information, the concerned
node is able to classify them into different classes regarding their relative position.
In dense scenarios, DV-CAST performs broadcast suppression techniques to reduce
the broadcast storm problem: authors make use of the weighted p-persistence scheme
to handle this challenge. On the other side (on totally disconnected neighborhood),
authors cope with such an extreme situation using the store-carry-forward mechanism
to route the message to the zone of interest. Despite the little overhead introduced
by DV-CAST, this latter still requires a precise positioning system (GPS) to classify
neighboring vehicles in different categories (front, back, and opposite directions). In
addition, there is an additional overhead introduced in order to add the GPS positions
in the periodic hello messages even it is considered minimal.
3.3.3.3 DSP Technique
Another work carried out by Dai et al. in [83] where a directional broadcast protocol
is proposed for adhoc networks. Their proposal, called DSP, is a generalization of
an existing localized broadcast protocol using omnidirectional antennas. Compared
with its omnidirectional predecessor, DSP achieves lower broadcast redundancy and
conserves bandwidth and energy consumption by switching off transmission in un-
necessary directions. Nevertheless, DSP is based on 2-hop neighborhood information
which requires an additional overhead in the broadcast transmission.
3.4 Proposed Technique: EBDR
As mentioned in Section 3.3, several multihop dissemination protocols have been pro-
posed for VANETs with good characteristics and acceptable performance. Neverthe-
less, most of these approaches are empirical in the sense that they are not strengthened
by a theoretical background to confirm their efficiency. In fact, they rely on prac-
tical test beds or simulations to demonstrate their performance. For our proposal
EBDR, the performance part consists of two directions: The first direction tries to
study the performance of EBDR by conducting several real-road simulations based
on a well known vehicular simulator. The second approach, which is described in the
next chapter, investigates the performance of our proposal analytically. Our novel
theoretical framework offers some insights about the behavior of EBDR and allows to

3.4 Proposed Technique: EBDR 35
derive several performance metrics including the probability of transmission success
as well as the required number of hops to reach the final destination.
In this section, we first focus on broadcast communications based on directional
antennas to disseminate messages in a vehicular wireless multihop network conditions.
We propose an Enhanced Broadcast-based Directional Routing (EBDR) scheme that
combines broadcast and directional transmission techniques to route a message to
a known destination. A communicating node, using EBDR, calculates its itinerary
based on a route guidance algorithm and then disseminates the message on the set
of nodes within its transmission range and located in its beamforming area. EBDR
technique does not introduce overhead, is extremely simple and it only requires the
presence of a GPS receiver and a directional antenna in the vehicle. Our proposal
aims to achieve good ratios of delivery while significantly reducing the bandwidth
consumption and redundancy. The efficiency of our proposal is studied using real-
road simulation scenarii.
In the following, we present the key properties of our antenna model. Then, we
detail the functionalities of our proposed technique and present relevant simulation
results.
3.4.1 Directional Antenna Model
In the study of VANETs, several types of smart antennas have been proposed to form
directional transmission and/or reception beams [84]. In our modeling approach, the
directional antenna is modeled as a circular sector with an angle θ and a radius equal
to the transmission/reception range r. As shown in Fig.3.1, the directional antenna
gain is within the angle θ, which represents the beamwidth of the antenna. Hence,
the gain outside the sector limited by θ is approximated to zero.
A real directional antenna pattern is formed by a mainlobe representing the direc-
tion of the maximum radiation and other smaller backlobes resulting from inefficien-
cies in the antenna design. For simplicity, we ignore the existence of such backlobes
in our modeling approach. In addition, each vehicle can point its smart antenna in
any direction. We assume also that each node possesses only one directional antenna.
Traditionally, a smart antenna offers two reception modes: omnidirectional and di-
rectional modes. While the former allows each vehicle to receive a packet from all
its neighbors, the latter limits the receiving directions to a single one limited by the
angle θ. Throughout the rest of this chapter, we assume transmissions in a directional
mode and an omnidirectional reception mode.

3.4 Proposed Technique: EBDR 36
Figure 3.1: Directional antenna model
3.4.2 EBDR Conception
In this section, we describe our proposed scheme for broadcast-based routing using
directional antennas. The functioning of our technique is composed of two main
phases. First, a route guidance algorithm is used to select a route from the source
S to the destination D. This route, carried out by the route guidance algorithm, is
composed of a set of intermediate destinations, called Di, through which the message
must pass. These Di can be a road intersection, a turning point, an RSU, etc. The
final destination can be a simple node or a geographic zone. This algorithm tries to
select a short geographical path while ensuring the maximum covered distance and
the minimum handovers. In fact, on a VANET network, vehicles follow roads and
highways along their journeys and don’t move randomly. Hence, it is mandatory
to select the best path linking S and D according to specific criteria. This path is
composed of several number of edges referring to geographic roads. Afterward, once
the route is selected, we use the directional broadcasting to let the message reach the
final destination [1].
3.4.2.1 Route Guidance Algorithm
We consider a VANET environment where nodes are positioned along roads and
highways. Vehicles are able to determine their geographic position using a Global
Positioning System (GPS) receiver. We assume also that vehicles are equipped with

3.4 Proposed Technique: EBDR 37
a digital map that reflects the road structure of a city and can run the route guidance
algorithm aiming at providing a suitable route.
Generally, such kind of algorithms are already used by some tools such as Mappy
[85]. Indeed, an algorithm proposed by Ghedira et al . [86] uses geographical in-
formation such as vehicle location and the hotspot map to route vehicles toward a
destination. It builds an oriented graph where nodes represent a portion of a route
covered by a hotspot and edges account for possible routes between nodes with a
weight function.
In our case, the situation is different since we do not want to guide drivers but we
aim to find a path for a packet to reach the destination. More precisely, a directed
graph G = (V,E) is built where the set of nodes V represent either road intersections,
or some turning points, or some special nodes (control center, RSU, etc) (see Figure
3.2).
Figure 3.2: Road map representation
Observe that since we are going to use directional broadcasting with a possibly
small beamforming angle, the roads are supposed to be straight lines. That is why
turning points of roads are considered as graph vertices to make this assumption valid.
Each road between two points of V will be represented by an edge. The weight of
this edge might be equal to the geographical distance between the extremities of the

3.4 Proposed Technique: EBDR 38
edge. One can also consider more complicated weights taking into account the vehicle
density or jam. In fact, roads with a large vehicle density can be more convenient
to transmit the packet since the probability of transmission success increases with
vehicle density (as will be shown by simulations and analytical formulas). Then the
edge weight might be a well chosen function which is decreasing in the vehicle density
and increasing in the distance. In fact, we can use the analytical framework, presented
in the next chapter, to get an estimation of the probability of transmission success
Sλe(de) if the vehicle density on a link e ∈ E is λe and the length of the road is de.
Then, the probability to reach a destination using a path in G is almost equal to the
product of the probabilities of success of the links belonging to the path. Maximizing
the probability of success is obviously equivalent to finding a path P from source to
destination minimizing∑
e∈P ln( 1Sλe (de)
). If vehicle densities are not equal on different
links (roads), then the obtained path is not necessarily a shortest path in terms of
geographical distance.
If a vehicle wants to communicate with a node having a known location (another
vehicle, an RSU, etc.), it has to compute a minimum-weight path between its position
and the destination. This path will be used to send the packet. Since there are
generally many packets to be sent to the same destination, this path does not need
to be computed for each packet. If the destination is also moving, the path might be
updated from time to time (more details are given in the next section).
We assume that each geographic point has a unique identifier, called PID. The
unicity of this identifier is a valid assumption since each geographic point is charac-
terized by a unique couple of GPS coordinates. Thus, the identifier PID may be this
couple of values. The sequence of these points are put into the first packet header to
transmit as shown in Figure 3.3.
Figure 3.3: Packet structure
Thus, the broadcasting technique is considered as a posterior stage to this route
guidance algorithm.

3.4 Proposed Technique: EBDR 39
Figure 3.4: Directional Broadcast in VANETs
3.4.2.2 Broadcasting Technique
Hence, using such an algorithm, we suppose that the source vehicle, before sending
the message, knows in advance the adequate route that the message should follow in
order to deliver it to the destination node (control center, RSU, etc). The global route
is composed of a number of subroutes ri, 1 ≤ i ≤ N , where N is the total number of
subroutes. At the end of each subroute, there is a an intermediate point namely, Di,
as shown in Figure 3.4. The message should go through these intermediate points,
considered as intermediate destinations, in order to reach the final destination.
In addition, we assume that all vehicles are equipped with directional antennas.
The beamforming angle used to transmit alert messages is equal to θ (θ ≤ 90◦). This
beamwidth ensures a directional propagation of the transmitted packets towards the
intermediate destinations and prevents a returning back of the message transmission.
Hence, upon receiving an intermediate packet, each node must decide whether
this packet should be forwarded and where to. To this end, vehicles that receive an
intermediate message will broadcast it on their turn unless they have seen it before,
or unless they are the destination. The system ends broadcasting when there are no
more relays to broadcast. In this case, we assume that the message has arrived or
that the system has encountered a transmission failure. The transmission failure is a
situation when there is not any intermediate relay to reach the destination.

3.4 Proposed Technique: EBDR 40
Figure 3.5: Packet propagation mechanism
The other challenge in the conception of our Enhanced Broadcast-based Direc-
tional Routing protocol (EBDR) [1] is to choose the direction of the directional beam-
forming to spread the message further toward the destination. To do so, the source
node forwards packets through the sequence of streets carried out using the route
guidance algorithm. Then each node that received a packet, compares its current
geographic position to the values of the intermediate points present in the packet
header. This comparison allows the forwarding node to locate itself within the for-
warding process and specially know the next geographic point to which the message
have to be transmitted. Afterward, the vehicle removes the list of points that are al-
ready reached by the transmission operation (eg. nodes located behind the forwarding
node) and points its directional beam toward the position of the intermediate point
Di and makes an angle θ2with each side of the central axis linking the relaying node
and the next intermediate point Di. This mechanism is repeated until the message
reaches the final destination D. (see Figure 3.5).
In this case, only vehicles positioned in the zone covered by the directional beam
will receive the message as shown in Fig.3.1. It is worthnoting that the beamforming
angle θ is fixed from the beginning of transmission operation and it is the same for
all the participating nodes. As mentioned before, each vehicle is supposed to know
or to guess the position of its destination in order to determine the direction of the
transmitted beams. Our algorithm can be adapted to relatively precise or less precise

3.4 Proposed Technique: EBDR 41
direction information as it will be seen. The success or failure of the transmission is
strongly dependent on the density of nodes λ.
The functioning of our proposed is summarized by the following Algorithm 1.
The broadcasting technique might be enhanced by asking the destination to send an
Algorithm 1 EBDR Algorithm
1: The source node S runs the route guidance algorithm.
2: The set of intermediate destinations {Di} is determined using the route guidance
algorithm.
3: S puts the sequence of the intermediate destinations Di in the header packet.
4: Transmission of the packet by S using beamforming angle toward the first Di.
5: for each node i do
6: if Packet already received or node i is the final destination D then
7: the packet is removed and not transmitted
8: else
9: repeat
10: node i compares its current position to the geographic positions of Di.
11: node i removes the sequence of Di already reached from the packet header.
12: node i points its directional beam toward the next intermediate node Di.
13: node i makes an angle θ2with each side of the central axis linking i to Di
and transmits the message.
14: until Di=D
15: end if
16: end for
acknowledgment of receipt (for each packet, or for each group of packets). Since the
received packets contain the position of the source, the destination can apply the
same algorithm to compute a path to the source (or it can be the reverse path). This
path is used to send an acknowledgment with the exact position of the destination.
Since the destination can be a moving vehicle, the new position can help the source
to update the path from it to the destination. If the source node does not receive
acknowledgment for a long time, then it can deduce that the chosen path is not
convenient to transmit information, and it may use a second path (a shortest disjoint
path for example) to broadcast packets. These enhancements are left for further
study. We will next focus on the basic approach without acknowledgments.

3.4 Proposed Technique: EBDR 42
3.4.3 Performance Evaluation
3.4.3.1 Simulation Plateform
In this section, we evaluate the performance of our proposed Broadcast-based Rout-
ing technique. To this end, we use the Veins [88] framework a realistic vehicular
communication simulator dedicated to VANETs networks. Veins is composed of two
simulators: OMNET++ [87] as a wireless network simulator and SUMO [89] as a
mobility traffic generator to perform real vehicular mobility simulations (see Fig.
3.6)
Figure 3.6: Simulation framework
In fact, realistic simulation of inter-vehicle communication protocols is one of
the main challenges in the vehicular networks research domain. Several simulators
were designed for VANETs in order to accurately simulate the behavior of such very
dynamic networks. Among these tools, we can mention:
• VanetMobiSim [90]/ NS2 [91]: VanetMobiSim simulator focuses on vehicular
mobility models at macro and microscopic levels and simulates the movement
of vehicles in roads. On the other side, NS2 forms the network simulator which
provides a networking stack for the communications between vehicles and sim-
ulates the wireless transmissions. The combination between these two tools
results in the formation of a decoupled simulator: the traces files generated
by the traffic simulator, as a prior stage, are used as an input for the network
simulator. Once used, the trace files can not be changed.

3.4 Proposed Technique: EBDR 43
• TraNS [92]: The traffic and network simulator TraNS is a graphical simula-
tor that integrates SUMO and NS2 simulators. With this simulator, events
occurred in the network simulator (accident, traffic light extension) can alter
the movement of vehicles in the traffic simulator NS2 and vice-versa. This
characteristic is very interesting because it offers a real model of the reality in
VANETs. In fact, this solution is the most powerful and attracting since the
vehicles react consequently to the reception of significant information from the
traffic simulator.
• Veins (OMNET++/SUMO): This simulator follows the same idea behind TraNS,
however it differs from it in choosing the network simulator OMNET++ in spite
of NS2. This framework is well documented and offers a good bidirectional cou-
pling between the two simulators resulting in more realistic behavior of protocols
and deeper insights into the impact of network protocols on the road traffic [93].
For these reasons, we have chosen to use this simulator in our study.
In the following, we focus on the impact of our broadcast technique on delays,
ratio of implicated nodes and probability of transmission success (i.e the probability
of the alert message to reach the destination). Findings corroborate the efficiency of
our proposal compared to a simple broadcast technique.
To make the proposed scheme tractable, we consider the following steps:
• We use the WAVE architecture [94] to model the MAC layer used for each
communicating node. This architecture is based on the IEEE 802.11p protocol
[37] dedicated specially to vehicular communications.
• All nodes have the same transmission/receiving range, which is denoted by r
and equal to 200 m.
• For the road topology, we have chosen the ”Champs-Elysees” avenue to test our
optimized broadcast protocol. The map (see Figure 3.7), centered at latitude:
2.303◦ and longitude: 48.8712◦, has 10 intersections and 17 road segments. The
main street (Champs-Elysees) is composed of 4 lanes in each direction. All lanes
are 2 Km in length. The total width of the Champs-Elysees street is equal to
30 meters.
• The number of vehicles was varied from from 800 to 1060 (its corresponds to a
realistic urban scenario).

3.4 Proposed Technique: EBDR 44
• We vary the beamforming angle θ from 10◦ to 90◦ to study the effect of the
beamwidth on several networking metrics.
For the mobility traffic generator, we use SUMO [89] simulator which is already
included in VEINS software and offers realistic vehicular mobility patterns. Details
of the simulation setup parameters are listed in TABLE 3.1.
Figure 3.7: Road topology
Table 3.1: Simulation Parameters
Parameter Value
Density of vehicles λ (veh/m) from 0.01 to 0.09
Beamforming angle θ from 10◦ to 90◦
Transmission power (pMax) 4 dbm
Transmission range r1 200 m
Beacon periodicity 1 s
Bit rate 18 Mbps
Number of service channels 2
Physical layer IEEE 802.11p
Accident start time 302 s
Accident duration 50 s

3.4 Proposed Technique: EBDR 45
(a) Approach 1: Blind Broadcast(b) Approach 2: Beamforming-Based Broad-
cast (θ = 70◦)
Figure 3.8: Implicated Nodes in the transmissions for the 2 approaches
3.4.3.2 Simulation Results
Two main scenarios are considered here: Blind and directional broadcast are used in
the routing process. Figures 3.8(a) and 3.8(b) provide a comparison of the snapshot
of the relaying nodes involved in the transmission process for both the two approaches
in the case of a density λ1 equal to 0.04 veh/m.
The maps represent a zoom of one sector in Paris (France). Circled nodes de-
note the vehicles implicated in the forwarding operation. We observe that, with the
Broadcast-based directional routing, nodes located outside the beamforming sector
(which corresponds to the vehicles not present on the road given by the route guidance
algorithm) are not participating in the broadcast process contrary to the blind dis-
semination technique. Furthermore, directional broadcast-based routing only allows
the nodes located on the direction to the destination to participate on the forward-
ing process and then vehicles which are not interested by the alert are not involved.
Hence, we can conclude that the adjustment of the dissemination direction signifi-
cantly reduces the number of implicated nodes.
In Figure 3.9, we present the average values of the probability of transmission
success, i.e. the probability that the alert packet successfully reaches the final desti-
nation D obtained by simulations for the two approaches. Here, the distance between
the sender S and the destination D is equal to 2000m. Four levels of vehicle density
are taken into account: λ = 0, 01; λ = 0, 02; λ = 0, 04; λ = 0, 05. We observe
obviously that the probability of transmission success increases when the density of

3.4 Proposed Technique: EBDR 46
Figure 3.9: Simulated values of probability of success
moving vehicles is high. In fact, a dense network allows a higher probability to find
a relay node to retransmit the packet and hence increases the reachability of the
message. On the other side, sparse networks (which correspond to little values of λ)
suffer usually from the fragmentation phenomenon which may stop easily the propa-
gation of transmitted information towards the destination. In addition, our proposal
outperformances clearly the blind broadcast and achieves higher values in most of the
cases. In fact, traditional broadcast yields to a huge amount of packet collisions since
all neighboring nodes try to forward the packet and then the propagation of the alert
message is stopped and the destination is not informed.
We investigate on Figure 3.10 the effect of the propagation distance d on our
broadcast-based routing technique. Thus, we run several simulations with different
values of d and with a density of vehicles λ equal to 0, 02. We are interested on the
middle curve corresponding to the simulation value. We can observe clearly that the
probability of transmission success decreases when d increases. For example, increas-
ing the distance from 1000 m to 4000 m reduces the probability from 70% to 20%.
In fact, if the distance is doubled, then the probability of success is approximately
squared. This is easy to understand since to reach a destination located at distance
2d, a message should successfully reach a point located at a distance d and then con-
tinues to be transmitted with success to reach the destination. In other words, ln(p)
is linear in d where p is the probability of transmission success.

3.4 Proposed Technique: EBDR 47
Figure 3.10: Effect of distance on the broadcasting operation
On previous simulations, we use a beamwidth angle equal to 90◦. This angle, as
mentioned before, allows all vehicles moving on the same propagation direction of the
alert packet, defined by the route guidance algorithm, to participate in the routing
operation. The variation of this angle θ in the interval [10◦−90◦] has no major impact
on the performance of our proposal since the packet is transmitted linearly following
the roads. Thus, even a smaller angle will have similar performance.
To confirm our proposition, we simulate, in Figure 3.11 the impact of the beam-
forming angle θ on the ratio of implicated nodes with a density of vehicles λ equal to
0, 02. From the results in Figure 3.11, it emerges clearly that the beamforming angle θ
does not affect severally the percentage of participating vehicles. In fact, the propor-
tion of implicated nodes ranges from 10% for an angle θ = 10◦ to 14% for θ = 90◦. It
can be observed from Figure 3.8 that vehicles participating on the forwarding process
are located on the set of roads chosen by the route guidance algorithm. Thus, even
with angle θ less than 90◦, the snapshot of implicated nodes will have the same shape.
For the traditional broadcast technique, the ratio of implicated nodes is independent
from the beamforming angle θ. It achieves a ratio equal to 48% while our technique
achieves for the worst case (θ = 90◦) a gain of ≈ 60% compared to it. This fact
confirms the efficiency of our proposal in terms of bandwidth consumption.

3.4 Proposed Technique: EBDR 48
Figure 3.11: Ratio of implicated nodes: Comparison overview
Figure 3.12: Broadcast delay: Comparison overview
To strengthen the observations carried out regarding the results in Figure 3.11, we
report on Figure 3.12 the variation of the end-to-end delay as well as the average of the
broadcast transmission duration. The first metric corresponds to the delay required
by the alert message to reach the final destination. By broadcast transmission delay,
we mean the delay between the first and the latest packets sent on the network. The

3.4 Proposed Technique: EBDR 49
bottom line depicts the variation of the end-to-end delay when θ is changing and
where the final destination is situated at distance d = 1000m from the initial sender.
The end-to-end delay can be considered as the delay of the shortest path from the
source S to the destination D. We notice that this variation is very tight and that
the curve is almost linear. This finding corroborates the fact that the variation of
the beamforming angle has no effect on the global performance of our technique.
Furthermore, in this scheme, the delay relative to the blind dissemination is equal
to 6, 7 ms. From Figure 3.12, we learn that for small values of θ (≤≈ 30◦), the
blind broadcast achieves better results than our technique. This can be explained by
the fact that when the beamforming angle θ is small, a little number of relays are
implicated on the forwarding process and consequently, the alert delivery is delayed
due to the absence of ”suitable” forwarding vehicles. Whereas, for higher values of θ
(≥ 30◦), our technique outperforms the blind broadcast and remains achieving smaller
value of delay even with larger beamforming angle values.
On the other hand, the top line is for the total broadcast transmission duration.
We observe clearly that the difference between the two curves is very tight. This little
difference between the two lines denotes clearly that the vehicles participating in the
broadcast operation are almost the nodes located on the subroutes between S and
D. The additional amount of time present on the top line is due to the additional
broadcast transmissions performed by the neighbor nodes of the final destination and
some nodes reached by the beamforming technique and present on secondary roads.
For this metric, blind broadcast achieves 17.54ms . As in the previous finding, our
proposed EBDR far outperforms the traditional broadcast. In fact, even for largest
value of θ = 90◦, our technique achieves a delay equal to 6.22ms. This observation
confirms the outperformance of our proposal in terms of total transmission delay
and more specially demonstrates that the arrival time at destination is almost the
same as the total broadcast delay: When the packet arrives at the destination D, all
transmissions are almost implicitly stopped. This feature represents a major key in
our modeling conception and underlines the efficiency of our technique.
Consequently, these findings undoubtedly prove that our proposed technique con-
serves the bandwidth (ensures a less ratio of implicated nodes) and improves at the
same time the end-to-end forwarding delay.

3.5 Other Application Scenarios of EBDR 50
In the next section, we investigate the applicability of our proposed technique
EBDR in a different network node distribution. Good performance results will endorse
the efficiency of our technique in terms of adaptation to different node distribution
schemes which is considered a very important asset in any networking algorithm
conception.
3.5 Other Application Scenarios of EBDR
In this section, we focus on the evaluation of our proposed broadcasting technique
in another networking scheme: The proposal is evaluated using a simplified node
distribution scheme, suitable to wireless adhoc networks. Thus, we investigate the
performance of EBDR in this new configuration and we derive an analytical model
that is able to capture the transmission area of the messages. Obtained results confirm
that the application of our proposal is not limited to vehicular networks but it can
also be adapted to different networking schemes. This adaptation facility represents
a strong key in the conception of our broadcasting technique.
3.5.1 Protocol Design
We suppose here that wirelesss nodes are randomly positioned in a square area. The
broadcasting technique is based on the same principles as EBDR. However, the route
guidance function is disabled in this case. The broadcast operation is based on two
geographic parameters: the first is the destination direction. This information is
sufficient in the context of wireless adhoc networks since the node distribution is
quite uniform and not depends on streets, intersections, etc. For these reasons, the
list of intermediate destinations Di is not needed here.
The second parameter is the beamforming angle θ. We use the same principle as
in the vehicular scheme: Each node points its directional beam toward the position
of the final destination D makes an angle θ2with each side of the central axis linking
the relaying node and the final destination D. This mechanism is repeated until the
message reaches D.
3.5.2 Results and Analysis
In this section, we evaluate the performance of our adhoc-version proposed technique
through MATLAB simulations. We study precisely the impact of the density of

3.5 Other Application Scenarios of EBDR 51
nodes and the beamforming angle on the performance of our proposal. The results
confirm the efficiency of our algorithm in terms of use of bandwidth, the ratio of
implicated nodes and the probability of transmission success. In fact, transmitting
messages within a limited area clearly reduces the number of nodes having to relay the
message and considerably reduces the total number of transmissions and affect the
probability of success. Moreover, varying the angle of transmission and the density
of the nodes will give us an indication on the spectrum efficiency. There will be two
kinds of results in this section. Some simulation results related to the probability of
success and the proportion of vehicles participating to the forwarding process. An
analytical model will also be given for the second performance criteria (the proportion
of implicated vehicles).
3.5.2.1 Some Simulation Results
In order to analyze the performance of our protocol, we conduct several simulations
varying the following system parameters:
• Number of vehicles in the simulation from 1000 to 3000.
• Beamforming angle θ (from 22.5◦to135◦).
The nodes are assumed to be randomly positioned in a square area according to a
Poisson process of density λ(so λis equal to the number of nodes divided by the area
of the square).
In Figure 3.13, we show a snapshot of the nodes implicated in the transmission of
a message from source S to destination D. We consider that the angle θ is equal to
60◦and that all nodes have a transmission range r equal to 200m. The figure shows
that the relays are located within a geographical area. The analytical model will
prove that this shape is similar to a leaf.
Figure 3.14 gives the ratio of implicated nodes in the transmission when varying
the angle θ. Clearly, the fact that we transmit messages within a limited area reduces
the number of nodes having to relay the message and in turn considerably reduces
the total number of transmissions. In addition, the use of indicators to determine
whether a node had already transmitted a message gives us the possibility to avoid
unnecessary retransmissions and hence avoid the broadcast storms.

3.5 Other Application Scenarios of EBDR 52
Figure 3.13: Network topology and distribution of implicated nodes in the transmis-
sions
Figure 3.14: Ratio of implicated nodes

3.5 Other Application Scenarios of EBDR 53
Figure 3.15 shows the gain in bandwidth (and hence the spectrum efficiency) when
varying the angle of transmission with a total number of nodes equal to 2000. The
spectrum use ratio of relays is presented by the product of the implicated nodes’ratio
and θ360◦
. Observe that the beamforming mechanism achieves a large gain in the
spectrum use when compared to a typical broadcast operation involving all nodes.
Figure 3.15: Gain in bandwidth
Figures 3.16, 3.17 and 3.18 show the variations of the success probability with the
beamforming angle. In each figure, different densities are considered (different node
numbers). The distance d between the source and the destination is equal to 1000m
in Figure 3.16, while it equals to 2000m (resp.3000m) in Figure 3.17 (resp.3.18).
Observe that the probability of success seems to be convex for small angles and
concave for large angles. One can deduce from Figures 3.16, 3.17 and 3.18 that the
angle should be chosen carefully depending on the distance and the density.

3.5 Other Application Scenarios of EBDR 54
Figure 3.16: Probability of transmission success (d = 1000m)
Figure 3.17: Probability of transmission success (d = 2000m)

3.5 Other Application Scenarios of EBDR 55
Figure 3.18: Probability of transmission success (d = 3000m)
3.5.2.2 An analytical Model for the Transmission Area
This section encloses an important contribution which consists in the derivation of
an exact formula to evaluate the transmission area (.i.e., the set of nodes that receive
a message and retransmit it). Thereby, this finding provides a good tool to confirm
the results obtained by simulations.
As such, we assume that nodes are uniformly distributed in a square. The source
and all relay nodes transmit messages according to an angle θ within a radius r. As
shown in Figure 3.19, the transmission can be approximated by a set of triangles
(the destination is a vertex of each triangle). Starting from the triangle containing
the source, each two consecutive triangles have a common vertex (in addition to the
destination). Each triangle’s vertex is obtained by considering that there is a mobile
situated in a vertex of the previous triangle transmitting within a distance r according
to an angle θ. It should be understood that the union of these triangles is only an
approximation of the true transmission area. We will see that this approximation is
very good. Observe that the transmission area is again similar to a leaf.
Since the transmission area is symmetric, we can focus on the half plane above the
line connecting the source and the destination. Starting from the triangle containing
the source and using di to denote the length of the common edge between the triangle

3.5 Other Application Scenarios of EBDR 56
Figure 3.19: Area of transmission
number i and the triangle number i+ 1, the area of triangle number i is given by:
Si =1
2rdi sin(
θ
2) (3.1)
Moreover, the distances di and di−1 are linked through the following equation:
d2i = d2i−1 + r2 − 2rdi cos(θ
2) (3.2)
All these distances and triangle areas can be iteratively computed using the two
previous equations. This directly leads to the total area given by:
S = 2Nb∑
1
Si (3.3)
We evaluate hereafter the model in Eq.3.3 and compare it to our simulations. The
result is expressed in terms of the ratio of implicated nodes with respect to the angle
θ. We show on Figure 3.20 the ratio of implicated nodes given by simulation when
there are 1000 nodes in the square and also when there are 3000 nodes. We also
show the theoretical ratio given by Eq.3.3. Notice that the theoretical value does not
depend on the mobiles density. One can see that the three curves are very close. This
clearly implies that the analytic model provides a very good approximation of the
real situation.
Figure 3.21 represents the relative error of the model computed as follows:
relativeerror =simulationvalue − theoreticalvalue
simulationvalue
(3.4)

3.5 Other Application Scenarios of EBDR 57
Figure 3.20: Comparison between the theoretical and practical values of the impli-
cated nodes ratio for different densities
Figure 3.21: Relative simulation results

3.6 Conclusion 58
The relative error seems to be particularly small for angles between 45◦ and 120◦.
An important observation related to Figure 3.20 (and confirmed by many other sim-
ulations) is that the ratio of implicated nodes seems to vary linearly when θ is less
than 100◦.
3.6 Conclusion
In this chapter, we studied dissemination of emergency messages in VANETs. After
an overview of the state of the art, we presented our proposed broadcast based rout-
ing technique, denoted EBDR, and devoted to urban vehicular networks. Unlike the
majority of existing approaches, the EBDR protocol grasps the transmission oppor-
tunities offered by directional antennas and uses a route guidance algorithm to route
messages toward their destination. Simulation results confirmed the efficiency of our
approach in terms of probability of success and end-to-end delays. Moreover, in spite
of the broadcast nature of the proposed technique, all transmissions stop very soon
after the arrival of a packet to its destination representing a strong feature in the
conception of EBDR. As a consequence, our approach fulfills the requirements of any
dissemination technique: simplicity (broadcast-nature), reliability and efficiency.
Additionally, we studied our approach in a wireless adhoc environment to demon-
strate the easy adaptivity of EBDR to different network schemes. Simulations as well
as analytical analysis corroborate the efficiency of our technique in this new node
distribution scheme. This feature distinguishes our approach from other existing
techniques.
Deriving a novel mathematical framework that is able to investigate analytically
the performance of our proposed technique EBDR will be the main goal of the next
chapter.

Chapter 4
A Mathematical Framework to Investigate
the Performance of EBDR
Contents
4.1 Introduction . . . . . . . . . . . . . . . . . . . . . . . . . . 59
4.2 State of the Art . . . . . . . . . . . . . . . . . . . . . . . . 60
4.3 Problem Statement . . . . . . . . . . . . . . . . . . . . . . 62
4.4 Probability of Success . . . . . . . . . . . . . . . . . . . . . 63
4.4.1 Analytical Model . . . . . . . . . . . . . . . . . . . . . . . . 63
4.4.2 Model Validation . . . . . . . . . . . . . . . . . . . . . . . . 66
4.5 Average Number of Hops . . . . . . . . . . . . . . . . . . 69
4.5.1 Analytical Model . . . . . . . . . . . . . . . . . . . . . . . . 69
4.5.2 Model Validation . . . . . . . . . . . . . . . . . . . . . . . . 73
4.6 Conclusion . . . . . . . . . . . . . . . . . . . . . . . . . . . 77
4.1 Introduction
In literature, there is a plethora of multihop broadcast routing protocols for VANETs.
However, scant efforts are supported by a theoretical proof or background underlying
their efficiency. In fact, most of the proposed techniques rely on experimental testbeds
or simulations to demonstrate their performance and neglect the importance of having
a mathematical proof of their results which make their findings more universal. For
these reasons, we focus in this chapter on constructing an analytical framework able
59

4.2 State of the Art 60
to investigate the performance of EBDR theoretically. As such, we derived recursive
upper and lower bounds for the end-to-end probability of success and the average
number of hops. Our proposed mathematical framework holds for any spatial node
distribution and it can be modified to fit new protocols. In addition, simulation re-
sults, carried out in the previous chapter, are compared to the results obtained with
the analytical models. Observations show that there is a good match between the
two techniques.
4.2 State of the Art
We present here some insights of the relevant works that tackled the problem of
reliable IVC and proposed some analytical models to investigate the performance of
such vehicular scenarios.
In [95], Nawaporn and al. focus on a sparsely connected highway in a vehicu-
lar network context. They develop an analytical framework to investigate the major
characteristics of wireless networks such as the probability of being disconnected from
the following vehicle, the cluster size and length, intra and inter cluster spacing in a
single direction road. Besides, they studied a disconnected network with two direc-
tional traffic and carried out analytical expressions for the disconnection probability
and the re-healing time defined as the time taken to deliver a message across two
adjacent clusters. Monte Carlo simulations match the proposed analytical models.
Authors in [96] consider a sparsely vehicular network and investigate the use
of RSUs to assist the traffic safety messaging. They propose an RSU advertising
model to tackle the problem of network fragmentation. Besides, they carried out
an analytical framework to evaluate the performance of their RSU-based solution.
Mathematical expressions are given for the connectivity probability, the re-healing
delay, and the number of re-healing hops. In their work, the connectivity probability
refers to the probability of finding an RSU within the transmission area of the source’
cluster:
PI =1
Du
×
∫ Du
ru=0
e−λeru
⌊ ruR
⌋∑
j=0
(−1)j
j![λe(ru − jR)]j−1 × [j + λe(ru − jR)]eλe(ru−jR)dru
where ru refers to the distance between the source vehicle V0 and the succeeding
RSU U1, R is the transmission range of each vehicle, Du corresponds to the distance
between two successive RSUs, and λe represents the density of vehicles in the highway.

4.2 State of the Art 61
The re-healing delay and the number of re-healing hops correspond, respectively,
to the time and the expected number of hops required to deliver the message to either
the nearby RSU or the the first vehicle in the following cluster. Simulations validate
the mathematical proposal and demonstrate that the message delivery delay to a
re-healing node can be significantly reduced.
Wang [97] considered the case where vehicles are distributed according to a Poisson
process. A closed form expression for the expected value of the propagation distance
(the total distance traveled by a message before getting stuck due to the absence of
any vehicle within the range r) is derived. The variance of this propagation distance
is also computed. When a vehicle sends a message, we can assume that among all
vehicles receiving it, only the farthest one will relay it. This is the traditional MFR
assumption (most forwarded within range) of [98]. This assumption does not influence
the probability of success and the propagation distance. However, it has an influence
on the number of transmissions before getting stuck. The average number of hops
before the end of transmissions is exactly computed in [97]. Some recursive formulas
are also given for the probability of transmission success (the probability that the
message reaches a destination located at a distance d).
A similar recursive approach is also presented in [99] to compute the probability
of success. Notice that the number of hops before transmission’s fading is called the
number of cycles in [100]. As one of the early efforts, a generalization of some results
of [97] is proposed in [101] where no assumptions are made about the distribution of
vehicles. The expectation and the variance of the propagation distance are computed
in an exact way through simple formulas.
Compared to this literature, we can claim that our solution is more complete since
it is the first approach that provides closed form expressions both for the probability
of success and the average number of hops and considers a propagation scheme where
the message must be transmitted to a known destination. In the following, we will
first focus on the probability of success. A novel recursive approach is proposed
and used to compute lower and upper bounds for the success probability. Moreover,
these lower and upper bounds will be useful to compute the average number of hops
required to reach a specific destination if we assume that the forwarding process is
successful.
Up to our knowledge, this average number of hops to reach a destination was
not considered before. As mentioned above, only the average number of hops before
getting stuck was considered in literature.

4.3 Problem Statement 62
4.3 Problem Statement
The work performed in this section is motivated by the need of having an analytical
framework with low complexity and able to evaluate the performance of our proposed
broadcast-based routing technique.
Hence, our framework allows deriving meaningful performance metrics including
the probability of transmission success as well as the required number of hops to
reach the final destination. This latter is illustrative of the end -to-end delay needed
to reach the final destination. In these analytical models, lower and upper bounds
are provided and computed by dynamic programming techniques. To assess the merit
of our mathematical expressions, a comparison with the simulation results obtained
with the proposed routing technique is carried out and findings match very well the
analytical models and show that the gap between lower and upper bounds is very
tight. Up to our knowledge, this average number of hops to reach a destination was
not considered before (only the average number of hops before getting stuck was
considered in literature).
Throughout the rest of this chapter, we consider a traffic stream present on a
straight line. This special case of inter-vehicle communication corresponds, in the
vehicular context, to a transmission along a straight one way road or highway using
a directional antenna. Figure 4.1 depicts the linear network topology of reference for
our proposed broadcast-based directional routing technique. θ refers here to the angle
of transmission. Observe that if all vehicles (including the source and the destination)
Figure 4.1: Linear propagation scheme

4.4 Probability of Success 63
are on a straight line, then the angle of transmission does not have any influence on
the propagation of the message. This one-dimensional network is suitable to analyze
highway-like VANET scenarii where the width of the road (10−40m) is smaller than
the transmission range of vehicles’ wireless card (200m).
We assume that the vehicles are distributed on the line connecting the source and
the destination according to a Poisson process of intensity λ (dimension : [veh/m]).
In other words, the distance between two consecutive vehicles follows an exponential
distribution. The average distance between two vehicles is 1λ. This assumption is
based on some traffic studies that have proved that the inter-vehicle spacing on a
highway can be modeled by an exponential distribution [95]. We consider a fixed
transmission range for all moving nodes denoted as r. The distance between the
source and the destination is noted as d.
In what follows, we present an analytical model for the probability of success as
well as the average number of hops. Simulations will also be conducted to validate
the models.
4.4 Probability of Success
4.4.1 Analytical Model
As mentioned above, we assume that the vehicle position is confined to one dimension
(single line). The vehicle spatial positions are modeled as a Poisson process of inten-
sity λ. We consider also a fixed transmission power for all nodes. Thus, all vehicles
have the same fixed transmission range denoted as r.
Initially, a sender vehicle (1) generates an alert message that has to be forwarded
by other vehicles (see Figure 4.2). We assume also that each node only forwards the
message once since it can recognize later copies of the original broadcast. We denote
by d the distance between the sender S and the destination D.
We will compute the probability of success though recursive formulas. To eval-
uate this probability, we can assume that after the emission of the first message,
by the source S, the farthest node from S will be the next relay. In other words,
the message will reach the destination if two conditions are satisfied: first there are
other nodes within a distance r from S, and second the message sent by the farthest
node from S (among those that are within a distance r) should reach the destination.

4.4 Probability of Success 64
Figure 4.2: One dimension Broadcasting scheme
Consequently, one may think that the whole probability of success is obtained by
considering all possible positions x of the farthest node and then multiplying by the
probability of success from the position x.
In other words, one may think that this probability is given by
S(d) =
∫ r
0
e−λ(r−x)S(d− x) dx
where e−λ(r−x) represents the probability that there are no nodes in the interval [x, r],
λ dx represents the probability to have a node around the position x while S(d−x) is
the probability to reach the destination from the farthest node (the distance between
the farthest node and the destination is d − x). The formula above is unfortunately
not correct because there is some dependency between the probabilistic events ”the
farthest node has the position x” and ”the message sent by the farthest node reaches
the destination”. Knowing that there are no nodes in the interval [x, r] has definitely
some correlation with the success probability of any transmission initiated from this
node.
One way to overcome this difficulty is to assume that the closest vehicle (instead
of farthest) is relaying the message. As observed by [101], this assumption does not
have any impact on the probability of success. Then the following recursive formula
is valid:
S(d) =
∫ r
0
e−λxS(d− x) dx (4.1)
Formula (4.1) can be used to compute the success probability (or more precisely to
approximate it). However, we will introduce another recursive formula to compute

4.4 Probability of Success 65
it. The main reason for that is that what will be computed in this section, will be
useful to compute the average number of hops in the next section.
Observe that assuming that the farthest node located in position x is transmitting
the message within a distance r is in fact equivalent to assume that there is a node
located in position r transmitting within a distance x.
Then, in order to compute the probability of success, we have to introduce the
quantity S(d, a) representing the probability of success knowing that the first node
(source) is transmitting within a range a, where 0 < a ≤ r, while all relays transmit
within a distance r.
While we are only interested in computing S(d, r), we must compute S(d, a) for
different values of d and a.
Figure 4.2 represents the situation described above. The first vehicle (S) will
transmit the broadcast message with a range a, where 0 < a ≤ r, while the farthest
vehicle transmits within a distance r.
The probability of success is now given by the following recursive formula for
0 < a ≤ r:
S(d, a) =
∫ a
0
λe−λ(a−x)S(d− a, r − a+ x) dx (4.2)
In this equation, λdx refers to the probability of having a node around x, while
e−λ(a−x) represents the probability of absence of any vehicle within the interval [x, a].
As explained above, the emission of a message within a distance r by a vehicle located
in position x is equivalent to the emission of a message within a distance r − a + x
by an ”imaginary” vehicle located in position a.
In order to exploit the recursive formula (4.2) to compute the numerical values of
S(d, a), we will discretize the interval [0, a]. More precisely, we assume that:
r = kb
d = lb (4.3)
a = ib
Where b is a small distance called a step and i, l and k are integers. b can be seen as
a precision factor in order to determine the probability of success. In fact, the smaller
it is, more precise the probability will be.
Hereafter, we give some obvious upper and lower bounds of the probability of
success.
By replacing a and x in the Eq.4.2, we obtain the probability of success transmission

4.4 Probability of Success 66
as:
S(lb, ib) =i−1∑
j=0
∫ (j+1)b
jb
λe−λ(ib−x)S((l − i)b, (k − i)b+ x) dx (4.4)
The upper bound of the probability is obtained using the fact that S(d, a) increases
when a increases.
Let us use S(lb, ib) (resp. S(lb, ib)) to denote the upper bound (resp. lower bound)
of S(lb, ib).
Thus:
S(lb, ib) =i−1∑
j=0
λe−λibS((l − i)b, (k − i+ j + 1)b)
∫ (j+1)b
jb
eλx dx (4.5)
corresponds to the upper bound.
Moreover, by calculating the integral in the Eq.4.5, we get:
S(lb, ib) =i−1∑
j=0
e−λb(i−j)(eλb − 1)S((l − i)b, (k − i+ j + 1)b) (4.6)
Using the same approach, we get the following lower bound for the probability of
success.
S(lb, ib) =i−1∑
j=0
e−λb(i−j)(eλb − 1)S((l − i)b, (k − i+ j)b) (4.7)
4.4.2 Model Validation
In this section, we evaluate the analytical model through several use cases. We also
compare analytical results to simulation results reported in the previous section. Our
goal is to verify the bounds given by Eq.4.6 and Eq.4.7.
To understand the impact of the density of vehicles on the analytical framework
precision, we consider four levels of vehicle density: λ = 0, 01; λ = 0, 02; λ = 0, 04;
λ = 0, 05.
The probability of success (upper and lower bounds) is evaluated against the results
given by simulations (reported on Figure 3.9).
We define the precision rate as follows: precisionrate = (1− upperbound−lowerbound
simulationvalue)100.
We fix the precision step b = 5 and we compute upper and lower bounds using
dynamic programming.
According to the results depicted in Figure 4.3, our analytical model shows good
performance in all cases. Indeed, in the worse case, the precision of the model does
not fall below 85% (λ = 0.01) and increases very quickly when λ increases.

4.4 Probability of Success 67
Figure 4.3: Precision of the probability model varying the density of vehicles
For instance, for λ = 0, 02 and d = 2000 m, the analytical model gives: upper
bound= 48.54% and lower bound= 47.80 % as a probability of success, while the sim-
ulated value of the probability of success is 48.01%. In other words, our mathematical
model performs better in dense network.
To measure the effect of the distance d on the bounds of the proposed framework
we ran several numerical simulations for different distances shown by figure 4.4. Here
b is equal to 5 and λ is equal to 0.02.
Figure 4.4 shows again that the lower and upper bounds are very close . Furthermore,
in this case as well there is an excellent agreement between the results obtained with
the analytical model and the simulations.
It can also be observed that the probability of success decreases very quickly when
d increases. For example, increasing the distance from 1000m to 4000m reduces the
probability from 70% to 20%.
In addition, if we plot the curve of the logarithm of the probability of success
when d is varying from 1000 m to 8000 m, we can see that the curve is almost linear
(see Figure 4.5).
This result may be justified as follows. If the distance d is large (compared to
r), then one can expect S(2d, r) to be approximately equal to S2(d, r). Reaching a
destination located at a distance 2d is approximately equivalent to reaching a first

4.4 Probability of Success 68
Figure 4.4: Effect of distance on the broadcasting operation
Figure 4.5: Effect of distance on the probability of success

4.5 Average Number of Hops 69
(a) Effect of b variations on the probability
of success
(b) Precision of the probability model when
varying the parameter b
Figure 4.6: Probability of success when varying the parameter b
destination located at a distance d and then restarting the transmission from this
first destination and reaching a second destination located at a distance d from it.
To better evaluate the influence of the parameter b on the precision of the lower
and upper bounds more experiments are conducted. Figures 4.6(a) and 4.6(b) show
the obtained results when λ = 0.02 and d = 4000 m.
One can see that the difference between the lower and the upper bounds increases
when b increases. The precision rate shown on Figure 4.6(b) seems to vary linearly
with b. As it can be seen from Figure 4.6(a) and the precision results, the smaller b
is, the more accurate our bounds will be.
4.5 Average Number of Hops
To have a better understanding of the connectivity in VANETs, we investigate the
average number of hops in the shortest path linking the source to the destination (if
there is any).
We will focus on the case when the message reaches the destination. An analytical
model based on a recursive formula will be presented for the average number of hops.
4.5.1 Analytical Model
We still use the same notation as in the previous section. Let h(d, a) denote the
average number of hops needed to propagate the message to a destination located

4.5 Average Number of Hops 70
at a distance d assuming that: the message reached the destination, the source is
emitting within a range a, where 0 < a ≤ r, while all relays transmit within a
distance r. While we are mainly interested in computing h(d, r), we need to compute
h(d, a) for different values of d and a.
Before presenting the recursive formula, we provide here some simple bounds
related to h(d, r).
Theorem 1
⌈d
r⌉ ≤ h(d, r) ≤ 1 + ⌈
2d
r⌉ (4.8)
Proof: The first inequality is obvious and well known. It is valid because the distance
between two consecutive relays is less than r. The second inequality seems to be new.
It can be proved very easily by observing that the distance between the relay number
j (the j th vehicle forwarding the message) and the relay number j+2 is strictly larger
than r. Adding up all inequalities for each j and rounding up leads to the wanted
inequality.
Formula (4.8) clearly implies that the average number of hops is almost proportional
to the distance. However, we should not forget that we are here making the assump-
tion that the destination is reached.
To investigate the validity of these bounds, we compare on Figure 4.7, the simu-
lations values obtained in the previous section to these analytical expressions. It can
be observed clearly that simulation values are within the interval defined by the two
bounds. We remark also that the precision of these bounds decreases when the end-
to-end distance is increasing. Nevertheless, these bounds still are interesting given
their simplicity and their acceptable precision and can be exploited analytically by
studying multihop broadcast protocols.

4.5 Average Number of Hops 71
Figure 4.7: The average number of hops: Simulation vs. analytical results using
Theorem 1 and varying d
Theorem 2 h(d, a) can be computed through the following recursive formula:
h(d, a) =
{
1, if d ≤ a
1 +∫ ib
0 λe−λ(a−x)h(d−a,r−a+x)S(d−a,r−a+x)
S(d,a), if d > a
(4.9)
Proof: Let h(d, a, j) denote the probability to reach the destination in j hops. if
d ≤ a we obviously have h(d, a) = 1 since the message sent by the source will reach
the destination in one hop.
In the other case, the expected probability is given by:
h(d, a, j) =
∫ a
0
λe−λ(a−x)h(d− a, r − a+ x, j − 1) dx (4.10)
In this equation, λ dx refers to the probability of having a node around x, while
e−λ(a−x) represents the probability of absence of any vehicle within the interval [x, a].
As explained before, the emission of a message within a distance r by a vehicle located
in position x is equivalent to the emission of a message within a distance r−a+x by an
”imaginary” vehicle located in position a. The first message reaches the destination in
j hops if and only if the message sent by this imaginary vehicle reaches the destination
in (j − 1) hops.
Using the conditional expectation rule, the average number of hops conditionally

4.5 Average Number of Hops 72
to the success of the transmission is given by:
h(d, a) =
∞∑
j=1
jh(d, a, j)
S(d, a)(4.11)
where S(d, a) is still the probability of a successful transmission from the source to
the destination.
Replacing h(d, a, j) by its expression, Eq.4.11 becomes:
h(d, a) =
∞∑
j=1
j∫ a
0λe−λ(a−x)h(d− a, r − a+ x, j − 1) dx
S(d, a)(4.12)
h(d, a) =
∫ a
0λe−λ(a−x)
∞∑
j=1
jh(d− a, r − a+ x, j − 1) dx
S(d, a)(4.13)
Eq.4.13 can be rewritten as follows :
h(d, a) =
∫ a
0λe−λ(a−x)
∞∑
j=0
jh(d− a, r − a+ x, j)dx
S(d, a)+
∫ a
0λe−λ(a−x)
∞∑
j=0
h(d− a, r − a+ x, j)dx
S(d, a)(4.14)
Using Eq.4.11 and Eq.4.2, Eq.4.14 becomes :
h(d, a) =
∫ a
0 λe−λ(a−x)h(d− a, r − a+ x)S(d− a, r − a+ x)dx
S(d, a)+
∫ a
0 λe−λ(a−x)S(d− a, r − a+ x)dx
S(d, a)
h(d, a) =S(d, a) +
∫ a
0λe−λ(a−x)h(d− a, r − a+ x)S(d− a, r − a+ x)dx
S(d, a)
h(d, a) = 1 +
∫ a
0λe−λ(a−x)h(d− a, r − a+ x)S(d− a, r − a+ x)dx
S(d, a)(4.15)
Observe that the recursive formula (4.9) includes the success probabilities S(d, a).
That is why the success probabilities were calculated in the previous section.
Let us make the same assumptions given by Eq.4.3. Then, we get the following:
h(lb, ib) = 1 +
i−1∑
j=0
∫ (j+1)b
jbλe−λ(ib−x)h((l − i)b, (k − i)b+ x)S((l − i)b, (k − i)b+ x)dx
S(lb, ib)(4.16)
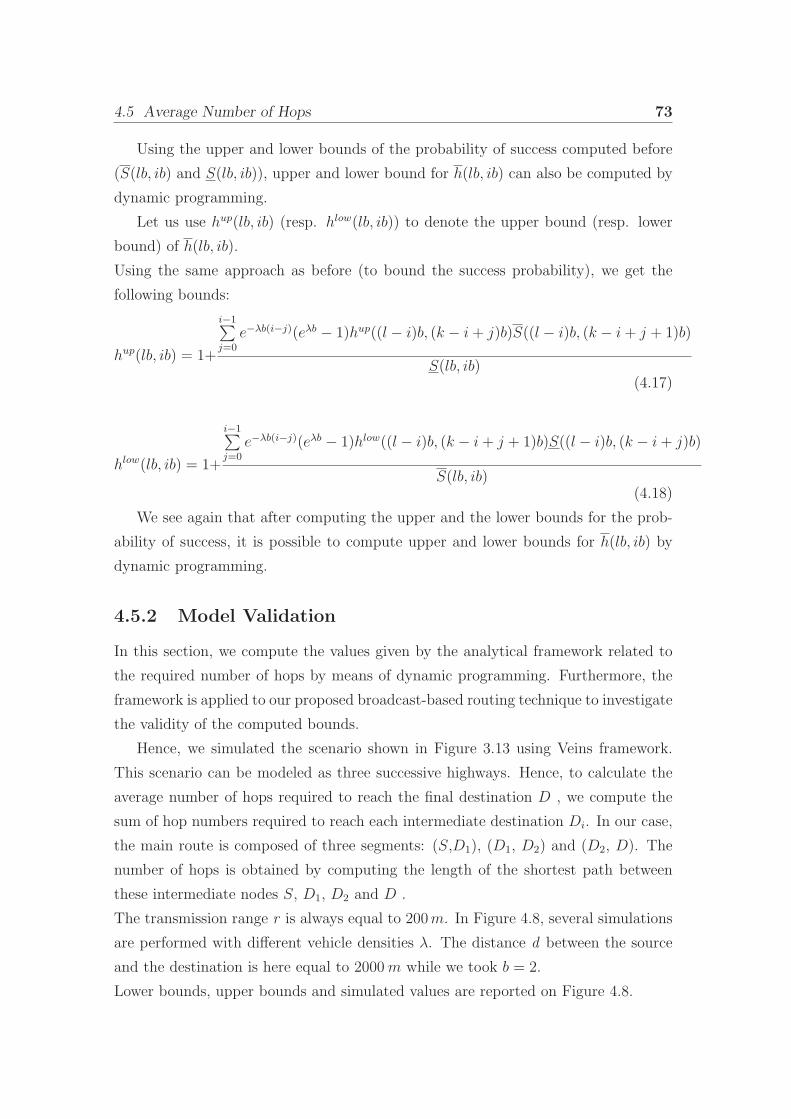
4.5 Average Number of Hops 73
Using the upper and lower bounds of the probability of success computed before
(S(lb, ib) and S(lb, ib)), upper and lower bound for h(lb, ib) can also be computed by
dynamic programming.
Let us use hup(lb, ib) (resp. hlow(lb, ib)) to denote the upper bound (resp. lower
bound) of h(lb, ib).
Using the same approach as before (to bound the success probability), we get the
following bounds:
hup(lb, ib) = 1+
i−1∑
j=0
e−λb(i−j)(eλb − 1)hup((l − i)b, (k − i+ j)b)S((l − i)b, (k − i+ j + 1)b)
S(lb, ib)(4.17)
hlow(lb, ib) = 1+
i−1∑
j=0
e−λb(i−j)(eλb − 1)hlow((l − i)b, (k − i+ j + 1)b)S((l − i)b, (k − i+ j)b)
S(lb, ib)(4.18)
We see again that after computing the upper and the lower bounds for the prob-
ability of success, it is possible to compute upper and lower bounds for h(lb, ib) by
dynamic programming.
4.5.2 Model Validation
In this section, we compute the values given by the analytical framework related to
the required number of hops by means of dynamic programming. Furthermore, the
framework is applied to our proposed broadcast-based routing technique to investigate
the validity of the computed bounds.
Hence, we simulated the scenario shown in Figure 3.13 using Veins framework.
This scenario can be modeled as three successive highways. Hence, to calculate the
average number of hops required to reach the final destination D , we compute the
sum of hop numbers required to reach each intermediate destination Di. In our case,
the main route is composed of three segments: (S,D1), (D1, D2) and (D2, D). The
number of hops is obtained by computing the length of the shortest path between
these intermediate nodes S, D1, D2 and D .
The transmission range r is always equal to 200m. In Figure 4.8, several simulations
are performed with different vehicle densities λ. The distance d between the source
and the destination is here equal to 2000m while we took b = 2.
Lower bounds, upper bounds and simulated values are reported on Figure 4.8.

4.5 Average Number of Hops 74
Figure 4.8: The average number of hops: Simulation vs. analytical results varying λ
Figure 4.9: Precision of the average number of hops model varying the density of
vehicles λ

4.5 Average Number of Hops 75
Figure 4.10: The average number of hops: Simulation vs. analytical results varying
d
From the results in Figures 4.8 and 4.9, it emerges clearly that our proposed
theoretical framework is very accurate. In particular, lower and upper bounds become
very close to the simulated value when the density increases.
Also observe that the average number of hops shown on Figure 4.8 becomes constant
when λ increases. In fact, the average number of hops is almost equal to ⌈dr⌉ for high
densities.
Moreover, several simulations are conducted with different values of d to evaluate
the behavior of the upper and lower bounds (here b = 2 and λ = 0.02). Results are
reported in Figure 4.10. The upper and the lower bounds seem to be very precise
when the ratio dris small. When the distance increases, since the bounds are computed
by dynamic programming, there is an accumulation of errors leading to less and less
precise bounds. Whereas, we observe that the simulation value is always in the range
limited by the lower and upper bounds.
In order to study the effect of the parameter b on the precision of our model, we
ran several simulations with different values of b. Figure 4.11 reveals the performance
of our analytical model when b is varying from 1 to 4 and for distance d = 2000 m.
This is also shown on Figure 4.12 where the precision rate is reported. One can
deduce clearly that b has a great effect on the precision of our model.

4.5 Average Number of Hops 76
Figure 4.11: Effect of b variation in the average number of hop model
Figure 4.12: Precision of the average number of hops model varying the parameter b
(d = 2000 m)

4.6 Conclusion 77
Hence, all of these simulation scenarii confirm the precision of our proposed mathe-
matical framework and demonstrate its robustness even with different values of vehicle
densities and end-to-end distances.
4.6 Conclusion
In this chapter, we presented a theoretical framework based on a recursive approach to
analyze the performance of our proposed broadcast-based routing technique EBDR.
Analytical bounds are proposed to compute the end-to-end probability of success
and the average number of hops in case of a successful linear transmission in a ve-
hicular context. Several simulations have been performed to evaluate the precision
of these models. Mathematical expressions match very well the simulation results.
Comparisons with conducted simulations corroborate the correctness of our analytical
approach. In addition, the validity of our framework is not limited to our special case
but span to other node distributions where the average positions are equally spaced.
We also showed that if the transmission range is r, the number of hops to reach a
destination located at a distance d is between drand 2d
r.
In the next chapter of this thesis, we will present an improvement of EBDR
protocol that offers greater efficiency without penalizing its reliability.

Chapter 5
Broadcast-based directional Routing
scheme for VANETs with Transmission
Range Adjustment
Contents
5.1 Introduction . . . . . . . . . . . . . . . . . . . . . . . . . . 78
5.2 Problem Statement . . . . . . . . . . . . . . . . . . . . . . 79
5.3 State of the Art . . . . . . . . . . . . . . . . . . . . . . . . 80
5.4 Proposed Technique . . . . . . . . . . . . . . . . . . . . . . 83
5.4.1 Design Goal . . . . . . . . . . . . . . . . . . . . . . . . . . . 83
5.4.2 Broadcasting Scheme . . . . . . . . . . . . . . . . . . . . . . 84
5.4.3 Transmission Range Adjustment Technique . . . . . . . . . 84
5.5 Evaluation Study . . . . . . . . . . . . . . . . . . . . . . . . 85
5.5.1 Proposed Technique in Real Vehicular Road Network . . . 86
5.5.2 Proposed Technique in an Uniform Node Distribution Scheme 90
5.6 Conclusion . . . . . . . . . . . . . . . . . . . . . . . . . . . 97
5.1 Introduction
In a dissemination vehicular scenario, it is primordial that all vehicles concerned by
the alert packet receive the warning as quickly as possible. In chapter 3, we saw that
78

5.2 Problem Statement 79
our proposed broadcast-based routing technique EBDR performs well this function
and presents essentially a very good efficiency in total transmission delay. In fact, in
spite of the broadcast nature of the proposed technique, all transmissions stop very
soon after the arrival of a packet to its destination and the messages propagation is
limited by destination zone.
The focus of this chapter is on increasing the efficiency of EBDR message delivery
by minimizing the bandwidth consumption as well as the interferences level. In other
words, we investigate here the following fundamental question: how can we achieve a
high reachability while minimizing the inherent effects of high transmission power for
a beamforming-based broadcast scheme in multihop wireless vehicular networks ? To
circumvent this challenge, we will present through this chapter, an enhanced version of
EBDR which maintains a high efficiency and a good reachability while severally min-
imizing the bandwidth consumption. This new technique proposes a fully distributed
scheme that allows nodes to set dynamically their transmission range based on their
local densities and the distance to the destination. Conducted simulations confirm
the efficiency of our enhanced technique for several performance metrics. Moreover,
we present an analytical framework that offers some insights about the behavior of
our technique in the case of an uniform node distribution suitable to wireless adhoc
network schemes.
5.2 Problem Statement
In vehicular communication, message propagation and dissemination occurs very of-
ten and have to be done in small delays. Therefore, reliability and low delay are
extremely significant factors for VANETs applications. Generally, in a wireless trans-
mission process, a larger transmission radius is often desirable to achieve a greater
progress. However, a larger transmit power also lead to a huge amount of interferences
between neighbor nodes, higher probability of packet collisions with other concurrent
transmissions and channel contention.
As a consequence, various methods have been proposed to implement congestion
control schemes. Amid them, transmission range adjustment technique (or trans-
mission power control) has shown its merit as a crucial countermeasure to minimize
interferences and guarantee a high reachability for the multihop transmission oper-
ation. The principle behind the concept is that reducing the transmission power
of vehicles will also decrease the number of nodes participating in the broadcasting

5.3 State of the Art 80
operation and then reduce the number of hidden terminals and packet collisions for
each transmission. An important challenge related to transmission range adjustment
technique should not be forgotten: the trade off between reducing the transmission
range (which prevents the message from reaching some vehicles located further) and
the reduced transmit power which inhibit a node to interfere with communications
occurring away.
Moreover, smart antennas (directional antennas) mitigate interference with beam-
based transmission range. In fact, in a beamforming mode, the antenna sends and
receives signals inside its sector limited by the angle of beamforming θ. Hence, the
gain outside the sector is approximated to zero and the interferences are almost null.
Hence, the combination between beamforming-based broadcast and transmission
range adjustment technique can further improve the efficiency of the dissemination
process. This feature represents the main key behind the conception of the reliable
version of EBDR.
5.3 State of the Art
In this section, we present the relevant approaches that address transmission range
adjustment techniques for multihop wireless networks.
In [102], authors focus on preserving the energy and maintaining the connectivity
of the mobile nodes and propose an approach to control the energy used in adhoc
networks. Their technique is based on varying the transmission range of the commu-
nicating nodes. In fact, this variation depends from the local density of the concerned
node: if the node has no neighbors, the transmission range takes the maximum value.
Otherwise, it will be equal to the farthest neighbors distance in order to maintain the
sufficient number of neighbors. The absence of any analytical model to evaluate their
approach constitutes the main weakness of this work.
The concept of power management in wireless adhoc networks is studied in [103].
Authors proposal is based on a clustering scheme wherein a node adapts its transmit
power to establish connectivity with only a limited number of neighborhood nodes.
Within a cluster, a node may adapt its power transmission to communicate with
neighboring nodes or it might use the same power with all nodes located in the
cluster. Nevertheless, this technique assumes that each node broadcasts a signaling
packet containing its local connectivity table information to construct a global view of

5.3 State of the Art 81
the network. This can lead undoubtedly to a huge overhead and a scalability problem
since it is not feasible for each node to store the entire global topological information.
In [104], Claudio E. Palazzi and al. proposed the Fast Broadcast (FB) protocol
for vehicular networks which uses a distance-based approach with an estimated trans-
mission range. This latter reduces the number of redundant transmissions as well as
the hops to be traversed. Their scheme is composed of two phases. The first one,
named estimation phase, aims to provide each vehicle with an up-to-date estimation
of its forward and backward transmission range. The second, called broadcast phase,
is performed only when a message has to be broadcasted to all cars in the senders
area of interest. During the estimation phase, each car tries to estimate its transmis-
sion range (frontward and backward) by the means of hello messages. Each vehicle
maintains two variables called: Current-turn Maximum Front Range (CMFR) and
Current-turn Maximum Back Range (CMBR). The former reflects the estimation
of the maximum frontward distance from which another car along the strip-shaped
area-of-interest can be heard by the considered one. The latter estimates the max-
imum backward distance at which the considered car can be heard. In the sending
operation, each node proceeds with transmitting a hello packet that includes the es-
timated maximum frontward transmission range. For the receiving procedure, the
vehicle takes the maximum value among the distance between the considered car
and the hello message sender, sender’s transmission range estimation (provided by
the hello message), and its CMFR value. Obviously, this technique introduces an
overhead caused by the periodic exchange of the hello messages.
Authors in [105] propose a dynamic transmission range assignment scheme called
DTRA that adjusts a vehicle transmission range based on the estimation of its local
traffic density. Their proposition uses an analytical traffic flow model to derive an
expression of the local vehicle density which makes vehicles able to adjust the trans-
mission range. This technique is dedicated to highway roads only, and can not be
generalized to a planar case. The DTRA functioning mechanism is based on the ratioTs
Ttto distinguish between free-flow and congestioned traffic conditions. In fact, Ts
depicts the time during which a vehicle remains motionless and Tt represents a short
time window. A high value of this fraction highlights a non congested traffic and a
low vehicle density. Hence, the algorithm sets the transmission range to its maximum
level in this case to maintain reachability.
M.Torento and al. [106] considered a fully distributed strategy to adjust each
vehicle transmission power. Their proposal, namely D-FPAV, aims to control the

5.3 State of the Art 82
channel load by adjusting the transmission power of each vehicle and hence minimize
the packet collisions. The optimization is built upon the concept of fairness and the
ability of every communicating vehicle to send and receive alert messages in a fair
way. In fact, according to the authors, the amount of load resulting from beaconing
should be limited in order to avoid a high number of packet collisions and leave some
available bandwidth to handle the emergency messages. Therefore, they define a
specific maximum threshold value of load for the beacons namely MaxBeaconingLoad
(MBL). The goal is to adjust the transmission power used for beaconing messages in
order to keep the load in the medium below MBL. Each node collects continuously
the power used by its neighboring nodes and computes the maximum common value
Pi of the transmit power for all of them. Since this value is locally obtained, D-FAPV
node circumvent this problem by broadcasting this common value Pi to all nodes in
its range. In addition, the node receives the power levels computed by the nodes in
its vicinity and then can calculate the final transmit power level, which is set to the
minimum among the value Pi computed by the node itself and the values received
from nodes in the vicinity. Despite the acceptable results given by D-FPAV, it still
introduce an important overhead when broadcasting at each time interval the values
of the computed transmission powers.
Another effort made by B.Rawat and al. [107] focuses on dynamic adaptation
of joint transmission power and contention window considering vehicle densities and
network traffic conditions. Indeed, their proposed algorithm adapts the transmission
power based on estimated traffic density: As such, the concerned vehicle counts its
neighboring vehicles based on the sequence number acknowledgement received from
them and evaluates the local density of vehicles by taking the ratio of total reachable
neighbors to the maximum possible number of vehicles on the given road segment.
For the adaptation of QoS parameters (e.g. contention window), the prioritization
is assigned according to the relevance of the message and time delay requirements.
To this end, they incorporated the enhanced distributed channel access (EDCA)
mechanism from the IEEE 802.11e standard.
Finally, in [108], authors address inter vehicle communication with stop and go
waves and carried out an algorithm to adjust the transmission range of vehicles with
the aim to achieve a better reliability. They study communication on highways with
single-hop periodic broadcast. Their proposed scheme adjusts the transmission range
by taking into account the variance coefficient of vehicles’ spacing. The adjusted

5.4 Proposed Technique 83
range is computed as follows:
TRadj(m) = (1 +m× CV )× TRavgsp
Where CV depicts the coefficient of variation of spacing for all vehicles in the
traffic stream. For some traffic models, this parameter can be computed. m refers
to the order of magnitude for increasing CV and TRavgsp corresponds to the average
vehicle spacing over the entire traffic stream. Based on NS2 simulations, they prove
that their technique realizes good packet reception rates. This technique is based
on the prior known of the value of the parameter CV which is possible only in the
case of some traffic models. Otherwise, to compute this value, a global knowledge
of the network and a periodic exchange of messages containing the precise positions
of vehicles will be required. Hence, these constraints represent a weakness for this
proposal.
5.4 Proposed Technique
In this section, we present our congestion control mechanism based on a distributed
adjustment of the transmission power for all vehicles. First of all, we outline the
rationale behind our transmission control strategy and then we detail the functioning
principles of our proposal. Finally, we give an overview of the simulation results
followed by an analytical model to validate the efficiency of our strategy.
5.4.1 Design Goal
Based on the previous study of existing works, we observe that the transmission
control techniques that try to improve the packet reachability at close distance from
the senders will also reduce the transmission range in a very acute way leading to the
stop of the propagation. Therefore, an approach is needed that balances both packet
reception probability and transmission range and at the same time this balance must
be adapted to varying network densities. In addition, such a control transmission
mechanism have to be totally distributed in order to minimize the overhead related to
message exchange compared to a centralize approach. Unfortunately, there is a dearth
of literature that studies this balance and tries to implement a totally distributed
technique. In addition, all these efforts study the performance of their contributions
empirically and do not provide any analytical proof of their efficiency. In the following,
our goal is to implement a totally distributed approach that controls the transmission

5.4 Proposed Technique 84
range of all vehicles and adapts them to the local densities. In addition, we derive
an analytical model to capture the transmission shape in the case of a uniform node
distribution scheme.
5.4.2 Broadcasting Scheme
For the purpose of developing our technique R-EBDR (Reliable EBDR), we assume
that the broadcasting technique is based on the same principles used above for EBDR
(Chapter 3) i.e., we use directional antennas with broadcasting to disseminate the
message to a specific destination. The main enhancement key concerns the transmis-
sion range adjustment of vehicles by enabling these latter to set dynamically their
transmission power based on their distance to the destination and the local nodes
densities.
5.4.3 Transmission Range Adjustment Technique
In the previous chapter, we used a fixed transmission range for all the participating
nodes to disseminate the alert packets with EBDR. In this part, the proposed scheme
adjusts the transmission range for each node by multiplying the original range with a
coefficient called adjustment coefficient. This coefficient is the same for all nodes. In
fact, only the sender (the node who originates the alert message) computes this coef-
ficient and then relay nodes, participating in the broadcast operation, will calculate
their transmission range based on this parameter.
Assume that the first node (the originator of the message) broadcasts the message
with an angle θ and a radius r1. This latter is a fixed parameter. The distance between
the source and the destination is denoted by d1. Therefore, the adjustment coefficient
is given by:
C =r1d1
(5.1)
This parameter has to be added to alert messages to allow other relays compute
their adjusted transmission range based on C. Indeed, we denote nodei a relay node
indexed by i. This relay is distant from the destination by di. The adjusted trans-
mission range for nodei, namely (ri) can be computed using the following rule:
ri = C ∗ di (5.2)
We notice that the above equation can lead to very little transmission range
(approximated to 0) when the relay vehicle becomes very close to the destination

5.5 Evaluation Study 85
node (di ≈ 0). This fact can easily stop the propagation of the message and hence the
rest of the participating nodes will not be reachable by the propagated information.
To alleviate this challenge, the algorithm defines a minimum transmission range
value (rmin) considered as a a minimum threshold. Thus, all nodes have to maintain
a transmission radius greater or equal to this value. In fact, rmin can be seen as the
transmission range that guarantees the existence of at least one neighboring node in
the vicinity of each forwarding node. rmin depends on the local densities of nodes
(λi) computed by each relaying nodei in the network. As demonstrated in [109], the
nodei’s local density can be expressed as follows:
λi =C i
onnectivity
π ∗ r2i(5.3)
where C ionnectivity refers to the nodei’s connectivity i.e., the number of its direct
neighbors. This latter can be easily obtained using the beaconing mechanism.
Thereby, rimin can be expressed as:
(rimin)2 ∗
θ
2∗ λi ≈ 1 (5.4)
Consequently, we obtain rimin ≈√
2θ∗λi
. Thereby, Eq.5.2 can be rewritten as
follows :
ri = max(rimin, C ∗ di) (5.5)
This new expression of ri guarantees a none-zero dynamic transmission range for
the communicating nodes and therefore reachability for distant neighbors.
5.5 Evaluation Study
In this section, we first investigate the performance of our proposed transmission
range adjustment technique in the case of a vehicular network. Then, we compare it
to our previous work EBDR (i.e. A fixed transmission range for the beamforming-
based broadcast scheme) [1]. To this end, we developed our Matlab [110] [111] based
simulation tool and performed simulation with real street maps. As a meaningful
performance metrics, we focus on the impact of this technique on bandwidth and
power utilization. These metrics are illustrative of the efficiency of the proposed
transmission range adjustment technique in minimizing interferences and keeping the
average number of implicated nodes as small as possible, yet guaranteeing end-to-
end reachability. To this end, we study the performance of our proposal in terms of
probability of success (i.e the probability of the alert message to reach the destination).

5.5 Evaluation Study 86
Another major contribution of this part is the development of an analytical model
aiming at estimating the transmission area of the forwarding process in the case of
a simplified multihop nodes distribution. The model is compared to simulations to
validate its exactness.
5.5.1 Proposed Technique in Real Vehicular Road Network
In this section, we investigate the performance of our proposed technique in a vehicu-
lar environment by using real road-based network simulations. To make the proposed
scheme tractable, we make the following assumptions:
1. We assume an ideal MAC layer without contention, collision, or node mobility.
2. All nodes have the initial transmission range equal to 200 m.
3. The number of vehicles was varied from from 250 to 1000.
4. We vary the beamforming angle θ from 22.5◦ to 135◦.
We assume that the vehicles are distributed on each lane of the streets according
to a Poisson process of intensity λ = 0.04. In other words, the distance between
two consecutive vehicles follows an exponential distribution. The average distance
between two vehicles is 1λ. This assumption is based on some traffic studies that have
proved that the inter-vehicle spacing on a highway can be modeled by an exponential
distribution [112].
Assumption related to the nodes mobility (1), can safely be adopted since during
rush hour urban traffic the velocity of vehicles is limited and the vehicles density is
very important. Indeed, the speed of nodes in such case, compared to the duration
of wireless transmission, is very small and therefore we can assume that the node
positions and connectivity do not change significantly from a broadcast operation to
another.
Furthermore, we use the framework OpenStreetMap for Matlab [111] to construct
a real road topology. Indeed, we have chosen, using the same approach as the previous
chapter, the ”Champs-Elysees” avenue to test our transmission range adjustment for
broadcast-based routing in VANETs. The broadcast process is triggered along this
street. Details of the simulation setup parameters are listed in Table 5.1.

5.5 Evaluation Study 87
Table 5.1: Simulation Configurations
Parameter Value
Number of vehicles from 250 to 1000
Beamforming angle θ from 11.25◦ to 120◦
Initial distance d1 1500m
Initial transmission range r1 200m
Coefficient C 0.13
Two main scenarios are considered here: Fixed and dynamic transmission ranges
are used in the beamforming broadcast process. Notice that the initial transmission
range r1 used in the dynamic approach is supposed to be equal to the fixed radius
used in the fixed technique. Figures 5.1(a) and 5.1(b) provide a comparison of the
snapshot of the relaying nodes involved in the transmission process for both the
two approaches. The maps represent a zoom of one region of the Champs- Elysees
street. Circled nodes denote the vehicles implicated in the forwarding operation. We
observe that, with the dynamic transmission range, nodes located on the side streets
are not participating in the broadcast process contrary to the fixed transmission
radius technique. Furthermore, the adjusted radius technique reduces the number of
implicated vehicles in the Champs-Elysees main street compared to the fixed range
method. Hence, we can conclude that the adjustment of the transmission radius
significantly reduces the number of implicated nodes.
(a) Approach 1: Fixed Transmission
Range
(b) Approach 2: Dynamic Transmission
Range
Figure 5.1: Implicated Nodes in the forwarding process for the 2 approaches

5.5 Evaluation Study 88
Figure 5.2: Power transmission gain
Figure 5.2 depicts the gain in power transmission when varying the angle θ and the
distance between the source and the destination. This gain is computed as follows:
Gpower = 1−Pf − Pd
Pf
(5.6)
where Pf and Pd refer to the power used by all participating nodes in case of fixed
and dynamic transmission radius respectively. In the case of directional antenna, the
transmission power is proportional to the square of the transmission range r. Thus,
Pf and Pd can be respectively expressed as :
β ∗m1 ∗ r21
and
β ∗m2∑
j=1
r2j
Hence, Eq.5.6 can be simplified as follows:
Gpower = 1−
∑m2
j=1 r2j
m1 ∗ r21(5.7)
where m1 and m2 are respectively the implicated nodes in the broadcasting opera-
tion with fixed and dynamic transmission ranges. From Figure 5.2 we notice that our
technique maintains for all cases (n = 500 and n = 750) a gain greater than 55%. We

5.5 Evaluation Study 89
remark also that even using wide values of θ, the power gain stills important. This
leads obviously to less interferences and packet loss. Thus, our adjustment technique
excels in power preservation compared to a fixed transmission range approach.
In Figure 5.3, we investigate the proportion of implicated nodes in the beamforming-
based broadcast operation when varying the density of vehicles. The top two lines
are for nodes using a fixed transmission radius with variation of the density of nodes
from 750 to 500. The bottom two lines depict the effect of adjusting the transmis-
sion range for the same values of nodes densities. When nodes transmit with a high
beamforming angle, we observe an increase in the ratio of implicated nodes for the
two scenarios. We also notice that transmitting messages within a limited beamwidth
as well as with an adjusted transmission range reduces severally the number of nodes
having to relay the message compared to a fixed transmission range approach.
Figure 5.3: Ratio of implicated nodes: Comparison overview
In Figure 5.4, we illustrate the variation of the probability of transmission success
as a function of θ and the density of nodes. The top two lines show the success
probability for 750 and 500 vehicles using a fixed transmission range. Whereas the
bottom lines show this metric for a dynamic radius scenario for the same values of
nodes densities. Obviously, the probability of transmission success increases as the
density of nodes increases leading to less fragmentation in the network. Although
the transmission range adjustment technique results in little lower performance, one
can see clearly that the curves are close. This observation underlines the trade off

5.5 Evaluation Study 90
achieved by our proposal for a high reachability while minimizing at the same time
the bandwidth utilization.
Figure 5.4: Probability of transmission success: Comparison overview
5.5.2 Proposed Technique in an Uniform Node Distribution
Scheme
While in the previous section we have considered a vehicular environment where
nodes are placed along roads and intersections, we now investigate the performance
of the proposed approach when the participating nodes are randomly positioned in a
rectangular area of 3500×2000m2 according to a Poisson process of density λ. λ can
be obtained by dividing the total number of nodes by the area of the rectangle. This
node distribution scheme practically corresponds to a wireless adhoc network where
nodes are uniformly distributed in a geographic zone. All assumptions given in the
previous part are still maintained here. The distance d1 represents how far the message
transmission is expected to go ahead. It can be a distance threshold imposed by upper
applications. The performance of our technique will be studied through simulations,
which will be properly described before presenting the obtained results. We provide
afterwards an analytical model to estimate the area of messages transmission (i.e
the message’s forwarding zone). Comparison with simulation findings confirms the
correctness of the theoretical expressions.

5.5 Evaluation Study 91
5.5.2.1 Simulation Results
Figure 5.5 presents a comparison of the snapshot of the relaying nodes participating
in the transmission operation for both the two approaches. As expected, our tech-
nique with the transmission power adjustment feature performs a less participating
ratio compared to the fixed transmission range technique. This is of course logical
since the proposed approach adjusts the transmission range according to the distance
separating the current source from the destination. This mechanism decreases, in
most cases, the transmission power of each relaying node which results obviously in
less number of vehicles receiving the information. On the other hand, the fixed trans-
mission range approach doest not do any optimization to reduce the transmission
power as the message is propagated toward the destination.
(a) Approach 1: Fixed Transmission Range(b) Approach 2: Dynamic Transmission
Range
Figure 5.5: Uniform distribution: Implicated nodes for the 2 approaches
Figure 5.6 outlines the gain in power transmission during the broadcast operation,
calculated using Eq.5.6, when varying the beamforming angle θ and the distance d1.
We observe that transmission range adjustment technique allows a good gain in power
utilization such as the previous node distribution case. In addition, the values for the
two scenarios are close.
Figure 5.7 depicts the variation of the probability of transmission success consid-
ering different values of distance d1. We notice that the proposed technique ensures
a high reachability even in the case of a little density of nodes. We see also that
the power efficiency technique achieves less performance than the fixed transmission
range-based technique. Nevertheless, the two curves are still very close. These results

5.5 Evaluation Study 92
Figure 5.6: Power transmission gain
Figure 5.7: Effect of d on the the probability of success
show that our approach performs well and fulfills its design functionality i.e., it is able
to deliver the message to the destination with a good success probability while min-
imizing at the same time the bandwidth and power consumption. This observation
corroborates the robustness of our scheme.

5.5 Evaluation Study 93
5.5.2.2 Analytical Model for the Transmission Area
We provide in the following an analytical model to estimate the area of message
transmission (i.e the messages forwarding zone) in the case of an uniform node dis-
tribution. The communicating nodes are uniformly positioned in a rectangular area.
The goal of this part is to compare this analytical model to the ratio of implicated
nodes (carried out by simulations in the previous section). Each node broadcasts the
message according to an angle θ within a radius r proportional to the distance d as
indicated by Eq.5.2. Therefore, the propagation shape of the forwarding area can be
approximated by Figure 5.8.
Figure 5.8: Forwarding shape with dynamic transmission range
The transmission zone can be approximated by a set of triangles having the des-
tination node as a common vertex. Each two consecutive triangles have a common
vertex in addition to the destination. The vertex of a each triangle Tr(i), whose first
vertex is located at a distance di of the destination, is obtained by considering that
there is a mobile node transmitting according to an angle θ and within a transmission
range ri proportional to the distance di (see Eq.5.2). This figure has to be consid-
ered as an approximation of the actual area of transmission since we have added the
supposition of the existence of a minimum transmission range in the broadcasting
operation.
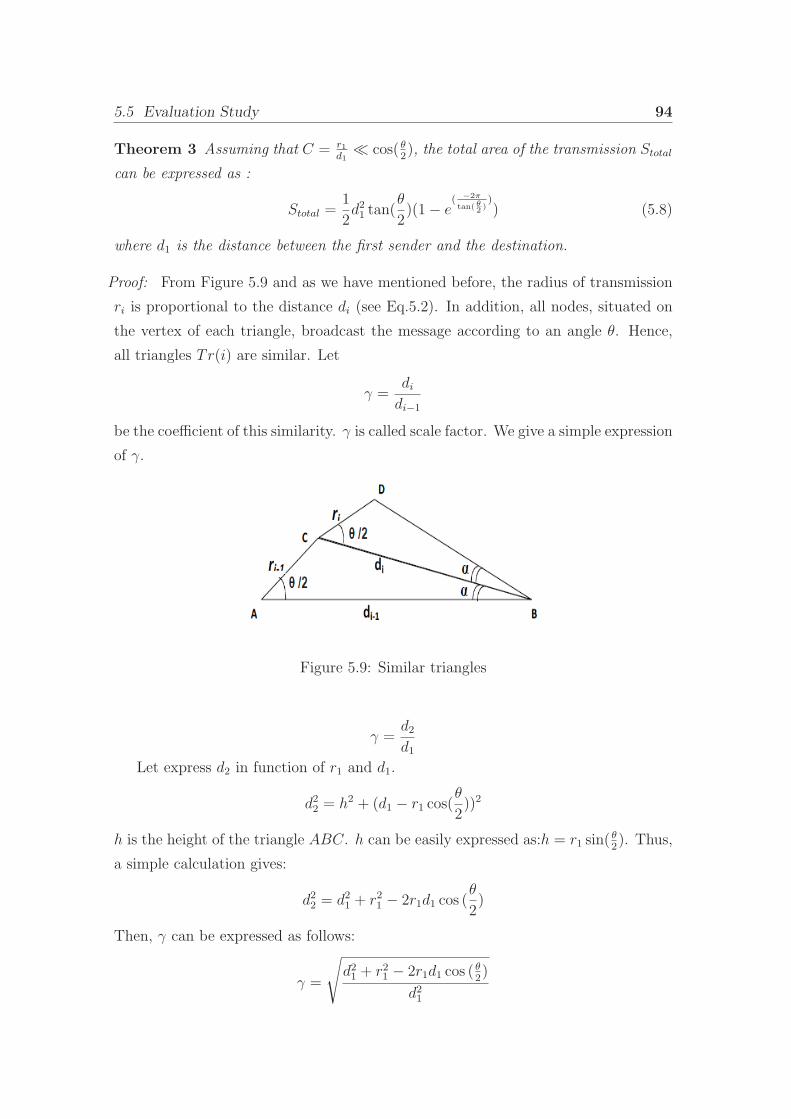
5.5 Evaluation Study 94
Theorem 3 Assuming that C = r1d1≪ cos( θ
2), the total area of the transmission Stotal
can be expressed as :
Stotal =1
2d21 tan(
θ
2)(1− e
( −2π
tan( θ2 ))) (5.8)
where d1 is the distance between the first sender and the destination.
Proof: From Figure 5.9 and as we have mentioned before, the radius of transmission
ri is proportional to the distance di (see Eq.5.2). In addition, all nodes, situated on
the vertex of each triangle, broadcast the message according to an angle θ. Hence,
all triangles Tr(i) are similar. Let
γ =didi−1
be the coefficient of this similarity. γ is called scale factor. We give a simple expression
of γ.
Figure 5.9: Similar triangles
γ =d2d1
Let express d2 in function of r1 and d1.
d22 = h2 + (d1 − r1 cos(θ
2))2
h is the height of the triangle ABC. h can be easily expressed as:h = r1 sin(θ2). Thus,
a simple calculation gives:
d22 = d21 + r21 − 2r1d1 cos (θ
2)
Then, γ can be expressed as follows:
γ =
√
d21 + r21 − 2r1d1 cos (θ2)
d21

5.5 Evaluation Study 95
γ =
√
1 +r21 − 2r1d1 cos (
θ2)
d21(5.9)
In Eq.5.9,r21−2r1d1 cos (
θ2)
d21≈ 0(d1 ≫ r1), then a limited development gives :
γ = 1 +1
2(r21 − 2r1d1 cos (
θ2)
d21) ≈ 1−
r1 cos(θ2)
d1(5.10)
We denote α the angle ABC. Then, the total number of triangles Tri situated on
the half plane containing the source is given by :
N ≈π
α(5.11)
where
α ≈ sin(α)
≈r1 sin(
θ2)
d2
α ≈r1 sin(
θ2)
γd1(5.12)
The elementary surface of each triangle Tri, denoted as Si, can be computed as
follows :
Si =1
2ridi sin
θ
2(5.13)
The similarity between triangles Tri implies that Si = γ2iS1. Then, the total area of
transmission can be given by:
Stot = 2N∑
1
Si ≈ 2N∑
1
γ2iS1 ≈ 2S1
N∑
1
γ2i ≈ 2S11− γ2N
1− γ2(5.14)
Using the fact that xy = eyLn(x), and the assumption r1d1≪ cos( θ
2), γ2N can be
expressed as
γ2N ≈ e2NLn(γ)
≈ e2NLn(1−
r1 cos( θ2 )
d1)
γ2N ≈ eN(
−2r1 cos( θ2 )
d1)
(5.15)

5.5 Evaluation Study 96
Eq.5.15 can be more simplified by using Eq.5.11, Eq.5.12 and the fact that γ ≪ 1.
We obtain then:
γ2N ≈ e(−2π cot θ2) (5.16)
By using formula (5.10) and replacing γN by its expression, Eq.5.14 can be expressed
as:
Stot ≈ 2S1(1− e(−2π cot( θ
2))
2r1 cos(θ2)
d1
)
Stot ≈ 2S1(d1(1− e−2π cot( θ
2))
2r1 cos(θ2)
) (5.17)
Hence, replacing S1 by its expression, Eq.5.17 becomes :
Stot = 21
2r1d1 sin (
θ
2)(d1(1− e−2π cot( θ
2))
2r1 cosθ2
)
Stot =1
2d21 tan(
θ
2)(1− e
( −2π
tan( θ2 ))) (5.18)
Note that the area of transmission does not depend on the initial radius r1 (under
the assumption r1d1≪ cos( θ
2)).
With the above analytical result, we investigate hereafter the accuracy of our
theoretical approach by comparing it to simulation results. Note that, the comparison
analysis is presented here in terms of the ratio of implicated nodes.
For that purpose, we present in Figure 5.10 a comparison of the implicated nodes’
ratio for both simulation and theoretical results. We consider, for the simulation
scenario, a total number of communicating nodes equal to 3000.
The top two lines correspond to the case where the initial distance d1 is equal to
3 Km while the bottom curves are for d1 equal to 1 Km. We clearly observe that
the gap between the simulation and the theoretical curves is very tight in the two
cases. Thus, our proposed analytical model provides a good approximation of the
real transmission shape.

5.6 Conclusion 97
Figure 5.10: Comparison between the theoretical and practical values of the impli-
cated nodes
5.6 Conclusion
In this chapter, we have considered the problem of transmission range adjustment
in a multihop wireless network context. An optimized technique devoted to the
adaptation of the transmission radius based on nodes’ local densities and the distance
to the destination was proposed. It uses the beamforming-based broadcast technique
presented in chapter 3 to broadcast the messages. It also introduced a congestion
control mechanism allowing vehicles to adapt their transmission power during the
broadcast process. For the performance evaluation, we have tested our approach in
two different network distribution: vehicular environment and wireless adhoc scheme.
Conducted simulations for vehicular networks using real street maps corroborate
the efficiency of our proposed scheme in terms of ratio of implicated nodes, power
transmission gain and probability of transmission success. Our technique confirmed
its capacity in maintaining high delivery ratio while minimizing at the same time
bandwidth consumption. We have also evaluated our approach in the case of an
uniform node distribution and findings confirm the previous results. As a major
contribution as well, we have derived an analytical model that provides an estimation
of the transmission area. Our mathematical expression stands out for its simplicity
and independence from the initial radius r1. Simulation results match very well the
mathematical expressions and confirm the merit of the analytical model.

Chapter 6
Adaptive Data Collection Protocol using
Reinforcement Learning for VANETs
Contents
6.1 Introduction . . . . . . . . . . . . . . . . . . . . . . . . . . 98
6.2 State of the Art . . . . . . . . . . . . . . . . . . . . . . . . 99
6.3 ADOPEL: Proposed Collection Technique . . . . . . . . 102
6.3.1 System Specifications . . . . . . . . . . . . . . . . . . . . . 102
6.3.2 Protocol Design . . . . . . . . . . . . . . . . . . . . . . . . . 103
6.4 Performance Evaluation . . . . . . . . . . . . . . . . . . . 110
6.4.1 Simulation Design . . . . . . . . . . . . . . . . . . . . . . . 110
6.4.2 Simulation Results . . . . . . . . . . . . . . . . . . . . . . . 111
6.5 Conclusion . . . . . . . . . . . . . . . . . . . . . . . . . . . 115
6.1 Introduction
As mentioned at the outset, we are interested through this thesis on enhancing
vehicular communications under different scenarios and optimizations. Each of our
contributions focus on a particular research field of the VANET world and tries to
address the relevant challenges of nowadays VANET studies. Previous proposals in-
vestigated the dissemination process in VANETs and implemented techniques (direc-
tional broadcast, congestion control) to minimize interferences and save bandwidth.
In addition, mathematical frameworks were derived to study the performance of our
98

6.2 State of the Art 99
proposals analytically and confirm simulations results. In this part of this thesis, we
will be focusing on a different VANET challenging domain called data collection. As
any research field, a lot of work has been published on data collection techniques since
they make inter-vehicle communications more efficient and reliable while minimizing
bandwidth utilization. In fact, most of VANET applications are based on a dissemi-
nation process [1] [113] [114] [115] [116] on which an information must be propagated
to rather long distance so that drivers can be alerted in advance. Since each vehicle
in a vehicular environment can detect a hazardous situation or a congestion zone,
the number of messages pumped on the network might increase dramatically. Hence,
data collection, as a technique aiming at collecting similar packets from moving vehi-
cles and aggregating them, is regarded as an important approach to circumvent these
problems.
In literature there are several proposals studying data collection protocols in
VANETs. However, in our opinion, the existing related works are still not satis-
factory, and we feel it is possible to obtain better results. First of all, most the
proposed techniques were adapted from MANET proposition and their adjustment
to vehicular conditions raises a lot of discussions and critics.
Furthermore, most of the proposed approaches ignore the fast topology changes
of VANETs and therefore their performance and effectiveness in such conditions rise
some doubts.
To fill this gap, we propose in this chapter a novel data collection technique devoted
to vehicular networks, denoted as ADOPEL, designated with the goal of making the
collecting operation more reactive to nodes mobility and topology changes. It is based
on a distributed Qlearning technique where a reward function is provided and defined
to take into account the delay and the number of aggregatable packets.
Before continuing with the remainder of this chapter, a review of existing tech-
niques is necessary in order to underline the novelty of our approach. Then, the
system specification is presented afterward followed by an underlining of the basic
design of our proposal and its functioning principles. Finally, simulations results are
presented and discussed to confirm the effectiveness of our technique.
6.2 State of the Art
Data gathering related literature reveals two main aspect for gathering issues. On one
hand, some contributions focus on the manner of routing the aggregatable messages

6.2 State of the Art 100
along farther distance in order to improve the aggregation ratio (data collection).
On the other hand, other studies concentrate on expressing data to be aggregated
differently by using compressing and merging methods to reduce the overhead [117].
In our case, we focus on how to route the aggregatable packets to a specific destination
node in order to improve the data collection ratio and hence obtain more accurate
global traffic information. Hence, we are not interested here on the mechanisms to
express data differently.
Several works have been proposed to investigate the data collection concept by
adopting different approaches.
In [118], authors propose a location service management protocol that solves the
location querying and updating problems by aggregating the location information
data. In this scheme, the vehicle’s mobility space is viewed as a grid network which
is partitioned into several segments and each segment is divided into a number of
cells. The central node of a segment plays the location server role. This server is
responsible for storing current location information about all nodes belonging to the
same segment. Then, the server aggregates this information and broadcast it to the
neighbors. In addition, the protocol uses message aggregation in location querying. It
introduces some delays before forwarding the queries in order to gather more queries
and aggregate them. This proposal is based on poor flooding to disseminate data
on the network which presents a great weakness for this approach. In addition, the
choice of the grid structure for the vehicle’s mobility space is not justified and makes
some ambiguous in this work.
B. Yu et al. in [119] focus on making similar reports broadcasted by vehicles meet-
ing each other in order to be aggregated together. In fact, this technique dynamically
changes the forwarding speed of nearby reports so that they can be delivered to the
same node at the same time and then be merged into a single report. This adaptive
forwarding is based on a distributed learning algorithm on which each node learns
from local observations and chooses a delay based on the learning results. Simulation
results outline the effectiveness of the proposed technique.
In [120], authors present their proposal, called CASCADE, where they expose a
new clustering-based data aggregation technique. This protocol uses two types of
reports: primary and aggregated records. The first ones are broadcasted periodically
by the nodes and comprise the local view of each vehicle. Then, the local view
is grouped into clusters and used to compact and aggregate the local view data
into an aggregated record. This aggregated record is then broadcast to neighboring

6.2 State of the Art 101
vehicles to provide them information about vehicles beyond the local view. This
technique allows vehicles to have an extended view of the road behind and then
accurate information about upcoming traffic conditions. However, their approach
introduced a large overhead to build the global view.
Another effort carried out by Y. Dieudonne et al. in [121] focuses on a distributed
collection information for VANETs. It collects data produced by vehicles using inter-
vehicle communications only. It is based on the operator ant allowing to construct a
local view of the network and therefore to collect data in spite of the network topology
changes. A theoretical proof of correctness and experiments confirm the efficiency of
the proposed technique.
Nadeem et al. [122] introduce a system for data dissemination and aggregation
in a vehicular context namely Traffic View. In this system, an aggregate record is
composed of specific information: single speed, position, timestamp value and a list
of vehicle’s IDs. The authors propose two aggregation schemes: ratio and cost based
techniques. In the ratio-based, the most important parameter is the aggregation ratio
which indicates the number of vehicles to be aggregated into one single frame. For the
cost based technique, a specific cost function is defined for each aggregating vehicle.
A high cost is assigned for the vehicles that are close to the aggregating node. Thus,
the produced view of traffic is not useful to any vehicle unless it is in the proximity
of the aggregating vehicle.
Lochert et al. in [123] [124] focus on cooperative information gathering and sharing
applications in VANETs and propose a hierarchical aggregation algorithm. Their
proposal is based on a probabilistic data representation Flajolet-Martin sketches,
which they extended to a soft-state data structure. In their scheme, there is no
longer a need to decide which aggregate contained more up-to-date information since
the resulting aggregate comprises all the information from all aggregates that have
been merged. Nevertheless, this work does not consider routing related-issues but
focus only on data representation.
The aforementioned aggregation/collect approaches do not strictly consider the
potentially mobility issue and the collection ratio in finding a suitable relay in the
collect process. In fact, most of the listed works focus on the representation and
the processing of the aggregated data and neglect how to obtain the raw information
among the running vehicles. In the next section, we present in depth our proposal
which is interested on collecting aggregatable packets from vehicles taking into ac-

6.3 ADOPEL: Proposed Collection Technique 102
count the dynamicity of the network. We use Q-learning method to select next hops
aiming at collecting more raw data.
6.3 ADOPEL: Proposed Collection Technique
Hereinafter, we introduce ADOPEL technique- an Adaptive distributed Data cOl-
lection Protocol using rEinforcement Learning for VANETs. The proposal is based
on a distributed learning algorithm on which a reward function is defined. This lat-
ter takes into account the delay and the number of aggregatable packets and hence
makes the collection operation more reactive to nodes mobility and topology changes.
After describing the system specifications, we show the functioning algorithm of our
technique to investigate in details the different working steps of ADOPEL.
6.3.1 System Specifications
ADOPEL considers that each communicating vehicle knows its current position and
speed using a positioning system such a Global Positioning System (GPS). Further-
more, we assume that vehicles exchange two types of messages: beacons and event
driven messages. Where the former aims at improving driver awareness of surround-
ing environment by exchanging information about position, velocity, direction, etc.,
and the latter is triggered when a vehicle needs to collect traffic data toward a control
center.
This collect operation is started by a node called initiator and involves a limited
number of vehicles. Here, the initiator is a vehicle that is leading a group of nodes
and running in a highway. The initiator, at each gathering operation, is randomly
selected from vehicles. Thereby, the initiator have to collect the traffic data from
vehicles and deliver it to a Traffic Control Center (TCC) in order to be processed
and studied (see Figure 6.1). We assume here that TCCs are sufficiently deployed
along the freeway.
In a vehicular context, the collect of traffic related data is periodically carried out
and transmitted to a TCC in order to have an up to date big picture of the road.
Thus, ADOPEL triggers periodically a collect operation from the initiator toward a
TCC. The collected data is provided to the TCC when this latter is reachable by
the node ending the gathering operation. To limit the collection process, we use a
dcollect parameter, representing the depth of the collecting operation, i.e. the maximal
distance in meters from the initiator. Indeed, this parameter reflects the zone that

6.3 ADOPEL: Proposed Collection Technique 103
Figure 6.1: ADOPEL functioning Overview
will be concerned by the collecting process. Thus, each additional meter increases the
total duration of the collect as well as the number of messages to collect; dcollect is then
an interesting parameter, impacting directly the performance of our proposal. The
type of data to be collected is specified by the initiator and included in the collect
packets. For instance, in our scenarios, ADOPEL deals with collecting the speed of
surrounding vehicles with the aim of computing the average speed of the concerned
road. However, this data type can be extended to other useful information as well as
real-time fuel consumption, pollution indicators and parking lots availability services,
etc. As mentioned previously, we focus on the manner of routing the aggregatable
messages (selecting the appropriate relay) along farther distance in order to improve
the data collection ratio.
6.3.2 Protocol Design
6.3.2.1 Distributed Qlearning in ADOPEL
The frequent topology changes in the vehicular context make it necessary to adapt
the aggregation and the forwarding policy to the network state. In fact, it is difficult
to predict in advance the set of rules that will adjust the actions of each vehicle when
the vehicular environment’s variables are changing.
Fortunately, the reinforcement learning techniques [125] can tackle these problems.

6.3 ADOPEL: Proposed Collection Technique 104
In reinforcement learning, each vehicle is a learner. Each vehicle tries to optimize
its interactions with the very dynamic environment through its experience. The
experience here is expressed in terms of errors and rewards. In addition, the vehicles
collaborate with each other to share their feedbacks and establish the distributed
learning system.
In this work, we model the aggregation operation in VANET as a Markov decision
problem that can be solved by reinforcement learning. Each vehicle (agent) decides
at each state which action to take based on its experience. After taking an action,
the agent gets a reward or a cost from the environment.
The Markov decision problem is defined as a tuple s, a, r
• s is the states set; In our work, the packet state is the current vehicle.
• a is the set of actions a vehicle can perform: in our scheme, the action of a node
is to select the next relay that will maximize the aggregation ratio. Hence, the
possible set of actions allowed at each node is nothing but the set of neighbors.
• r is the immediate reward a vehicle may receive after taking an action a.
To solve this MDP model, we propose to use a reinforcement learning algorithm.
The literature provides a large number of reinforcement learning approaches, such as
temporal difference learning, direct utility estimation and Q-learning [126]. We are
motivated to use Q-learning algorithm since it allows comparing the expected utility
of the available actions without requiring knowledge of the environment’s model.
A Q(s, a) matrix is used to store the learned reward/cost for each state and action
pair. For example Q(s, a) is the expected reward for taking an action a at state s.
The updating function of Q(s, a) is defined as:
Q(s, a) = (1− α) ∗Q(s, a) + α ∗ (r + γ ∗maxa′Q(s′, a′)) (6.1)
Where
• α denotes the learning rate which model here how quickly the Q-values can
change with a dynamic network topology.
• γ refers to the discount factor. It models the fact that immediate reward is
or not more valuable than future reward. If this value is high, future rewards
are more valued than immediate reward. In the opposite case, the learning
algorithm count immediate rewards more strongly.

6.3 ADOPEL: Proposed Collection Technique 105
• r represents the expected immediate reward of executing action a at state s.
• Maxa′Q(s′, a′) models the maximum expected future reward when the system
reaches the state s′ after taking the action a.
The most important challenge to successfully achieve the collection performance is
to define the suitable reward function. In fact, the vehicle will use this function to
update its forwarding policy.
For immediate rewards, we consider the most relevant parameters effective in
decision. First factor is based on the number of neighboring vehicles that each node
possesses in its transmission range. In fact, the reward should be more for a vehicle
with a high number of neighbors. Secondly, the aggregation proposal must route the
packet to the destination in a limited delay. Thus, the node has to choose the node
that offers the most relevant advance to the destination. It is worth saying that our
proposal focuses on a collection process rather than a rapid propagation of a packet
in the network. This observation has to be considered on the reward function.
Based on these decision factors, we formulate the reward function as follows :
r =
β ∗ (1− 1data(i)
) + (1− β) ∗ ( adv(i)adv(i)avg
)
if next hop is not the destination
K1 if next hop is the destination
−K1 if the vehicle hasn’t neighbors
(6.2)
The reward function considers several routing scenarios to improve the aggregation
ratio and guarantee a steady advance to the destination.
The first item in Eq.6.2 combines the normalized number of neighboring nodes that
the next hop possesses and its normalized progress toward the destination. adv refers
to the advance of the node i (current node) to the destination vehicle D, situated at
a distance dcollect from the initiator, by choosing the neighboring node j as the next
hop. This parameter d can be seen as the depth in distance of the collection process.
Hence, this advance can be expressed ad follows:
adv(ij) = dist(i, d)− dist(j, d) (6.3)
The average advance is given by:
adv(i)avg = (t
∑
k=1
adv(ik))/nbneighbor(i) (6.4)
where t = nbneighbor(i) is here the total number of neighbors of node i. Thus, more
reward is assigned to the next hop with more neighbors and larger relative advance.

6.3 ADOPEL: Proposed Collection Technique 106
In fact, a node with a higher number of surrounding vehicles and a higher advance
toward the TCC allows respectively a larger quantity of collected data and a faster
delay to reach the destination.
The second item in Eq.6.2 denotes the reward if the node can reach directly the
destination D. In this case, the reward is a positive constant K1.
Finally, the last item is to solve the ”void” problem in geographic routing. In
fact, when a node receives a packet and cannot find a neighboring vehicle, its drops
the packet and sends a negative reward to the sending node to inform a forwarding
failure. Then, the sending node will choose another vehicle to send the packet based
on the Q-values. The node with the highest Q-value will be selected.
As an important feature in our proposal, we use a variable discount factor called
γ′to handle the instability of the vicinity. This parameter depends on the link stability.
In fact, the node selected as a next relay is the vehicle that will spend more time in
the vicinity of the sending vehicle. In this way, we ensure that the route we select is
more stable. For that purpose, we define a stability factor SFi as:
SFi =
√
|Ni|⋂
|Ni+1||Ni|
if |Ni| 6= 0
0 Otherwise(6.5)
Where Ni (Ni+1 respectively) is the current neighbor set of the sending node i (the
forwarding node i+1 respectively). Neighbor list can be attached to the hello messages
exchanged between vehicles. As aforementioned, the SF will reflect a higher value for
a relatively stable couple of neighbors. Then, a node calculates the discount factor γ′
as :
γ′ = γ ∗√
SFi (6.6)
Therefore, every time a node has a packet to send, it calculates the reward for its
neighboring set, the stability factor and updates the Q-values of its matrix using the
following equation:
Q(s, a) = (1− α) ∗Q(s, a) + α ∗ (r + γ′ ∗maxa′Q(s′, a′)) (6.7)
The vehicle with the highest Q-value will be selected as next hop.
6.3.2.2 Exploration vs Exploitation:
In reinforcement learning there is a balance between exploitation and exploration.
Exploitation occurs when the action selection strategy is based on the highest value

6.3 ADOPEL: Proposed Collection Technique 107
of the Qtable. In this case, exploitation will lead to locally optimal policies since the
selection is greedy. In the case of most of the optimization problems, this will not
lead necessary to a global optimum.
On the other hand, exploration consists on taking risk by choosing the non-optimal
action and exploring other choices to obtain more knowledge about the network.
Obviously, excessive exploration degrades the performance of the Qlearning approach.
Thus, convergence is an important issue for our proposed algorithm. Neverthe-
less, in [127], authors demonstrate that a Q-learning scheme converges to the opti-
mum actions-values provided that ”all actions are repeatedly sampled in all states
and action-values are represented discretely”. Here, the conditions of convergence
are insured. In fact, ADOPEL uses hello messages to sample all its neighbors by
computing the γ′ factor. In addition, the action-values (Q-values) are represented
discretely in ADOPEL. As a result of that, we can say loudly that our proposed
technique converges to the optimum action values.
6.3.2.3 ADOPEL Algorithm Overview
Based on the description given in the previous section, we summarize here the different
steps of ADOPEL. As stated above, each node uses the received ”hello” messages
from neighbors to a build a neighboring node table. The ”hello” messages contains
in addition to the usual information the list of neighboring nodes. This way, each
vehicle can maintain its two-hop neighbor list and can easily compute the stability
factor given by Eq.6.5.
Algorithm 2 shows the different steps of the execution of ADOPEL on a each
node i whenever this latter receives a collect request. This execution is triggered
periodically by an initiator node.
As illustrated by Figure 6.2, upon receiving a relaying request, the first step
undertaken by a node i aims at collecting data from neighbors by sending them a
collect data request. Afterward, the node processes the data received (eg: it computes
the average value of the received ones) and starts the relaying process. For the relaying
process, it classifies the neighboring nodes on three different lists. Highest priority is
attributed to vehicles that are more surrounded and closest to the final destination
node situated at a distance dcollect. Notice that a vehicle with a large number of
neighboring nodes leads to a larger quantity of collected data.
The second phase consists on selecting the appropriate relay node based on the
previous classification (see Figure 6.2(c)). This operation depends on the Q-values of

6.3 ADOPEL: Proposed Collection Technique 108
Algorithm 2 ADOPEL algorithm, for evry node i
1: Send a data collection request to neighboring nodes.
2: L1, L2, L3 are 3 lists initialized by NULL.
3: Qi is initialized based on the number of surrounding vehicles and the advance
toward the destination.
4: Ni is the neighboring nodes set of node i
5: if ”Ni 6= ∅ then
6: for j ∈ Ni do
7: i compares each of its neighboring node j as follows :
8: if ”nbneighbor(j) 6= 0 and (advance(j) > advance(i))” then
9: L1← j
10: end if
11: if ”nbneighbor(j) = 0 and (advance(j) > advance(i))” then
12: L2← j
13: end if
14: if ”nbneighbor(j) 6= 0 and (advance(j) ≤ advance(i))” then
15: L3← j
16: end if
17: end for
18: if ”L1 6= ∅” then
19: Next hop will be the one with largest Q-Value
20: end if
21: if ”L1 = ∅ & L2 6= ∅” then
22: The node with largest Q-Value will be the next hop
23: end if
24: if ” L1, L2 = ∅ & L3 6= ∅” then
25: Next Hop will be chosen from L3 with the highest Q-Value
26: end if
27: i relays the message to the selected next hop after making aggregation (com-
puting average value)
28: else
29: /* Ni is empty */
30: i generates a negative reward
31: i chooses its previous source as the next hop.
32: end if
33: i computes the reward after making the relaying process based on 6.2
34: i updates the Q-Value Q(s, a) using Eq.6.7

6.3 ADOPEL: Proposed Collection Technique 109
(a) Collecting data from vehicles (b) Classification of neighboring vehicles
(c) Selection of the next relay (d) Updating Q-Values
Figure 6.2: ADOPEL algorithm overview
each candidate node. In fact, nodes with high values of Q are prosperous. Once the
selection of the relay vehicle is performed, the sending node computes the immediate
reward r and then calculate the total expected reward Q(s, a).
Since the collection process is periodically initiated by the initiator, a node i is
involved in this operation for few times before leaving the concerned road. Thus, the
vehicle learns from its acquired experience (rewards or costs) to select the appropri-
ate relay node ensuring a good collection ratio and a faster propagation toward the
destination.

6.4 Performance Evaluation 110
6.4 Performance Evaluation
In this section, we show our simulations results and investigate the performance of
our proposal in terms of collection ratio and number of hops. We compare our scheme
to a non-learning protocol. We call a collection technique ”nonlearning” when a first
part of relays are selected based on the number of their neighboring cars and the other
part are selected based on their advance toward the final destination. The destination
is situated at a distance dcollect behind the initiator.
6.4.1 Simulation Design
We used MATLAB to conduct simulations using Freeway mobility model. The free-
way mobility model emulates the motion behavior of vehicles in a freeway. In our
study, we use a freeway which has two lanes in each direction. All lanes of the freeway
are 20Km in length (see Figure 6.3)
Figure 6.3: ADOPEL Simulation framework
To make the proposed scheme tractable, we make the following assumptions:
• We assume an ideal MAC layer without contention and collision.
• All nodes have the initial transmission range equal to 200m.
• The number of vehicles was varied from from 200 to 400.
• All vehicles are initially positioned at the entrance of the freeway.
6.4 Performance Evaluation 111
• We respectively assigned to α, β and γ the following values: 0.8, 0.7 and 0.8.
• For the data collection depth, we set dcollect equal to 1500m.
In addition, each vehicle stores its own Q-values and the ones received from neigh-
boring nodes (using hello messages) in a matrix to be used in the relaying process.
Furthermore, we compare our scheme to a non-learning version. For that purpose,
we suppose for the non-learning schemes that at each relaying operation, a node has
a 20 percent (respectively 40 percent) probability of choosing the most surrounding
vehicles as a next relay and 80 percent (respectively 60 percent) to choose the node
with the largest advance toward the destination node.
6.4.2 Simulation Results
In this section, we focus on the performance of our technique both for the average data
collecting ratio and the average number of hops required to reach the final destination
node.
Figure 6.4 depicts the average data collection ratio when varying the density of
nodes for the two techniques. We can observe that our proposed scheme outperforms
loudly the nonlearning versions. In fact, in all cases, ADOPEL achieves a gain of
over than 20% compared to the other techniques. This can be explained by the fact
that in very dynamically changing networks as VANETs, ADOPEL can change adap-
tively to better relaying nodes to increase the collect ratio as the network topology
changes, whereas the others non-learning protocols find major difficulties to adapt to
the dynamicity of the network.
To make a fair analysis, we investigate in Figure 6.5 the average number of hops
needed to travel the collect distance dcollect. Indeed, a good collect ratio might have
a heavy cost and then can be a real weakness for the algorithm. However, 6.5 shows
that the gap between the three techniques is very tight even ADOPEL achieves higher
values than the others schemes. This clearly implies that our technique achieves a
good trade-off between delays and collection ratio. This is because ADOPEL takes
the stability of vicinity into account which yields in a higher probability of using nodes
moving in the same direction as the destination node to relay aggregated messages.
On the other side, in non-learning versions, the source node may select a node moving
in opposite direction as a next hop which can very vulnerable. As a result, many data
collection operations may be penalized when relaying vehicles became far away from
the destination.

6.4 Performance Evaluation 112
Figure 6.4: The average data collect ratio: ADOPEL vs Non-learning versions
Figure 6.5: The average number of hops: ADOPEL vs Non-learning versions

6.4 Performance Evaluation 113
To unravel the impact of the depth of the collecting operation on the performance
of our proposed technique, we investigate afterward the variation of the parameter
dcollect and how it will affect the collection ratio and the total number of hops required
to reach the TCC. The total number of moving vehicles is equal to 400 for all the
following scenarios.
In Figure 6.6, we show the variation of the collection ratio as a function of the dis-
tance dcollect. We clearly observe, for the three collecting scheme, that the greater the
distance dcollect the higher the ratio of collected packets. This observation is perfectly
expected because when the distance dcollect increases, this means that the gathering
operation will be extended to an additional parts of the vehicular network and hence
it will touch more vehicles. Therefore, the ratio of the implicated vehicles in the
collecting operation increases resulting in a higher gathering percent. However, our
proposal performs better performance than the non-learning techniques. It can be
observed also that the outperformance of ADOPEL is more clear for longer distance.
This can be explained by the fact that longer distances permit to the learning oper-
ation to be more efficient when updating the Q-learning values since we have in this
case a more global view of the network which affects the learning process.
Figure 6.6: Effect of the variation of dcollect on the ratio of collected packets

6.4 Performance Evaluation 114
In the following, we present in Figure 6.7 the impact of dcollect on the number
of hops to reach the control center. Obviously, as dcollect increases, the number of
required relays to reach TCC become more important. This observation underlines
the need of a good trade-off between the two metrics : collection ratio and end-to-end
delays. Higher delays may be accepted for non sensitive delay applications (like e-
traffic and infotainment applications, etc.), however, for e-safety applications, delays
have to be less as possible. The comparison, as shown in Figure 6.7 between learning
and non-learning techniques reveals that our technique achieves better results than
the other approaches specially when the distance dcollect is very important. This can
be explained by the fact that with a higher distance non learning distance encounters
several difficulties in finding the good path toward the TCC regarding the instability
of wireless links between neighboring nodes and the higher probability to choose the
vehicle moving in the wrong direction. On the other side, ADOPEL, with its stability
approach to choose next relays (SFi factor) and learning technique, overcomes the
negative effects of large distances and achieves better results in all cases.
Figure 6.7: Effect of the variation of dcollect on the number of hops

6.5 Conclusion 115
6.5 Conclusion
In this chapter, we have tried to tackle another inherent challenging problem related
to vehicular communications by developing a data collecting technique aiming at
gathering raw data from moving vehicles. We proposed a total distributed scheme,
namely ADOPEL, based on a Qlearning technique making the collecting operation
more reactive to nodes mobility and topology changes. For that purpose, we defined
a reward function to take into account the delay and the number of aggregatable
packets. In addition, a novel expression of the discount factor γ′ was provided to
handle the instability of the vicinity and to choose the most stable route toward the
control center where the raw data will be treated. The Q-learning technique offered
to vehicles the opportunity to optimize their interactions with the very dynamic
environment through their experience in the network.
To analyze the performance of our proposal, we compared it to a non-learning
version to study the effect of the learning technique. We used two important metrics
which are directly linked with the efficiency of our collecting approach: The collection
ratio and the number of hops. A good technique must achieve a trade off between
these two metrics to guarantee its success. Our simulation results show that our
technique far outperforms other propositions and achieves a good trade off between
delay and collection ratio.

Chapter 7
Conclusion and Ongoing Work
7.1 Conclusion
Vehicular networks arise from the incessant need of having safer roads and smooth
driving during our daily journeys. This type of networks has given birth to a large
variety of applications ranging from safety applications which aim to increase the
user and vehicle safety to comfort applications like internet connection or file sharing.
Most of safety applications, if not all, are based on a dissemination process since they
need to disseminate the alert information among a large number of moving vehicles
or a specific geographic zone.
In our search for a better approach to disseminate emergency message in VANETs
among the existing techniques in literature, we have examined, as a first contribu-
tion of this thesis, the problem of multihop broadcasting information in a vehicular
environment. We have presented our broadcast-based directional routing technique,
denoted as EBDR. EBDR is firstly based on a route guidance algorithm responsi-
ble for choosing the better route in which the alert packet will be propagated. The
choice of this route can be adjusted according the user preferences (shortest path,
road with high density of vehicles, etc.). In addition, EBDR uses directional anten-
nas to transmit the message among neighboring vehicles. These smart antennas have
shown their merit in the conservation of bandwidth, energy consumption as well as
the minimization of wireless interferences when compared to other omnidirectional
antennas. Conducted simulations using a dedicated VANET simulator, have corrob-
orated the efficiency of our technique in comparison to the flooding technique and
shown that EBDR maintained a low bandwidth consumption and low end-to-end de-
livery delay. Interestingly, in spite of the broadcast nature of the proposed technique,
116

7.1 Conclusion 117
all transmissions, in our proposal, stop very soon after the arrival of a packet to its
destination. In addition, the arrival time at destination is almost the same as the
total broadcast delay: when the packet arrives at the destination D, all transmissions
are almost implicitly stopped. This feature represents a major key in our modeling
conception and underlines the efficiency of our technique.
Afterward, we have investigated the evaluation of our proposed technique EBDR
analytically. As such, we have constructed a novel complete mathematical frame-
work based on a recursive approach that offers precious insights about the protocol
behavior. In fact, our analytical models provided uppers and lower bounds for two
performance metrics: the probability of transmission success and the average number
of hops to reach the final destination. This contribution presented the first attempt to
investigate this number of relays (or hops) in this specific scheme of a known destina-
tion. The pertinence of our analytical expressions have been verified by comparisons
with simulation results. Findings confirmed the correctness of the proposed analyt-
ical framework. Thereby, our mathematical framework stands out as a promising
mathematical tool to evaluate the performance of end-to-end linear propagation in
any mobile adhoc networks.
On the basis of the performance shown by the EBDR protocol in the first chapter,
we have presented an improvement of EBDR aiming at guaranteeing a greater effi-
ciency (a smaller number of implicated nodes in the multihop transmissions), without
penalizing the reachability of the EBDR first version. For that purpose, we added a
congestion control mechanism to the EBDR protocol called transmission power ad-
justment. In fact, transmission power control has a great impact on the number of
hidden nodes, and can increase the spatial reuse, and hence the channel capacity, in a
congested network like a vehicular network. The new technique proposes a fully dis-
tributed scheme that allows nodes to set dynamically their transmission range based
on their local densities and the distance to the destination. Conducted simulations
confirmed the efficiency of our enhanced technique for several performance metrics.
Moreover, we presented an analytical framework that offers a good attempt to model
the behavior of our technique in the case of an uniform node distribution suitable to
wireless adhoc network scheme.
Finally, we were interested on the data collection mechanisms devoted to VANETs.
This field of research is challenging regarding the rapid changing topology in vehic-
ular networks and in consequence the instability of links between moving vehicles.
To tackle this challenge, we proposed an Adaptive Data cOllection Protocol using

7.2 Future Directions 118
rEinforcement Learning (ADOPEL). It is based on a distributed Qlearning technique
making the collecting operation more reactive to nodes mobility and topology changes.
In fact, the frequent topology changes in the vehicular context make it necessary to
adapt the gathering and the forwarding policy to the network state. In fact, it is
difficult to predict in advance the set of rules that will adjust the actions of each
vehicle when the vehicular environment’s variables are changing. Fortunately, the re-
inforcement learning techniques can tackle these problems since each vehicle tries to
optimize its interactions with the very dynamic environment through its experience
expressed in terms of errors and rewards. Simulation results confirm the efficiency
of our technique compared to a non-learning version and demonstrate the trade-off
achieved between delay and collection ratio.
7.2 Future Directions
The analysis and findings presented in this thesis report have shown a good per-
formance for our proposed technique EBDR, as well as its improved version and
specially the impressive correctness of our mathematical framework devoted to linear
propagation in VANETS. Nevertheless, several future research directions open up.
First of all, we envision to enhance the broadcast technique EBDR with a dynamic
adjustment of the beamforming angle θ to make it more adaptive to the local density
of nodes and hence improve the bandwidth utilization and reduce the interferences
between nodes. In fact, smart antennas have these capabilities of changing the direc-
tion as well as the width of beams transmitted toward the required destination. As
such, we will grasp all the potential capabilities offered by these smart antennas.
In addition, we are interested on information relaying in the planar case. We aim
at providing a complete mathematical framework that will be able to investigate the
performance of multihop protocols in this special case. We think that our analyti-
cal model presented in chapter 4 represents a good starting point to design such a
complete framework.

Bibliography
[1] A. Soua, W. Ben-Ameur, H. Afifi, Broadcast-based directional routing in vehic-
ular ad-hoc networks, Joint IFIP Wireless and Mobile Networking Conference
(WMNC), pp. 48-53, Bratislava, Sept. 2012.
[2] A. Soua, W. Ben-Ameur, H. Afifi, Analysis of information relay processing in
inter-vehicle communication: A novel visit, IEEE 8th International Conference
on Wireless and Mobile Computing, Networking and Communications (WiMob),
pp. 157-164, Barcelona, 2012.
[3] A. Soua, W. Ben-Ameur, H. Afifi, Beamforming-Based Broadcast Scheme for
Multihop Wireless Networks with Transmission Range Adjustment, IEEE/IFIP
Annual Conference on Wireless On-demand Network Systems and Services
(WONS), pp. 107-109, March 2013.
[4] A. Soua, and H. Afifi, Adaptive Data Collection Protocol using Reinforcement
Learning for VANETs, IEEE International Wireless Communications and Mobile
Computing Conference (IWCMC), pp. 1040-1045, July 2013.
[5] GPS, URL: http://www.gps.gov/systems/gps.
[6] B.K. Chaurasia, R.S. Tomar, G.S. Tomar, Suitability of MANET Routing Proto-
cols for Vehicular Ad Hoc Networks, International Conference on Communication
Systems and Network Technologies (CSNT), pp. 334-338, 2012.
[7] E. Spaho, M. Ikeda, L. Barolli, F. Xhafa, Performance Evaluation of OLSR and
AODV Protocols in a VANET Crossroad Scenario, IEEE International Confer-
ence on Advanced Information Networking and Applications (AINA), pp. 577-
582, 2013.
119

BIBLIOGRAPHY 120
[8] L. Junhai, Y. Danxia, X. Liu, F. Mingyu, A survey of multicast routing protocols
for mobile Ad-Hoc networks, IEEE Communications Surveys & Tutorials, vol.
11, pp. 78-91, 2009.
[9] W. Viriyasitavat, O.K. Tonguz, F. Bai, Network Connectivity of VANETs in
Urban Areas, IEEE Communications Society Conference on Sensor, Mesh and
Ad Hoc Communications and Networks (SECON), pp. 1-9, 2009.
[10] S. Yousefi, E. Altman, R. El-Azouzi, , Study of connectivity in vehicular ad hoc
networks, International Symposium on Modeling and Optimization in Mobile,
Ad Hoc and Wireless Networks and Workshops (WiOpt), pp. 1-6 2007.
[11] A.Mahajan , N. Potnis , K. Gopalan , An-I A. Wang, Urban mobility models for
VANETs, IEEE Workshop On Next Generation Wireless Networks, 2006.
[12] T. Kosch, C.J. Adler, S. Eichler, C. Schroth,The scalability problem of vehicular
ad hoc networks and how to solve it, IEEE Wireless Communications, vol. 13,
pp. 22-28, 2006.
[13] The Institute of Electrical and Electronics Engineers, IEEE Standard for Infor-
mation technology–Telecommunications and information exchange between sys-
tems Local and metropolitan area networks–Specific requirements Part 11: Wire-
less LAN Medium Access Control (MAC) and Physical Layer (PHY) Specifica-
tions, 2012.
[14] The Institute of Electrical and Electronics Engineers, EEE Standard for
WirelessMAN-Advanced Air Interface for Broadband Wireless Access Systems
–Amendment 2: Higher Reliability Networks, 2013.
[15] Xavier Lagrange, Philippe Godlewski, Sami Tabbane, Reseaux GSM : des
principes a la norme, Editions Hermes Sciences, ISBN 2-7462-0153-4, 2000.
[16] The Institute of Electrical and Electronics Engineers, 802.15.1-2005 - IEEE
Standard for Information technology– Local and metropolitan area networks–
Specific requirements– Part 15.1a: Wireless Medium Access Control (MAC)
and Physical Layer (PHY) specifications for Wireless Personal Area Networks
(WPAN), 2005.

BIBLIOGRAPHY 121
[17] M.S. Al-kahtani, Survey on security attacks in Vehicular Ad hoc Networks
(VANETs), International Conference on Signal Processing and Communication
Systems (ICSPCS), 2012.
[18] M.S. Al-kahtani, A Framework for Secure and Efficient Data Acquisition in Ve-
hicular Ad Hoc Networks, IEEE Transactions on Vehicular Technology, vol.62,
pp. 536-551, 2012.
[19] CAR 2 CAR Communication Consortium, C2C-CC Manifesto, Version 1.1, Au-
gust, 2007.
[20] SAFESPOT, URL: http://www.cvisproject.org.
[21] CVIS, URL: http://www.cvisproject.org.
[22] SeVeCom, URL: http://www.sevecom.org.
[23] K. Takada and T.Wada, Progress of Road-Automobile Communication System,
Journal of Transportation Engineering, vol. 116, pp. 436-441, 1990.
[24] V. Council, VICS Promotion Council Safety Committee Report on Information
Display, Tokyo, Japan, VICS Promotion Council, 1993.
[25] AHS, URL: http://www.fhwa.dot.gov/publications/publicroads/94summer/
p94su1.cfm
[26] I. America, Strategic plan for intelligent vehicle-highway systems in the United
States, Final Report, May, vol. 20, 1992.
[27] Federal Highway Administration, The Intelligent Vehicle Initiative: Advancing
”Human-Centered” Smart Vehicles, Vol. 61, no. 2, September 1997.
[28] F. Bai, T. Elbatt, and G. Hollan, Towards characterizing and classifying
communication-based automotive applicat ions from a wireless networking per-
spective, IEEE Workshop on Automotive Networking and Applications (Au-
toNet), 2006.
[29] International Organization for Standardization, Intelligent transport systems -
Communications access for land mobiles (CALM) – Architecture, 2010.
[30] International Organization for Standardization (ISO), URL: http://www.iso.org.

BIBLIOGRAPHY 122
[31] Dedicated Short Range Communications (DSRC), URL: http://
www.its.dot.gov/DSRC.
[32] Infrared Radiation (IR), URL: http://www.dpfwiw.com/ir.htm.
[33] European Telecommunications Standards Institute (ETSI), Intelligent Transport
Systems (ITS); Communications Architecture, V1.1.1, September, 2010.
[34] European Telecommunications Standards Institute (ETSI), URL: www.etsi.org.
[35] European Telecommunications Standards Institute (ETSI), IEEE Draft Guide
for Wireless Access in Vehicular Environments (WAVE) - Architecture, pp. 1 -
74 June, 2013.
[36] Institute of Electrical and Electronics Engineers (IEEE), URL: www.ieee.org.
[37] IEEE Computer society, IEEE Standard for Information technology– Local and
Metropolitan area networks– Specific requirements– Part 11: Wireless LAN
Medium Access Control (MAC) and Physical Layer (PHY) Specifications Amend-
ment 6: Wireless Access in Vehicular Environments, 2010.
[38] The Institute of Electrical and Electronics Engineers, IEEE Trial-Use Standard
for Wireless Access in Vehicular Environments (WAVE)-Resource Manager, Oc-
tober 2006.
[39] The Institute of Electrical and Electronics Engineers, IEEE Standard for Wire-
less Access in Vehicular Environments - Security Services for Applications and
Management Messages, April 2013.
[40] The Institute of Electrical and Electronics Engineers, IEEE Standard for Wire-
less Access in Vehicular Environments (WAVE) - Networking Services, 2010.
[41] The Institute of Electrical and Electronics Engineers, IEEE Standard for Wire-
less Access in Vehicular Environments (WAVE) - Multi-channel Operation,
February 2011.
[42] C.D. Wang, and J.P. Thompson, Apparatus and method for motion detection and
tracking of objects in a region for collsion avoidance utilizing a real-time adpative
probabilistic neural network, U.S patent no. 5.613.039, 1997.
[43] European project REACT, http://www.react-project.org.

BIBLIOGRAPHY 123
[44] F. Soldo, C. Casetti, C.F. Chiasserini, and P.A. Chaparro, Video Streaming Dis-
tribution in VANETs, IEEE Transactions On Parallel and Distributed Systems,
Vol. 22, no. 7, July 2011.
[45] F. Li, Y. Wang, Routing in vehicular ad hoc networks: A survey , IEEE Vehicular
Technology Magazine, vol.2, pp. 12-22, Jun. 2007.
[46] J. Bernsen, D. Manivannan, Unicast routing protocols for vehicular ad hoc net-
works: A critical comparison and classification, Pervasive and Mobile Comput-
ing, vol.5, pp. 1-18, Feb. 2009.
[47] S. Basagni, M. Conti, S. Giordano, I. Stojmenovic, A Taxonomy of Data Com-
munication Protocols for Vehicular Ad Hoc Networks, Mobile Ad Hoc Net-
working:The Cutting Edge Directions, Wiley-IEEE Press, pp. 515-544, ISBN:
9781118511305.
[48] A. Boukerche, Vehicular Ad Hoc Networks: An Emerging Technology Toward
Safe and Efficient Transportation, Algorithms and Protocols for Wireless, Mobile
Ad Hoc Networks , Wiley-IEEE Press, pp. 405-432, ISBN: 9780470396384.
[49] B. Clifford Neuman, Scale in distributed systems, Readings in Distributed Com-
puting Systems, CA: IEEE Computer Society, vol.5, pp. 463-489, Feb. 1994.
[50] M. Slavik, I. Mahgoub, On the scalability of wireless multi-hop broadcast protocols
with respect to density in VANET, International Conference on Communications
and Information Technology (ICCIT), pp. 92-95, 2011.
[51] N. Wisitpongphan, O.K. Tonguz, J.S. Parikh, P. Mudalige,Broadcast storm miti-
gation techniques in vehicular ad hoc networks, IEEE Wireless Communications,
pp. 84-94, 2007.
[52] S. Park, Y. Chang, F. Khan, J.A. Copeland, Dynamic Service-Channels Alloca-
tion (DSCA) in vehicular ad-hoc networks , IEEE Consumer Communications
and Networking Conference (CCNC), 2013.
[53] A. Vinel, C. Campolo, J. Petit, and Y. Koucheryavy, Trustworthy Broadcasting
in IEEE 802.11p/WAVE Vehicular Networks: Delay Analysis, IEEE Communi-
cation Letters, vol.15, no. 9, Sept. 2011.

BIBLIOGRAPHY 124
[54] A. Vinel, C. Campolo, J. Petit, and Y. Koucheryavy, A Reception Based Node
Selection Protocol for Multi-hop Routing in Vehicular Ad-hoc Networks , IEEE
11th International Conference on Trust, Security and Privacy in Computing and
Communications (TrustCom), pp. 1593-1600, Jun. 2012.
[55] A. Bradai, H. Afifi, A Framework Using IBC Achieving Non-Repudiation and
Privacy in Vehicular Network, IEEE Conference on Network and Information
Systems Security (SAR-SSI), pp. 1-6 , May 2011.
[56] S. Ni, Y. Tseng, Y. Chen, and J. Sheu, The broadcast storm problem in a mo-
bile ad hoc network, ACM International Conference on Mobile Computing and
Networking (MOBICOM), pp. 151-162, Aug. 1999.
[57] S. Panichpapiboon, W. Pattara-Atikom, A Review of Information Dissemination
Protocols for Vehicular Ad Hoc Networks, IEEE Communications Surveys &
Tutorials, vol. 14, pp. 784-798, 2012.
[58] F. Li, Y. Wang, Routing in vehicular ad hoc networks: A survey, IEEE Vehicular
Technology Magazine, , vol. 2, pp. 12-22, 2008.
[59] M. Jerbi, S.M. Senouci, T. Rasheed, Y.G. Doudane, Towards Efficient Geo-
graphic Routing in Urban Vehicular Networks, IEEE Transactions on Vehicular
Technology, vol. 58, pp. 5048-5059, November 2009.
[60] L. Briesemeister, G. Hommel, Role-based multicast in highly mobile but sparsely
connected ad hoc networks, First Annual Workshop on Mobile and Ad Hoc Net-
working and Computing, DaimlerChrysler AG, Berlin, Germany, 2000.
[61] M. Slavik, I. Mahgoub, Spatial Distribution and Channel Quality Adaptive Pro-
tocol for Multihop Wireless Broadcast Routing in VANET, IEEE Transaction on
Mobile Computing, April, 2012.
[62] M. Sun, W. Feng, H.T. Lai, K. Yamada, H.Okada, GPS-based message broad-
cast for adaptive inter-vehicle communications, IEEE-VTS Vehicular Technology
Conference (VTC Fall), pp. 2685-2692, vol.6, Boston, MA, 2000.
[63] P.R. Singh , A. Gupta, Information dissemination in VANETs using zone based
forwarding, IFIP Wireless Days (WD), Niagara Falls, Canada, 2011.

BIBLIOGRAPHY 125
[64] M. Barradi, A.S. Hafid, S. Aljahdali, Highway multihop broadcast protocols for
vehicular networks, IEEE International Conference on Communications (ICC),
2012.
[65] K. Xu, M. Gerla, S. Bae, How effective is the IEEE 802.11 RTS/CTS handshake
in ad hoc networks, IEEE Global Telecommunications Conference (GLOBE-
COM), pp. 72-76,2002.
[66] D. Li, S. Tong, H. Huang, X. Li, M. Li , A Distance-Based Directional Broadcast
Protocol for Urban Vehicular Ad Hoc Network , IEEE Wireless Communications,
Networking and Mobile Computing (WiCom), pp. 1520-1523, Sep. 2007.
[67] CISCO, URL: http://www.cisco.com/en/US/tech/tk722/tk809/technologies
tech note09186a00807f34d3.shtml.
[68] C. Tung, M. Gerla, An efficient road-based directional broadcast protocol for urban
VANETs , IEEE Vehicular Networking Conference (VNC), Jersey City, New
Jersey, 2010.
[69] G. Korkmaz, and E. Ekiciand, Urban Multi-hop Broadcast Protocol for Inter-
Vehicle Communication Systems, ACM workshop on vehicular Ad Hoc networks
(VANET04), pp. 76-85, 2004.
[70] M. Sun, W. Feng, T. Lai, K. Yamada, H. Okada, and K. Fujimura, GPSbased
message broadcast for adaptive inter-vehicle communications, IEEE Vehicular
Technology Conference (VTC-Fall), May. 2000.
[71] A. Benslimane, Optimized Dissemination of alarm Messages in Vehicular Adhoc
Networks (VANET), IEEE International Conference on High Speed Networks
and Multimedia Communications (HSNMC04), 2004.
[72] C. Plazzi, S. Ferretti, M. Roccetti, G. Pau, and M. Gerla, How Do You Quickly
Choreograph Inter-Vehicular Communications? A Fast Vehicle-to-Vehicle Multi-
Hop Broadcast Algorithm, IEEE Consumer Communications and Networking
Conference (CCNC 2007), Jan. 2007
[73] E. Fasolo, R. Furiato, and A. Zanella, Smart Broadcast algorithm for interve-
hicular communications, IEEE Wireless Personal Multimedia Communications
Symposium (WPMC), 2005.

BIBLIOGRAPHY 126
[74] K. Tonguz, N. Wisitpongphan, F. Bai, P. Mudalige, K. Sadekar, Broadcasting
in VANET, Mobile Networking for Vehicular Environments, Anchorage, Alaska,
2007.
[75] N. Wisitpongphan, O. K. Tonguz, J. S. Parikh, P. Mudalige, F. Bai, and V.
Sadekar, Broadcast storm mitigation techniques in vehicular ad hoc networks,
IEEE Wireless Communications, vol. 14, pp. 84-94, 2007.
[76] M.Slavik, I. Mahgoub, Stochastic broadcast for VANET, IEEE Consumer Com-
munication and Networking Conference (CCNC), pp. 1-5, 2010.
[77] S. Busanelli, G. Ferrari, and S. Panichpapiboon, Efficient broadcasting in IEEE
802.11 networks through irresponsible forwarding, IEEE Global Telecommunica-
tion Conference (GLOBECOM), pp. 1-6, 2009.
[78] S. Busanelli, Efficient MultiHop Wireless Communications In VANETS, Thesis
report, 2011.
[79] A. Wegener, H. Hellbruck, S. Fischer, C. Schmidt, Efficient MultiHop Wireless
Communications In VANETS, IEEE Vehicular Technology Conference (VTC-
FALL), pp. 1947-1951, 2007.
[80] B. Blaszczyszyn, A. Laouiti, P. Muhlethaler, Y. Toor,Opportunistic broadcast in
VANETs (OB-VAN) using active signaling for relays selection , International
Conference on ITS Telecommunications, (ITST), pp. 384-389, 2008.
[81] A. Laouiti, P. Muhlethaler, Y. Toor, Reliable opportunistic broadcast in
VANETs (R-OB-VAN), International Conference on Intelligent Transport Sys-
tems Telecommunications,(ITST), pp. 382-387, 2009.
[82] K. Tonguz, ,N. Wisitpongphan,F. Bai, DV-CAST: A distributed vehicular broad-
cast protocol for vehicular ad hoc networks, IEEE Wireless Communications, vol.
17, pp. 47-57, April, 2010.
[83] D. Fei, W. Jie, Efficient Broadcasting in Ad Hoc Wireless Networks Using Di-
rectional Antennas, IEEE transaction on Parallel and distributed systems, vol.
17, no. 4, pp. 335-347, 2006.
[84] R. Ramanathan, On the performance of ad hoc networks with beamforming an-
tennas, ACM international symposium on Mobile ad hoc networking & comput-
ing (MobiHoc), pp. 95-105, New York, 2001.

BIBLIOGRAPHY 127
[85] Mappy, URL: http://www.mappy.com.
[86] C. Ghedira, W. Ben-Ameur, H. Afifi, A Novel Route Guidance Algorithm with
Maximum Coverage and Minimum Handover for Vehicular Networks, IEEE In-
ternational Conference on Networking (ICN), pp. 692-697, 2008.
[87] OMNET Simulator, URL: http://www.omnetpp.org.
[88] VEINS, URL: http://veins.car2x.org.
[89] SUMO Simulator, URL: http://sumo.sourceforge.net.
[90] M. Fiore, J. Harri, F. Filali, C. Bonnet, A Vehicular Mobility Simulation for
VANETs, Annual Simulation Symposium (ANSS), pp. 301-309, 2007.
[91] NS2 simulator, URL: www.isi.edu/nsnam/ns.
[92] M. Piorkowski, M. Raya, A. Lezama Lugo, P. Papadimitratos, M. Grossglauser,
J.P. Hubaux, TraNS: realistic joint traffic and network simulator for VANETs,
ACM SIGMOBILE Mobile Computing and Communications Review, pp. 31-33,
2008.
[93] C. Sommer, R. German, F. Dressler, Bidirectionally Coupled Network and Road
Traffic Simulation for Improved IVC Analysis , ACM SIGMOBILE IEEE Trans-
actions on Mobile Computing, pp. 3-15, 2011.
[94] R. Ramanathan, VANET architectures and protocol stacks: a sur-
vey, International conference on Communication technologies for vehicles
(Nets4Cars/Nets4Trains), pp. 95-105, Germany, 2011.
[95] N. Wisitpongphan, F. Bai, P. Mudalige, V. K. Sadekar, and O. K. Tonguz, Rout-
ing in Sparse Vehicular Ad Hoc Wireless Networks, IEEE Journal on Selected
Areas in Communications, vol. 25, no. 8, pp. 1538-1556, Oct. 2007.
[96] S.-I. Sou, and O. K. Tonguz, Enhancing VANET connectivity through Roadside
Units on Highways, IEEE Transactions on Vehicular Technology, vol. 60, no. 8,
pp. 3586-3602, Oct. 2011.
[97] X. Wang, Modeling the process of information relay through intervehicle commu-
nication, Transportation Research Part B: Methodological, Vol. 41, Issue 6, pp.
684-700, July 2007. vol. 41, no. 6, pp. 684-700, Jul. 2007.

BIBLIOGRAPHY 128
[98] H.Takagi and L.Kleinrock, Optimal Transmission Ranges for Randomly Dis-
tributed Packet Radio Terminals, IEEE Transaction on communication, vol.
COM-32, no. 3, pp. 246-257, March 1984.
[99] W. Jin and W. W. Recker, Instantaneous information propagation in a traffic
stream through inter-vehicle communication, Transportation Research Part B:
Methodological, vol. 40, no. 3, pp. 230-250, Mar. 2006.
[100] Y.-C. Cheng and T. G. Robertazzi, Critical connectivity phenomena in multihop
radio models, IEEE Transactions on Communications, vol. 37, no. 7, pp. 770-777,
Jul. 1989.
[101] X.Wang, T. M. Adams, W.-L. Jin, and Q. Meng, The process of information
propagation in a traffic stream with a general vehicle headway: a revisit, Trans-
portation Research Part C, pp. 367-375, 2010.
[102] F. Tolba, D. Magoni, W.L Jin, P. Lorenz, Energy saving and connectivity trade-
off by adpative transmission range in 802.11g MANETs, IEEE International Con-
ference on Wireless and Mobile Communications (ICWMC), pp. 45-50, 2006.
[103] T. Ebatt, S. Krihnamurthy, D. Connors, S. Dao, Power Management for
Throughput Enhancement in Wireless Adhoc Networks, IEEE International Con-
ference on Communications (ICC), pp. 1506-1513, 2000.
[104] C. Palazzi, S. Ferretti, M. Roccetti, G. Pau, and M. Gerla, How
Do You Quickly Choreograph Inter-Vehicular Communications? A Fast
Vehicle-to-Vehicle MultiHop Broadcast Algorithm, IEEE CCNC International
Workshop on Networking Issues in Multimedia Entertainment, 2007.
[105] M. Artimy, Local Density Estimation and Dynamic Transmission-Range As-
signment in Vehicular Ad Hoc Networks, IEEE Transactions on Intelligent Trans-
portation Systems, vol. 8, pp. 400-412, Sept. 2007.
[106] M. Torrent-Moreno, P. Santi, H. Hartenstein, Distributed Fair Transmit Power
Adjustment for Vehicular Ad Hoc Networks, IEEE Communications Society on
Sensor and Ad Hoc Communications and Networks, Sept. 2006.
[107] D.B. Rawat, G. Yan, D.C. Popescu, M.C. Weigle, S.Olariu, Dynamic Adapta-
tion of Joint Transmission Power and Contention Window in VANET, IEEE
Vehicular Technology Conference Fall (VTC-Fall), Sept. 2009.

BIBLIOGRAPHY 129
[108] R. Chen, H. Yang, W.L Jin, A. Regan, Dynamic transmission range in inter-
vehicle communication with stop-and-go traffic, IEEE Intelligent Vehicles Sym-
posium (IV), pp. 1166-1171, June. 2010.
[109] Z.Li, Y.Zhao, Y.Cui, D.Xiang, Density Adaptive Routing Protocol for Large-
Scale Ad Hoc Networks, IEEE Wireless Communications and Networking Con-
ference (WCNC), March. 2008.
[110] MATLAB, URL: www.mathworks.fr/products/matlab.
[111] OPENSTREETMAP, URL: http://www.mathworks.com/matlabcentral/
fileexchange/35819-openstreetmap-functions.
[112] N. Wisitpongphan, F. Bai, P. Mudalige, V. K. Sadekar, and O. K. Tonguz,
Routing in Sparse Vehicular Ad Hoc Wireless Networks, IEEE Journal on Se-
lected Areas in Communications, vol. 25, no. 8, pp. 1538-1556, Oct. 2007.
[113] G. Badawy, J. Misic, T.D. Todd, and D. Zhao, Performance modeling of
safety message delivery in vehicular ad hoc networks, IEEE International Con-
ference on Wireless and Mobile Computing, Networking and Communications
(WiMob),Oct. 2010.
[114] Y. Bi, L.X. Cai, X. Shen, and H. Zhao, Performance A Cross Layer Broad-
cast Protocol for Multihop Emergency Message Dissemination in Inter-Vehicle
Communication, IEEE International Conference on Communications (ICC), May
2010
[115] R.Singh, and A.Gupta, Information Dissemination in Vanets using zone based
forwarding, IEEE/IFIP Wireless Days Conference, Oct. 2011.
[116] L. Chou and Y. Yang, Location-Based Directional Broadcast for intervehicle
Communications, IEEE Vehicular Technology conference, Sept. 2010.
[117] V. Cherfaoui, T. Denoeux, and Z. Cherfi, Distributed data fusion: application
to confidence management in vehicular networks, Internation Conference on In-
formation Fusion (FUSION), 2008.
[118] H. Saleet, O. Basir, R. Langar, and R. Boutaba, Region-Based Location-
Service-Management Protocol for VANETs, IEEE Transactions on Vehicular
Technology, vol. 59, no. 2, Feb. 2010.

BIBLIOGRAPHY 130
[119] B. Yu, C. Xu, and M. Guo, Adaptive Forwarding Delay Control for VANET
Data aggregation, IEEE Transactions on Parallel and Distributed Systems, vol.
23, no. 1, pp. 11-18, Jan. 2012
[120] K. Ibrahim, and M. Weigle, CASCADE: Cluster-based Accurate Syntactic Com-
pression of Aggregated Data in VANETs, GLOBECOM Workshops, Nov. 2008.
[121] Y. Dieudonne, B.Ducourthial, and S.M. Senouci, COL: a Data Collection Pro-
tocl for VANET, Intelligent Vehicles Symposium, Jun. 2012.
[122] T. Nadeem, S. Dashtinezhad, C. Liao, and L. Iftode, TrafficView: Traffic Data
Dissemination using Car-to-Car Communication, ACM Mobile Computing and
Communications Review (MC2R), vol. 8, no. 3, pp. 6-19, Jul.2004.
[123] C. Lochert, B. Scheuermann, M. Mauve., Probabilistic Aggregation for Data
Dissemination in VANETs, ACM International Workshop on Vehicular Ad Hoc
Networks, pp. 1-8, Sept. 2007
[124] C. Lochert, B. Scheuermann, M. Mauve., A Probabilistic Method for Cooperative
Hierarchical Aggregation of Data in VANETs, Ad Hoc Networks, vol. 8, no. 5,
pp. 518-530, Jul. 2010.
[125] L. Panait, and S.Luke,, Cooperative Multi-Agent Learning: The State of the
Art, Autonomous Agents and Multi-Agent Systems, vol. 11, no. 3, pp. 387-434,
Nov.2005.
[126] S.J. Russel, and P. Norvig, Artificial Intelligence: A Modern Approach, second
ed. Prentice Hall, 2003.
[127] C.J.C.H, Watkins, and P. Dayan, Q-learning, Mach. Learn, vol. 8, no. 3-4, pp.
279-292, 1992.

Appendix A
Resume de These
A.1 Introduction generale
Depuis la nuit des temps, l’homme cherchait a rendre ses trajets plus surs et plus
agreables. En effet, il a du affronter tout au long de l’histoire les nombreux dangers qui
jalonnaient ses trajets a travers les pays et les continents qu’il explorait. Aujourd’hui,
l’evolution technique et culturelle ne modifie en rien ce besoin incessant a la securite
routiere dans la mesure ou l’homme voyage plus, plus vite et plus loin.
Par consequent, pendant les dernieres decennies, les autorites publiques et l’industrie
automobile ont ete impliquees dans l’amelioration des conditions de securite routiere
par la prevention des accidents et par la reduction du nombre des blesses sur la route.
La plupart des mesures preventives se sont focalisees sur le conducteur, alors que la
reduction des consequences d’un accident s’est concentree sur la securite des vehicules
et sur celle de l’infrastructure. Neanmoins, toutes ces mesures permettent d’offrir
une securite passive et limitee dans la mesure ou elles ont pour objectif primordial de
reduire les consequences lorsque l’accident est imminent et n’est plus evitable. Cette
constatation de l’insuffisance de ces mesures preventives a pousse les industriels vers
de nouvelles perspectives innovantes qui cherchent a eviter l’accident et detecter le
danger a l’avance plutot que minimiser les degats et aller par consequent plus loin
que la perception du conducteur.
D’autre part, ce debut de vingt et unieme siecle est place sous le signe de la
communication. Apres le phenomene Internet, la democratisation des technologies
sans fil revolutionne les moyens de communication avec notamment l’apparition de
reseaux spontanes ou reseaux ad hoc. En effet, les reseaux ad-hoc representent une
131

A.1 Introduction generale 132
composante cle de cette evolution. Ces reseaux auto-organises sont formes spon-
tanement a partir d’un ensemble d’entites mobiles communicantes, sans necessiter
d’infrastructure fixe preexistante telle qu’une station de base ou un point d’acces
par exemple. Les entites mobiles constituent en elles-memes le reseau. Elles peu-
vent etre de formes variees : ordinateurs portables, telephones mobiles, assistants
electroniques, capteurs et presentent par consequent des capacites non homogenes en
termes de communication, de puissance de calcul et de stockage.
L’heterogeneite de ces reseaux, l’absence d’infrastructure et le besoin de plus en
plus croissant d’un systeme de transport intelligent(ITS) ainsi que l’engagement des
industriels ont ouvert de nouvelles perspectives pour les reseaux ad-hoc mobiles avec,
par exemple, l’emergence sans precedente des reseaux vehiculaires.
En effet, Les reseaux vehiculaires (VANET) sont une projection des systemes de
transports intelligents. Les vehicules, qui constituent les nœuds du reseau ad-hoc,
communiquent les uns avec les autres par l’intermediaire de la communication inter-
vehicule (V2V) aussi bien qu’avec les equipements de la route par l’intermediaire de la
communication d’equipement-a-Vehicule (I2V), ceci dans le but fort louable d’eviter
les accidents en prevenant leurs conducteurs de dangers potentiels causes par d’autres
automobilistes ou par des dangers sur la route.
L’avenement des reseaux vehiculaires laisse entrevoir une myriade de possibilites
de partage et d’exploitation des informations echangees entre les vehicules. Parmi
ces domaines, un des plus prioritaires est celui lie a la securite des personnes et
plus particulierement sur les routes. En effet, le premier objectif d’un tel systeme
de transport intelligent vise a diminuer les accidents en augmentant les informations
disponibles au niveau du vehicule. Ce spectre d’application tres etendu recouvre aussi
une gestion efficace du trafic routier en aidant le conducteur a perdre moins de temps
sur les routes et un confort routier qui permet par exemple aux passagers de naviguer
sur Internet, faire de la video a la demande.
Dans cette perspective d’utilisation des possibilites de communications V2V et
V2I offertes par un reseau et dans le but de rendre nos routes plus sures et plus
confortables, de nouveaux defis sont poses en termes de protocoles et d’architectures
de communication qui doivent faire face a des caracteristiques inherentes a ces reseaux
d’automobiles telles que la grande mobilite des nœuds, la connectivite intermittente,
et la fragmentation frequente du reseau.
A.1 Introduction generale 133
Suivant cette meme vision, nous nous interessons dans ce manuscrit de these aux
approches de dissemination des informations d’alerte dans un reseau VANET pour
les applications eSafety. Ces mecanismes visent a informer le conducteur a un stage
precoce d’une situation dangereuse sur la route en lui permettant ainsi de prendre les
precautions necessaires pour contourner ce danger. Notre objectif est d’optimiser les
communications V2V afin de proposer une solution de dissemination (appelee EBDR)
basee sur des transmissions directionnelles (en utilisant des antennes directionnelles)
et un algorithme de guidage permettant de choisir la meilleure route que doit suivre
le paquet selon les preferences du conducteur ou de l’application.
Nous nous sommes aussi interesses a la modelisation mathematique de notre pro-
tocole de dissemination EBDR afin d’evaluer ses performances analytiquement. Ce
modele recursif a permis d’obtenir deux metriques de performances: La probabilite
de succes et le nombre de sauts requis pour atteindre la destination. La comparison
entre les resultats de simulation et les valeurs obtenues analytiquement ont permis de
confirmer la precision de notre approche mathematique.
Nous avons aussi ameliore notre technique EBDR par un mecanisme de controle
de congestion. Ainsi, nous avons utilise l’ajustement de la puissance de transmission
(et donc l’ajustement du rayon de transmission) pour envoyer les messages. En fait,
chaque nœud calcule son rayon de transmission en se basant sur la densite locale
des voitures voisines et la distance qui le separe de la destination finale. Cette tech-
nique a permis d’ameliorer d’avantage les performances de notre approche en terme
de consommation de bande passante tout en conservant son efficacite en terme de
probabilite de succes.
Finalement, nous nous sommes interesses aux mecanismes de collecte de donnees
dans les reseaux vehiculaires vu qu’ils rendent plus efficace les communications inter-
vehiculaires et minimisent l’utilisation de la bande passante. Plusieurs travaux exis-
tent dans la litterature, neanmoins, notre proposition se presente comme l’un des rares
efforts qui utilise la technique d’apprentissage Q-learning pour collecter les donnees
entre les vehicules en mouvement. L’objectif derriere l’utilisation de la technique
d’apprentissage et de rendre l’operation de collecte plus reactive a la mobilite des
nœuds et le changement frequent de la toplogie du reseau.

A.2 Analyses des Contributions de la these 134
Figure A.1: Structure du paquet a transmettre
A.2 Analyses des Contributions de la these
Dans cette partie, nous detaillons les differentes contributions de la these en se basant
sur les objectifs et les resultats obtenus:
A.2.1 Approche de dissemination directionnelle basee sur le
broadcast
Nous presentons dans cette partie notre technique EBDR basee sur la combinaison
de la transmission directionnelle et la diffusion afin d’acheminer le message vers la
destination finale. Le nœud initial, utilisant EBDR, calcule l’itirenaire que doit suivre
le paquet en utilisant un algorithme de guidage routier. Une fois le chemin calcule,
le nœud diffuse le message dans son angle de beamforming limite par l’antenne direc-
tionnelle.
A.2.1.1 Algorithme de guidage routier
Le but de cet algorithme est de trouver un chemin pour le paquet vers la destination.
Pour ce faire, un graphe oriente G = (V,E) est construit, ou l’ensemble des nœuds
V represente des intersections des routes, des rond points, des nœuds particuliers
(RSU, centre de controle, etc). Chaque rue entre deux points de V est representee
par un arc. Le poids de chaque arc peut etre la distance entre les deux extremites
de l’arc. Nous pouvons aussi considerer d’autres parametres plus compliques comme
la densite des nœuds. En effet, un chemin avec un grand nombre de vehicule aura
une probabilite plus grande pour faire arriver le paquet. Nous assumons que chaque
point geographique possede un identifiant unique PID forme par exemple par les
coordonnees geographiques du point considere. La sequence des points par lesquels
le message doit passer est inseree dans l’entete du paquet a envoyer comme le montre
la figure A.1.

A.2 Analyses des Contributions de la these 135
Figure A.2: Diffusion directionnelle dans VANETs
A.2.1.2 Approche de diffusion
Le chemin global vers la destination est compose par un certain nombre de sous-routes
ri, 1 ≤ i ≤ N , ou N est le nombre total de sous-routes. A la fin de chaque sous-route,
il y a un point intermediare Di. Le message doit passer par ses points intermediares
pour arriver a la destination.
En outre, nous assumons que chaque vehicule est equipe par une antenne direction-
nelle. L’angle de beamforming utilise est egal a θ ≤ 90◦. Cet angle de transmission
assure une propagation directionnelle des paquets vers les points intermediares et
permet le non-retour des paquets. A la reception d’un paquet, chaque nœud decide si
le paquet doit etre relaye ou non. A cette fin, chaque vehicule retransmet le message
s’il n’est pas la destination ou s’il a deja vu le message. L’operation de broadcast
prend fin lorsque il n’ya plus de points relais ou le systeme rencontre un echec de
transmission. Cet echec se manifeste par l’absence d’un relais (voir Figure A.2)
A.2.1.3 Resultats
Dans cette section, nous nous interessons aux resultats de simulations effectues avec
le framework de simuation VEINS, dedie pour VANETs, afin d’evaluer les perfor-
mances de notre approche de dissemination. La Figure A.3 presente la variation de
la probabilite de succes en variant la densite des nœuds dans le reseau et fixant la

A.2 Analyses des Contributions de la these 136
Figure A.3: Variation de la probabilite de succes en fonction de la densite des nœuds
distance entre la source et le destination a 2000m. Nous observons clairement que la
probabilite de succes augmente avec l’amelioration de la densite des nœuds. En plus,
notre approche depasse de loin le protocole de broadcast tradionnel.
Figure A.4: Impact de la distance sur la propagation du paquet
Nous examinons dans la figure A.4, l’effet de la variation de la distance de propaga-
tion sur notre technique de broadcast. Pour cela, nous effectuons plusieurs simulations
avec des differents valeur de d en fixant la densite des nœuds a 0, 02. Nous observons
clairement que la probabilite de succes diminue en augmentant d. Nous remarquons
aussi que si la distance d est multipliee par 2, la probabilite obtenue est a peu pres le
carree de celle relative a une distance d. En effet, atteindre un point a une distance
2d, signifie que le message doit etre transmis au point situe a d puis continue son
chemin aussi vers le dernier poitn avec succes.

A.2 Analyses des Contributions de la these 137
A.2.2 Framework Analytique pour l’evaluation de EBDR
La plupart des techniques de dissemination proposees pour VANETs reposent sur
des tests-beds experimentaux ou des simulateurs pour demontrer leurs performances
et negligent l’importance d’un modele analytique capable de confirmer les resultats
obtenus. Pour ces raisons, nous nous concentrons dans cette contribution a la consc-
truction d’un modele analytique capable d’etudier les performances de EBDR theoriquement.
Dans ce qui suit, nous considerons un flux de trafic modelise par une ligne droite.
Ce cas particulier des communications inter-vehiculaire correspond a une transmission
dans une autoroute ou meme dans un milieu urbain ou la largeur de la route peu etre
consideree petite devant le rayon de transmission du vehicule (Figure A.5).
Figure A.5: Regime de propagation lineaire dans VANETs
A.2.2.1 Probabilite de succes
La construction du modele mathematique a permis de fournir deux bornes sup et inf
de la probabilite de succes :
S(lb, ib) =i−1∑
j=0
e−λb(i−j)(eλb − 1)S((l − i)b, (k − i+ j + 1)b) (A.1)
S(lb, ib) =i−1∑
j=0
e−λb(i−j)(eλb − 1)S((l − i)b, (k − i+ j)b) (A.2)

A.2 Analyses des Contributions de la these 138
Figure A.6: Precision du modele de probabilite en variant la densite de vehicules
Ces deux bornes sont construites recursivement et sont calculees en utilisant le
calcul dynamique.
Validation des bornes
Nous evaluons dans ce qui suit notre modele mathematique pour la probabilite
de succes en effectuant plusieurs calculs numeriques et aussi en le comparant aux
resultats de simulations.
Afin d’etudier l’impact de la variation de la densite des nœuds sur la precision du
modele mathematique, nous considerons quatre cas λ = 0, 01; λ = 0, 02; λ = 0, 04;
λ = 0, 05 (Figure A.6). Les bornes sont evaluees par rapports aux resultats de
simulation.
Nous observons clairement que notre modele presente des performances tres sat-
isfaisantes dans tous les cas. En effet, la precision du modele est dans le pire des cas
egale a 70% (λ = 0.01) et puis elle augmente tres rapidement.
A.2.2.2 Nombre de sauts requis
Afin d’avoir une comprehension globale de la connectivite dans VANETs, nous enquetons
dans ce qui suit sur le nombre moyen de sauts requis pour atteindre le destination
(dans le chemin le plus court). En utilisant la meme demarche que la probabilite

A.2 Analyses des Contributions de la these 139
de succes, nous proposons deux bornes sup et inf recursives pour le nombre de hops
requis.
h(d, a) =
{
1, if d ≤ a
1 +∫ ib
0 λe−λ(a−x)h(d−a,r−a+x)S(d−a,r−a+x)
S(d,a), if d > a
(A.3)
Les deux bornes ci dessus dependent des bornes deja calculees pour la prob-
abilite de succes. Ceci confirme notre approche de construire tout un framework
mathematique d’evaluation.
Validation du modele
Figure A.7: Le nombre moyen de sauts: Simulation vs resultats analytiques en variant
λ
Nous pouvons constater depuis la Figure A.7 que notre modele mathematique est
tres precis. Particulierement, les bornes deviennet tres proches quand la densite des
nœuds augmente.
En outre, plusieurs simulations ont ete conduites afin d’etudier le comportement
de ces bornes avec la variation de d. Pour cela, nous avons fait varier les valeurs de d
tout en fixant b = 2 et λ = 0.02. Les resultats sont reportes dans la Figure A.8. Les
deux bornes sont precises quand le rapport drest petit.
Lorsque la distance d augmente, et vu que les bornes sont calculees par la program-
mation dynamique, nous observons une augmentation de l’erreurs due a l’accumulation
des erreurs de calcul.

A.2 Analyses des Contributions de la these 140
Figure A.8: Le nombre moyen de sauts: Simulation vs resultats analytiques en variant
d
A.2.3 Technique d’ajustement de la puissance de transmis-
sion pour EBDR
L’objectif de cette partie de la these est d’ameliorer l’efficacite de EBDR en terme de
consommation de bande passante ainsi que le taux des interferences entre les vehicules.
Ainsi, cette nouvelle technique propose une approche entierement distribuee qui per-
met aux nœuds d’ajuster dynamiquement leurs rayons de transmission en fonction de
la densite locale des nœuds et la distance qui les separe de la destination.
Ainsi, nous supposons que le premier nœud (expediteur du message) diffuse le mes-
sage avec un angle θ et un rayon fixe r1. La distance entre la source et la destination
est notee d1. Nous definissons le cœfficient d’ajustement comme suit:
C =r1d1
(A.4)
Ce parametre C doit etre ajoute dans les messages d’alerte pour permettre aux
autres relais de calculer leurs rayons de transmission ajustes en se basant sur C. En
effet, le rayon d’un nœud nodei est calcule a l’aide de la regle suivante :
ri = C ∗ di (A.5)
Nous constatons que ce rayon de transmission peut devenir tres petit lorsque
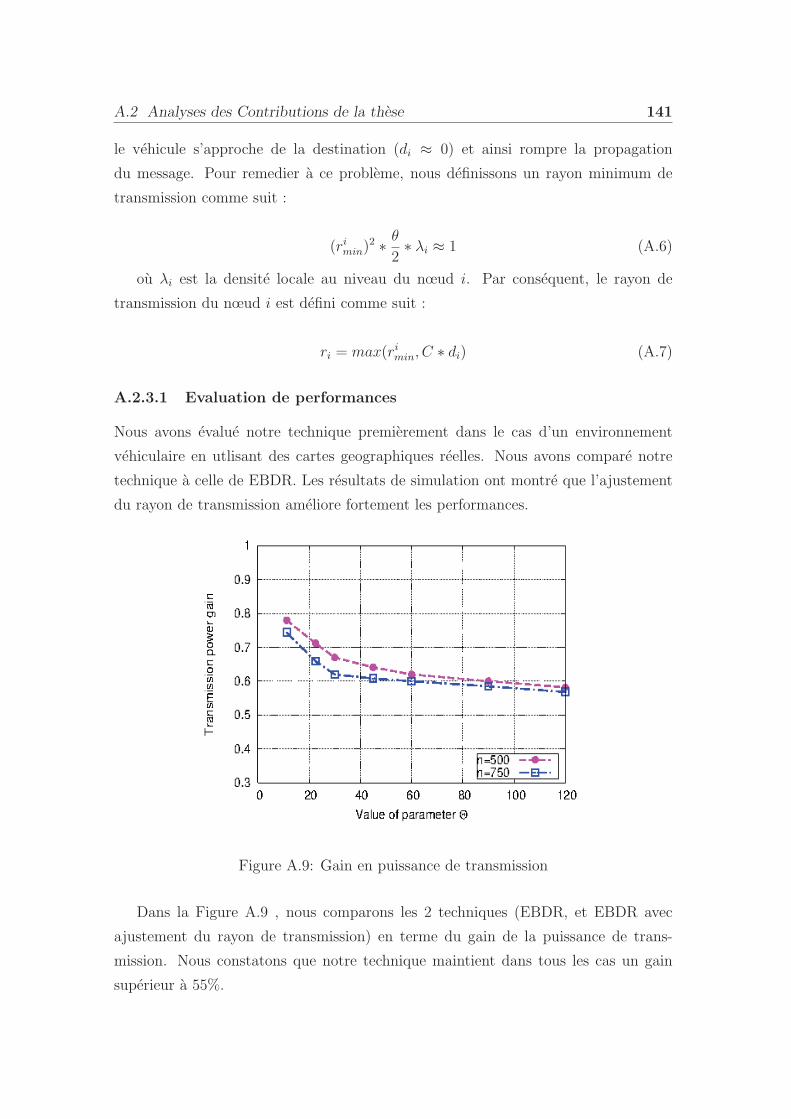
A.2 Analyses des Contributions de la these 141
le vehicule s’approche de la destination (di ≈ 0) et ainsi rompre la propagation
du message. Pour remedier a ce probleme, nous definissons un rayon minimum de
transmission comme suit :
(rimin)2 ∗
θ
2∗ λi ≈ 1 (A.6)
ou λi est la densite locale au niveau du nœud i. Par consequent, le rayon de
transmission du nœud i est defini comme suit :
ri = max(rimin, C ∗ di) (A.7)
A.2.3.1 Evaluation de performances
Nous avons evalue notre technique premierement dans le cas d’un environnement
vehiculaire en utlisant des cartes geographiques reelles. Nous avons compare notre
technique a celle de EBDR. Les resultats de simulation ont montre que l’ajustement
du rayon de transmission ameliore fortement les performances.
Figure A.9: Gain en puissance de transmission
Dans la Figure A.9 , nous comparons les 2 techniques (EBDR, et EBDR avec
ajustement du rayon de transmission) en terme du gain de la puissance de trans-
mission. Nous constatons que notre technique maintient dans tous les cas un gain
superieur a 55%.

A.2 Analyses des Contributions de la these 142
Dans un second temps, nous nous sommes interesses a l’evaluation de notre tech-
nique dans le cas d’une distribution uniforme des nœuds semblable a un reseau
MANET. Les resultats ont demontre l’efficacite de notre approche. En outre, nous
avons developpe un modele mathematique capable de calculer la surface de transmis-
sion du message dans le reseau suivant cette equation:
Stotal =1
2d21 tan(
θ
2)(1− e
( −2π
tan( θ2 ))) (A.8)
Cette equation est obtenue sous l’hypothese suivante: r1d1≪ cos( θ
2). Nous re-
marquons que cette expression de la surface Stotal est independante du rayon de
transmission.
La comparison entre les valeurs theoriques et de simulations ont confirme la va-
lidite de notre approche analytique puisque la difference entre les deux courbes est
minimale (Figure A.10).
Figure A.10: Comparaison entre les valeurs theoriques et de simulation des nœuds
impliques
A.2.4 Technique de collecte de donnees dans VANETs
Dans cette partie, nous nous sommes concentres sur un autre defi inherent lie aux com-
munications vehiculaires: La collecte des donnees. Ainsi, nous proposons une tech-
nique totalement distribuee nommee ADOPEL, basee sur un processus d’apprentissage

A.2 Analyses des Contributions de la these 143
appele Q-learning visant a rendre l’operation de collecte plus reactive a la mobilite
des nœuds et le changement de la toplogie du reseau.
Dans ce but, nous avons defini une fonction de recompense qui prend en compte
le nombre de paquets a collecter au niveau de chaque nœud et son avancement par
rapport a la destination. En outre, une nouvelle expression du parametre γ′ a ete
fournie afin de gerer l’instabilite du voisinage du nœud et de choisir l’itineraire le
plus stable vers le centre de controle ou les donnees brutes seront traitees. La tech-
nique Q-learning offre aux vehicules la possibilite d’optimiser leurs interactions avec
l’environnement grace a leur experience dans le reseau.
Par consequent, chaque fois qu’un nœud a un paquet a envoyer, il calcule la
recompense r, le facteur de stabilite γ′, et met a jour les valeurs de la matrice con-
tenant les valeurs Q, en utilisant l’equation suivante:
Q(s, a) = (1− α) ∗Q(s, a) + α ∗ (r + γ′ ∗maxa′Q(s′, a′)) (A.9)
Le vehicule avec la plus grande valeur de Q est selectionne pour etre le prochain
hop.
Evaluation de performances
Figure A.11: Taux moyen de collecte de donnees: ADOPEL vs les versions non-
learning
Afin d’etudier l’effet de l’apprentissage sur notre technique, nous avons compare
notre approche avec des techniques utilisant un apprentissage partiel. La Figure A.11
revele le taux de collecte en variant la densite des nœuds pour les deux techniques.
Nous observons clairement que notre approche depasse largement les versions non-
learning. En fait, dans tous les cas, ADOPEL realise un gain de plus de 20% par

A.3 Conclusion & Perspectives 144
rapport aux autres techniques. Ceci s’explique par le fait que dans un environnement
tres dynamique comme VANETs, ADOPEL est capable de changer d’une maniere ad-
patative son choix du meilleur relais afin d’augmenter le taux de collecte alors que les
autres techniques rencontrent des enormes difficultes pour s’adapter a la dynamicite
du reseau.
A.3 Conclusion & Perspectives
Dans un premier temps, nous avons examine le probleme de dissemination multihop
dans un reseau VANET et nous avons propose notre solution basee sur des transmis-
sions directionnelles et un algorithme de guidage routier visant a choisir le meilleur
chemin pour le paquet. Les resultats de simulations ont confirme l’efficacite de notre
approche EBDR devant un algorithme de broadcast aveugle.
Ensuite, nous avons essaye d’etudier les performances de notre approche analy-
tiquement. A ce titre, nous avons construit un framework mathematique recursif per-
mettant d’investiguer le comportement de notre protocole. En effet, nos modeles an-
alytiques permettent d’etudier deux parametres importants: la probabilite de succes
et le nombre moyen de sauts requis pour atteindre la destination finale.
En se basant sur les bonnes performances presentees par EBDR dans le premier
chapitre, nous avons propose une amelioration du protocole visant a minimiser la
consommation de la bande passante (diminuer le nombre des nœuds impliques dans
la transmission) sans penaliser la probabilite de succes des transmissions. Pour cela,
nous avons utilise un mecanisme de controle de congestion qui s’interesse au reglage
de la puissance de transmission. Le reglage se base sur la densite locale des nœuds et
la distance qui separe un nœud de la destination. En plus, nous avons applique cette
technique pour une distribution uniforme des nœuds et un modele mathematique a
ete genere pour calculer la zone de transmission.
Nous nous sommes interesses dans la derniere partie au probeme de collecte
de donnees et nous avons propose un algorithme base sur l’apprentissage appele
ADOPEL qui adapte sa politique de collecte selon la stabilite des liens entre les
vehicules et le nombre de paquets a collecter. La comparison avec des techniques qui
n’utlise pas de l’apprentissage a permet de devoiler l’efficacite de notre approche.
Neanmoins, plusieurs directions de recherche s’ouvrent a la fin de cette these :
Tout d’abord, nous envisageons d’ameliorer la technique EBDR par un ajustement

A.3 Conclusion & Perspectives 145
dynamique de l’angle de beamforming θ pour l’adapter a la densite locale des nœuds
et ameliorer ainsi l’utlisation de la bande passante et reduire les interferences.
En outre, nous interessons au relayage de l’information dans le cas planaire. Nous
visons a fournir un framework mathematique complet capable d’etudier les perfor-
mances des protocoles de diffusion multi-sauts dans ce cas de figure. Nous pensons
aussi que notre modele mathematique presente au chapitre 4 represente un bon point
de depart pour concevoir un tel outil mathematique complet.