vehicle noise functional performance indicators … noise functional performance indicators using...
TRANSCRIPT

Inter-noise 2014 Page 1 of 13
Vehicle noise functional performance indicators using tire sound intensity
Paul Donavan1; Carrie Janello2 1,2 Illingworth & Rodkin, Inc., USA
ABSTRACT Tire noise plays an important role in the noise performance of light vehicles for both interior and exterior noise. Tire noise sound intensity can be considered as a functional performance indicator for both types of noise. Databases of vehicle interior noise and exterior pass-by noise combined with the corresponding on-board sound intensity (OBSI) results were assembled to examine the relationships between these types of data. Relationships or objective “filters” were developed for relating OBSI to interior noise quantified in terms of A-weighted sound pressure level, loudness in sones, speech interference level, and percent articulation. Relationships between OBSI and interior structure-borne road noise were also examined. For exterior noise, a filter shape relating controlled pass-by measurements to OBSI data were developed for assessing community noise due to different pavements. This filter can also be used to quantify the increased exterior noise produced by tires under acceleration with applied torque. The principles described can be used in the vehicle noise development process for interior noise and for diagnosing the contribution of tires to regulatory pass-by noise, such as defined in the ISO 365 test procedure. Keywords: Tire Noise, Vehicle Noise I-INCE Classification of Subjects Number(s): 11.7.1, 13.2.1
1. INTRODUCTION In the United States, there has been interest in defining individual, single metrics to relate various
performance parameters of pavements to attributes that are perceived by the public. In the case of tire-pavement noise, the public’s perception of a pavement is influenced by both exterior noise propagated into the community and by the occupants inside vehicles operating on the pavement. For vehicle manufacturers, similar interests exist, except the concern is more the effect different tire designs have on regulatory exterior pass-by noise and minimizing interior tire noise for their customers. Some initial successes in relating on-board sound intensity (OBSI) measurements to both controlled pass-by levels and interior noise have been reported for a limited number of concrete research test sections (1). Similarly, initial success has been reported for relating OBSI measurements for different tire designs to regulatory pass-by test procedures on the ISO 10844 surface (2,3).
The purpose of the study reported in this paper was to expand on the relationships developed in previous work between OBSI and interior and exterior noise and to assess how well either of these can be estimated based on OBSI data alone. Within the context of pavements, these relationships are referred to as “functional performance indicators”. To develop such relationships, more extensive databases of OBSI to interior noise and OBSI to exterior noise measurements were assembled from measurements made on roadways in California and Arizona. The results and relationships developed can be applied to tire noise either with respect to pavement performance or tire performance.
2. TIRE-PAVEMENT NOISE DATABASES Two databases where assembled, one of interior noise and corresponding OBSI levels, and one of
exterior controlled pass-by levels with corresponding OBSI data. For both databases, the OBSI

Page 2 of 13 Inter-noise 2014
Page 2 of 13 Inter-noise 2014
measurements were conducted following the methods standardized by the American Association of State Highway and Transportation Officials as AASHTO procedure TP 76, Standard Method of Test for Measurement of Tire/Pavement Noise Using the On-Board Sound Intensity (OBSI) Method (4). Under this procedure, sound intensity probes are mounted on the same test vehicle used for the interior noise and exterior pass-by measurements. As shown in Figure 1, the sound intensity measurements
Figure 1 – OBSI test fixture mounted on test vehicle with a Goodyear Aquatred 3 test tire
are made with probes mounted very close to the tire, 100mm from the tire sidewall and 75mm above the pavement, and opposite the leading and trailing edges of the tire contact patch. The microphone pairs are protected by microphone windscreens, which along with the signal processing done in the measurement of sound intensity, eliminate any issues with wind-induced noise on the probes. The OBSI measurements were conducted immediately prior to or just after the interior or exterior measurements. Following the TP 76 procedure, all of the measurements were conducted at a test speed of 97 km/h. The data was acquired as a linear average over a 5 second periods and the results 3 of runs over the same section of pavement were averaged together. In variance with TP 76, the tire used throughout these measurements was a P205/70R15 Goodyear Aquatred 3.
Interior noise levels were measured in the right rear passenger seat of the Subaru Legacy Outback test vehicle. This seating position was selected to minimize wind and engine noise relative to airborne tire noise and to be more distant from the vehicle and instrumentation operators. The interior level was measured with a single 12.7mm diameter pressure condenser microphone suspended vertically so that the diaphragm of the microphone was 61cm above the seat cushion, centered on what would be a typical occupant’s head position. Consistent with OBSI data, the interior measurements were obtained at a speed of 97 km/h over a 5-second interval. These data were all obtained using four Goodyear Aquatred 3 tires mounted on the test vehicle. The database consists of 26 pairs of interior noise and OBSI results, as measured on 26 different pavements. The pavements included open graded, dense graded, and rubberized asphalt and a variety for portland cement concrete pavements with textures including ground, longitudinally tined, uniform and random transversely tined, and burlap drag. The resultant interior and OBSI ⅓ octave spectra are shown in Figure 2.
Controlled vehicle pass-by tests were performed using the same Subaru test vehicle with the four Goodyear Aquatred 3 test tires. These were also conducted at an operating speed of 97 km/h as well as other speeds ranging from 72 to 113 km/h. The 12.7mm diameter microphone was located 7.5m from the centerline of the path of vehicle travel at a height of 1.5m above the pavement surface. Maximum overall A-weighted sound pressure levels were captured with the corresponding ⅓ octave band levels using a real-time analyzer set to one-eighth second (“fast”) exponential averaging. For each test site, four or more individual pass-by events were acquired and the maximum levels averaged together to obtain the average pass-by level. The complete data set consists of 71 pairs of OBSI and pass-by levels spanning the same range in types of pavement as the interior noise data base. Twenty of the

Inter-noise 2014 Page 3 of 13
Inter-noise 2014 Page 3 of 13
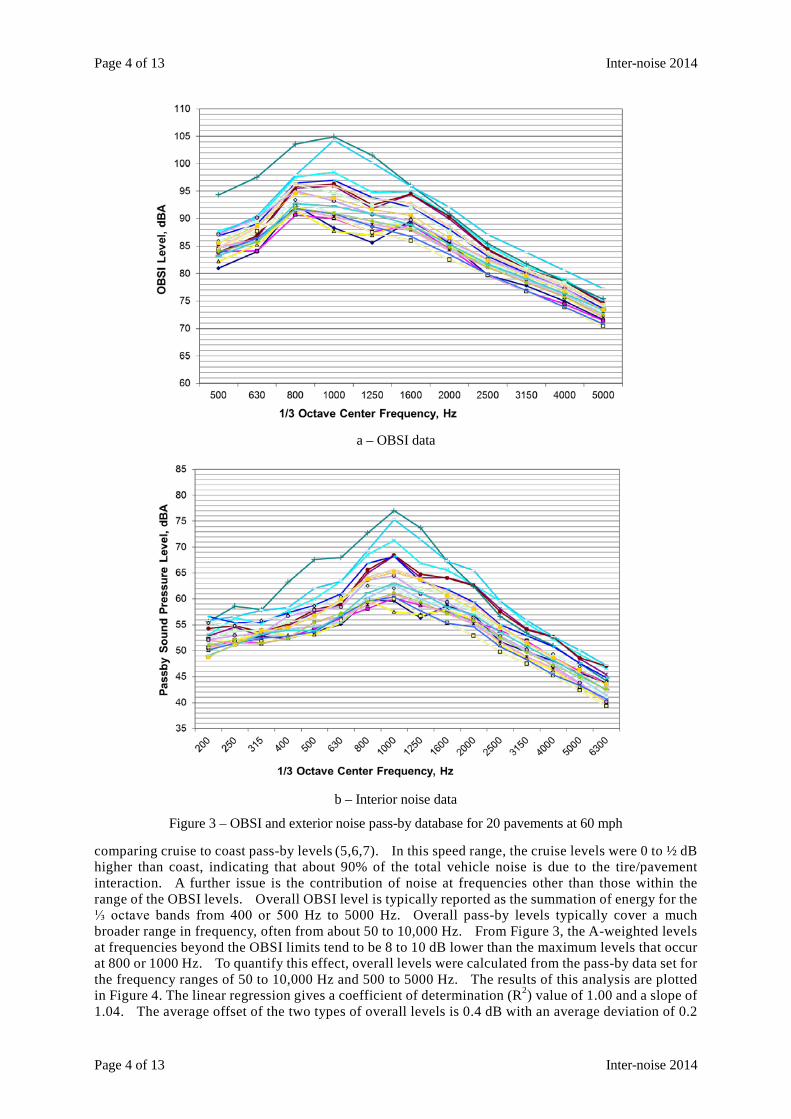
pass-by events were conducted at 97 km/h, and OBSI and exterior spectra for these are shown in Figure 3.
a – OBSI data
b – Interior noise data
Figure 2 – OBSI and interior noise database for 26 pavements at 60 mph
3. OBSI AND PASS-BY NOISE The relationship OBSI levels and pass-by noise depends on the degree to which tire/pavement noise
dominates the overall vehicle noise emission. For the test vehicles included in the pass-by/OBSI data base, tire noise was verified as the dominate source for test speeds of 72.4 km/h or greater by
Page 4 of 13 Inter-noise 2014
Page 4 of 13 Inter-noise 2014
a – OBSI data
b – Interior noise data
Figure 3 – OBSI and exterior noise pass-by database for 20 pavements at 60 mph
comparing cruise to coast pass-by levels (5,6,7). In this speed range, the cruise levels were 0 to ½ dB higher than coast, indicating that about 90% of the total vehicle noise is due to the tire/pavement interaction. A further issue is the contribution of noise at frequencies other than those within the range of the OBSI levels. Overall OBSI level is typically reported as the summation of energy for the ⅓ octave bands from 400 or 500 Hz to 5000 Hz. Overall pass-by levels typically cover a much broader range in frequency, often from about 50 to 10,000 Hz. From Figure 3, the A-weighted levels at frequencies beyond the OBSI limits tend to be 8 to 10 dB lower than the maximum levels that occur at 800 or 1000 Hz. To quantify this effect, overall levels were calculated from the pass-by data set for the frequency ranges of 50 to 10,000 Hz and 500 to 5000 Hz. The results of this analysis are plotted in Figure 4. The linear regression gives a coefficient of determination (R2) value of 1.00 and a slope of 1.04. The average offset of the two types of overall levels is 0.4 dB with an average deviation of 0.2

Inter-noise 2014 Page 5 of 13
Inter-noise 2014 Page 5 of 13
Figure 4 – Comparison of overall pass-by level to pass-by levels band passed from 500 to 5,000 Hz
dB. This result indicates that data from the smaller frequency range corresponding to the OBSI measurement can represent the wider range of overall levels quite well with a small constant offset of less than ½ dB.
The 71 data points of the pass-by/OBSI data set are cross-plotted in Figure 5 to establish their relationship on an overall level basis. The OBSI overall levels include the frequency range from 500
Figure 5 – Comparison of overall pass-by level to OBSI levels band
to 5000 Hz, while the pass-by overall levels are from 50 to 10,000 Hz. A linear regression produces a slope of 1.02 with an R2 value of 0.94. The average offset of the data is 23.7 dB with average deviation of 0.8 dB and a standard deviation of 1.0 dB. Figure 5 indicates that overall pass-by levels for a controlled vehicle can be estimated from OBSI data within about 1 dB with good confidence. Consequently, a filter developed from these data should be able to provide an accurate estimate of pass-by levels.
To develop a filter shape for the pass-by noise, the ⅓ octave band controlled pass-by levels from the

Page 6 of 13 Inter-noise 2014
Page 6 of 13 Inter-noise 2014
Figure 2 were subtracted from the corresponding OBSI levels resulting in the data presented in Figure 6. These were then averaged and the standard deviation determined for each ⅓ octave band from the
Figure 6 - ⅓ octave band differences between pass-by levels subtracted from OBSI Levels for 74 pass-by events
20 data sets and the results are shown in Figure 7. It is seen that the average differences between the OBSI and pass-by levels are not strongly dependent on frequency as the variation in averages of the
Figure 7 – OBSI to pass-by filter
bands between the 500 and 3,150 Hz is only 2 dB. This filter can be used to estimate the pass-by levels from different pavements when it is applied to OBSI data from that pavement. The relationships developed here have also been found to apply to estimating the pass-by level for different tires operating on the same pavements2.
As an example of an application of OBSI/pass-by filter, it has been applied to OBSI and pass-by
Inter-noise 2014 Page 7 of 13
Inter-noise 2014 Page 7 of 13
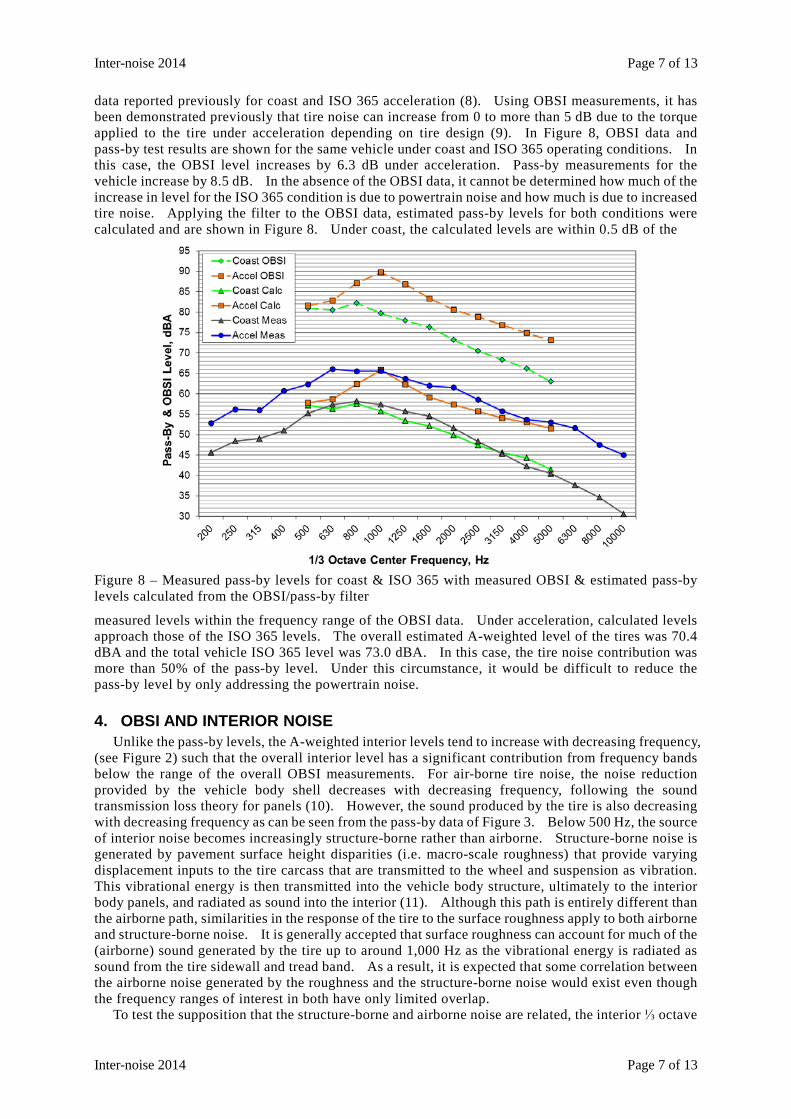
data reported previously for coast and ISO 365 acceleration (8). Using OBSI measurements, it has been demonstrated previously that tire noise can increase from 0 to more than 5 dB due to the torque applied to the tire under acceleration depending on tire design (9). In Figure 8, OBSI data and pass-by test results are shown for the same vehicle under coast and ISO 365 operating conditions. In this case, the OBSI level increases by 6.3 dB under acceleration. Pass-by measurements for the vehicle increase by 8.5 dB. In the absence of the OBSI data, it cannot be determined how much of the increase in level for the ISO 365 condition is due to powertrain noise and how much is due to increased tire noise. Applying the filter to the OBSI data, estimated pass-by levels for both conditions were calculated and are shown in Figure 8. Under coast, the calculated levels are within 0.5 dB of the
Figure 8 – Measured pass-by levels for coast & ISO 365 with measured OBSI & estimated pass-by levels calculated from the OBSI/pass-by filter
measured levels within the frequency range of the OBSI data. Under acceleration, calculated levels approach those of the ISO 365 levels. The overall estimated A-weighted level of the tires was 70.4 dBA and the total vehicle ISO 365 level was 73.0 dBA. In this case, the tire noise contribution was more than 50% of the pass-by level. Under this circumstance, it would be difficult to reduce the pass-by level by only addressing the powertrain noise.
4. OBSI AND INTERIOR NOISE Unlike the pass-by levels, the A-weighted interior levels tend to increase with decreasing frequency,
(see Figure 2) such that the overall interior level has a significant contribution from frequency bands below the range of the overall OBSI measurements. For air-borne tire noise, the noise reduction provided by the vehicle body shell decreases with decreasing frequency, following the sound transmission loss theory for panels (10). However, the sound produced by the tire is also decreasing with decreasing frequency as can be seen from the pass-by data of Figure 3. Below 500 Hz, the source of interior noise becomes increasingly structure-borne rather than airborne. Structure-borne noise is generated by pavement surface height disparities (i.e. macro-scale roughness) that provide varying displacement inputs to the tire carcass that are transmitted to the wheel and suspension as vibration. This vibrational energy is then transmitted into the vehicle body structure, ultimately to the interior body panels, and radiated as sound into the interior (11). Although this path is entirely different than the airborne path, similarities in the response of the tire to the surface roughness apply to both airborne and structure-borne noise. It is generally accepted that surface roughness can account for much of the (airborne) sound generated by the tire up to around 1,000 Hz as the vibrational energy is radiated as sound from the tire sidewall and tread band. As a result, it is expected that some correlation between the airborne noise generated by the roughness and the structure-borne noise would exist even though the frequency ranges of interest in both have only limited overlap.
To test the supposition that the structure-borne and airborne noise are related, the interior ⅓ octave

Page 8 of 13 Inter-noise 2014
Page 8 of 13 Inter-noise 2014
band levels of the interior/OBSI data set were summed over 500 to 5,000 Hz to produce an overall level that could be compared to the overall level for the entire 31.5 to 10,000 Hz range. These are cross-plotted in Figure 9 with the linear regression line producing a slope of 0.92 and R2 value of 0.89.
Figure 9 – Overall interior noise levels versus interior noise from 500 to 5,000 Hz
The average offset between these data is 8.2 dB with a standard deviation of 0.9 dB. Although these data indicate a good correlation between the air-borne and overall interior noise levels, several outliers should be noted. The high frequency data point at 67.0 dBA corresponds to a uniform transverse tine PCC that produces a somewhat lower overall level compared to the trend line. In this case, the regularly spaced tines produce a tonal peak at about 1,000 Hz and does not generate as much lower frequency noise as other rougher surfaces, such as random transverse tine and chip seals. On the low end of the scale, the data points in the 57 to 58 dB range, correspond to quieter pavements for which the lower frequency noise contribution is somewhat reduced due to the lack of surface roughness.
Following from the relationship of higher frequency interior noise to overall sound pressure levels from Figure 9, ranges of overall interior noise levels are plotted against OBSI levels in Figure 10. This plot includes the overall and high frequency overall levels from Figure 9 as well as the summation of interior levels from the range of 31.5 to 400 Hz. The linear regression lines through these data points are remarkably similar with slopes of 0.82 to 0.85 and R2 values from 0.84 to 0.85. As might be expected, the slopes of these regressions are less than 1, which may be attributed to other sources of interior noise (engine and wind noise) contributing more as the tire noise contribution decreases. These data indicate that the correlations between OBSI and high frequency, predominately airborne interior noise and between OBSI and lower frequency, predominately structure-borne noise are virtually identical for this test vehicle. This is particularly remarkable as the band passed lower frequency interior levels include none of the frequency range of the overall OBSI levels.
The results of Figure 10 suggest that overall A-weighted interior noise may be reliably estimated for a given vehicle from OBSI data alone. Using the spectra of Figure 2, the relationship between OBSI and other interior noise metrics can also be determined. To consider the use of loudness, the sone value for each of the interior noise spectra in the data set was calculated using the American National Standard “Procedure for the Computation of Loudness of Steady Sound” (12). The resulting values are plotted in Figure 11 versus the corresponding overall OBSI levels. In comparison to Figure 10, a similar degree of correlation is seen for the loudness metric as was seen for the overall A-weighted sound level. However, the slopes are quite different, 0.82 for dBA versus 1.49 for sones. This occurs because the range in sones is from about 20 to 37, corresponding to a range in OBSI level from about

Inter-noise 2014 Page 9 of 13
Inter-noise 2014 Page 9 of 13
Figure 10 – OBSI levels versus overall interior noise, interior from 500 to 5,000 Hz, and from 31.5 to 400Hz
Figure 11 – Interior noise loudness in sones versus overall OBSI level
66 to 78 dBA. The range in sones is slightly compressed compared to dBA. The increase in loudness in sones is not quite a doubling of loudness which is generally taken to be a 10 dB increase. The A-weighted level increase is slightly greater at 12 dB.
Another metric to consider is Speech Interference Level (SIL). SIL is commonly used to gauge speech communication as a function of distance between the speaker and listener and vocal effort. SIL is simply the arithmetic average of the octave band levels for the frequencies from 500 to 4000 Hz. The SIL has been calculated for the 26 interior noise spectra of Figure 2 and is presented in Figure 12 versus overall OBSI. The R2 value for these data indicates that correlation between SIL and OBSI is as good as it is for the interior A-weighted, and reasonably confident estimations of interior SIL appear

Page 10 of 13 Inter-noise 2014
Page 10 of 13 Inter-noise 2014
Figure 12 – Interior speech interference level versus overall OBSI level
to be possible from the OBSI data alone. However, it should be noted that the SIL is determined by an arithmetic average of the band levels in different frequencies, unlike the overall A-weighted level. As a result, a 1 dB reduction in tire/pavement noise in the 4,000 Hz octave band provides as much improvement in SIL as does a 1 dB reduction in the 1,000 Hz band. On the contrary, a 1 dB reduction in the 4,000 Hz band provides virtually no reduction in the overall A-weighted interior noise level.
A final metric to consider is articulation index (AI). To apply AI to a vehicle interior, some assumptions have to be made regarding the both the distance between conversationalists and a level of voice effort that people expect to use for communication in the vehicle. For this analysis, a speaker/listener separation of 1m was used, and voice efforts of normal, raised, and loud were left as parameters. AI was then calculated following the American National Standard, “Methods for Calculation of the Speech Intelligibility Index” (13) for the spectra in the OBSI/interior noise data set. The results of these calculations are presented in Figure 13, in terms of percent articulation (AI times 100) where higher values of AI are better (i.e. speech is more intelligible). For a loud voice, the R2 is slightly lower than the other interior noise metrics of Figures 10 through 12 by 0.05 to 0.06. For lower voice efforts, the R2 are even lower. For the loud voice, there is a considerable range in AI between the quietest and loudest pavements. For the quietest pavement, the percent articulation is a little greater than 60% which is generally considered to be acceptable (14). For the loudest pavement, it is less than about 30%, which is considered as unsatisfactory.
Similar to the pass-by noise filter, the interior noise filter was developed by the subtraction of the interior noise levels of Figure 2 from the corresponding OBSI ⅓ octave band levels as shown in Figure 14. The resultant average differences and standard deviations are presented in Figure 15. Above 1,000 Hz, the average difference between the OBSI and interior levels increases fairly uniformly with frequency at about 2½dB/octave. Below 800 Hz, the difference increases more rapidly with a rate of about 16 dB/octave. This range is where the airborne contribution is declining compared to the structure-borne contribution and where the tire is producing less radiated sound. Unlike the pass-by filter shape, the shape of Figure 15 must be considered to be specific to the particular test vehicle used. The magnitude of the airborne portion of this curve (800 Hz and above) depends on the acoustic content of the vehicle, as defined by parameters such as glass thickness, door sealing, door liners, carpet system, headliner acoustic performance, etc., which vary with vehicle design. Frequencies above 800 Hz may also have different levels of contribution of interior engine and wind noise specific to a given vehicle design. For frequencies below 800 Hz, variation from one vehicle design to another can be expected based on suspension design, structural isolation, wheel design, etc. It is also

Inter-noise 2014 Page 11 of 13
Inter-noise 2014 Page 11 of 13
Figure 13 – Percent interior articulation versus overall OBSI level for normal, raised, and loud voice efforts
Figure 14 – ⅓ Octave band interior noise levels subtracted from OBSI levels for 26 pavements
common to find different noise reductions relationships (filters) depending on the measurement location in the vehicle. The data in Figure 15 is for the right rear seat passenger. Higher interior noise levels due to engine and wind noise typically occur in the front seat positions tending to make the apparent tire noise reduction curve less in amplitude.
Although the filter shape of Figure 15 is specific to the test vehicle and seating position, in comparison to other, unpublished vehicle manufacturer data, it does capture the typical behavior of tire noise reduction, as measured inside a light vehicle. For highway agencies, this filter could be applied to OBSI data for different pavements to gain some insight on how a particular pavement may be perceived inside a typical vehicle. This filter could be used also to rank order air-borne tire noise for

Page 12 of 13 Inter-noise 2014
Page 12 of 13 Inter-noise 2014
Figure 15 – OBSI to interior noise filter
different tires for a typical vehicle. In the vehicle development, a filter would need to be determined for a specific vehicle design based on either a target filter from competitive and/or previous vehicles or on data from a prototype vehicle. Once the filter shape was established, it could be applied to the OBSI data from different tire submissions to assess tire noise performance and aid in the tire selection process. The OBSI testing could be done on essentially any vehicle or a tire noise test trailer. This would eliminate the need for full vehicle testing on scarce, representative hardware and allow tire suppliers to develop the tire for noise separate from the vehicle.
5. SUMMARY Databases of OBSI versus pass-by levels and OBSI versus interior noise levels were collected and
analyzed for relationships to OBSI. It was found that cruise pass-by levels could be estimated to within 0.8 dB, on average, based on OBSI results. This relationship can be used either to predict pass-by noise due to different pavements or due to different tires. For interior noise, overall levels can be estimated to within 1 dB on average from the OBSI data. For the specific test vehicle used, the lower frequency levels, below 500 Hz, could be estimated equally as well as the overall and lower frequency levels. It was also found that other interior metrics, loudness in sones, SIL, and AI had similar relationships to OBSI.
The databases were also used to construct filters that can be used to estimate the spectra of pass-by and interior noise from OBSI data within the range of the OBSI measurement. For pass-by noise, this filter is not a function of the vehicle. It can be used to estimate differences in pass-by noise due to either differences in tires or pavements. It can also be used to determine the contribution of tire noise to overall pass-by noise for vehicles under acceleration such as in the ISO 365 test procedure. For interior noise, the filter developed is specific to the test vehicle used. For assessing pavements, the filter could be considered as typical and applied to rank order pavements for interior noise. For assessing tires, the filter could be used generically, or the filter concept could be applied to other specific vehicles. For vehicle tire noise development , once a filter is established, it could be used to screen and select tires without the need for full vehicle testing.
REFERENCES 1. Donavan P Noise Evaluation of Various Pavement Texture on New Portland Cement Concrete.
Noise Control Engineering Journal, 57 (2), March-April 2009, pp 62-76. 2. Donavan PR An Assessment of the Tire Noise Generation and Sound Propagation Characteristics

Inter-noise 2014 Page 13 of 13
Inter-noise 2014 Page 13 of 13
of an ISO 10844 Road Surface. SAE Paper 97NV126, Society of Automotive Engineers Noise and Vibration Conference Proceedings, Traverse City, MI, May 1997
3. Bolton JS, Hall HR, Schumacher RF, and Stott JR Correlation of Tire Intensity Levels and Passby Sound Pressure Levels. SAE Paper 951355, Society of Automotive Engineers Noise and Vibration Conference Proceedings, Traverse City, MI, May 1995.
4. Standard Practice for Measurement of Tire/Pavement Noise Using the On-Board Sound Intensity (OBSI) Method. TP 76-12, American Association of State Highway and Transportation Officials, Washington, D.C. 20001, May 2012.
5. Donavan P, Rymer B Assessment of Highway Pavements for Tire/Road Noise Generation. SAE Paper 2003-01-1536, Society of Automotive Engineers Noise and Vibration Conference Proceedings, Traverse City, MI, May 2003.
6. Donavan P Six Year Evaluation of the Noise Performance of the Caltrans Asphalt Research Pavements on LA 138. prepared for the California Department of Transportation, Division of Environmental Analysis, Sacramento, CA, by Illingworth and Rodkin, Inc., Petaluma, CA, April 2009.
7. Donavan P Lodico D Measuring Tire-Pavement Noise at the Source. NCHRP Report 630, Transportation Research Board, Washington, D.C., 2009.
8. Donavan PR Examination of Tire/Road Noise at Frequencies above 630 Hertz. Proc NTER-NOISE 2002, Dearborn, MI, USA, August 2002.
9. Donavan PR Tire-Pavement Interaction Noise Measurement under Vehicle Operating Conditions of Cruise and Acceleration. SAE Paper 931276, Society of Automotive Engineers Noise and Vibration Conference Proceedings, Traverse City, MI, May 1993.
10. Beranek L Noise and Vibration Control, McGraw-Hill, Inc., New York, NY, 1971, pp. 285-287. 11. Donavan P Noise Control, Sound, and the Vehicle Design Process. Proc NOISE-CON 2005 17-19
October 2005; Minneapolis, Minnesota, 2005. 12. American National Standard Procedure for the Computation of Loudness of Steady Sounds. ANSI
S3.4-2007, Standards Secretariat, Acoustical Society of America, Melville, NY, May 2007. 13. American National Standard Methods for Calculation of the Speech Intelligibility Index. ANSI
S3.5-1997, Standards Secretariat, Acoustical Society of America, Melville, NY, May 2007. 14. Crocker M Handbook of Noise and Vibration Control. John Wiley & Sons, Inc., Hoboken, NJ,
2007, p 399.