vehicle-based technologies for winter maintenance: the
TRANSCRIPT
Project No. 20-7(200)
Vehicle-Based Technologies for Winter Maintenance: The State of the Practice
FINAL REPORT
Prepared for National Cooperative Highway Research Program
Transportation Research Board Of the National Academies
Xianming Shi, Ph.D.
Christopher Strong, P.E. Robb E. Larson, P.E.
David W. Kack, M.B.A. Eli V. Cuelho, P.E.
Nabil El Ferradi Aswinkumar Seshadri
Katie O’Keefe Laura E. Fay, M.Sc.
Western Transportation Institute
College of Engineering Montana State University, Bozeman
September 2006
ACKNOWLEDGEMENT OF SPONSORSHIP
This work was sponsored by the American Association of State Highway and
Transportation Officials, in corporation with the Federal Highway Administration, and was conducted through the National Cooperative Highway Research Program, which is administered by the Transportation Research Board of the National Academies.
DISCLAIMER
This copy is an uncorrected draft as submitted by the research agency. The opinions and conclusions expressed or implied in the report are those of the research agency. They are not necessarily those of the Transportation Research Board, the National Academies, the Federal Highway Administration, the American Association of State Highway and Transportation Officials, or the individual states participating in the National Cooperative Highway Research Program.
ACKNOWLEDGEMENTS The authors would like to thank the NCHRP Senior Program Officer Amir Hanna for his
leadership in this project. We also extend our sincere appreciation to the professionals who responded to our questionnaires and the reviewers who provided feedback on our draft final report.

Page iii
TABLE OF CONTENTS List of Tables ................................................................................................................................. iv List of Figures ................................................................................................................................ iv Executive Summary .........................................................................................................................1 Chapter One: Introduction ...............................................................................................................2 Chapter Two: Methodology and Reporting Agency Statistics ........................................................5 Chapter Three: Automatic Vehicle location ....................................................................................7 Chapter Four: Surface Temperature Measurement Devices..........................................................26 Chapter Five: On-Board Freezing Point and Ice-Presence Detection Sensors ..............................34 Chapter Six: Salinity Measurement Sensors.................................................................................40 Chapter Seven: Millimeter Wave Radar Sensors...........................................................................46 Chapter Eight: Visual and Multi-Spectral Sensors ........................................................................54 Chapter Nine: Fixed Automated Spray Technology.....................................................................67 Chapter Ten: Other Vehicle-Based Technologies for Winter Maintenance.................................79 Chapter Eleven: Conclusions.........................................................................................................88 References......................................................................................................................................95 Appendix A: Survey Instruments................................................................................................104 Appendix B: Responding Agencies ............................................................................................122

Page iv
LIST OF TABLES Table 1: Typical Applications of Sensor Technologies for Winter Maintenance .......................... 4
LIST OF FIGURES Figure 1: Survey of Advanced Winter Maintenance Technologies – Participants..........................6 Figure 2: Schematic of Automatic Vehicle Location System..........................................................7 Figure 3: GPS Geostationary Satellites (Graphic Courtesy of the Canadian Coast Guard) ............8 Figure 4: Differential GPS Positioning............................................................................................9 Figure 5: Nationwide DGPS Coverage (Graphic Courtesy of the U.S. Coast Guard) ..................10 Figure 6: Touch-Screen Interface (Photo Courtesy of IWAPI, Inc.).............................................11 Figure 7: Keypad Interface (Photo Courtesy of Orbital TMS) ......................................................12 Figure 8: (A) Control Products IR Sensor, (B) Air Temperature Sensors, and (C)
RoadwatchTM IR Sensor (from Tabler, 2004) .............................................................28 Figure 9: RoadwatchTM Installed in the Iowa Prototype Vehicle (from Smith et al., 1998) .........28 Figure 10: Apogee IRTS-P Sensor Installed on the Test Vehicle (from Campbell
Scientific, Inc., 2004)...................................................................................................29 Figure 11: Acclimation Time for Sprague and Control Products Sensors on Concrete and
Asphalt at Various Temperatures (from Scott et al., 2005) .........................................30 Figure 12: Effect of Varying Ambient Temperature on Sprague and Control Products
Sensors (from Scott et al., 2005)..................................................................................31 Figure 13: Decision Matrix for Snow and Ice Control (from McCall et al., 2001) .......................33 Figure 14: Sensor Mounted on CRREL Instrumented Research Vehicle (from Joshi,
2002) ............................................................................................................................35 Figure 15: Frensor Device Mounted on the Highway Maintenance Concept Vehicle (from
Andrle, 2002) ...............................................................................................................37 Figure 16: Block Diagram of Salinity Measurement Sensor (Modified from Iwata et al.,
2004) ............................................................................................................................40 Figure 17: Photograph of Collection Box (from Garrick et al., 2002) ..........................................42 Figure 18: Photograph of Rear-View Collection Box with Conductivity Probe (from
Garrick et al., 2002) .....................................................................................................42 Figure 19: Block Diagram of Chemical Spraying Control System (from Iwata et al.,
2004) ............................................................................................................................43 Figure 20: RoadView Technologies (Photo courtesy of Ravani et al., 2002) ...............................47 Figure 21: RoadView Human Machine Interface Display (Photo courtesy of Ravani et al.,
2002) ............................................................................................................................48 Figure 22: Phase II Prototype Highway Maintenance Concept Vehicle using Backup
Sensors (from Andrle, 2002)........................................................................................57 Figure 23: Roadware Group Inc. “ARAN” Vehicle Capabilities (from Roadware, Inc.,
2006) ............................................................................................................................61 Figure 24: Judgment of Road Surface Condition (from Kawana et al., 2005) ..............................63 Figure 25: Winter Road Surface Management using Visible Image Road Surface Sensors
(from Kawana et al., 2005) ..........................................................................................63 Figure 26: A Typical Picture of a Road Surface Taken by the LRSS (from Paulsen and
Schmokel, 2004) ..........................................................................................................64
Page v
Figure 27: A FAST System in Action (Graphic Courtesy of the Ontario Ministry of Transportation).............................................................................................................68
Figure 28. A Comparison between Locations Treated with FAST and with Mobile Operations (Graphic Courtesy of the New York City Department of Transportation).............................................................................................................76
Figure 29: Hindsight Ultrasonic Sensor System (Graphic Courtesy of the National Institute for Occupational Safety and Health) .............................................................79
Figure 30: Hindsight Detection Zone (Graphic Courtesy of the National Institute for Occupational Safety and Health) .................................................................................80
Figure 31: Snowplow Used in Mn/DOT Study (from Lim et al., 2000) .......................................82 Figure 32: Driver's View through the HUD (from Lim et al., 2000).............................................83 Figure 33: Advanced Rotary Plow (from Tan, 2003) ....................................................................84 Figure 34: Blower Head Position Indicator (from Tan, 2003).......................................................85
Page 1
EXECUTIVE SUMMARY Maintenance agencies in charge of snow and ice control operations are continually challenged to provide a high level-of-service and improve safety and mobility while working with increased traffic volumes, higher expectations from the public, and the unprecedented budget and staffing constraints. The ultimate goal of winter maintenance operations is to deliver the right type and amount of materials in the right place at the right time. To address these challenges, a variety of vehicle-based sensor technologies have been implemented by winter maintenance agencies to optimize material usage, reduce associated annual spending, and ensure the safety of the personnel responsible for maintaining winter roadways. This synthesis focuses on the state of the practice of these advanced winter maintenance technologies that have seen increased implementation throughout North America since the completion of the International Winter Maintenance Technology Scanning Reviews in 1994 and 1998. These advanced technologies are envisioned to revolutionize winter operations across North America.
In order to reduce the direct costs (nearly $2.3 billion annually in the United States) and indirect costs of highway winter maintenance nationwide while increasing its benefits, it is important that individual maintenance agencies improve their snow and ice control strategies and tactics. Cutting-edge technologies can make the task of maintaining winter more efficient, safer and less costly. Numerous vehicle-based technologies, including automatic vehicle location (AVL), surface temperature measuring devices, freezing point and ice-presence detection sensors, salinity measuring devices, visual and multi-spectral sensors, and millimeter wavelength radar sensors, have been developed in recent years to improve winter maintenance efficiency and safety.
Conducted through the NCHRP Project 20-7/Task 200, this report synthesizes information obtained from a comprehensive literature review and agency surveys on the state of development of these advanced technologies. Of these technologies, AVL systems, road surface temperature measuring devices and fixed automated spray technology (FAST) systems are the only ones that have matured and become fully operational, while the remainders are still in the development and testing phases. Some considerations to be addressed when implementing theses advanced technologies for winter maintenance include communications (especially in rural areas), planning, and system integration. Capital and maintenance costs, user acceptance, training issues, and maintenance needs should be considered early on when planning for advanced technologies. Integration of various technologies is important but challenging, particularly in the areas of communications, user interface, and software/hardware expandability and compatibility.
While each of the advanced technologies may be used independently, their greatest benefit can be realized when they are integrated with one another to provide a greater depth of information. For example, AVL, when coupled with other sensor technologies, can record data such as the surface temperature, ice-presence, road surface salinity, blade position, engine hours and miles traveled. This georeferenced data can then be compiled into a real-time map of maintenance activities and road conditions, providing valuable information to both the maintenance agencies and traveling motorists.
This synthesis will enable maintenance agencies to easily find and evaluate sensor technologies that may be applicable to their particular location, available staff and vehicle inventory. It is expected to encourage maintenance agencies to implement better winter maintenance practices with respect to providing safe, reliable winter highways in a cost-effective and environmentally responsible manner.
Page 2
CHAPTER ONE: INTRODUCTION
Purpose of Synthesis Between 1987 and 1993, the Strategic Highway Research Program (SHRP) began funding research in new areas of winter maintenance technology, including the SHRP Project H-207 which examined road weather information systems (RWIS) and the SHRP Project H-208 on proactive maintenance strategies such as anti-icing (NCHRP, 1999). Shortly thereafter, in 1994, an International Winter Maintenance Technology Scanning Review was completed, leading to a secondary scanning tour in 1998 of European winter service technologies (NCHRP, 1999). The focus of the 1998 scanning tour included RWIS systems as well as other key technologies such as an automatic vehicle location (AVL) system, a fixed automated spray technology (FAST), environmental sensors, pavement surface temperature sensors, salinity sensors, and friction measurement sensors (NCHRP, 1999).
Many of these technologies have since been put into operation throughout the United States; however, documentation of the state-of-the-practice and user benefits is limited and often anecdotal. This is in part because evaluating the advantages, cost-benefits and service-benefits of the wide spectrum of available vehicle-based winter maintenance technologies and other advanced technologies is a complex task and would be difficult for individual maintenance agencies to complete.
This synthesis, which identifies seven key technologies and their state of development, will enable maintenance agencies to easily find and evaluate technologies that may be applicable to their particular location, available staff and vehicle inventory. Additionally, it will encourage maintenance agencies to implement better winter maintenance practices with respect to providing safe, reliable winter highways in a cost-effective and environmentally responsible manner. Not examined in this synthesis are RWIS and friction measurement sensors. RWIS has been well documented through studies such as the NCHRP Synthesis 344: Winter Highway Operations and the FHWA Test and Evaluation Project 28: Anti-icing Technology, Field Evaluation Report, and is not a vehicle-based technology. Friction measurement sensors have been discussed in the NCHRP Project 6-14, Feasibility of Using Friction Indicators to Improve Winter Maintenance Operations and Mobility.
Background In the northern United States and Canada, snow and ice control operations are essential to ensure the safety, mobility and productivity of winter highways (Institute for Safety Analysis, 1976), on which the driving conditions are often worsened by the inclement weather. The U.S. spends $2.3 billion annually to keep roads clear of snow and ice (FHWA, 2005a). These winter maintenance activities provide direct benefits to the public in the form of fewer accidents, improved mobility, and reduced travel costs. Their indirect benefits include, but are not limited to, sustained economic productivity, reduction in accident claims, and continued emergency services. The state departments of transportation (DOTs) are charged with the difficult task of maintaining and operating the highway network during the winter season while working with increased traffic volumes, higher expectations from the public, and the unprecedented budget and staffing constraints.
Depending on the road weather scenarios, resources available and local rules of practice, DOTs use a combination of tools for winter road maintenance and engage in activities including
Page 3
anti-icing, deicing, sanding and snowplowing. As the detrimental environmental impacts of abrasives are generally greater than those of chemicals (Staples et al., 2004), DOTs have begun to minimize the use of abrasives. Currently, the U.S. applies approximately 20 million tons of salts each year (Salt Institute, 2005). The increased use of chemicals, however, has raised growing concerns over their effects on motor vehicles, the transportation infrastructure, and the environment (FHWA, 2002; Mussato et al., 2003; Buckler and Granato, 1999). A study estimated that on average, the indirect costs of snow and ice control operations amount to approximately three times as much as the direct costs (Shi, 2005).
Maintenance agencies are continually challenged to provide a high level-of-service (LOS) and improve safety and mobility in a cost-effective manner while minimizing corrosion and other adverse effects to the environment. In order to reduce the direct and indirect costs of highway winter maintenance nationwide while increasing its benefits, it is important that individual state DOTs and other maintenance agencies improve their snow and ice control strategies. The ultimate goal is to deliver the right type and amount of materials in the right place at the right time. To this end, it is desirable to use the most recent advancements in the application of anti-icing and deicing materials, winter maintenance equipment, and road weather information as well as other decision support systems (Environment Canada, 2004).
A variety of vehicle-based winter maintenance technologies as well as FAST have been implemented by maintenance agencies to optimize material usage, reduce associated annual spending, and ensure the safety of the personnel responsible for maintaining winter roadways, such as AVL, surface temperature measuring devices, on-board freezing point and ice-presence detection sensors, salinity measuring devices, visual and multi-spectral sensors, and millimeter wavelength radar sensors. Benefits of using these advanced technologies may include:
• Improved response time to snowstorms and emergencies • More proactive response to adverse weather conditions • Improved snowplow performance and service • Fewer damaged plows • More accurate and efficient operations with on-demand dispatching • Better fleet and staff management • Improved communications between supervisors and operators • Reduction of manual data entry • Improved safety for traveling motorists and maintenance personnel • Optimized material usage and reduced annual spending • Minimized corrosion and environmental impacts from winter operations.
Technology Integration and Applications While each of the advanced technologies may be used independently, their greatest benefit can be realized when they are integrated with one another to provide a greater depth of information. For example, AVL, when coupled with other sensor technologies, can record data such as the surface temperature, ice-presence, road surface salinity, blade position, engine hours and miles traveled. This georeferenced data can then be compiled into a real-time map of maintenance activities and road conditions, providing valuable information to both the maintenance agencies and traveling motorists. AVL is the most common technology linking the vehicle to the maintenance center.
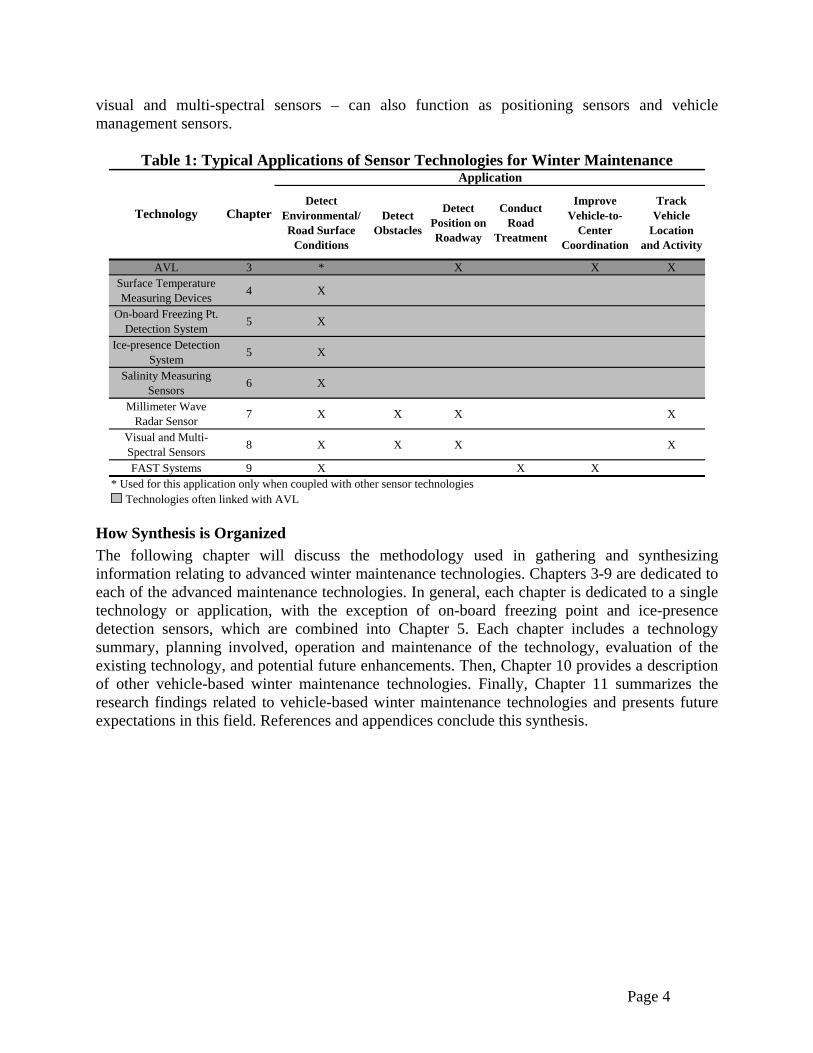
Multiple technologies can perform similar tasks, as shown in Table 1. For instance, two technologies commonly used to detect obstacles – millimeter wavelength radar sensors and
Page 4
visual and multi-spectral sensors – can also function as positioning sensors and vehicle management sensors.
Table 1: Typical Applications of Sensor Technologies for Winter Maintenance
Detect Environmental/ Road Surface
Conditions
Detect Obstacles
Detect Position on Roadway
Conduct Road
Treatment
Improve Vehicle-to-
Center Coordination
Track Vehicle
Location and Activity
AVL 3 * X X XSurface Temperature Measuring Devices 4 X
On-board Freezing Pt. Detection System 5 X
Ice-presence Detection System 5 X
Salinity Measuring Sensors 6 X
Millimeter Wave Radar Sensor 7 X X X X
Visual and Multi-Spectral Sensors 8 X X X X
FAST Systems 9 X X X
Technologies often linked with AVL
Application
Technology Chapter
* Used for this application only when coupled with other sensor technologies
How Synthesis is Organized The following chapter will discuss the methodology used in gathering and synthesizing information relating to advanced winter maintenance technologies. Chapters 3-9 are dedicated to each of the advanced maintenance technologies. In general, each chapter is dedicated to a single technology or application, with the exception of on-board freezing point and ice-presence detection sensors, which are combined into Chapter 5. Each chapter includes a technology summary, planning involved, operation and maintenance of the technology, evaluation of the existing technology, and potential future enhancements. Then, Chapter 10 provides a description of other vehicle-based winter maintenance technologies. Finally, Chapter 11 summarizes the research findings related to vehicle-based winter maintenance technologies and presents future expectations in this field. References and appendices conclude this synthesis.

Page 5
CHAPTER TWO: METHODOLOGY AND REPORTING AGENCY STATISTICS The state of the practice of vehicle-based winter maintenance technologies as well as FAST, was evaluated through a literature review and responses from several questionnaires distributed to maintenance agencies. The literature review was used to determine how the technologies work, how they have been used for transportation applications, how the technologies are advancing, and agency experiences with the technologies. The literature review was carried out using a variety of sources, including:
• Transportation Research Information Service (TRIS) online • The ITS Electronic Document Library • The U.S. Federal Highway Administration Website • Search engines such as Google Scholar • Scientific databases such as SciFinder Scholar • US Patent Office search engine The agency survey process began by using the literature review to identify individuals
with experience using advanced maintenance technologies. A preliminary survey was sent to them as well as the Snow and Ice list serve operated under the Snow and Ice Pooled Fund Cooperative Program ([email protected]), which has hundreds of subscribers ranging from state and local DOT personnel to private sector specialists who are interested in winter roadway maintenance issues. Based on the responses to the preliminary survey, a master list with varying levels of familiarity with the technologies was developed and the questionnaires for each technology were sent to the appropriate contacts (see Appendix A for the survey instruments and Appendix B for the list of responding agencies). Other contacts included maintenance professionals from state DOTs who were not identified previously, individuals from the Transportation Research Board (TRB) Committee on Winter Maintenance, as well as individuals from the American Public Works Association (APWA) winter maintenance subcommittee. Overall, 152 individuals were contacted with a response rate of 21 percent, or 33 participants, and little response was obtained from the contacts in Europe and Japan. State DOTs made up the majority of respondents (63 percent). Other respondents were from U.S. city and regional maintenance agencies, the Canadian Ministry of Transportation, Canadian city and regional maintenance agencies, and the German Federal Highway Institute (as shown in Figure 1). Phone interviews were also conducted when deemed necessary.
Finally, a follow-up survey that briefly evaluated user experience was conducted to confirm the initial findings of this study and ensure all technologies were represented properly. Thirteen United States agencies participated in this process as well as one Canadian agency (see Figure 1). This follow-up survey solicited input on user experience with applicable technologies from individuals who did not participate in the in-depth questionnaire.

Page 6
Figure 1: Survey of Advanced Winter Maintenance Technologies – Participants

Page 7
CHAPTER THREE: AUTOMATIC VEHICLE LOCATION Automatic vehicle location (AVL) is a vehicle-based technology that builds on the need for communication of data between a center and maintenance vehicles in the field, especially with respect to the location of a vehicle. In the past, this information exchange occurred through voice communications over radio and it would require significant manual effort to use this information. Now, there are a variety of AVL technology packages that automatically determine a vehicle’s location, and transmit this information (along with other attributes of interest) wirelessly to a computer located many miles away. Relative to other technologies reviewed in this synthesis, AVL has a long history of usage in numerous applications, and is available from a large number of vendors as, more or less, a commercial-off-the-shelf (COTS) package. Therefore, the focus on this chapter will be on describing how AVL works, and then reviewing the experiences of early AVL implementers.
Figure 2: Schematic of Automatic Vehicle Location System
Technology Summary According to the 2004 Intelligent Transportation Systems (ITS) deployment survey, six states reporting using AVL for winter maintenance operations: Iowa, Michigan, New York, Ohio, Washington and Wisconsin (ITS Joint Program Office, 2005). Several other transportation agencies have adopted pilot projects with AVL in winter maintenance, including the states of Colorado, Idaho, Iowa, Montana, Utah and Virginia; McHenry County (Illinois); and the cities of Columbus, Ohio and West Des Moines, Iowa. This suggests that AVL is gaining national acceptance as an important tool in improving winter maintenance operations.
AVL is a technological concept that integrates several functions, as shown in Figure 2. At the core of AVL is the ability to provide an absolute geospatial reference for the vehicle on a real-time basis. This reference is associated with a time-stamp so that a vehicle’s location can be tracked over time. The time-stamp information may be supplemented with other data that is
sensors
data
data
• In-vehicle unit• Antenna• Sensors
sensors
data
data
• In-vehicle unit• Antenna• Sensors

Page 8
collected from the vehicle automatically, or is manually input through an in-vehicle interface. All information from the vehicle is then communicated wirelessly to a remote server that interprets the information, and displays it in a variety of interfaces for analysis and use. Most vendors offer integrated solutions that include one or more options for all of these functional aspects; however, customers may choose to develop their own system to take advantage of existing capabilities (e.g. a state-owned radio system).
Vehicle Location Central to an AVL system is the automated identification of a vehicle’s location, speed and direction of travel. Before the availability of satellite-based global positioning systems (GPS), vehicle location was determined using signposts along roadways. Each signpost sent a radio signal that was received by the vehicle; as each signpost’s location was fixed and known, the location of the vehicle was able to be approximated. The actual motion of the vehicle was extrapolated based on the change in the odometer reading from when the last radio signal was sent.
Figure 3: GPS Geostationary Satellites (Graphic Courtesy of the Canadian Coast Guard) The first true AVL application was introduced for the motor carrier industry in February
1990 by Qualcomm. Qualcomm used its own two-way satellite wireless link, Qualcomm Automatic Satellite Position Reporting (QASPR), which relied on Time Division Multiple Access (TDMA) signals on the up and downlink, with one satellite processing the signal and the second satellite monitoring a beacon signal. The satellites send distance information, which is converted into the latitude and longitude coordinates of the mobile terminal in real-time. QASPR could be used to accurately capture vehicle location within 0.25 miles (0.40 km), which would be reasonable for many long-distance freight applications.
Page 9
Today, vehicle location is done primarily through GPS technology (US DOT, 2000) Position location using GPS is done through a network of 24 satellites in 12-hour circular orbit approximately 12,000 miles (20,000 km) above the earth. The satellites are grouped into six groups of four, with each group occupying a separate orbital plane around the earth. With the satellites rotating around the earth on a 12-hour orbit, any object on the surface of earth is in the field of view of four of them (Jet Propulsion Laboratory 1998). Only three satellites are necessary to give an accurate position, the fourth satellite reading is used to give exact coordinates with varying accuracies; it also provides information about elevation (Canadian Coast Guard, 2005). On some occasions, GPS signals do not reach the receivers because of topography, tall buildings or thick foliage; in such cases, “dead-reckoning” is used to predict the position of vehicles based on the last known direction, speed and location of vehicles.
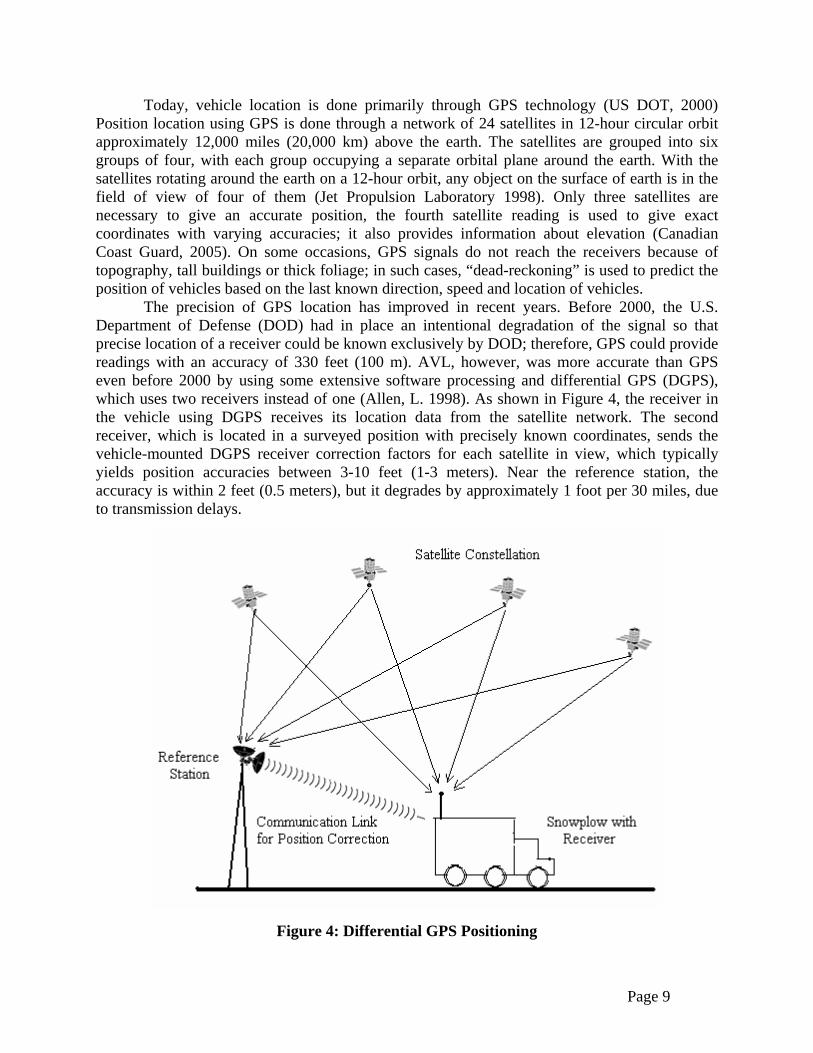
The precision of GPS location has improved in recent years. Before 2000, the U.S. Department of Defense (DOD) had in place an intentional degradation of the signal so that precise location of a receiver could be known exclusively by DOD; therefore, GPS could provide readings with an accuracy of 330 feet (100 m). AVL, however, was more accurate than GPS even before 2000 by using some extensive software processing and differential GPS (DGPS), which uses two receivers instead of one (Allen, L. 1998). As shown in Figure 4, the receiver in the vehicle using DGPS receives its location data from the satellite network. The second receiver, which is located in a surveyed position with precisely known coordinates, sends the vehicle-mounted DGPS receiver correction factors for each satellite in view, which typically yields position accuracies between 3-10 feet (1-3 meters). Near the reference station, the accuracy is within 2 feet (0.5 meters), but it degrades by approximately 1 foot per 30 miles, due to transmission delays.
Figure 4: Differential GPS Positioning
Page 10
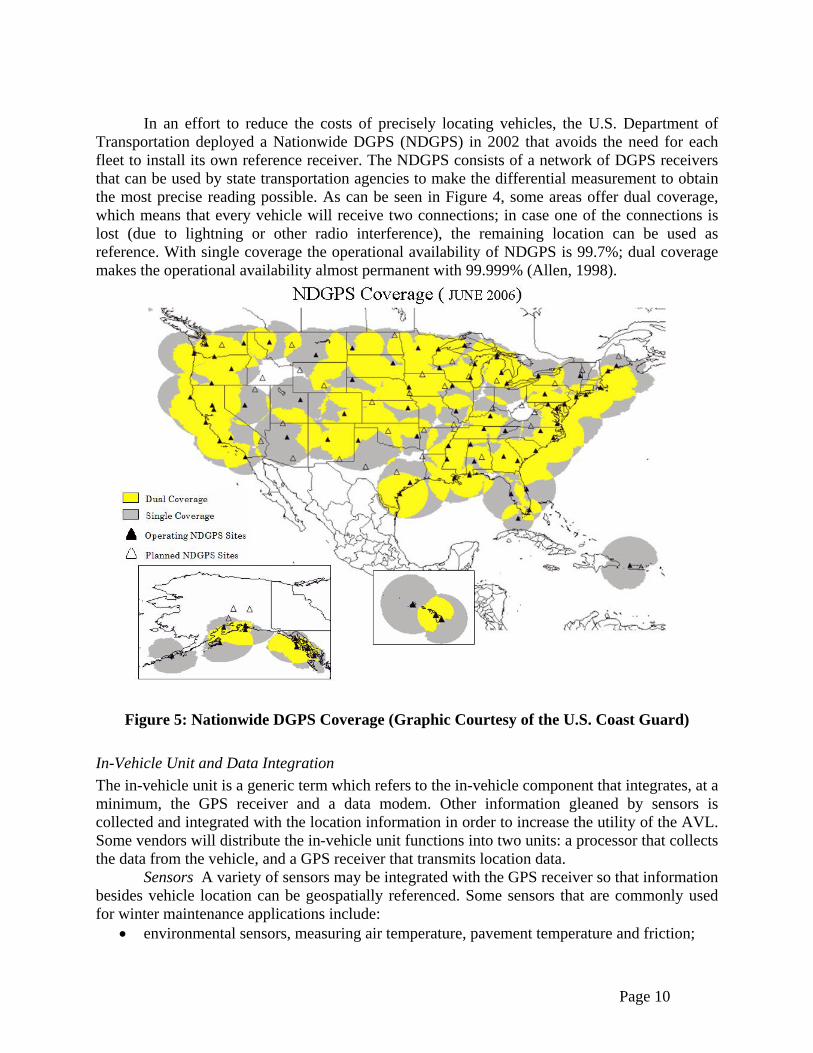
In an effort to reduce the costs of precisely locating vehicles, the U.S. Department of
Transportation deployed a Nationwide DGPS (NDGPS) in 2002 that avoids the need for each fleet to install its own reference receiver. The NDGPS consists of a network of DGPS receivers that can be used by state transportation agencies to make the differential measurement to obtain the most precise reading possible. As can be seen in Figure 4, some areas offer dual coverage, which means that every vehicle will receive two connections; in case one of the connections is lost (due to lightning or other radio interference), the remaining location can be used as reference. With single coverage the operational availability of NDGPS is 99.7%; dual coverage makes the operational availability almost permanent with 99.999% (Allen, 1998).
Figure 5: Nationwide DGPS Coverage (Graphic Courtesy of the U.S. Coast Guard)
In-Vehicle Unit and Data Integration The in-vehicle unit is a generic term which refers to the in-vehicle component that integrates, at a minimum, the GPS receiver and a data modem. Other information gleaned by sensors is collected and integrated with the location information in order to increase the utility of the AVL. Some vendors will distribute the in-vehicle unit functions into two units: a processor that collects the data from the vehicle, and a GPS receiver that transmits location data.
Sensors A variety of sensors may be integrated with the GPS receiver so that information besides vehicle location can be geospatially referenced. Some sensors that are commonly used for winter maintenance applications include:
• environmental sensors, measuring air temperature, pavement temperature and friction;

Page 11
• vehicle activity sensors, such as whether the plow is raised or lowered and whether materials or chemicals are being spread and the application rate; and
• vehicle status sensors, such as fuel level and odometer reading. The integration of sensors with a particular vendor’s AVL platform should not be
assumed to be a “plug-and-play” hookup. In many cases, AVL vendors design their products to work with certain vehicle equipment vendors; products, such as spreader controllers. Compatibility with other products can usually be obtained, but often at an additional cost for the customer.
Manual Input The location information can also be integrated with manual input from a mobile data terminal. The terminal may display information such as chemical spreading rates, position of the blade and roadway surface temperature readings for better operator awareness of roadway and atmospheric conditions. This input could include geographically relevant information (e.g. observed roadway conditions), and therefore is logically connected with the location information. In other cases, the input could simply take advantage of the existing wireless communication connection between the vehicle and the center.
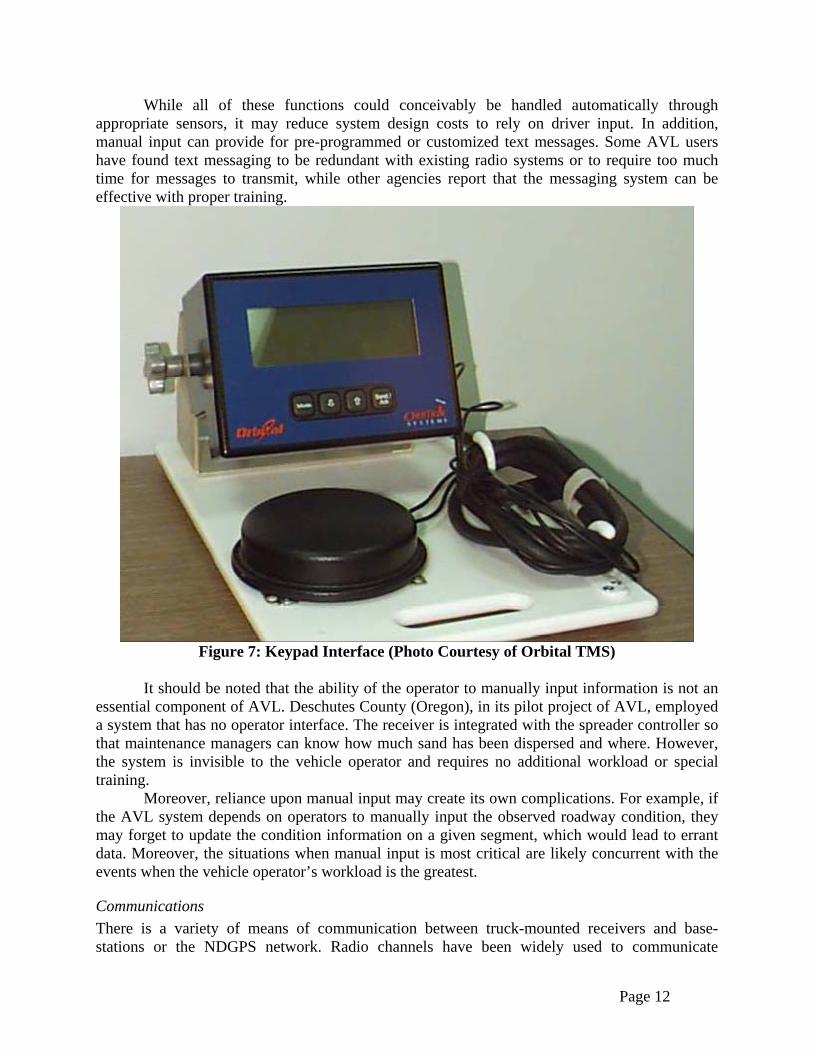
Manual input may be provided through a touch-screen interface, as shown in Figure 6. This particular interface allows the vehicle operator to touch large “keys” to enter information regarding the lane of travel, the material currently being used, blade position, and similar information. On the left side of the screen, the operator can view the conditions that are currently being recorded by the in-vehicle unit. Manual input can also occur using a keypad, as shown in Figure 7.
Figure 6: Touch-Screen Interface (Photo Courtesy of IWAPI, Inc.)
Page 12
While all of these functions could conceivably be handled automatically through appropriate sensors, it may reduce system design costs to rely on driver input. In addition, manual input can provide for pre-programmed or customized text messages. Some AVL users have found text messaging to be redundant with existing radio systems or to require too much time for messages to transmit, while other agencies report that the messaging system can be effective with proper training.
Figure 7: Keypad Interface (Photo Courtesy of Orbital TMS)
It should be noted that the ability of the operator to manually input information is not an
essential component of AVL. Deschutes County (Oregon), in its pilot project of AVL, employed a system that has no operator interface. The receiver is integrated with the spreader controller so that maintenance managers can know how much sand has been dispersed and where. However, the system is invisible to the vehicle operator and requires no additional workload or special training.
Moreover, reliance upon manual input may create its own complications. For example, if the AVL system depends on operators to manually input the observed roadway condition, they may forget to update the condition information on a given segment, which would lead to errant data. Moreover, the situations when manual input is most critical are likely concurrent with the events when the vehicle operator’s workload is the greatest.
Communications There is a variety of means of communication between truck-mounted receivers and base-stations or the NDGPS network. Radio channels have been widely used to communicate

Page 13
information. For example, the Southeast Michigan Snow and Ice Management (SEMSIM) AVL deployment used the Detroit area regional public bus system’s 900 MHz radio system to provide communication between vehicles and computer terminals located at a dispatch center managed by the SEMSIM partnering agencies (Anderson, E. 2004). A radio system is attractive in that the only costs involved would be the initial equipment, set-up, and maintenance costs. However, the availability of capacity within existing radio channels may constrain the attractiveness of this alternative, as AVL-related transmissions could potentially interfere with voice traffic and emergency calls.
Cellular communications is an attractive communications alternative, because it is widely used and can take advantage of a variety of off-the-shelf technology and support options. It is possible to send data over analog cellular service using a modem. This is similar to a modem used by a home computer to connect to the Internet using a standard phone line. Because the analog cellular connection can have more noise than a wired phone line, the data will transfer at a much slower rate. AVL only needs to send small bursts of data (dependant on the amount of sensors installed), so an analog signal might be adequate. For AVL data communications, a digital cellular network is preferred as it provides a much better data rate. However, digital cellular coverage is often limited to larger cities and major highway and interstate corridors, which may limit its usefulness in rural highway applications. Data would have to be stored until a digital signal was found, and this delay might reduce some of the benefits associated with having real-time information on vehicle location and operations.
Cellular digital packet data (CDPD) transmission was attractive for fleets for many years, as CDPD carriers charged rates based on the number of data packets sent as opposed to connection time. As a packet-based protocol, CDPD was compatible with TCP/IP and therefore with the Internet and intranet, even if data transfers using CDPD were slow (19.2 kbps) compared to other IP transfers. However, many telecommunications carriers have stopped supporting CDPD, so it is falling out of favor with many transportation agencies that would prefer a long-term communications solution.
General Packet Radio Service (GPRS) transmission has emerged as an attractive option for fleets wanting to use AVL as it is available on most Global System for Mobile (GSM) communications networks. GPRS offers higher throughput rates up to 40 kbps. The main advantage of using GPRS is that it is supported by all the emerging communications schemes used in the latest generations of mobile communications products by major U.S. providers, such as Verizon, AT&T, T-Mobile and Cingular. GSM, being a ubiquitous technology, allows subscribers to use their privileges with other operators, and has maintained backward compatibility with previous generations. GPRS was also favored over CDPD, because as the price of individual GPRS modems is $1,000 or lower, compared to CDPD modem costs of $3,500 per vehicle.
One way of bypassing coverage issues associated with some methods of communication is to use satellite coverage, which can provide a data link connection whenever there is an unobstructed view of the sky. However, connection and airtime charges with a satellite link can be very high. Also, the hardware to connect to the satellites would cost considerably more than the hardware required for standard cellular data communications. Prices of satellite data communication services are decreasing, so this might be a viable option in the future.
Another recent advance in communications is the use of Wireless Wide Area Networks (WAN), which rely on wireless network cards that are standard with all new generation laptop computers. Agencies that are reluctant to depend on monthly satellite or cellular subscriptions
Page 14
can find this option appealing. Currently, these networks function only within certain distance ranges – less than 1 mile for the common 802.11b, 802.11e and 802.11g wireless standards – but emerging standards promise longer communication range that could be compatible with some AVL deployments.
Data Management AVL's success in providing real-time information from the vehicle to the center depends on the availability and capacity of wireless communications. There is generally a tradeoff between availability and cost: with a desire for improved communications availability, the corresponding cost increases as well. In addition to this, the technology must effectively compensate for times when bandwidth is limited or wireless coverage is absent. Both of these concerns are addressed in how the AVL system manages data from the vehicle side.
Reducing Transmission Volumes To reduce communications costs, especially in rural areas where cellular coverage may be limited, a customer may experiment with changing the frequency of data transmission as well as the volume of data included in a transmission. While more frequent updates can be seen as beneficial, these may not be feasible when using a shared radio network, and this will tend to increase the cost of data transmission in a commercial network (e.g. cellular). Therefore, system designers tend to confine transmissions to updated pieces of information. Suppose, for example, that the plow position status was sent every two seconds to the central office. If the plow is in the same position for five minutes, 150 updates will be sent, instead of two smarter updates: a first update telling that the plow is down, and five minutes later a second update saying that the plow is now up.
While polling on a two-second or three-second basis is common in more urbanized deployments, pilot projects in several states have revealed far less frequent updates. In a recent Iowa pilot project, data is updated every ten minutes or if the status of selected sensors changed. A project in Utah had 15-minute update intervals. A pilot project in Colorado uses a mixed approach, with 10-second updates on some vehicles and 3-minute updates on others (Strong et al., 2005). Another deployment in Washington State sends updates every 100 meters (telephone comm. McBride 2006).
As another method of reducing data transmission volumes, systems may be designed to receive information through polling, on an exception basis, or both. In the polling scenario, the central computer sequentially polls vehicles and then updates the location map. This method introduces delays that increase with the size of the fleet being polled, and may be limited by the capacity of an existing radio channel. Exception data transmission is less demanding than polling; only noticeable changes to expected operations are conveyed, such as delays beyond preset tolerances or changes in path. A combination of polling and exception can be used to optimize event reporting details and radio usage, such as using polling only at known stages of operations such as their debut and end, and having all polling done on an exception basis to minimize communication traffic and data that needs to be stored.
In-Vehicle Data Storage When a communications network becomes unavailable in a certain area, there are a couple of different approaches that may be employed. One option is to have an AVL platform that supports multiple communications methods, relying on a hierarchy based on availability. For example, the receiver could normally operate using cellular communications, but switch to satellite communications when cellular coverage is poor or unavailable. Another approach to this challenge, used by many vendors, is to provide storage within the vehicle for historical data. This storage would hold data until communications become

Page 15
available again, at which point the entire cache of data would be transmitted. Each element of data could include a timestamp, so that the history of the vehicle’s movements could be reconstructed after the fact.
Center The final component of an AVL system is termed a center, although it may not refer to a staffed building where dispatchers are using vehicle data on a real-time basis. The center could refer to a software application that can be accessed for this information on an as-needed basis from one or more computers. Moreover, the server containing this data may be physically located at the vendor’s office. Many AVL vendors now use applications that are Web-based so that any user can, with the proper permissions, monitor the vehicles equipped with AVL, even from home. The interfaces are often flexible so that one interface can be presented to maintenance managers, which might include the identification of specific vehicles or drivers, whereas a different one can be presented to the traveling public. Any information available to the public is usually stored separately from the data available to the agency to avoid any security breaches, making the agencies; communications accessible only through an Intranet.
Vendors have also improved the integration of AVL data with non-proprietary map platforms. Some vendors use open-source conventions, so that a transportation agency may more easily integrate AVL data onto their pre-existing mapping software platform.
Computer assisted dispatching (CAD) software is responsible for gathering the data from vehicles. These data may include vehicle location, condition, schedule delay, operator identification, and incidents. The CAD software manages communications, keeps logs of all activities relating to vehicles tracked, and assists managers in taking operational decisions.
The software and the graphic displays are complex especially when the in-vehicle units include touch screens. For this reason, transportation agencies have relied on COTS software applications, with software enhancements contracted out as needed.
Planning Like any other technology, a transportation agency’s decision to use AVL should be based on having some specific applications in mind. This section reviews the more common applications that AVL can provide in winter maintenance, and then synthesizes guidance on how an agency can plan for AVL implementation.
Real-Time Applications AVL has been used extensively in applications outside of winter maintenance, including motor carrier freight, public transportation, and emergency response. Some of the benefits realized in these applications have motivated several transportation agencies to deploy AVL on maintenance vehicles. There has been special interest in applying AVL to winter maintenance operations, both for management of vehicle and personnel resources during winter storm events (real-time), as well as in improving the documentation and analysis of resource usage after storms have ended (archived).
Real-time AVL applications involve analysis of and action upon vehicle information immediately upon receipt of this information. This information is designed to help maintenance managers direct resources efficiently during winter storm events.
Page 16
Vehicle Tracking AVL provides the current location of a vehicle, and can be used to provide a recent historical trace of a vehicle’s path. Agencies may use this to ensure that drivers are making their expected progress on their routes.
Vehicle Dispatching When a fleet of vehicles is equipped with AVL, personnel stationed at a maintenance office may identify which vehicle should respond to a new situation, such as a stranded motorist or an accident. This can be valuable in reducing response time, or in compensating for times when one or more vehicles are out of service.
Vehicle Routing It may be necessary to change the routing of vehicles during a winter storm, in order to avoid congested areas or accidents. Instead of a driver being required to develop alternate route plans on a real-time basis and being distracted from other activities, a dispatcher may use outputs from AVL to help to identify the best route for each vehicle, and may communicate this via voice or data transmission to a driver.
Vehicle Activity Several aspects of a vehicle’s operation, such as speed and direction of travel, the plow position and dispersion rates of sand or chemicals, may be communicated along with vehicle location. Synthesized over time, this information can be used to direct future activities by identifying when they were last done (e.g. when was a particular segment of road most recently sanded).
Environmental Conditions When integrated with other sensors, AVL can provide georeferenced data regarding pavement condition, current weather conditions, surface temperature and other factors that could be useful in making winter maintenance decisions. This information may also be provided to the general public on a Web site. Automatic transmission of this information can improve the timeliness and accuracy of information while reducing the need for manual input.
Driver Communications Many AVL systems offer the ability to send pre-written text messages between the driver and the dispatch center. This can provide documentation of communication that occurred during a winter event, which could facilitate driver and dispatcher training, while also lessening routine communications on the voice communication system, leaving that available for emergency communications.
Interagency Coordination AVL systems can translate a variety of vehicle location and operations information into a format that can be readily shared with other agencies in the same region. This can support cooperative efforts across agencies during winter storm response.
One deployment of AVL which has focused extensively on the benefits of interagency coordination is SEMSIM, a partnership that includes the Detroit Department of Public Works, the Road Commission of Macomb Country, the Road Commission for Oakland County, and the Wayne County Department of Public Services. The partnership has provided a framework, supported by AVL technology, to allow snowplows to cross jurisdictional lines if it may improve efficiency during a given winter event (Road Commission for Oakland County, MI, 2002).
Vehicle Status AVL can be used, in conjunction with the appropriate on-board sensors, to measure a maintenance vehicle’s performance in terms of fuel efficiency, engine idling time and emissions. While not a benefit specific to winter maintenance activities, tracking vehicle status could lead to identification of opportunities to save money by making vehicle operations more efficient.
Driver Security The ability to monitor vehicle location can be used to identify when a vehicle has not moved for an extended period of time, indicating that a driver may have been involved in an accident and is not able to communicate to their dispatcher.
Page 17
SEMSIM includes an emergency alarm message that can be sent by a driver. This message, which includes an audible alarm, differs from other messages transmitted by the vehicle operator in that it must cleared intentionally by a dispatcher. The fact that a dispatcher does not have to be at the center when the message is received is an additional security benefit (Road Commission for Oakland County, MI., 2002)
Archived Applications Using AVL on an archived basis does not require real-time communications between vehicles and a center. It does, however, require the association of location and other vehicle data with a specific time-stamp. Analyzed after a storm or a season, archived AVL data may be used in several applications.
Maintenance Management Archived records from AVL can provide a more accurate representation of winter maintenance activities. These can replace voice recordings or written record-keeping by plow operators, which may be sporadically kept, may be difficult to read, and require additional time for data entry.
A demonstration AVL project started in Deschutes County, Oregon in 2005 was motivated by the ability to improve maintenance record-keeping. They did not have a need for real-time tracking, and, moreover, there was poor cellular coverage or satellite communications were expensive. Through the use of AVL, county personnel felt they could avoid the problems of garbled or indecipherable data.
Chemical and Material Management AVL can be used to track not only the amount of chemicals and materials used in winter maintenance, but also the location where these were applied. This information can be valuable for maintenance resource management purposes, as well as in addressing environmental and run-off concerns.
One benefit of an AVL system implemented in Vaughan, Ontario, which integrates computerized salt spreaders with the in-vehicle unit, is that it puts the city in a position to comply with whatever systems may eventually be implemented by the Canadian government to monitor actual use of road salts (Anthony, 2004)
Contractor Accountability Some transportation agencies, such as the Alberta Department of Transportation, the Virginia Department of Transportation’s Northern Virginia (NOVA) Region (Roosevelt et al., 2002) and the City of Vaughan [Ontario] (Anthony, 2004) have used AVL to provide better accountability for contractors who perform highway maintenance. AVL can be used to improve documentation and billing of contractor activities.
Tort Liability An increasing issue for many transportation agencies is tort liability in relation to alleged failure to properly treat a road segment prior to a crash, or damage allegedly caused by winter maintenance vehicles (for example, a rock expelled from a snowplow blade that hits a car’s windshield). By having time-stamped data of each vehicle’s location throughout a storm, the transportation agency can provide defensible information that could assist in these claims. The Massachusetts Department of Transportation cited tort liability as a motivating factor in using AVL on its snowplows (Talcott, 2004). The Alberta Department of Transportation and Deschutes County (Oregon) have cited similar motivations for their systems.
Guidelines As a number of agencies have implemented AVL on winter maintenance vehicles on at least a pilot basis, there has been a significant amount of experience gained regarding how AVL implementation should be planned for success.

Page 18
Use a Systems Engineering Approach While responding agencies did not use these words, the systems engineering approach is foundational for successful planning and design of an AVL system. The systems engineering approach is an iterative process that seeks to build the true user needs and requirements into the final product to minimize the need for costly modifications later. Key aspects of this approach include the following:
• Development of a concept of operations – e.g. how AVL will be used and by whom • Identification of requirements – the functionality that is necessary for the concept of
operations to be realized • Development of a system design that follows the requirements The first two stages require considerable input from vehicle operators and maintenance
managers to ensure that the system will be responsive to their needs. If the system requirements or detailed design are developed through the use of an outside contractor, it may be beneficial to have the system integrator “shadow” winter maintenance operations, at both the vehicle and center levels, so he or she can have a first-hand experience of the true requirements and needs.
The systems engineering approach may not work perfectly if a transportation agency is unsure about how it would use AVL, but it provides a good framework to better respond to uncertainty. More information on applying the systems engineering process to transportation systems is available through the ITS Joint Program Office (Gonzalez 2002).
Obtain Buy-In Stakeholder engagement occurs throughout the systems engineering process, and obtaining the buy-in of vehicle operators and managers is vital to ensure successful completion of the process. Several transportation agencies have cited vehicle operators; fears of “Big Brother” – i.e. using AVL as an intrusive device to micromanage vehicle operators – as a hindrance to AVL acceptance. Vehicle operator buy-in is especially critical on any system that requires driver input or action (i.e. manually entering the current road condition). The Alberta Department of Transportation found that face-to-face training and committee meetings helped to correct misperceptions regarding how AVL data would be used. Moreover, vehicle operators could appreciate that the new automatic billing, included as a part of the AVL deployment, would reduce their paperwork, so they could see personal benefits in the AVL system.
Aside from the “Big Brother” fear, AVL will introduce a change in how winter maintenance operations are done. Depending on how it’s used, AVL could simply provide better historical information for maintenance managers, or it could involve a virtual re-invention of how snowplow routes are executed. There may be staff reluctance to learn the new technology, and there may need to be reassignment of staffing resources to better align with the capabilities of AVL. Developing a consensus among stakeholders from the beginning is therefore vital.
Consider Trade-offs with Software Customization AVL is sufficiently advanced that there are a variety of COTS packages that could meet most transportation agency needs. However, through the systems engineering process, it may become clear that AVL could be customized to address a broader set of needs. For example, a transportation agency that is procuring a maintenance management system may want to provide for future introduction of AVL as a means of collecting data. As another example, the Oregon Department of Transportation’s (ODOT) Transportation Operations Center System project seeks to provide and track transportation information for dissemination to ODOT operations, law enforcement, other State and public transportation systems, and the general public through a series of mission critical services. Although ODOT does not currently employ AVL on its winter maintenance vehicles – it is used on incident response vehicles – the third and fourth phases of TOCS will make full geographic information system (GIS) capabilities available to all of ODOT, opening
Page 19
the use of AVL to winter maintenance vehicles (Daniel, email comm., 2006). These opportunities should be recognized at the beginning, to minimize the costs of costly re-design. However, software customization can lengthen the time required to have an operational system. The Alberta Department of Transportation found that it took time to modify the mainframe application to accept data from the AVL system. Moreover, contractor and staff training generated suggestions for software modifications, which took additional time. A COTS AVL package could avoid most of these problems, although it might not provide the agency which their desired functionality. These trade-offs should be considered early on.
Investigate Partnerships and Data Sharing Opportunities SEMSIM showed that there was value realized when several agencies with similar responsibilities in adjacent or overlapping jurisdictions could share data on their winter maintenance operations. Similarly, an agency considering AVL implementation should seek to identify potential partners early on, so that any requirements regarding data sharing can be addressed.
Investigate ITS Architecture Conformity As a technology which uses other technologies to exchange information between maintenance vehicles and maintenance centers, AVL may be a candidate for inclusion into a region’s ITS architecture. AVL as developed in the National ITS Architecture primarily focuses on winter maintenance operations, including market packages such as Maintenance and Construction Vehicle and Equipment Tracking (MC01), Road Weather Data Collection (MC03) and Winter Maintenance (MC06). It may be included indirectly as a component of Interactive Traveler Information (ATIS02) or an ITS Data Warehouse (AD02) as well (USDOT “National ITS Architecture – Market Packages”, 2006). The specific way that AVL will be integrated into the architecture depends on the applications that AVL is intended to address, but this should be considered at the planning stage as well. More information on these market packages and use of the National ITS Architecture may be found through the ITS Joint Program Office (USDOT “Architecture – ITS”, 2006).
Start with Pilot Test While AVL is gaining recognition as a technology that can improve winter highway maintenance efficiency, and while the technology has become more robust and failure-resistant over time, most agencies approach AVL with a pilot test, followed by a full deployment later. This approach falls in line with the traditional systems engineering process, and is appealing because it lessens the initial cost of implementation. More importantly, a pilot test can reveal institutional and operational issues associated with broader AVL deployment, such as the following:
• Are there personnel who would act on AVL information on a real-time basis? • Does the in-vehicle unit successfully integrate with the desired sensors? • What is the optimum frequency of updating vehicle status information? • Do operators have concerns about the system (e.g. privacy, information overload)? • Is the software adequate to meet vehicle operator and dispatcher expectations? Since it provides limited geographical coverage, often times not covering all winter
maintenance vehicles within a given region, the pilot test will not give a comprehensive picture of the potential efficiency benefits of AVL related to dispatching and fleet management. Iowa DOT noted in its pilot test that broader implementation would be necessary to get a better understanding of AVL’s potential benefits (Anderson, E., 2004). However, the pilot test can make significant headway into addressing issues that could paralyze a future, larger-scale deployment.
Incorporate AVL into Vehicle Procurement Decisions Since AVL is a vehicle-based system, the use of AVL may affect vehicle procurement decisions. The Alberta Department of

Page 20
Transportation, which relies on AVL to assist in contractor monitoring, is making AVL a requirement on all new contracts, so that trucks purchased by the department in the future have AVL. This can ensure that any on-board integration issues – for example, with spreader controllers – are addressed at the outset. When specifying on-board sensors for its snowplows, the Washington State Department of Transportation requires that the sensors be compatible with more than one AVL vendor. This helps to protect the state from being limited to using only one AVL vendor (Telephone Comm., McBride 2006).
Install AVL during Off-Season In-vehicle installation should not be scheduled for winter months, except for a pilot test on spare vehicles. This will ensure that vehicles are available to have the in-vehicle units properly installed, and integration with on-board sensors thoroughly tested.
Operations and Maintenance After AVL is procured, the agency must operate and maintain the system. This involves considerations of staff training, as well as costs and maintenance requirements.
Training Proper usage of any new technology is often dependent on the training that is provided to users of the technology. With respect to AVL, there are two groups of people who may interact with the technology: vehicle operators and dispatchers/maintenance managers. The training needs for each vary based on how the transportation agency uses AVL.
Vehicle Operators Transportation agencies that have implemented AVL have taken numerous approaches to how vehicle operators are to interact with the system. Deschutes County (Oregon) has taken an approach where no action is required by operators to activate or use the AVL system; therefore, no training is required. The Alberta Department of Transportation’s AVL system requires operators to use a billing switch to indicate when their work was part of a maintenance contract. At the end of a workday, the AVL system creates an automated bill that must be reviewed by the vehicle operator before submission for billing. While not requiring special technical expertise, it does necessitate re-learning a normal procedure.
Dispatchers/Maintenance Managers There have been significant improvements in the usability of information gathered through AVL, so that familiarity with a Web browser may be all that is required of maintenance managers to view and use the data. However, the Alberta Department of Transportation noted that while their AVL software may easily generate a variety of prepared reports, some expertise is required to know how to interpret the reports. Therefore, the training and expertise required may need to focus more on interpretation of the data rather than actual use of the system. Another early implementer of AVL for winter maintenance operations, the Utah Department of Transportation, noted similar experiences (FHWA, Turner-Fairbank Highway Research Center, 2000).
SEMSIM Case Study Evaluation of the SEMSIM AVL project discussed in some detail the training provided by the vendor. The vendor included four groups: a general training to drivers, and more in-depth training focused on maintenance, web and administrative staff. These in-depth training sessions were offered to a limited number of SEMSIM partners in the hope that they would in turn train the remaining users in their respective groups. The length of the training was half a day, which was deemed too short by the maintenance personnel. SEMSIM partners later negotiated to include additional maintenance trainings on vehicles with known problems to

Page 21
acquire hands-on experience. The web and administrator training were also requested to be longer to know about the system in further detail.
The SEMSIM training also included instructions on debugging the system and dealing with common vehicle issues. SEMSIM partners were initially offered a 1 year maintenance warranty, but that was not deemed sufficient for mastery of the system. Therefore, they negotiated with the vendor for further on-site training to give maintenance crews more exposure with common vehicle issues.
Costs AVL has both initial (capital) and on-going (operations and maintenance) costs to be considered. The capital costs will be highly dependent on the level of software development and customization that is required, while the operations and maintenance costs will be based primarily on the cost of communications.
Capital Costs The capital cost per truck varies based on which sensors were installed on each truck and how the truck was equipped before the AVL was installed. Another variable in cost is when the systems were installed, as prices have dropped quite a bit over time. Alberta estimated the cost to be $2,000 per installation, which included one plow sensor. Colorado’s installations were $1,250 per vehicle for the GPS and communications hardware, and the optional touch screen displays in the trucks were $285 each. Iowa’s installations cost around $3,500-4,000. Utah stated that their AVL cost around $3,000 per truck. Washington’s cost was reported at about $1,250 per truck without sensors (Strong, C., et al., 2005). Howard County (Maryland) estimated their installation costs per truck at approximately $4,800 per truck in 1999 dollars ($5,800 today) (Howard County, MD., Bureau of Highways 2005).
Operations and Maintenance Costs Communications costs from several deployments, such as Alberta, Virginia [NOVA (Roosevelt et al., 2002)] and Aurora, Colorado (AT&T Wireless, 2004) are in the range of $40 to $60 per month per vehicle. In addition to their communication costs, Alberta DOT's AVL system requires about $1,300 per month on data administration and management. Even though other transportation agencies might not use AVL for billing purposes as Alberta has, there could be significant costs associated with data management and storage. Howard County (Maryland) estimated their on-going costs per truck at approximately $100 per truck per year (Howard County, MD., Bureau of Highways 2005).
Many early deployments of AVL were plagued by maintenance problems. These were generally related to poor installation and connection of the sensors or the in-vehicle unit. Virginia’s NOVA District, for example, reported a 5-10 percent failure rate in its in-vehicle units during its early pilot trial (Roosevelt et al., 2002) Alberta DOT opted to use a three-year maintenance contract through the system vendor.
Evaluation Documented results of evaluations of AVL deployments are somewhat limited, and they offer a mixed picture.
Northern Virginia (Anderson, 2004 and Roosevelt et al., 2002) A pilot AVL program was initiated in the Virginia Department of Transportation’s Northern Virginia (NOVA) District in 1996. AVL was tested for three consecutive winters, from 1997-98 to 1999-2000, on 80 trucks to help manage operations and communications during storm events, when the NOVA District relies heavily on contractor support. Because of its early deployment,

Page 22
the system relied on components such as DGPS, CDPD and three networked desktop computers, which have been superseded in more recent deployments. An in-vehicle unit recorded binary information on the status of the plow height, chemical spreader and vehicle engine at two-second intervals, and transmitted it every ten seconds. It supported customized messaging from the base station to the vehicle operator, and 30 pre-written messages that the operator could send to the base station. Maps were displayed on vendor-provided software that could be updated at varying scales and showed real-time displays of vehicle location, route traces, and color-coding based on vehicle activity.
While the pilot test performed reasonably well in mapping vehicle location, it revealed several areas for potential improvement. Short update speeds provided more information than could be processed by dispatchers and resulted in significant delays in receiving information. The color-coded maps and the specification for lane-specific DGPS precision were also more information than was required. The use of temporary installations of the in-vehicle units resulted in a higher-than-expected failure rate. Moreover, milder-than-normal winters were experienced through the duration of the pilot test. The pilot test was terminated in 2000 due to sensor failures, obsolescence of the in-vehicle units, and cost.
NOVA District resuscitated AVL in 2003 using GPS cell phones in conjunction with an Internet map and reporting system. The customized system was far less expensive than the earlier system, and maintenance managers were pleased with its performance. However, no benefit-cost information is available.
Aurora, Colorado (FHWA Road Weather Management Program, undated and CompassCom, 2003) The City of Aurora started implementation of AVL on 20 snowplows in 1998. The system collected vehicle position information every two seconds, and transmitted this information to a base computer every 20 seconds. Aurora’s experience is somewhat unusual in that they have successfully migrated between vendors and communications systems since the project’s inception. The system originally used CDPD for communications, but later switched to GPRS GSM because CDPD was to be deactivated. The city switched vendors because the original in-vehicle unit was no longer being supported, and the city desired greater functionality.
City officials estimate that the tracking capabilities afforded by their AVL system have reduced treatment costs by 15 percent and improved productivity by 12 percent. The system has also given maintenance managers better ability to answer citizen queries on when a specific street will be plowed.
Wayne County, Michigan (National Research Council, 1999 and Thirumalai, 1998) In 1997, Wayne County, where Detroit is located, recognized the difficulty in supervising and managing snow clearance operations which could involve 160 trucks on 130 routes at any given time. There was a desire to improve coordination of trucks based on the dispatcher having a clearer understanding of how current road clearing operations were progressing. A public-private partnership was formed to install AVL in one Wayne County district, provide the district with intelligent routing software, and determine the efficiency increase that resulted from the dispatcher having a color-coded map indicated what portion of the district’s roads were salted or plowed. The in-vehicle unit collected information on plow position, amount of salt being dispersed, and vehicle location every three seconds, and an assessment of snow conditions every three to five minutes. The system used CDPD to transmit information.
Page 23
The primary benefit of this project is that it spawned interest in SEMSIM (see next section), which included Wayne County. The study found that there was a 3-4 percent reduction in “deadhead” miles (i.e. the distance where the vehicle is not actively treating the road) on freeway routes, with more improvement expected on non-freeway primary roads. The study also reported reduced salt consumption, reduced operational costs for snow removal, quicker response time, and reduced fatigue for dispatchers and drivers during peak operations.
SEMSIM (Anderson, 2004) The SEMSIM project was initiated in the spring of 1999, and an evaluation report was completed after the 2003-04 winter. SEMSIM's total cost, through September 2004, was nearly $8.2 million, which was required to equip nearly 400 vehicles with sensors and communications infrastructure. Three types of sensors are used: spread rate, blade position and temperature. The system cost included design, development, and installation of the equipment onto the vehicles. The scale of this project is significant not only for the number of equipped vehicles, but also because it integrates four transportation agencies.
Several improvements were made to the system during the course of the project, based on interim evaluations. These improvements included migrating the center software application to a Web-based application, adopting a mercury switch to detect plow position, upgrades in the in-vehicle unit, and modifications to the cabling and connections to improve environmental durability. The SEMSIM evaluation considered it early to expect observable cost benefits from the system, but maintenance supervisors were optimistic that the system would improve supervisor and material usage efficiency.
Howard County, Maryland (Howard County MD., 2005 and Java Location Services Newsletter 2003) In Howard County, Maryland, the Bureau of Highways implemented AVL on their snowplow fleet starting in 2000-01 to track and balance progress in three operational zones. The Bureau’s goals included being able to send a replacement truck to a specific area when a truck breaks down. Another goal of the Bureau was to be able to manage the maintenance of the roadways based on the time since the road was last maintained. Finally, the Bureau hoped to increase public trust through improved service. Howard County estimated they could recover the costs of the system in less than three years if it helped them reduce the number of trucks by one.
The Bureau of Highways considered the AVL system to be a success. They had several snow events over the winter that allowed them to track their snowplow operations. Managers were able to watch the location of plows and plowed routes from their office in real-time, allowing them to send plows to areas with greater snowfall and re-deploy snowplows if one becomes unusable. Call volume was decreased to the Bureau concerning road conditions due to real-time information that was made available to the public through a Web site. Another benefit was the ability of the 911 dispatchers to route emergency vehicles based on the information provided by the Web site. If there wasn’t a cleared route to the location of the emergency, the dispatcher could request that the nearest plow on the map be sent to clear a path for the emergency vehicle. It was not known, however, whether the Bureau was able to recoup the costs as they had expected.

Page 24
Vaughan, Ontario (Anthony, 2004) AVL was implemented in Vaughan’s winter maintenance operations in 2001-02 due to population growth and increasing complaints from residents and council members regarding the level of service on their streets. These complaints included missed streets, missed sidewalks, and poor timing of driveway clearance operations.
The installation of the system involved two power wires, two quick connectors for GPS and communications, and a magnetic mount antenna on top of the vehicle. Computerized salt spreaders were also connected to the system to relay the rate and location of salt application. Information is sent via wireless text messaging to a vendor-owned server. Equipment operations can be monitored on any computer connected to the Internet. Equipment can be tracked in real-time or past activities replayed in order to determine the location at any point in time. Vehicle summaries are also provided, including information on the amount of salt used and the distance covered by the vehicle.
The city found several benefits to this system, including accurate information on storm costs, an assessment of whether minimum maintenance standards mandated by the province and council have been met, and a reduction in paper timesheets and progress reports. Implementation of AVL resulted in a significant decrease in complaints, better coordination, better information for city council members and residents, and better management of in-house and contracted services.
Other Reports The SEMSIM evaluation report included capsule evaluations of several other AVL deployments, which were based on interviews with project managers of the implementing agencies; these provide some additional documentation of other agencies; experience with AVL (Anderson, E., 2004).
Iowa DOT Iowa DOT conducted a pilot test in 1998 on a limited number of its winter maintenance vehicles. Maintenance managers were using the system primarily for archived information, not real-time applications. While users were reportedly satisfied with the system and its information, funding was not available to continue the project and so the AVL units were removed from the vehicles. DOT management speculated that the cost of AVL could be justified only based on year-round use, not just for winter maintenance.
City of Baltimore The City of Baltimore installed AVL on its snowplow fleet in 2001. They report the system has been fairly reliable, but they have difficulty in compatibility between the radio system and the vendor’s software. At the time of publication of the SEMSIM report, the City was looking to upgrade the entire system because the vendor no longer supported that product. They were interested in migrating AVL to non-winter applications.
City of Waukesha (Wisconsin) The City of Waukesha (Wisconsin) ran a test deployment of AVL on six vehicles starting in March 2003. The system worked initially well, but server problems resulted in significant delays in polling updates. They removed the units in September 2003, and have no plans to expand AVL to other snowplows.
Future Enhancements Agencies that are using AVL are generally interested in increasing their use in the future. For pilot tests, this means expanding use of AVL throughout the winter maintenance vehicle fleet. For agencies with AVL in use on all of its winter-related vehicles, it means including other vehicles such as graders, street cleaners and patrol trucks.
Page 25
There is a long-term goal for standardization of interfaces, connections and protocols, removing proprietary hardware, firmware and codes, so that AVL brands can be readily exchanged. Some vendors have adopted open-architecture protocols that enable an agency to more readily develop customized code incorporating outputs from the AVL system, but this is not a universal practice. There is some potential through existing efforts like the Maintenance Decision Support System (MDSS) to develop some functional standards for AVL, although this will not address protocol or electromechanical standards. There is currently no organized standards movement within the community of transportation agencies using AVL for winter maintenance, so it may take some time for this goal to be realized.
Another potential future enhancement for agencies with long-term commitments to AVL (for example, SEMSIM and Alberta) is to have the AVL in-vehicle unit integrated within the vehicle dashboard and the receiver built into the vehicle. This would depend upon realization of the standards discussed previously.
In environments where wireless communications coverage is ubiquitous and latency is low, using two-way communication with AVL could have the potential to revolutionize winter maintenance operations. Under this concept, the AVL system would provide real-time information to a remote dispatcher, who makes decisions regarding appropriate pavement treatment activities, and then communicates these decisions back to the AVL in-vehicle unit. There also may be the possibility for the in-vehicle unit to control on-board equipment (for example, setting an application rate), making the driving task easier for the plow operator.
Summary of Findings AVL integrates vehicle location information with other information from the vehicle to provide temporally and spatially referenced information on a maintenance vehicle’s activities. AVL can assist in storm response through vehicle tracking and dispatching capabilities. It can also guide storm event planning by providing previous storm event histories. AVL can also help agencies simplify tracking and reporting requirements, thus decreasing the paperwork and time required to manage winter maintenance activities.
There is a rich repository of documented experience on lessons learned and best practices for use of AVL in winter maintenance operations. Some of the major themes include the need for thoughtful integration of AVL into an existing vehicle fleet and with the variety of expected users and sensor packages, and the need to consider the communications requirements of the various technologies.
Through several years of demonstration and evaluation, many of the problems which plagued earlier AVL deployments, such as sensor protection, communications availability, and GPS accuracy, have been addressed. The level of support from the vendor community has improved as AVL vendors have become flexible, adapting and customizing systems to fit specific customer requirements. Vendors also provide customized maps, statistical analysis, and reports as requested by the customer. AVL users generally plan to sustain or increase their use of the technology, and there are a number of transportation agencies performing AVL pilot projects to further the use of AVL in winter maintenance activities.

Page 26
CHAPTER FOUR: SURFACE TEMPERATURE MEASUREMENT DEVICES Maintenance personnel regard pavement temperature as essential information to better determine chemical application rates for winter maintenance. Moreover, pavement temperature is used to determine the timing of the application, since it “directly influences the formation, development, and breaking of a bond between fallen or compacted precipitation and the road surface as well as the effectiveness of chemical treatments” (FHWA, 1996). As such, the temperature of the road greatly dictates the quantity of chemicals needed to achieve the desired suppression level of the snow-ice mixture’s freezing point. Pavement temperature, however, is also greatly influenced by ambient temperature, sub-surface temperature, solar radiation, sky view factor (the fraction of the visible sky at the observed location), and local geographic features.
Pavement temperature measurement and forecasting is not included in standard national weather forecast services. Maintenance personnel and snow fighters, however, must make anti-icing and frost suppression decisions based on pavement temperature forecasts, which are determined using pavement surface temperature data they have collected (Knollhoff et al., 1998). In a national survey conducted in 2004, 75 percent of the survey respondents indicated that they collected pavement surface temperature data to support operational decisions (Oak Ridge National Laboratory, 2004). Pavement temperature measurement has a direct impact on road treatment strategy; hence, maintenance agencies should consider implementing pavement surface measuring devices to assist them in their operations.
This chapter will synthesize available literature and document the state-of-the-practice of vehicle-mounted surface temperature measurement devices. Key items to be discussed include: planning, operations and maintenance of these devices; an evaluation of their performance, user perception and acceptance, benefits and costs; and possible future enhancements.
Technology Summary Pavement surface temperature may be measured by using in-pavement sensors integrated with RWIS, non-contact infrared (IR) sensors installed on a fixed structure, or vehicle-mounted infrared (IR) sensors. When choosing between these types of measurement devices, it is important to consider their ability to map temperature variation throughout road networks. For example, within a road network, nighttime pavement temperature can vary significantly. Such a variation in pavement temperature means that, on a particular night, some stretches of the road may fall well below the freezing point while others may remain well above the freezing point (Shao et al., 1996). To determine the variation in pavement temperature, it would be practically infeasible to have a dense network of in-pavement sensors. Hence, vehicle-mounted infrared sensors are commonly used to allow continuous monitoring of pavement temperature and its trend.
Non-contact IR sensors have been widely used in vehicle-mounted pavement temperature measurement devices to quantify the amount of radiation emitted by the road surface, thereby providing an indirect measure of surface temperature. IR-based pavement surface temperature measurement devices typically consist of an IR sensor, a processor and a display unit. The entire sensor assembly can be mounted on the maintenance vehicle to allow continuous and rapid monitoring of pavement temperature. Surface PatrolTM manufactured by Control Products, Inc. (Vancouver, WA) and RoadWatchTM manufactured by Sprague Devices (Michigan, IN) are the two most commonly used in-vehicle pavement temperature measurement devices (Scott et al., 2005). In each of these devices, an infrared detector absorbs the infrared emissions from the road

Page 27
surface and then converts it into an electrical signal. The electrical signal is processed and displayed on a digital temperature readout mounted in the vehicle. Both the Control Products sensor and Sprague Devices sensor have a response time of 1/10th of a second, facilitating continuous measurement of pavement temperature.
Emissivity is a measure of a surface’s ability to emit thermal radiation that is dependent on the type of material and its surface texture. IR sensors manufactured by both Control Products and Sprague Devices assume uniform emissivity for different types of road surfaces and road conditions. However, depending upon the road material (concrete/asphalt) and road surface condition (dry, wet, snow, ice etc), emissivity would change. Therefore, the assumption of uniform emissivity may not always yield accurate measurements (Harling et al., 2001). A field evaluation study conducted by Tabler found that the difference in emissivities does not affect the measurement of Control Product and Sprague Devices sensors (Tabler, 2003). A laboratory and field study sponsored by the Aurora Consortium conducted an emissivity check test on various pavements and led to similar results, and additional testing was suggested in order to make formal conclusions about the effects of emissivity on the accuracy of mobile sensors (Scott et al., 2005).
IR sensors are also affected by factors such as nearby heat sources (exhausts, engines, buildings, etc). In general, IR detectors are arranged to read the IR temperature wavelength associated with concrete and asphalt to avoid erroneous readings inadvertently received through IR emissions of other nearby heat sources (Rendon, 1995). Under dense foggy conditions, the sensor may measure the temperature of the water molecules in the fog. To overcome this, the sensor mounting height can be adjusted so that it is closer to the road surface and has a better chance of measuring the road surface temperature.
Planning As with most vehicle-based sensor technologies for winter maintenance, several factors
should be considered when selecting an appropriate vehicle-mounted surface temperature measurement device, including ease of operations and maintenance; capital and maintenance costs; ability to integrate with an AVL platform; accuracy, reliability and repeatability; sensor response time; and calibration requirements.
Most of the survey respondents indicated that they began to use vehicle-mounted IR pavement temperature sensors between 1996 and 2002. Four of the eight survey respondents who use vehicle-mounted sensors stated that they use the RoadWatchTM system because it is more affordable. One common issue among the survey respondents was the need to periodically calibrate the sensors. It has been reported that the Surface PatrolTM system can be field-calibrated using ice whereas RoadWatchTM must be sent to the manufacturer for calibration (Tabler, 2003).
Installing the infrared sensor assembly is relatively simple, requiring only slight modifications to the maintenance vehicle (Figure 8 and Figure 9). One of the survey respondents indicated that the typical installation time was approximately two hours. Additionally, pavement temperature measurement devices are quite simple to use and require very little training or experience to install or operate.
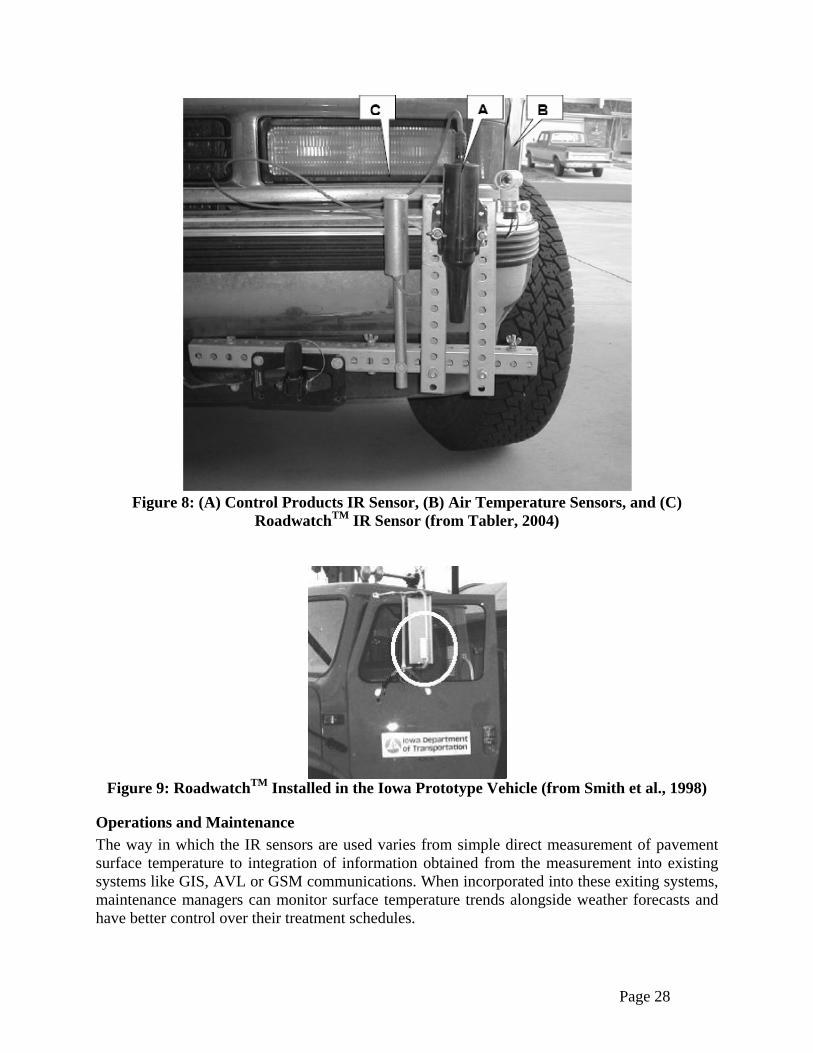
Page 28
Figure 8: (A) Control Products IR Sensor, (B) Air Temperature Sensors, and (C)
RoadwatchTM IR Sensor (from Tabler, 2004)
Figure 9: RoadwatchTM Installed in the Iowa Prototype Vehicle (from Smith et al., 1998)
Operations and Maintenance The way in which the IR sensors are used varies from simple direct measurement of pavement surface temperature to integration of information obtained from the measurement into existing systems like GIS, AVL or GSM communications. When incorporated into these exiting systems, maintenance managers can monitor surface temperature trends alongside weather forecasts and have better control over their treatment schedules.
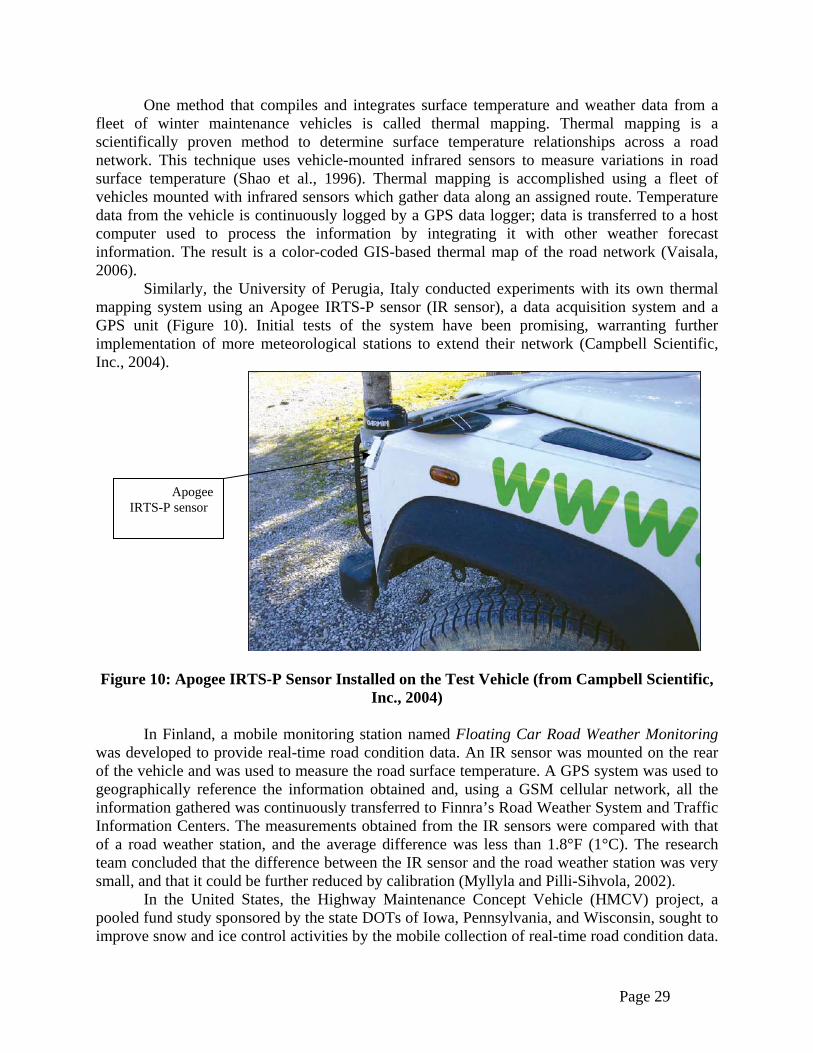
Page 29
One method that compiles and integrates surface temperature and weather data from a fleet of winter maintenance vehicles is called thermal mapping. Thermal mapping is a scientifically proven method to determine surface temperature relationships across a road network. This technique uses vehicle-mounted infrared sensors to measure variations in road surface temperature (Shao et al., 1996). Thermal mapping is accomplished using a fleet of vehicles mounted with infrared sensors which gather data along an assigned route. Temperature data from the vehicle is continuously logged by a GPS data logger; data is transferred to a host computer used to process the information by integrating it with other weather forecast information. The result is a color-coded GIS-based thermal map of the road network (Vaisala, 2006).
Similarly, the University of Perugia, Italy conducted experiments with its own thermal mapping system using an Apogee IRTS-P sensor (IR sensor), a data acquisition system and a GPS unit (Figure 10). Initial tests of the system have been promising, warranting further implementation of more meteorological stations to extend their network (Campbell Scientific, Inc., 2004).
Figure 10: Apogee IRTS-P Sensor Installed on the Test Vehicle (from Campbell Scientific,
Inc., 2004) In Finland, a mobile monitoring station named Floating Car Road Weather Monitoring
was developed to provide real-time road condition data. An IR sensor was mounted on the rear of the vehicle and was used to measure the road surface temperature. A GPS system was used to geographically reference the information obtained and, using a GSM cellular network, all the information gathered was continuously transferred to Finnra’s Road Weather System and Traffic Information Centers. The measurements obtained from the IR sensors were compared with that of a road weather station, and the average difference was less than 1.8°F (1°C). The research team concluded that the difference between the IR sensor and the road weather station was very small, and that it could be further reduced by calibration (Myllyla and Pilli-Sihvola, 2002).
In the United States, the Highway Maintenance Concept Vehicle (HMCV) project, a pooled fund study sponsored by the state DOTs of Iowa, Pennsylvania, and Wisconsin, sought to improve snow and ice control activities by the mobile collection of real-time road condition data.
Apogee IRTS-P sensor
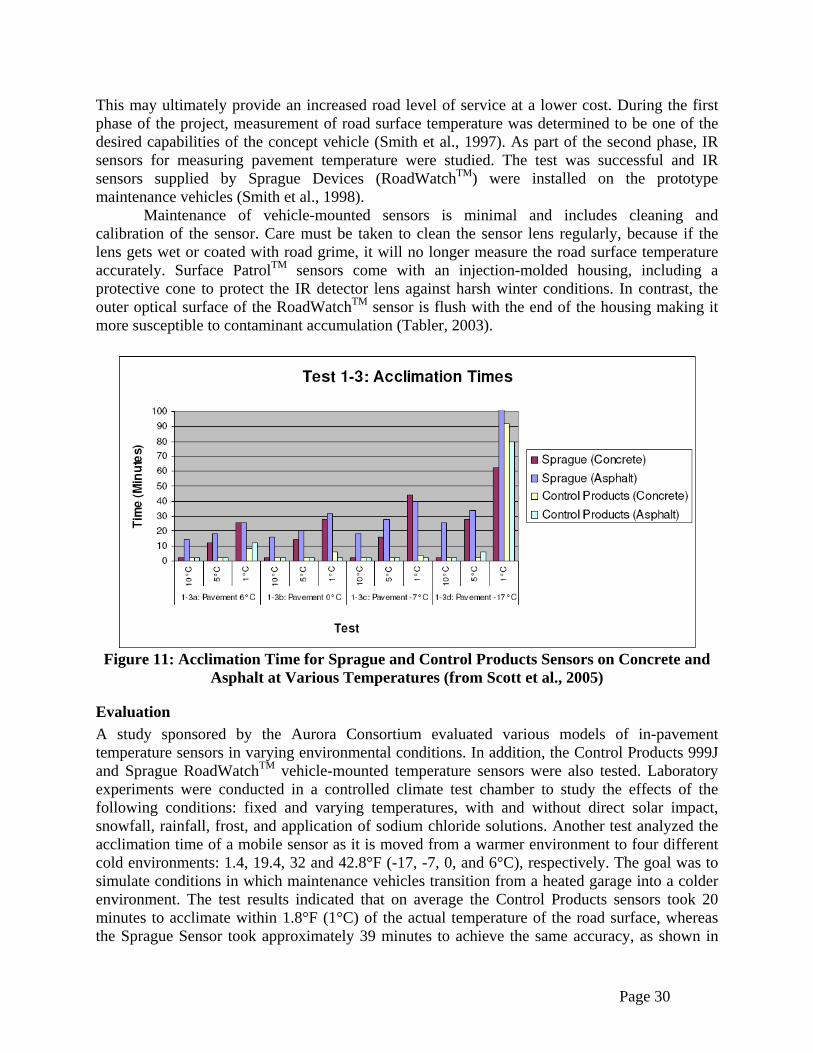
Page 30
This may ultimately provide an increased road level of service at a lower cost. During the first phase of the project, measurement of road surface temperature was determined to be one of the desired capabilities of the concept vehicle (Smith et al., 1997). As part of the second phase, IR sensors for measuring pavement temperature were studied. The test was successful and IR sensors supplied by Sprague Devices (RoadWatchTM) were installed on the prototype maintenance vehicles (Smith et al., 1998).
Maintenance of vehicle-mounted sensors is minimal and includes cleaning and calibration of the sensor. Care must be taken to clean the sensor lens regularly, because if the lens gets wet or coated with road grime, it will no longer measure the road surface temperature accurately. Surface PatrolTM sensors come with an injection-molded housing, including a protective cone to protect the IR detector lens against harsh winter conditions. In contrast, the outer optical surface of the RoadWatchTM sensor is flush with the end of the housing making it more susceptible to contaminant accumulation (Tabler, 2003).
Figure 11: Acclimation Time for Sprague and Control Products Sensors on Concrete and
Asphalt at Various Temperatures (from Scott et al., 2005)
Evaluation A study sponsored by the Aurora Consortium evaluated various models of in-pavement temperature sensors in varying environmental conditions. In addition, the Control Products 999J and Sprague RoadWatchTM vehicle-mounted temperature sensors were also tested. Laboratory experiments were conducted in a controlled climate test chamber to study the effects of the following conditions: fixed and varying temperatures, with and without direct solar impact, snowfall, rainfall, frost, and application of sodium chloride solutions. Another test analyzed the acclimation time of a mobile sensor as it is moved from a warmer environment to four different cold environments: 1.4, 19.4, 32 and 42.8°F (-17, -7, 0, and 6°C), respectively. The goal was to simulate conditions in which maintenance vehicles transition from a heated garage into a colder environment. The test results indicated that on average the Control Products sensors took 20 minutes to acclimate within 1.8°F (1°C) of the actual temperature of the road surface, whereas the Sprague Sensor took approximately 39 minutes to achieve the same accuracy, as shown in
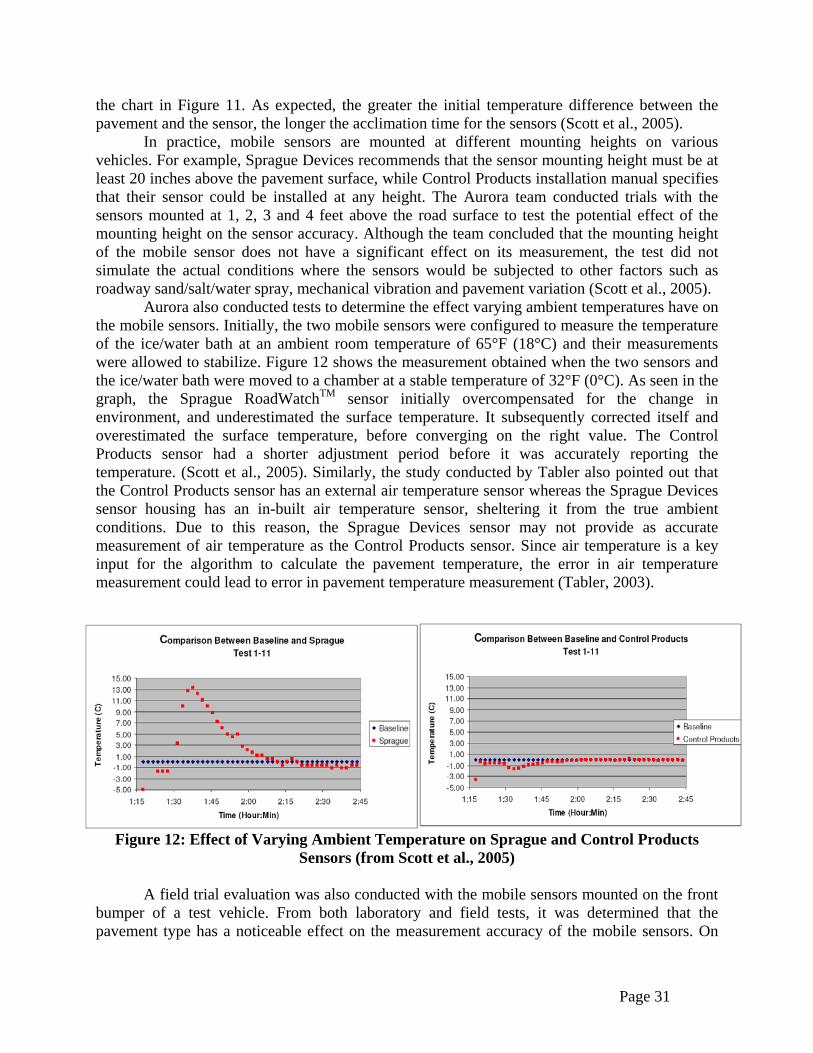
Page 31
the chart in Figure 11. As expected, the greater the initial temperature difference between the pavement and the sensor, the longer the acclimation time for the sensors (Scott et al., 2005).
In practice, mobile sensors are mounted at different mounting heights on various vehicles. For example, Sprague Devices recommends that the sensor mounting height must be at least 20 inches above the pavement surface, while Control Products installation manual specifies that their sensor could be installed at any height. The Aurora team conducted trials with the sensors mounted at 1, 2, 3 and 4 feet above the road surface to test the potential effect of the mounting height on the sensor accuracy. Although the team concluded that the mounting height of the mobile sensor does not have a significant effect on its measurement, the test did not simulate the actual conditions where the sensors would be subjected to other factors such as roadway sand/salt/water spray, mechanical vibration and pavement variation (Scott et al., 2005).
Aurora also conducted tests to determine the effect varying ambient temperatures have on the mobile sensors. Initially, the two mobile sensors were configured to measure the temperature of the ice/water bath at an ambient room temperature of 65°F (18°C) and their measurements were allowed to stabilize. Figure 12 shows the measurement obtained when the two sensors and the ice/water bath were moved to a chamber at a stable temperature of 32°F (0°C). As seen in the graph, the Sprague RoadWatchTM sensor initially overcompensated for the change in environment, and underestimated the surface temperature. It subsequently corrected itself and overestimated the surface temperature, before converging on the right value. The Control Products sensor had a shorter adjustment period before it was accurately reporting the temperature. (Scott et al., 2005). Similarly, the study conducted by Tabler also pointed out that the Control Products sensor has an external air temperature sensor whereas the Sprague Devices sensor housing has an in-built air temperature sensor, sheltering it from the true ambient conditions. Due to this reason, the Sprague Devices sensor may not provide as accurate measurement of air temperature as the Control Products sensor. Since air temperature is a key input for the algorithm to calculate the pavement temperature, the error in air temperature measurement could lead to error in pavement temperature measurement (Tabler, 2003).
Figure 12: Effect of Varying Ambient Temperature on Sprague and Control Products Sensors (from Scott et al., 2005)
A field trial evaluation was also conducted with the mobile sensors mounted on the front
bumper of a test vehicle. From both laboratory and field tests, it was determined that the pavement type has a noticeable effect on the measurement accuracy of the mobile sensors. On
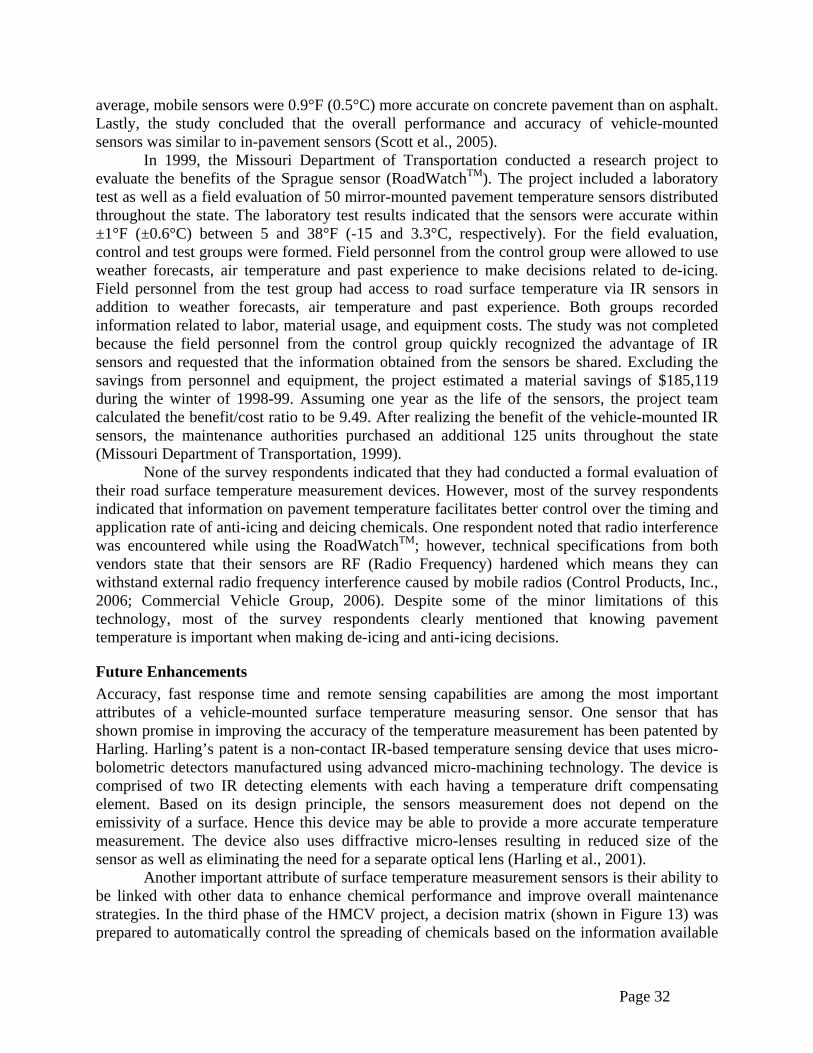
Page 32
average, mobile sensors were 0.9°F (0.5°C) more accurate on concrete pavement than on asphalt. Lastly, the study concluded that the overall performance and accuracy of vehicle-mounted sensors was similar to in-pavement sensors (Scott et al., 2005).
In 1999, the Missouri Department of Transportation conducted a research project to evaluate the benefits of the Sprague sensor (RoadWatchTM). The project included a laboratory test as well as a field evaluation of 50 mirror-mounted pavement temperature sensors distributed throughout the state. The laboratory test results indicated that the sensors were accurate within ±1°F (±0.6°C) between 5 and 38°F (-15 and 3.3°C, respectively). For the field evaluation, control and test groups were formed. Field personnel from the control group were allowed to use weather forecasts, air temperature and past experience to make decisions related to de-icing. Field personnel from the test group had access to road surface temperature via IR sensors in addition to weather forecasts, air temperature and past experience. Both groups recorded information related to labor, material usage, and equipment costs. The study was not completed because the field personnel from the control group quickly recognized the advantage of IR sensors and requested that the information obtained from the sensors be shared. Excluding the savings from personnel and equipment, the project estimated a material savings of $185,119 during the winter of 1998-99. Assuming one year as the life of the sensors, the project team calculated the benefit/cost ratio to be 9.49. After realizing the benefit of the vehicle-mounted IR sensors, the maintenance authorities purchased an additional 125 units throughout the state (Missouri Department of Transportation, 1999).
None of the survey respondents indicated that they had conducted a formal evaluation of their road surface temperature measurement devices. However, most of the survey respondents indicated that information on pavement temperature facilitates better control over the timing and application rate of anti-icing and deicing chemicals. One respondent noted that radio interference was encountered while using the RoadWatchTM; however, technical specifications from both vendors state that their sensors are RF (Radio Frequency) hardened which means they can withstand external radio frequency interference caused by mobile radios (Control Products, Inc., 2006; Commercial Vehicle Group, 2006). Despite some of the minor limitations of this technology, most of the survey respondents clearly mentioned that knowing pavement temperature is important when making de-icing and anti-icing decisions.
Future Enhancements Accuracy, fast response time and remote sensing capabilities are among the most important attributes of a vehicle-mounted surface temperature measuring sensor. One sensor that has shown promise in improving the accuracy of the temperature measurement has been patented by Harling. Harling’s patent is a non-contact IR-based temperature sensing device that uses micro-bolometric detectors manufactured using advanced micro-machining technology. The device is comprised of two IR detecting elements with each having a temperature drift compensating element. Based on its design principle, the sensors measurement does not depend on the emissivity of a surface. Hence this device may be able to provide a more accurate temperature measurement. The device also uses diffractive micro-lenses resulting in reduced size of the sensor as well as eliminating the need for a separate optical lens (Harling et al., 2001).
Another important attribute of surface temperature measurement sensors is their ability to be linked with other data to enhance chemical performance and improve overall maintenance strategies. In the third phase of the HMCV project, a decision matrix (shown in Figure 13) was prepared to automatically control the spreading of chemicals based on the information available
Page 33
(McCall et al., 2001). This prompted the fourth phase of the HMCV project that investigated the feasibility of integrating location data (GPS/AVL), on-board sensor devices, and friction measurements with an automatic material spreader system. It was also mentioned that a rule-based algorithm using the FHWA Manual of Practice for Snow and Ice Control guidelines will be coded into an application capable of controlling the material distribution (Andrle et al., 2002).
Figure 13: Decision Matrix for Snow and Ice Control (from McCall et al., 2001)
Summary of Findings Maintenance authorities rely on information about road surface temperature in addition to other available information such as RWIS, weather forecasts, and other mobile sensor data to make road treatment decisions. As a widely-deployed technology, vehicle-mounted IR sensors act as an additional decision support tool enabling real-time decisions for winter road treatment, thus potentially increasing the level of service and reducing material usage – both of which ultimately save money without sacrificing traveler safety.
The advantages of using IR sensors mounted on a vehicle for measuring pavement temperature are as follows:
• ease of installation, operation and maintenance; • fast response time (1/10th of a second); • generally accurate and reliable measurement, as proved by laboratory and field
evaluations; and • low cost relative to expected benefit. Two principal vendors of road surface temperature sensors were identified: Sprague
Systems and Control Products. While both use infrared technology, there are differences in the system design that affect system performance. Studies indicate that the Control Products sensor is technically superior, while the Sprague Systems RoadWatchTM product is more affordable.
Transportation agencies seem to be generally satisfied by these sensors and plan to continue their use in the future. Future enhancements in the technology may improve how quickly it responds to changing conditions, as well as how it may successfully be integrated into an AVL platform.

Page 34
CHAPTER FIVE: ON-BOARD FREEZING POINT AND ICE-PRESENCE DETECTION SENSORS The presence of ice, snow, water, or other substances affects the traction between a vehicle’s tires and the road surface and results in potentially hazardous driving conditions. Freezing point and ice-presence detection sensors determine the presence of ice or moisture on the road surface generally through collecting the mixture of precipitation and chemicals on the roadway and then measuring its freezing point temperature. Freezing point temperature can be defined as the temperature at which a particular solution freezes. A national survey conducted in 2004 evaluating the use of ITS devices used for winter maintenance indicated that about 60 percent of the survey respondents collected freezing point temperature information and about 81 percent of the survey respondents collected information on pavement conditions (i.e., wet, dry, icy, snow-covered, flooded) to support operational decisions (Oak Ridge National Laboratory, 2004).
Predicting when and at what temperature the moisture or substances on the road surface will freeze helps maintenance personnel determine the timing, type and extent of surface treatment required. Moreover, information on the road surface condition provides increased knowledge on the effects of deicing and anti-icing chemicals. This information can also be used to automatically trigger dynamic message signs warning motorists about potentially hazardous driving conditions.
Freezing point measurement and ice-presence detection may be conducted through passive in-pavement sensors, active in-pavement sensors, or vehicle-mounted active sensors. Passive in-pavement sensors determine the freezing point temperature indirectly by measuring the chemical concentration (salinity) of the road surface. Alternatively, active sensors, whether in-pavement or vehicle-mounted, directly measure the actual freezing point of the mixture on the road surface rather than deriving it from other measured data (e.g., salinity). This allows the freezing point to be determined regardless of what types of chemicals or pollutants are present.
The primary vendors of in-pavement active freezing point sensors are Aerotech Telub (Ostersund, Sweden), Boschung Mecatronic (Granges Paccot, Switzerland), and Quixote Transportation Technologies (St. Louis, Missouri). The sensors produced by these vendors all contain a Peltier cell that automatically cools and warms the collected liquid in a cyclic pattern. The freezing point is determined from measuring the heat energy released when the substance freezes or changes from a liquid to a solid (Aerotech Telub, 2006).
One major drawback of any in-pavement sensor, whether passive or active, is that it measures local conditions only. It is likely that the surface condition along a particular stretch of roadway will vary considerably. Consequently, some localized hazardous ice patches may be overlooked or undetected. Vehicle-mounted freezing point and ice-presence detection sensors may offer a cost-effective solution for agencies to overcome the practical infeasibility of having a dense network of in-pavement sensors. However, information regarding available technologies related to vehicle-mounted freezing point and ice-presence detection sensors is very limited since most of the technologies are currently under development.
Technology Summary One promising and relatively well-developed active vehicle-mounted sensor technology used to measure freezing point and detect ice presence is Frensor, developed by Aerotech Telub along with the Swedish National Road Administration. The sensors are mounted behind the vehicle’s wheels where the tire spray is collected and then isolated by closing the system with a pneumatic

Page 35
bladder. Similar to the in-pavement active sensors, the vehicle-mounted sensors contain a Peltier cell and the freezing point temperature is determined through a series of cyclic warming and cooling cycles of the moisture sample. The time it takes to complete a measurement cycle varies with respect to the pavement condition (i.e., dry, wet, or snow/ice covered). The measurement results are reported as follows:
• “Freezing point temperature - If the amount of liquid is sufficient to allow determination of freezing point temperature”
• “Moist – If a freezing point is detected and the amount of liquid is insufficient to allow the determination of freezing point temperature”
• “Dry – No freezing point is detected” (Aerotech Telub, 2006). After determining the freezing point of the sample, the test sample is removed using
pressurized air, and a new sample is collected. A computer program is used to log the data, present the data to the operator, and transmit the data (Aerotech Telub, 2006).
Several other conceptual designs for ice-presence detection sensors are still under development. These ideas include measuring the infrared backscatter of radiation emitted by an onboard light source from the road surface (Joshi, 2002), using optical spatial filters to distinguish between varying road conditions (Yoda et al., 1998), measuring the near infrared reflectance due to absorption (Misener, 1998), and using visual images to determine the road surface condition (Reed and Barbour, 1997).
Figure 14: Sensor Mounted on CRREL Instrumented Research Vehicle (from Joshi, 2002)
Joshi of Physical Sciences Inc. (PSI) (Andover, MA) developed a compact, lightweight
prototype of a vehicle-mounted sensor system for detecting and monitoring winter road conditions (see Figure 14). The sensor technology is based on measuring infrared backscatter of radiation emitted by an onboard light source from the road surface. Using a micro-processor, the signals are processed in real-time and provide the vehicle operator with a user-friendly informative map. Laboratory evaluations and field trials of the prototype were performed at the Cold Regions Research and Engineering Laboratory (CRREL) in Hanover, New Hampshire. This included calibrating the sensor for films and layers of water, ice, dry and wet snow, sand and other various mixtures over asphalt surfaces. CRREL also mounted the prototype sensor on their instrumented research vehicle and conducted field tests under varying road surface conditions. Additionally, PSI conducted their own winter field trials in 2001 with the Massachusetts Highway Department and the Colorado Department of Transportation. The data from all the tests demonstrated the ability of the prototype device to characterize and

Page 36
discriminate varying layers of ice and snow as well as black ice conditions in near-freezing weather. It was also reported that the system has become more affordable and practical as the technology has advanced (Joshi, 2002). Surface Systems Inc. (St. Louis, MO) evaluated the prototype sensor system in their laboratory as a candidate system for commercial winter maintenance vehicles. They concluded further testing would be required before the sensor could be commercialized and became usable by the transportation agencies (Joshi, 2002).
Researchers from the OMRON Corporation of Japan proposed an alternative road surface recognition method. The proposed method utilizes optical spatial filters to distinguish between road surface conditions such as dry versus wet asphalt, and fresh versus trampled (packed) snow as well as black ice on the asphalt. The sensor would be small enough to eventually be mounted on road maintenance vehicles. From their initial work, the researchers have claimed achieving a success rate greater than 90 percent in recognizing the road surface condition (Yoda et al., 1998).
Another proposed technique is called Polarized Reflectance Infrared Signature Method (PRISM). This technique uses absorption differences in measured near infrared reflectance (NIR) between ice, water and dry road to determine the pavement condition. It was envisioned that one application of the technology could include mounting a camera-like sensor on maintenance vehicles to discriminate between icy and non-icy roadway sections (Misener, 1998).
Finally, Reed of the Nichols Research Corporation (Arlington, VA) built a Remote Passive Road Ice Sensor System (RPRISS), which is a remote, non-contact, passive infrared imaging system that detects the presence of ice and snow on roadways. It provides visual images of the road condition with ice/snow shown in red. RPRISS has the ability to detect very thin layers of ice, including black ice. A fixed roadway monitoring system was developed and successfully tested in the laboratory followed by limited field evaluations. The evaluation also indicated that RPRISS could be implemented as a mobile environmental sensor (Reed and Barbour, 1997).
Planning It is advantageous for maintenance agencies to record the freezing point temperature and be alerted to changing road surface conditions. For example, most of the survey respondents mentioned that the information on freezing point temperature improves their decision-making process related to the type, amount and timing of chemical applications. However, commercial vehicle-based technologies that allow agencies to perform these tasks over an entire roadway network are limited. The survey responses generally suggest that vehicle-mounted freezing point and ice-presence detection technologies are still in the development stage. While most of the survey respondents started using freezing point and ice-presence detection technologies between 1997 and 2002, the technologies were limited to in-pavement sensors.
Even though the in-pavement and vehicle-mounted sensors try to capture the same information, they do so via different means and work within different constraints. With limited demonstration experience of the vehicle-mounted freezing point and ice-presence detection sensors to date, it is not fully understood what additional training or background knowledge will be necessary for successful implementation of such sensors. Nonetheless, as with most vehicle-based sensor technologies for winter maintenance, several factors should be considered when selecting an appropriate vehicle-mounted freezing point and ice detection sensor, including ease of operations and maintenance; capital and maintenance costs; ability to integrate with an AVL platform; accuracy, reliability and repeatability; sensor response time; and calibration requirements.
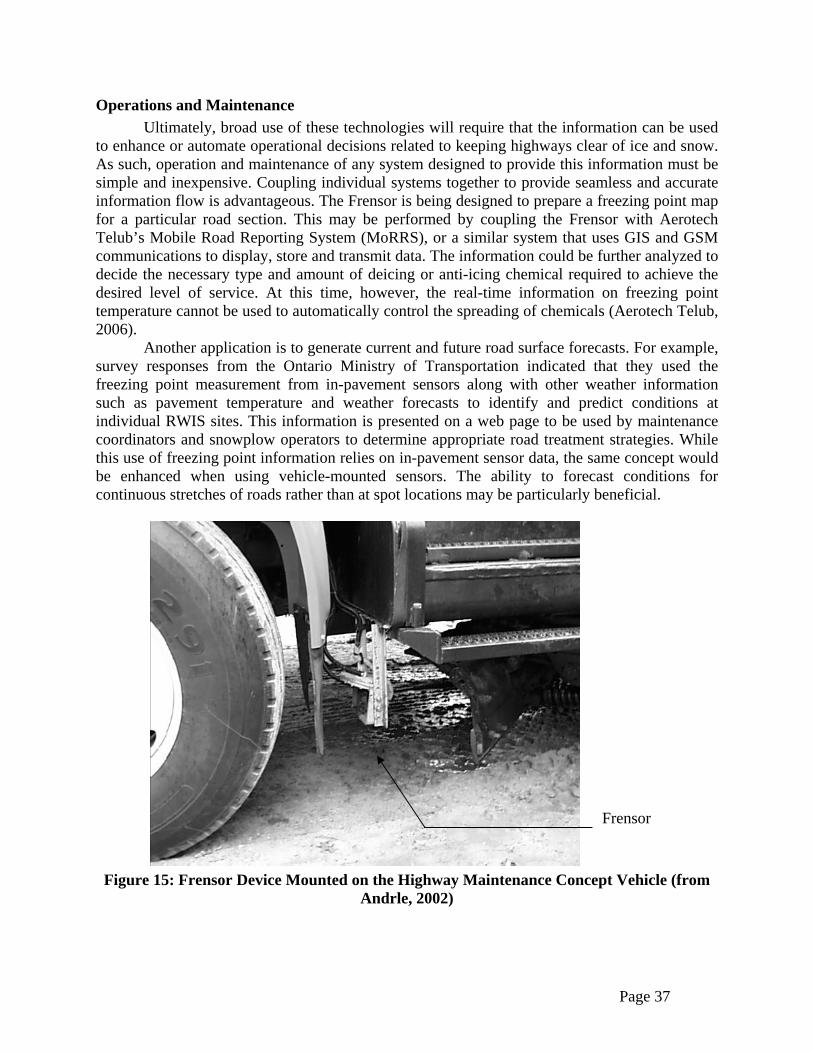
Page 37
Operations and Maintenance Ultimately, broad use of these technologies will require that the information can be used
to enhance or automate operational decisions related to keeping highways clear of ice and snow. As such, operation and maintenance of any system designed to provide this information must be simple and inexpensive. Coupling individual systems together to provide seamless and accurate information flow is advantageous. The Frensor is being designed to prepare a freezing point map for a particular road section. This may be performed by coupling the Frensor with Aerotech Telub’s Mobile Road Reporting System (MoRRS), or a similar system that uses GIS and GSM communications to display, store and transmit data. The information could be further analyzed to decide the necessary type and amount of deicing or anti-icing chemical required to achieve the desired level of service. At this time, however, the real-time information on freezing point temperature cannot be used to automatically control the spreading of chemicals (Aerotech Telub, 2006).
Another application is to generate current and future road surface forecasts. For example, survey responses from the Ontario Ministry of Transportation indicated that they used the freezing point measurement from in-pavement sensors along with other weather information such as pavement temperature and weather forecasts to identify and predict conditions at individual RWIS sites. This information is presented on a web page to be used by maintenance coordinators and snowplow operators to determine appropriate road treatment strategies. While this use of freezing point information relies on in-pavement sensor data, the same concept would be enhanced when using vehicle-mounted sensors. The ability to forecast conditions for continuous stretches of roads rather than at spot locations may be particularly beneficial.
Figure 15: Frensor Device Mounted on the Highway Maintenance Concept Vehicle (from Andrle, 2002)
Frensor
Page 38
Maintenance of freezing point and ice-presence detection sensors is anticipated to be minimal, mainly entailing occasional calibration as well as cleaning sensor heads. The Frensor unit is designed to spray air over the sensor heads after each data collection as a means of flushing the system; however, under certain conditions, this air stream is not enough to maintain a clean sensing surface. For example, during field evaluations of the Frensor unit installed on the Highway Maintenance Concept Vehicle (HMCV), the sensor heads became coated with ice and debris and it became necessary to manually clean (Andrle et al., 2002).
Evaluation In 2001, Aerotech Telub donated a Frensor unit to the HMCV, which was installed as part of the mobile data collection platform (see Figure 15). During the fourth phase of the HMCV project (which included the Frensor technology), various bench tests and field trials were conducted and the following conclusions were made:
• The sensor performance was reasonable, and it has the potential for continuation on the HMCV project.
• During data collection, the sensor was caked with ice and debris which had to be manually cleaned.
• Any unusual change in the measurement cycle time indicates that the sensor needs to be cleaned.
Based on these evaluations, the following observations were made: • To improve the monitoring process, a more efficient method of cleaning the sensor is
required. • The entire system needs a computer to collect and store the data, so there is a need for
an electronic interface for automatic monitoring. The greatest concern with the Frensor unit was the need to manually clean the sensor
heads during field use; therefore, it was determined that an automatic cleaning device, which can also alert the operator of a dirty sensor, was needed. The whole system was not tested for repeated accuracy, but based on the test results the system was considered generally reliable (Andrle, 2002).
Future Enhancements This section presents emerging technologies for on-board road condition detection, many of which are patented. Griesinger patented a process and an apparatus to determine the road condition using spectral distribution of light backscattered from the road surface. Analyzing the spectral components of this light may help detect the presence of water and ice/snow on a surface (Griesinger, 2000). Tran patented a device for mobile road condition detection, which uses a digital camera, temperature sensor, and an ultrasonic sensor. The sensors provide image data, air and road temperature, and roughness data. The data obtained are filtered for easier processing and then compared with the reference data to generate a road condition report. The comparison between filter data and reference data yields the road condition classification such as dry, snow, ice or water, and also the road surface classification such as concrete, asphalt, sand or gravel (Tran, 2004).
Another patented technology is a surface condition sensing and treatment system, which includes an Electromagnetic Radiation (EMR) transmitter used to determine one or more characteristics of a road surface such as friction, ice or snow, and freezing point temperature as well as depth, density and composition of the road surface material. The system also comprises a

Page 39
GIS, material spreader control system and a temperature sensor. The system features manual or automatic material spreader control by using the information obtained from the sensing devices and weather forecasts. The system may be controlled both remotely and locally, and the data may be transmitted, received and processed. The researcher indicated that the entire system may also have a vehicle-mounted application (Doherty et al., 2005).
Konrad (2005) patented a road surface conditions sensing device, which includes an electrical element capable of generating an alternating electric field. The system utilizes the principle that during the phase transition from ice to water, the dielectric properties change. The interactions of the electric field with the road surface result in changes to the electrical properties of the electrical element. The researcher also indicated that the use of a capacitor as an electrical element could provide information on temperature of the ice. To prevent water splash from affecting the system, the system could be coated with hydrophobic materials (Konrad, 2005).
In addition, researchers at Aerotech Telub and Dalarna University developed an acoustic non-contact pavement sensor. The developed system uses image data obtained from a stationary image sensor and a microphone that measures the sound from a passing vehicle to classify the road condition into one of the four classes: dry, wet, icy, or snowy (McFall and Niittula, 2000). In addition, Aerotech Telub is involved in the development of a Mobile Acoustic Road Condition Sensor (MoARCS), of which no information is readily available (Aerotech Telub, 2006).
Summary of Findings In the continuing effort to optimize winter maintenance activities, maintenance personnel rely on detailed information on road and weather conditions. The potential advantages of using vehicle-mounted freezing point and ice-presence detection sensors include the ability to map road surface conditions along an entire roadway network and detect localized ice patches, and increased knowledge of the effects of deicing and anti-icing chemicals on the road surface. However, based on the extensive literature search and survey responses, vehicle-mounted freezing point and ice-presence detection technologies are not as well-established as some of the other vehicle-mounted sensor technologies (e.g., surface temperature sensors) and have not been widely deployed for field use. Although Frensor was successfully installed and tested in HMCV, the project team identified a few issues related to its maintenance needs. In summary, vehicle-mounted freezing point and ice-presence detection sensors are promising alternatives to current methods of monitoring road conditions, and with further development the full benefit of this technology may be realized.
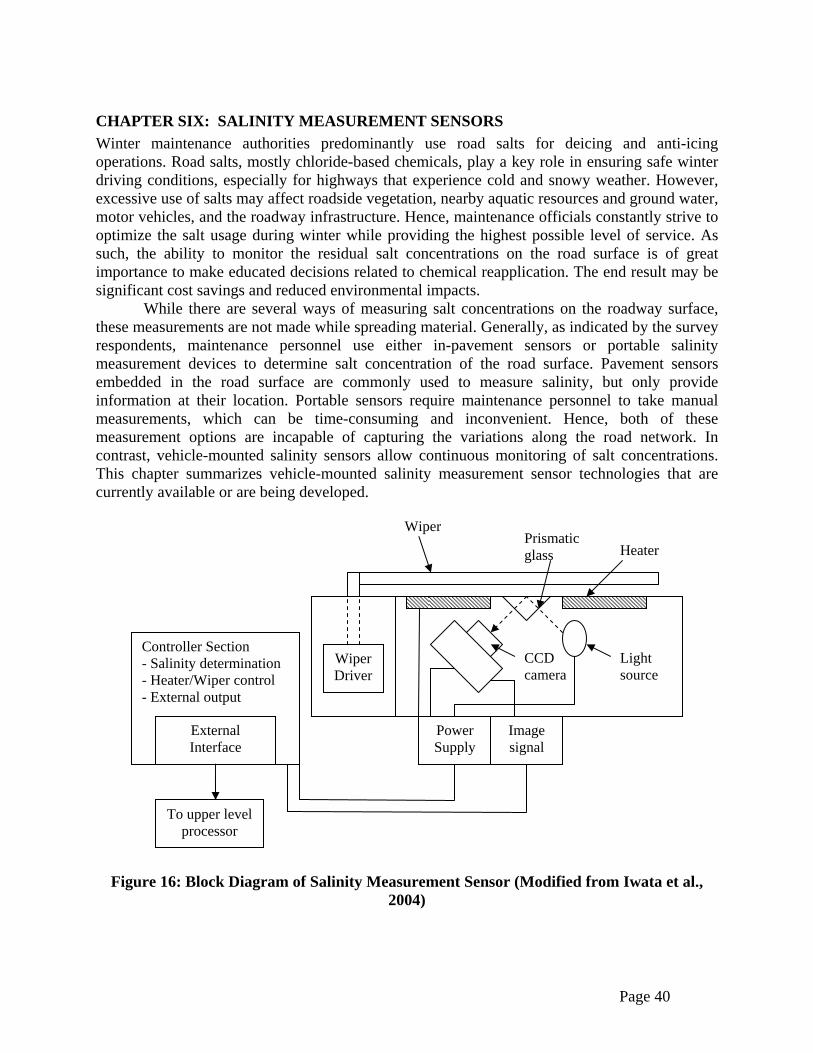
Page 40
CHAPTER SIX: SALINITY MEASUREMENT SENSORS Winter maintenance authorities predominantly use road salts for deicing and anti-icing operations. Road salts, mostly chloride-based chemicals, play a key role in ensuring safe winter driving conditions, especially for highways that experience cold and snowy weather. However, excessive use of salts may affect roadside vegetation, nearby aquatic resources and ground water, motor vehicles, and the roadway infrastructure. Hence, maintenance officials constantly strive to optimize the salt usage during winter while providing the highest possible level of service. As such, the ability to monitor the residual salt concentrations on the road surface is of great importance to make educated decisions related to chemical reapplication. The end result may be significant cost savings and reduced environmental impacts.
While there are several ways of measuring salt concentrations on the roadway surface, these measurements are not made while spreading material. Generally, as indicated by the survey respondents, maintenance personnel use either in-pavement sensors or portable salinity measurement devices to determine salt concentration of the road surface. Pavement sensors embedded in the road surface are commonly used to measure salinity, but only provide information at their location. Portable sensors require maintenance personnel to take manual measurements, which can be time-consuming and inconvenient. Hence, both of these measurement options are incapable of capturing the variations along the road network. In contrast, vehicle-mounted salinity sensors allow continuous monitoring of salt concentrations. This chapter summarizes vehicle-mounted salinity measurement sensor technologies that are currently available or are being developed.
Figure 16: Block Diagram of Salinity Measurement Sensor (Modified from Iwata et al.,
2004)
Controller Section - Salinity determination - Heater/Wiper control - External output
Image signal
Power Supply
Wiper Driver
External Interface
To upper level processor
Light source
Wiper Prismatic glass
CCD camera
Heater

Page 41
Technology Summary Researchers at the Japan Highway Public Corporation (JHPC) developed a vehicle-mounted sensor to continuously measure the salinity of road surfaces. The sensor operates by measuring the refractive index of an aqueous solution atop of the road surface. The refractive index varies proportionally to the change in its salt concentration. The refractive index of the water solution is also affected by air temperature, but the researchers used an air temperature sensor to account for these effects (Iwata et al., 2004). The vehicle-mounted salinity measurement system primarily consists of a salinity sensor and an on-board controller. The salinity sensor has been designed to receive and analyze road splash from the revolving tires. As shown in Figure 16, the salinity sensor uses a near infrared Light Emitting Diode (LED) as the light source and a Charge-Couple Device (CCD) used as a light receiving element. The CCD camera sends an image signal to the on-board controller for signal processing in order to estimate the salinity of the solution. The measurement accuracy of the sensor may be affected by the accumulation of snow, mud or residual salt content on the sensor’s detection surface. To overcome this, Itawa et al. (2004) equipped the sensor with a wiper and a heater to prevent the accumulation of snow, mud or residual salt content on the sensor’s detection surface and to prevent the sensor from freezing, respectively.
In 1999, researchers from the University of Connecticut also initiated a project to develop a portable salinity measurement device. Similar to the approach adopted by the Japanese researchers, the project team used tire splash to measure the residual salt concentration of the road surface. However, instead of using the optical refractive index measurement method, this project team used a heater to melt the tire splash to determine its electrical conductivity. Due to their simplicity and ruggedness, conductivity probes were used to measure salt concentrations. In the first phase of the project, a prototype device was designed and developed, and, in 2000, the team conducted field trials. Initial testing proved the system’s ability to determine the variation in salt concentration of the road surface. However, the large retention volume of the collector assembly caused a sampling problem that resulted in mixing of influent mixture with the retained fluid. This mixing adversely affected the accuracy and sensitivity of the measurement. The team also discovered that to reduce the measurement delay the influent must be brought in contact with the measurement probe immediately. Moreover, field tests also showed that the heating arrangement that used low DC energy was insufficient to melt all the slush collected from the tire spray. The second phase of the project aimed to address the technical shortcomings identified. As such, the collector box was redesigned and the retention volume was decreased (see Figure 17 and Figure 18). Changes in design and the vertical installation of conductivity probe outside the collector assembly were to ensure continuous contact between the tire splash and the sensor. Additionally, an adjustable cover was attached to front of the collection box to manually control the volume of inflow. Modifications were made to optimize the melting speed of the snow so that the sensor could measure at a quasi-instantaneous rate (Garrick et al., 2002).
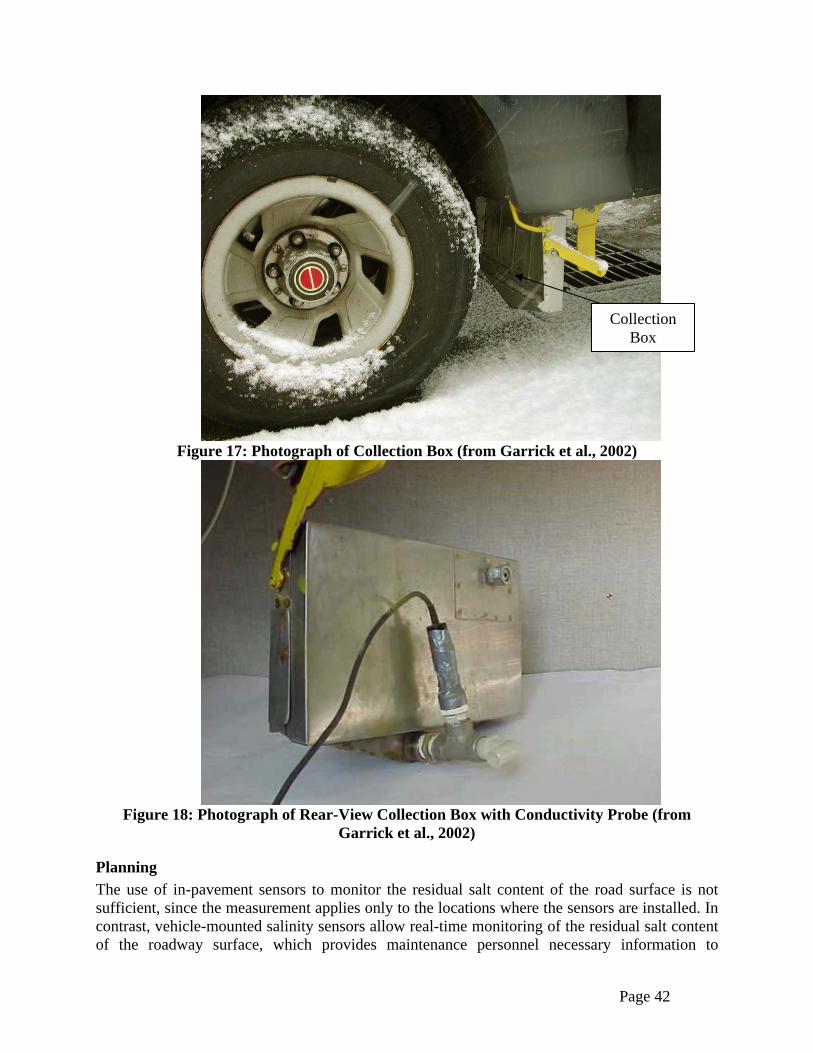
Page 42
Figure 17: Photograph of Collection Box (from Garrick et al., 2002)
Figure 18: Photograph of Rear-View Collection Box with Conductivity Probe (from
Garrick et al., 2002)
Planning The use of in-pavement sensors to monitor the residual salt content of the road surface is not sufficient, since the measurement applies only to the locations where the sensors are installed. In contrast, vehicle-mounted salinity sensors allow real-time monitoring of the residual salt content of the roadway surface, which provides maintenance personnel necessary information to
Collection Box
Collection Box
Collection Box

Page 43
instantaneously control the salt application rate. Such information would allow greater precision over the amount of salt applied to the roadway, resulting in the cost savings and reducing the associated corrosion and environmental impacts. However, currently there are very few choices for vehicle-mounted sensor technologies in measuring real-time salinity of the road surface.
As with most vehicle-based sensor technologies for winter maintenance, several factors should be considered when selecting an appropriate vehicle-mounted salinity measurement sensor, including ease of operations and maintenance; capital and maintenance costs; ability to integrate with an AVL platform; accuracy, reliability and repeatability; sensor response time; and calibration requirements.
Operations and Maintenance With the recent developments in technologies, it is possible to couple the vehicle-mounted salinity sensor with other technologies such as AVL, RWIS, and weather forecasts to transmit and analyze real-time salinity data. The sensor developed by JHPC has the ability to monitor residual salt content of a dry roadway surface. When the sensor determines that the roadway is dry, a water-spraying unit is activated. This particular characteristic would be highly beneficial to anti-icing operations in which the anti-icing chemicals are applied before the winter storm events. The researchers proposed a system configuration (see Figure 19) for controlling the amount of chemical to be applied through using measurements obtained from salinity and road surface temperature sensors. With the road surface recognition sensor also functioning as a speedometer, information on vehicle speed could be used by both the chemical spreading unit and water spraying unit to precisely control their application rate (Iwata et al., 2004).
Figure 19: Block Diagram of Chemical Spraying Control System (from Iwata et al., 2004)
Because the vehicle-mounted salinity measurement system developed by the University
of Connecticut uses a catch basin to collect aqueous samples, it can become inundated with particulate such as road grime or sand. This system currently has no automatic means to prevent accumulation of such substances. Even though the accumulation of sand does not necessarily affect the conductivity measurement, it may prevent the incoming tire splash from entering the collecting chamber. Hence, the system needs to be cleaned on a regular basis, which may be impractical (Garrick et al., 2002).
Since neither system has had an extended period of field usage, it is unclear what the long-term maintenance requirements will be.

Page 44
Evaluation JHPC conducted their own evaluation to determine how well their system accurately measured salinity. The researchers installed the sensor on two vehicles: a pre-wetted salt spreader and a patrol car. Salinity measurements from the veicle-mounted salinity sensors were compared to values collected using a handheld salinometer. The average measurement error between the salinometer and the newly developed sensor was 0.73 percent, and the results of 70 percent or more of the measurements were within an error of ±1 percent. There was no major difference between the measurements collected from the patrol car and the salt spreader. The newly developed salinity measurement sensor was thus considered suitable for widespread deployment. As part of the performance verification testing, field trials were conducted to measure the salinity of the roadway before and after anti-icing chemicals were applied. The team used the pre-wetted salt spreader to measure the initial salinity of the roadway and then spread the anti-icing chemical from the rear of the pre-wetter salt spreader unit. While the spreader vehicle spread the anti-icing chemical, the patrol car ran about 0.6 mile (1 km) behind the spreader vehicle and measured the salinity of the roadway. As expected, the sensor on the patrol car was able to detect an increase in salinity. The team also observed that the spreader vehicle was able to obtain better and consistent measurements than the patrol vehicle because of its size and bigger tires. Alternative protocols may be required when measuring the salinity of dry roadways, since a certain amount of time is necessary to allow the residual salt content of the road surface to melt after spraying the water.
The University of Connecticut conducted field tests during two winter storms in 2001 under controlled conditions on an unused roadway section within the university campus to evaluate the overall performance of the new sensor. The first field test was conducted on a 0.25 mile (0.4 km) section of the roadway using a constant salt application (sand-to-salt ratio of 5:1) over the entire length of the test section, to field evaluate the overall performance of the new sensor. The test was conducted using four runs lasting 63 seconds each. To ensure similar influent conditions, the collection box was flushed before starting each run. The results from several trial runs indicated that the temperature of the heater must be at least 200°C to prevent snow clogging. Therefore, 225°C was selected as the maximum heater temperature. During a different storm, a second field test was conducted on two contiguous 0.25 mile (0.4 km) long road sections. This time, two different salt concentrations (sand to salt ratio of 5:1 and 10:1) were used on two different sections of the roadway, to evaluate the performance of the system under real-world conditions in which the salt concentration may vary from point to point. The test results demonstrated the ability of the measurement system to differentiate salt concentrations; however, the readings made by the device were not instantaneous. Two main factors were identified as contributing to this delay: the time needed for the influent to completely cover the detector and the need to have the fluid constantly mixed. The first delay was significantly reduced by modifying the collector assembly design. To address the mixing delay, the project team proposed an analytical approach to predict the concentration of the influent from the measured concentration value. A multiple compartment model was used to fit the field data for modeling the mixing effect and a procedure was developed for estimating the influent concentration based on the measured concentration of the fluid in the collecting chamber. Based on the field test results, the team identified the following three ways in which the whole system can be further optimized:
• Use a more compact conductivity probe to minimize the mixing effect

Page 45
• Use a gate controller to control the opening of the collection box automatically to control the influent flow rate
• Use a mass outflow controller to the match the mass outflow rate with the inflow rate, thus preventing overflow or drainage when the inflow rate is higher or lower than the outflow rate, respectively. (Garrick et al., 2002)
Future Enhancements Owing to the limited availability of technologies in vehicle-mounted salinity measurement sensors, there is the potential to adapt technologies used in other fields. In agriculture, for example, salinity is an important indicator of the soil quality and several technologies have been developed for soil salinity measurement. However, most of the technologies are either costly or not rugged enough for mobile salinity measurement of the road surface. One particular technology is the Electro-Magentic Induction (EMI) sensors, which are often used in practice to estimate field-scale soil salinity patterns by measuring the soil’s electrical conductivity (Spies and Woodgate, 2005). An EM wave is generated in a loop transmitter at the soil surface, which in turn creates secondary currents within the soil profile and enhances the primary EM signal received by a surface-based detector. The receiver signal is interpreted as a measure of the mean or apparent electrical conductivity of the material through which the primary EM wave has passed. Further research would be needed to evaluate whether this or similar technology could be adopted for vehicle-based salinity measurement of the road surface.
Summary of Findings To better optimize winter maintenance operations, specifically deicing and anti-icing applications, maintenance personnel desire real-time salinity measurements of the road surface. If maintenance vehicle can measure the actual concentration of roadway salinity while applying salts, the application rate could be adjusted to avoid under-application or over-application. Therefore, using vehicle-mounted salinity sensors may result in improved level of service and cost-effectiveness for winter maintenance and reduce the corrosion and environmental impacts associated with excessive salt usage.
Two alternative approaches have been demonstrated for this application: using optical properties and measuring electrical conductivity (Garrick et al., 2002; Iwata et al., 2004). Both of these have shown some promise in continuously measuring the salinity of the road surface. However, neither has been used over extended field tests, so it is unclear whether the potential benefits observed in the pilot tests will be replicable on a larger scale.
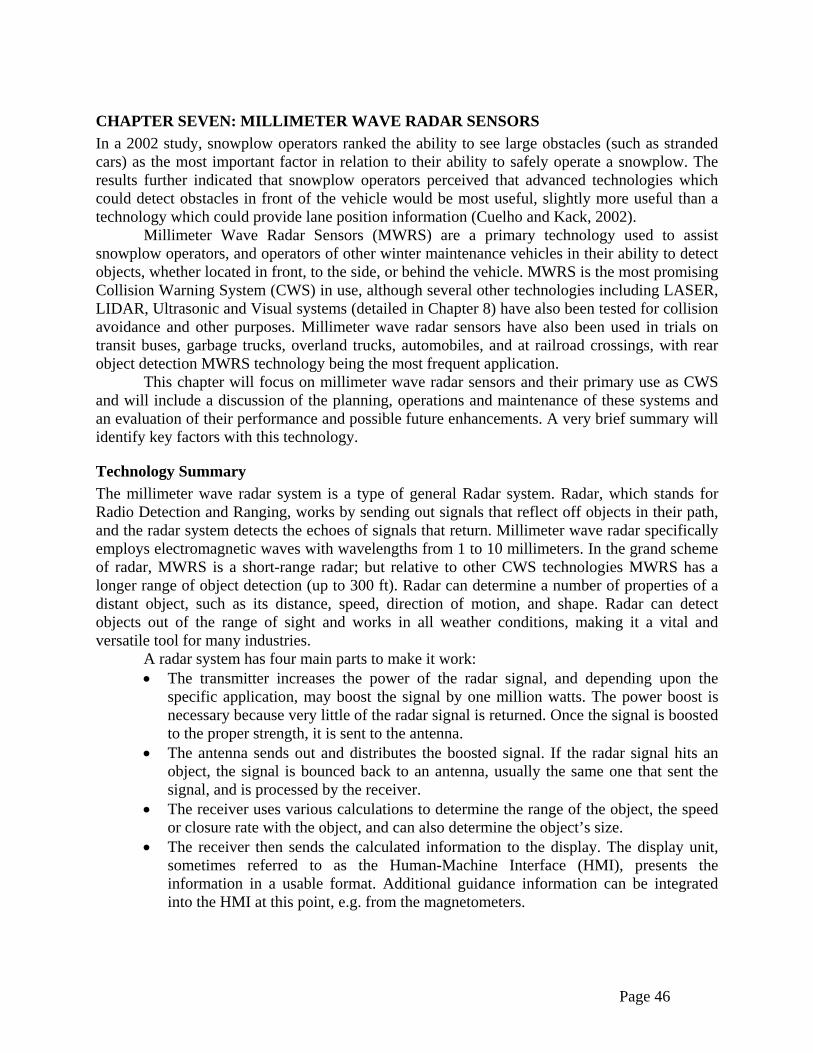
Page 46
CHAPTER SEVEN: MILLIMETER WAVE RADAR SENSORS In a 2002 study, snowplow operators ranked the ability to see large obstacles (such as stranded cars) as the most important factor in relation to their ability to safely operate a snowplow. The results further indicated that snowplow operators perceived that advanced technologies which could detect obstacles in front of the vehicle would be most useful, slightly more useful than a technology which could provide lane position information (Cuelho and Kack, 2002).
Millimeter Wave Radar Sensors (MWRS) are a primary technology used to assist snowplow operators, and operators of other winter maintenance vehicles in their ability to detect objects, whether located in front, to the side, or behind the vehicle. MWRS is the most promising Collision Warning System (CWS) in use, although several other technologies including LASER, LIDAR, Ultrasonic and Visual systems (detailed in Chapter 8) have also been tested for collision avoidance and other purposes. Millimeter wave radar sensors have also been used in trials on transit buses, garbage trucks, overland trucks, automobiles, and at railroad crossings, with rear object detection MWRS technology being the most frequent application.
This chapter will focus on millimeter wave radar sensors and their primary use as CWS and will include a discussion of the planning, operations and maintenance of these systems and an evaluation of their performance and possible future enhancements. A very brief summary will identify key factors with this technology.
Technology Summary The millimeter wave radar system is a type of general Radar system. Radar, which stands for Radio Detection and Ranging, works by sending out signals that reflect off objects in their path, and the radar system detects the echoes of signals that return. Millimeter wave radar specifically employs electromagnetic waves with wavelengths from 1 to 10 millimeters. In the grand scheme of radar, MWRS is a short-range radar; but relative to other CWS technologies MWRS has a longer range of object detection (up to 300 ft). Radar can determine a number of properties of a distant object, such as its distance, speed, direction of motion, and shape. Radar can detect objects out of the range of sight and works in all weather conditions, making it a vital and versatile tool for many industries.
A radar system has four main parts to make it work: • The transmitter increases the power of the radar signal, and depending upon the
specific application, may boost the signal by one million watts. The power boost is necessary because very little of the radar signal is returned. Once the signal is boosted to the proper strength, it is sent to the antenna.
• The antenna sends out and distributes the boosted signal. If the radar signal hits an object, the signal is bounced back to an antenna, usually the same one that sent the signal, and is processed by the receiver.
• The receiver uses various calculations to determine the range of the object, the speed or closure rate with the object, and can also determine the object’s size.
• The receiver then sends the calculated information to the display. The display unit, sometimes referred to as the Human-Machine Interface (HMI), presents the information in a usable format. Additional guidance information can be integrated into the HMI at this point, e.g. from the magnetometers.

Page 47
These various components are integrated and utilized in winter maintenance vehicles for the purposes of collision warning and avoidance on the roadway, as discussed in the following sections.
Two main initiatives have tested the use of millimeter wave radar systems as collision warning technology in winter maintenance vehicles: the RoadView™ system and the Guidestar program. This section will discuss each of these initiatives.
RoadView™ The Advanced Highway Maintenance and Construction Technology Research Center (AHMCT) has conducted several studies on Advance Snow Plow (ASP) systems, and created its own trademarked system known as RoadView™. Roadview™ (Figure 20) includes a collision avoidance feature that utilizes millimeter wave radar that allows for operations during fog, rain, and falling snow (Ravani et al., 2002).
Figure 20: RoadView Technologies (Photo courtesy of Ravani et al., 2002)
The Eaton® (Cleveland, OH) VORAD® EVT-300 utilized by RoadView™ is a radar
system that is capable of delivering range, rate, and azimuth angle data from multiple targets (Eaton, 2006). The radar system of RoadView™ also incorporates an encoder which provides information on the steering wheel position, so that the system can minimize the number of false alarms on curved sections of the highway by calculating the turning rate of the host vehicle. The EVT-300 Collision Warning System (CWS) has an internal temperature sensor to compensate for frequency deviation, thus optimizing performance at a wide range of climates. The temperature range of the EVT-300 system is -40 to 185ºF (-40 to 85ºC) and therefore may not be usable in harsh winter conditions (Eaton, 2006).
The radar system updates every 65 milliseconds in order to accommodate the most abrupt change in traffic flow, and uses a built-in test system to detect and report any faults every 15 seconds. The testing conducted by AHMCT indicated that the MWRS was sufficiently accurate to 330 ft (100 m) in the front and rear of the vehicle for collision detection and warning (Ravani et al., 2002). This is similar to results from Japan, where a similar radar system provided sensing

Page 48
out to 360 ft (110 meters) (Kajiya et al., 1996). The lateral MWRS and HMI interface is versatile enough to accommodate roads ranging from a two-lane rural road to a three-lane highway (Ravani et al., 1999).
The RoadView™ CWS is able to detect obstacles in the left, center and right lanes of a three-lane highway. The information is displayed to the driver as shown in Figure 21. In Figure 21, the left hand side of the display shows distance to the perceived obstacles as the colored tape bands; yellow 300-160 ft (100-50 m), orange 160-80 ft (50-25 m) and red less than 80 ft (25 m).
Figure 21: RoadView Human Machine Interface Display (Photo courtesy of Ravani et al.,
2002)
Guidestar Guidestar is the Minnesota Department of Transportation’s (Mn/DOT) Intelligent Transportation Systems (ITS) program, which also includes Intelligent Vehicle Initiatives (IVI). One project within Guidestar that is relevant to this chapter is the use of Mn/DOT’s Advanced Snow Plow collision avoidance system developed by Altra Technologies, Inc. (ATI). ATI’s CWS consisted of four major components:
• A forward collision warning system • A secondary forward collision warning system mode focused on mail boxes, guard
rails, signs, and stalled vehicles that may be off to the side of the road but are likely to be in the path of a deployed wing plow.
• A rear collision warning system to alert drivers of vehicles approaching the rear of the snowplow. The rear object detection system does not warn the snowplow driver; it simply flashes an external strobe light when it detects a car approaching too quickly and too closely from behind.

Page 49
• A side object detection system that consists of two radar sensors on each side of the plow, one on each side of the front fender and one in each rear corner. The side CWS provides an audible warning to the driver only when the directional signal is turned on and if an obstacle is within ten feet of the side of the truck.
There is an audible tone and visual display for the side object detection system and both primary and secondary modes of the forward collision warning system (Booz-Allen and Hamilton, 2000).
Planning The respondents to the survey on MWRS noted the two main reasons for employing the technology were to warn operators of approaching vehicles and to aid operations during heavy snow conditions.
MWRS is a technology that performed adequately according to operators and managers. Many issues were able to be resolved during trials and through modifications of the technology (Booz-Allen and Hamilton, 2000).
Participants in the RoadView™ and Guidestar studies noted the initial amount of training time for the operators ranged from adequate to not adequate, and additional training time was negotiated in one instance. Respondents of the survey conducted for this report noted the operators needed adequate time to become acquainted with the technology, ranging from days to months.
Also in the survey, two of the three respondents suggested that if they could do anything differently, additional planning between the snowplow operators and managers would be beneficial. Additionally, working with the technology, prior to use in the field, could potentially better identify how the technology would benefit the operation.
Operations and Maintenance The respondents to the survey on MWRS noted that their primary reason for testing the technology was to provide snowplow (or other winter maintenance vehicle) operators the ability to receive a warning of obstacles (vehicles) in front of them, as well as vehicles approaching from the rear. With additional radar units installed, such as in the Guidestar project, vehicle operators can also be warned of objects to the sides of the winter-maintenance vehicle. These results coincide with the results from the 2002 study of snowplow operators, which indicated that the most important factor related to safe snowplow operation was the ability to “see” large obstacles. It was also determined that these operators perceived technology that would help detect obstacles in front of their vehicles as very useful (Cuelho and Kack, 2002). Respondents did indicate, however, that their respective states have not deployed the MWRS systems on a large scale, and most systems were still in the testing/development stage. While Departments of Transportation in the United States may be in the initial stages of using MWRS, the Eaton website noted several large deployments of its VORAD system (Eaton, 2006).
Important issues involved with any technology include the operations and maintenance of the technology and its systems. Several questions were asked in the survey in order to determine the time and effort involved with operating and maintaining MWRS. The respondents indicated that operations and maintenance issues required little time and money. Comments indicated that, once aiming the system was completed, little maintenance attention was required, except cleaning the radar antennas and making sure there was no damage to the antennas or system wiring.

Page 50
Two of the three survey respondents indicated that the forward and side MWRS technology would not be continued due to lack of funding and/or support. However the respondents noted rear MWRS (i.e. Backspotter) technology would very likely be continued and expanded to use on other vehicles due to clear effectiveness in preventing operators from backing into stationary objects, such as guardrails, poles, and signs.
In the Guidestar study it was determined that the MWRS technology could not penetrate snow drifts to detect objects within the drifts, such as cars, nor could it detect plastic and fiberglass objects, such as road signs and mail boxes (Booz-Allen and Hamilton, 2000). In addition, some operators became frustrated with the false readings that occurred while going around curves, over dips, bridges, and past large signs. Modifications were made in the Guidestar study that allowed the operators to turn off the HMI at these locations to reduce operator frustration, while survey respondents noted some operators adapted to expect false readings at these locations. As previously mentioned the RoadView™ technology takes into account the turning rate of the host vehicle from the steering wheel position, so that the system can minimize the number of false alarms on curved sections of the highway.
The survey conducted for this report also asked how much experience operators and managers needed for them to effectively use the MWRS. Using a scale of “1” being “no training/novice” and a “10” being “expert” the average score of the three respondents was 5.6 for operators (scores of 8, 5 and 4) and 6.3 for managers (scores of 8, 6 and 5). Comments related to the score for operators included the fact that trust had to be developed in the system over time, and that operators had to become familiar with how the information was presented to them. Comments relating to the scores for managers indicated that managers need experience to understand how the system can realistically improve operations and safety; and how this could impact budgets/costs.
The survey respondents noted that the MWRS technology was most useful in snow and ice operations and in whiteout conditions, but suggested the potential for use in other weather situations. According to respondents, the MWRS technology performs well in most weather, with the exception of heavy falling wet snow which causes additional false readings. Study findings suggest that operators maintain better road position during road clearing for a greater percentage of the time when using the HMI display than when not using it and are able to clear roads in white out conditions previously not allowed due to lack of visibility (Ravani et al., 2000).
The HMI display was originally mounted on the dashboard of the snowplow. After operators noted this configuration limited driver visibility, the HMI display was mounted in the location of the rear view mirror. Operators found the new HMI location to be user-friendly.
Further information on the operations and maintenance of millimeter wave radar systems can be found in evaluations of the RoadView (Ravani et al., 2002) and Guidestar (Booz-Allen and Hamilton, 2000) systems.
Evaluation Multiple research projects have been conducted on MWRS technology. A study by Cuelho and Kack (2002) evaluated the RoadView™ system design to determine the challenges faced by the snowplow operators while using the technology, focusing on use in low visibility conditions. The study assessment included a cost/benefit analysis of the system and identified needs and variables associated with the technology with respect to safety, mobility, and operation; and utilized a survey of operators. The study focus areas were Idaho, Montana, North Dakota and
Page 51
Wyoming and found that lane position was determined visually and “operators have a high perceived usefulness of technology that would assist in detecting obstacles and provide lane position information.” The cost/benefit analysis results indicate Roadview™ to be most cost-effective in areas with high traffic and inclement weather conditions.
A field test and analysis of the Roadview™ system was performed by Ravani et al. (2002) and was performed in cooperation with PATH and WTI. The Roadview™ system was tested on three snowplows over the winters of 2000-02 in California and Arizona. This study provides detailed descriptions of the HMI, magnetic sensing system, and CWS, and includes a discussion of improvements made as determined by previous research projects. Study results were positive in terms of user interface with the technology and showed an increased level of comfort with the technology over a shorter amount of time as compared with previous studies. Significant data was collected on false warning triggers, and methods to reduce false warnings may be the result of this. The study found the CWS system was correct 73% of the time, an improvement over past studies, with anecdotal operator comments suggesting the HMI display could be used as an aid to the operator or as the primary visual source.
A report in 2000 provided results of the Mn/DOT’s Guidestar Advanced Snow Plow demonstration. The study was designed to summarize the general progress, identify potential benefits, and clarify potential steps to be taken for technology implementation. The winter 1999-2000, of this Phase II study, proved to be mild and resulted in significantly less data collection than was anticipated. The technology was demonstrated to be technologically feasible with user acceptance of the CWS technologies. Recommendations were made for further enhancements in the system including additional operational experience for benefits and costs analysis, and a possible need for future lab testing. Continued road testing, including data collection and operator feedback, was suggested due to the mild winter.
The Phase II and III studies from Arizona Department of Transportation (ADOT), performed by Owen (2003 and 2004), provide an evaluation of advanced snowplow technologies, including millimeter wave radar applications. Phase II (2001-02) employed 3M (St. Paul, MN) magnetic striping tape, Lane Awareness System and tested the snowplow operator-assistance system as compared with the Caltrans lane guidance systems. The comparative testing of the Caltrans and ADOT 3M assisted system was limited by no snowfall in the field area during the time the Caltrans RoadViewTM plow was in Arizona. In the few storms that were experienced, the ADOT-3M plow operated effectively. The lack of weather provided few opportunities to document any advantages for either system. After four winters of field tests, it was determined that the technology cost was prohibitive for ADOT. As a result, Phase III (2002-03) focused on commercial on-board warning systems.
The Phase III (2002-03) research area was expanded to the I-40 Corridor in Arizona and utilized seven snowplows with collision warning radar or passive infrared night vision, which were implemented at a lower cost than the Phase II system Results for the warning radar were positive overall, with a few comments that the ice buildup in storms made the night vision system difficult to use. Both of these systems were judged to be effective and operationally successful, with certain limitations. Field deployment was to be continued for the 2003-04 winter season, with minor adjustments.
From the survey conducted to gain information on millimeter wave radar sensors for this report, three respondents provided a brief evaluation of MWRS. Their comments indicated that the operators of winter maintenance vehicles with MWRS had the ability to “see” obstacles that they would have not been able to detect without MWRS under low visibility conditions. While

Page 52
all respondents indicated that MWRS was beneficial in low visibility (winter) situations, one indicated that more research may prove the system to be valuable in good/fair visibility conditions. Respondents were also allowed to comment on any problems or issues their agency had with MWRS, and were able to provide information relative to how their agency may do things differently, knowing what they know now. The main issue noted by the respondents was the frequency of false warnings of obstacles from the MWRS. The false warnings can be a problem as vehicle operators may over time not pay attention to any of the warnings, or may simply turn off the system. Respondents indicated that more testing or development time could reduce the number of false warnings.
This theme was also noted by the responses on what the agencies would do differently. While one respondent indicated that they would do nothing differently, the other two respondents indicated that their agencies would take more time in planning and development, making sure they knew which problems they were trying to solve, and spending time to make sure the technology was working as well as possible, before having the operators use the systems. The respondents also provided information on additional (or “formal”) evaluations of the technologies.
Survey respondents estimated a range in initial cost of $1,500-4,000 per unit installed, with additional operation and maintenance costs ranging from minor to $2,500, listing cleaning and protection for antennae and wiring as maintenance needs. The rear MWRS, Backspotter, technology was noted as initially costing $750, with an additional $150 for shop installation fees. No comments on cost associated with the maintenance of the rear MWRS technology were provided.
Future Enhancements Due to either budget issues or technical issues with the millimeter wave radar system such as false alarms, all respondents indicated that their agencies are not moving forward with widespread implementation of the technology. A study of the overall cost to benefit ratio for RoadView™ yielded only one DOT with benefits outweighing costs. This should be considered a conservative estimate, with the potential for cost-effectiveness to improve in areas with high traffic volume, areas with high probability of road closures, or in areas that experience a high volume of snowplow-related accidents (Cuelho and Kack, 2002). Given that both agency personnel and snowplow operators perceive the technology as useful, it is likely that once millimeter wave radar systems mature, they may be implemented in a more widespread fashion.
The California Department of Transportation continues to use the handful of snowplows that have the RoadView™ system; however, no refinement of the technologies is occurring at this time. Based on past research, it is likely, however, that millimeter wave radar systems will be the primary technology used for obstacle detection and collision avoidance purposes, based on its ability to “see through” heavy fog, rain and snow. One respondent indicated that they had tried infrared cameras on snowplows for obstacle detection (collision warnings), but that the test was not successful due to snow and ice buildups on the windshields and other components of the system.
Recent patent publications show improvement on the weight and cost of MWRS in attempts to make this technology available as a “black box” for general use in automotive transport. In addition to this, patent publications show development of technologies that integrate MWRS collision avoidance systems and blindspot monitoring systems into automobiles. Additional research that may advance MWRS technology has been conducted in Antarctica,
Page 53
where MWRS technology was used in robotic sensors for obstacle avoidance and navigation (Foessel et al., 1999). Testing in the extreme climate of Antarctica may allow for potential future advances in extending the temperature use range of the technology, and may aid in developing a methods for clarifying object images resulting in fewer false warnings.
Beyond their collision avoidance capabilities, MWRS systems have the resolution to detect relatively small objects, including surface contour changes that might indicate pavement damage or snow/ice buildup. This capability might make MWRS useful in applications other than collision warning, such as in road condition evaluation systems.
Summary of Findings Research has shown that millimeter wave radar systems provide longer range (300 ft) obstacle detection capabilities that are superior in winter conditions to other technologies such as Ultrasonic, LASER and LIDAR discussed in Chapter 8. Millimeter wave radar systems have been shown to be able to detect obstacles in-front of, to the side of, and behind winter maintenance vehicles.
The most prevalent issue limiting widespread use of MWRS systems is the high frequency of false alarms, which may reduce the operator’s confidence in the system. It is important to note that the false alarms are triggered in curves, tight vehicle turns, or by heavy and wet snowfall and are not random false readings by the system itself.
Millimeter wave radar systems continue to be refined, reducing the weight, size and cost of the product so that it may be more cost-effective for use in overland trucking, transit, and automobiles.
Survey results show that rear millimeter wave radar sensors are viewed as more beneficial than front and side MWRS; this may reflect the reduced operator interface, lower cost, or cost savings from reduced rear-end collisions.

Page 54
CHAPTER EIGHT: VISUAL AND MULTI-SPECTRAL SENSORS Sensors that utilize electromagnetic energy at various wavelengths, especially in the infrared and visible wavelength spectrum, are common in advanced transportation applications. A wide range of systems have been developed and tested, both in the laboratory and in the field. For example, this technology is used in applications ranging from surface temperature evaluation and ice-presence detection to salinity sensing, as described in previous chapters.
Multi-modal sensing, or the use of multiple wavelengths or even multiple technologies (e.g., video with acoustic sensing) in a single sensing system, has some attractive attributes for solving a wide range of problems, including the detection, tracking, and classification of objects (Chellappa et al., 2004). In surveillance applications or low-visibility highway operations, different types of sensors such as visible wavelength video combined with infrared wavelength thermal imaging can provide enhanced observation capability.
Many applications using fixed-position roadside sensors have been developed; however, vehicle-mounted visual and multi-spectral sensors used for road condition evaluation and collision avoidance systems are not as mature.
The use of visual and multi-spectral sensors as collision avoidance systems or roadway condition sensors is described in this chapter, even though there is little information in the published literature about their specific application to winter maintenance vehicles. In addition, radio and Internet systems are actually multi-spectral technologies that enable vehicle-mounted and roadside sensors to communicate with one another or facilitate the transmission of data between vehicles and traffic management centers.
Collision Avoidance Technologies Collisions are a function not only of obstacle presence but also a function of vehicle speed and direction, and vehicle traction (tire friction). The discussion and operation of vehicle speed sensors and friction measurement systems is beyond the scope of this NCHRP synthesis, but it is clear that collision probability changes as stopping distances vary with road conditions and speed.
LIDAR (LIght Detection And Ranging) and Optical (including infrared) systems have been tested and utilized in collision avoidance systems, although Millimeter Wave Radar Sensors (discussed in Chapter 7) have emerged as the most prevalent and reliable technology for collision avoidance and warning systems presently in use. LIDAR and RADAR (RAdio Detection And Ranging) both use active sensor technology; that is, the sensors used in these collision avoidance systems broadcast or emit a signal, then detect and interpret any returned signals to indicate the presence of and distance to an object. Thermal imagers operate in the infrared wavelength and are generally passive devices; that is, they rely on collecting energy emitted from adjacent objects. Optical systems have been developed using both active and passive systems. Passive systems can measure energy that is naturally available, while active sensors provide their own energy source and “illuminate” the target before gathering the energy reflected back to be analyzed. One distinct advantage of active sensors over passive ones is the possibility of making measurements anytime, anywhere, regardless of weather, time, and temperature
Vision enhancement systems can be classified with collision avoidance systems because they provide the operator additional information in limited visibility situations so that objects can be detected, seen and avoided. Both of these systems utilize electromagnetic energy, but use different operating wavelengths.
Page 55
The Adaptive Cruise Control (ACC) technology overlaps collision avoidance technologies to a large extent. AAC systems use LASERs (Light Amplification by Stimulated Emission of Radiation) or RADAR to monitor and maintain vehicle speed as well as the distance to the other vehicles.
Technology Summary LIDAR collision avoidance systems utilize the same principle as RADAR except that it uses optical rather than radio frequencies to determine the distance between the sensor and the object. The radiation used by LIDAR is at wavelengths 10,000 to 100,000 times shorter than that used by conventional radar. The “pulse-echo, time of flight” technique for target distance determination relies on precise measurement of the time between sending a signal pulse and receiving an echo return from a target. LIDAR systems use a laser source as the signal pulse. In addition to the basic range finding function, analysis of the return signal can reveal some other properties of the target. For example, measurement of return signal light intensity, frequency or wavelength shift, and light polarization can indicate target properties such as target reflectivity or size, and target motion and direction. LIDAR may be continuous-wave or pulsed, focused or collimated, with many other possible variations in configuration (PWRI, 2000).
Optical (also known as Visual) systems utilize video image acquisition technology to improve operator awareness under low-visibility conditions. Both passive and active system architectures are used in various fields. Passive systems collect ambient light using various methods, while active systems emit light to “illuminate” the target, and then collect reflected light from the obstacle. Both systems utilize an image display to output the collected image to the user, either using a video monitor or heads-up display (Seiler et al., 1998).
Several OEM (Original Equipment Manufacturer) and aftermarket product suppliers for trucks and automobiles market infrared visibility enhancement systems. These systems can excel in providing visual cues for drivers in low-visibility situations. Cadillac introduced a passive infrared thermal imaging system, developed by Raytheon, in their 2000 model-year Cadillac Deville. Raytheon’s “Thermal Eye” systems are utilized for firefighting applications, airport maintenance and emergency vehicles and security systems. These imaging system tools do not, in general, provide warning of impending collision but rather are intended to improve the vision of the operator who can use that information to determine if objects are present, and therefore if collisions are imminent or likely.
Vision systems are a related technology widely used in automated manufacturing operations. The technology has also become commonplace for traffic signal control. Vision system technology or “Machine Vision” is related to image acquisition but adds the complex task of identifying features within the acquired image. These systems operate at wavelengths ranging from infrared through visible and into ultraviolet wavelengths, depending upon the application, and can use passive or active sensor packages. Vision systems rely on acquisition of an image of a scene that can then be analyzed pixel-by-pixel for feature content. Changes in pixel shading or the presence of linear arrays of like-shaded pixels may indicate proximity of objects. The algorithms used to determine presence of objects can be very complex and are most often proprietary. Integration of these types of systems into moving platforms adds another level of complexity. Additionally, stereo-vision cameras integrated into multi-modal sensor systems with radar or ultrasonic sensors can provide enhanced functionality beyond the capability of single-technology systems. Despite the difficulties, manufacturers such as Iteris (Iteris, 2006) provide commercial vision systems using image acquisition and feature recognition for lane departure

Page 56
warning (LDW). LDW tracks a vehicles position relative to the lane markings. The system uses image recognition software to detect when a vehicle drifts towards an unintended lane change. If lane drift is sensed, the unit automatically emits a rumble strip sound from the left or right speaker (depending on which way the vehicle is drifting), alerting the driver to make a correction. Iteris indicates that LDW works both day and night and in most weather conditions where lane markings are visible. LDW is capable of detecting both solid and dashed lines even if the lines are heavily faded.
Planning It is clear that many vehicle operators desire advance warning of nearby obstacles in order to reduce or eliminate collisions. The respondents to the survey on MWRS noted that their primary reason for testing the technology was to provide snowplow (or other winter maintenance vehicle) operators the ability to receive a warning of obstacles (vehicles) in front of them, as well as vehicles approaching from the rear. This same reasoning holds true for other collision avoidance technologies. Results from a 2002 study of snowplow operators indicated that the most important factor related to safe snowplow operation was the ability to “see” large obstacles. It was also determined that these operators perceived technology that would help detect obstacles in front of their vehicles as very useful (Cuelho and Kack, 2002). Systems to provide this capability for snowplow drivers has been under development by a number of state agencies, the military, and private companies. Infrared imaging system selection guides are available by manufacturers such as Ricoh, West Caldwell NJ; Fluke, Everett WA; and Electrophysics, Fairfield NJ. However, as discussed in Chapter 6, respondents to the survey on vehicle-based winter maintenance indicated that their respective states have not yet deployed collision avoidance systems for winter maintenance vehicles in a large scale, and most systems were still in the testing/development stage. The more complex systems have not yet been integrated for black-box installations, and require optimization for winter maintenance vehicle operation. Agencies desiring to implement these systems will likely need in-house expertise, or could consider teaming with contractors or manufacturers for support. With the technology in a rapid state of development it is difficult to give specific, comprehensive guidance regarding the selection of specific system architectures.
Backup alarms or proximity warning systems are more common, and are readily available from aftermarket suppliers. However, some operational difficulties have been encountered during severe weather usage of backup alarm systems. Specifically, the sensor or receiver may be blocked by accumulating snow, ice, or spray. The effects could be minimized during installation by selecting mounting locations that are not as subject to accumulation.
Personnel training and device maintenance needs will vary by vehicle and are highly dependent upon the system components and operator interface. Backup alarms or proximity sensing systems with audible warning could be implemented with virtually no operator training beyond awareness that the device exists. Maintenance would consist of cleaning the sensor, relatively straightforward component installation steps, and occasional replacement of simple “black box” system components in case of component failure. On the opposite end of the spectrum, training for operators and service personnel involved with more advanced components (e.g. heads-up displays and thermal imaging systems) will require significant dedication of time and resources.

Page 57
Operations and Maintenance Essential system components in a LIDAR system include a laser light source with power supply, a light-sensitive receiver, signal timing & processing equipment, and a user interface or display. LIDAR technology is equally effective in most daytime and nighttime lighting conditions, but difficulties arise when used in fog, snow, dust or rain.
With optical or vision-based systems, two general types of systems are available: passive vision systems use ambient light (or the heat energy of the target in the case of infrared systems) while active systems broadcast electromagnetic energy to illuminate objects with light at the frequency of the receiving sensor. Passive systems require sensitive circuitry to operate in low-light environments or in darkness, and active systems can be (just as) prone to poor performance in low-visibility situations such as fog or snow due to the illumination beam not reaching the target. Components of optical or infrared image enhancement systems include a camera to acquire images, a processing unit or computer to convert the gathered information to a format that can be seen or processed by the user, and a screen or heads-up display for presentation of data. Active systems add an illumination unit to enhance signal return at the wavelength of the sensor.
Figure 22: Phase II Prototype Highway Maintenance Concept Vehicle using Backup Sensors (from Andrle, 2002)
Short-range proximity alarms and backup warning systems have been implemented on
commercial and private vehicles for a number of years. The Search-Eye Sensor System from Global Sensor Systems, Inc. is an example of such a system, and uses infrared sensors in conjunction with automatic braking components to prevent backup collisions. (Global Sensor Systems, Inc., 2006). Another representative product from Global Sensor Systems is Global View, an active infrared camera system with display monitor. This technology has been under development for at least a decade as indicated by a 1995 Iowa State University study describing

Page 58
the use of backup sensors in each of three prototype winter maintenance vehicles (Figure 22) (Andrle, 2002).
Evaluation In May 2002, a Final Report for ITS-IDEA Project 85 described the testing and evaluation of a mobile road condition sensor used as a highway maintenance aid (Prakash, 2002). In May 2005, the National Highway Traffic Safety Administration (NHTSA) published a report on the Automotive Collision Avoidance System Field Operational Test (NHTSA, 2005). The report was conducted in cooperation with General Motors (GM) to further the science and understanding of Forward Collision Warning (FCW) and Adaptive Cruise Control (ACC) by conducting extensive field operational tests on non-professional drivers. The report investigated whether there could be a reduction in near crashes, operator tolerance to repeated alerts, the delay of alerts, and emergence of problems with the collision avoidance systems.
Despite some operational difficulties, LIDAR technology has been investigated for use in various vehicle-mounted transportation applications (Kavaya, 2006) and has been implemented in ACC systems on vehicles from Toyota, Lexus, and others. At the time of this report only one automaker, Lexus, uses a laser-based ACC system in its LS430 luxury sedan. Toyota system engineers have acknowledged LIDAR shortcomings and taken steps to make the system unavailable in situations where the weather may limit its effectiveness. According to the LS430 owner’s manual, the system will automatically shut itself off if the windshield wipers are turned to a rapid setting, indicating heavy rain or snow; if something activates the anti-lock braking system; or if the vehicle skid control system detects the slipping of tires on turns, common in wet weather (Khattak and Shamalyleh, 2005).
A 2003 University of Minnesota project investigated the applicability of infrared imaging sensors for use as a driver assist display interface. These sensors were evaluated as a device to be integrated into the IV Lab Driver Assistive System as a complement to the radar based obstacle detection systems (Shankwitz, 2003). Infrared sensors can provide information regarding what is detected, but unless stereo sensors are used, the IR sensors cannot provide accurate information regarding where an obstacle is located. This project investigated how imaging and radar technologies complement one another.
The German Federal Ministry of Education and Research has been promoting a research initiative called INVENT (Intelligenter Verkehr und Nurzergerechte Technik: Intelligent Traffic and User-Friendly Technology) aimed at improving different aspects of driver assistance and safety. Under this umbrella, Audi AG and the Institute of Automatic Control at the University of Erlangen-Nuremberg are developing automatic vehicle guidance. The requirement for the automatic vehicle guidance (AVG) is to keep the vehicle within a lane. A test vehicle, Audi A8, was equipped with an image acquisition system and a data processing system to measure the location of the vehicle with respect to the lane or to the geometric parameters of the road. In the case of snow-covered roadways, the geometric recognition scheme is an excellent option to avoid relying on visibility and whether the lane markings are clear or obscured. The AVG performance was tested after an initial lateral deviation as well as on curves. The results obtained were satisfactory and the measurements were encouraging (Meier et. al., 2004). However, the study mentions that this solution is not itself a black-box solution, as the sensors need to be adapted (calibrated) to each vehicle it is mounted on.
Adaptive Cruise Control systems were first introduced by Toyota in 1998, in a sedan sold in Japan only (ABI Research, 2005). Nissan and Jaguar installed ACC on some of their

Page 59
luxury cars by 1999 (Jones, 2001). The radar sensors in these vehicles were manufactured by Delphi Delco Electronic Systems (Delphi Corp., 2006), and the braking control interface units were manufactured by TRW Automotive Electronics (TRW Automotive, 2006), both in the state of Michigan. Typically, the units installed in these vehicles used a 77 GHz radar sensor to detect obstacles 650 ft away, with 5% precision and a field of view of 12 degrees. In Japan, ACC systems were adapted to in-city driving, where slower vehicle operating speeds result in short braking distances.
To support ACC development, Omron Electronic Automotives Inc. in Novi Michigan offers a LIDAR that accommodates both short and long-range sensing (Omron Automotive, 2005). This LIDAR sensor can also detect objects with low and high reflectivity through wave pattern recognition (micro-lens array), so that the speed and distance as well as the physical nature are recovered to differentiate between vehicles, pedestrians, poles, or other objects. The challenge with lower speeds and short gaps is that the sensor had to have a wider viewing range both horizontally and vertically. Mercedes-Benz and Lexus also added the ACC option in their most luxurious vehicles. The ACC systems in Mercedes-Benz vehicles were developed by M/A-Com in Lowell Massachusetts, and the radar unit is a product of Filtran Microcircuits Inc. in West Caldwell, New Jersey (Merrimac, 2002).
Fujitsu Ten of Plymouth, Michigan (Jones, 2001) has demonstrated a prototype system for so-called stop-and-go adaptive cruise control. Ordinary ACC systems maintain safe distances between cars at speeds above 25 mph (40 km/h), whereas Fujitsu Ten’s system is designed primarily for use at lower speeds in heavy traffic. If the car in front of it stops, the system will bring the vehicle to a complete stop. Afterward, Fujitsu Ten’s system will not re-engage the throttle—that’s up to the driver—but as soon as the throttle is engaged, it will accelerate and decelerate along with the leading car over any range of speeds between zero and the cruising speed set by the driver.
The “fusion sensor” links enhanced millimeter-wave radar from Fujitsu Ten’s first-generation ACC system to a 640-by-480-pixel stereo camera with a 40-degree viewing angle. The camera, which uses two CMOS image sensors spaced 20 cm apart, is mounted inside the car between the windshield and the rear-view mirror.
The radar and the cameras work together to rapidly track the car ahead and distinguish it from extraneous nonmoving objects. The radar is used for range finding tasks while the stereo camera measures the widths of all the items in its wide field of view. To calculate these widths, it uses an algorithm based on the detection of vertical edges and the distance. Bridges, trees, and other stationary objects that are much wider or narrower than a car should not trigger a brake application.
A large degree of commercial and government agency interest in the development and application of adaptive cruise control exists. As components and systems mature, they will likely see further implementation in winter maintenance vehicle applications.
Future Enhancements In the transportation field, LIDAR is used extensively for vehicle speed detection by law enforcement agencies, and has also been utilized as an airborne mapping system for tasks such as planning of highway routes and evaluating sight distances, and for aircraft approach and departure hazards at airport locations (Chellappa et al., 2004; and Prakash, 2002). Due to this prior usage, the term “Collision avoidance” when associated with LIDAR often indicates accessing databases of previously mapped fixed obstacles, rather than real-time vehicle-mounted
Page 60
systems. This technology, when combined with GPS systems for vehicle location awareness, has great potential for fixed-obstacle collision avoidance applications for winter maintenance vehicles. LIDAR also has potential for application in road condition evaluation sensors.
MWRS systems have the resolution to detect relatively small objects, including surface contour changes that might indicate pavement damage or snow/ice buildup. This capability might make MWRS useful in applications beyond present uses, such as in road condition evaluation systems.
In vision-based systems such as Fujitsu Ten’s “fusion” system, a phased-array radar may replace the MWRS component presently being demonstrated. The phased-array radar “scans” by altering the relative phase of the signals emitted from a group of antennas and, consequently, the direction of the emitted beam. This system could theoretically cut response time and eliminate the complexity and maintenance issues associated with the moving components found in other radar systems. Additionally, the shape of the beam, which defines the scanning area, could be changed quickly in response to changing road conditions (Jones, 2001).
Collision avoidance systems span the range from systems intended to aid visibility in non-optimal visibility conditions, to systems that sense discreet obstacles, to smart systems that take vehicle speed and road surface friction into account when estimating collision probabilities. Future systems will continue to incorporate advances in autonomous operation such as steering and/or braking based on the sensor information gathered. Automatic braking has already been accomplished with backup alarm systems, and automated steering systems have been developed using input from magnetic sensors in advanced snowplows.
It is anticipated that collision avoidance systems usage in winter maintenance vehicles will increase as they become more commonplace as lessons from related applications in transportation and maintenance are exchanged. For instance, proximity sensors & short-range collision alarms in common use on garbage trucks and transit buses may also be used on snowplows, sanding trucks and anti-icing vehicles.
Finally, implementing intelligent combinations of sensor technologies in a single system will likely result in performance gains not achievable with the technologies individually.
Roadway Condition Sensors Weather conditions are one of the major factors that impact driving experience and safety. Since snow and ice on roadways can contribute to the deterioration of driving conditions, detecting any snow and ice build-up quickly and precisely can drastically improve roadway safety. Various weather sensors can be used by winter maintenance agencies to predict evolving roadway surface conditions. However, the data collected by these sensors can be compromised by wind, air temperature, visibility, and even pavement structural conditions. Although some devices exist that use these systems to detect winter roadway driving conditions, most vehicle-mounted roadway condition sensors have been developed for pavement evaluation. Both laser and visible image systems have been developed. Additionally, some fixed-position systems are adaptable to vehicle mounting, and most are compatible with roadside to vehicle communication systems.
Technology Summary Visible image sensors rely on hue, saturation, and brightness to detect the roadway surface condition by comparing the images to clear road condition. LIDAR sensors consist of a laser transmitter/receiver unit that produces a laser pulse. The emitted laser pulse propagates until it meets an obstacle, in this case, the roadway surface, which scatters light in all directions. The
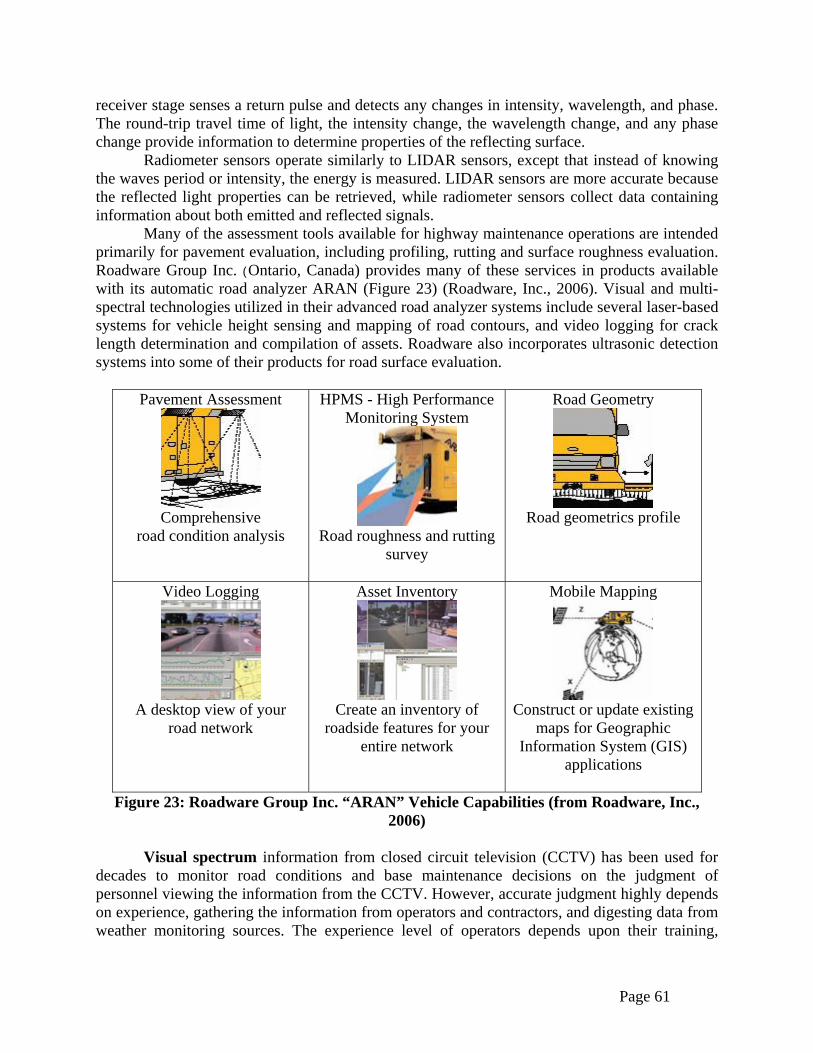
Page 61
receiver stage senses a return pulse and detects any changes in intensity, wavelength, and phase. The round-trip travel time of light, the intensity change, the wavelength change, and any phase change provide information to determine properties of the reflecting surface.
Radiometer sensors operate similarly to LIDAR sensors, except that instead of knowing the waves period or intensity, the energy is measured. LIDAR sensors are more accurate because the reflected light properties can be retrieved, while radiometer sensors collect data containing information about both emitted and reflected signals.
Many of the assessment tools available for highway maintenance operations are intended primarily for pavement evaluation, including profiling, rutting and surface roughness evaluation. Roadware Group Inc. (Ontario, Canada) provides many of these services in products available with its automatic road analyzer ARAN (Figure 23) (Roadware, Inc., 2006). Visual and multi-spectral technologies utilized in their advanced road analyzer systems include several laser-based systems for vehicle height sensing and mapping of road contours, and video logging for crack length determination and compilation of assets. Roadware also incorporates ultrasonic detection systems into some of their products for road surface evaluation.
Pavement Assessment
Comprehensive
road condition analysis
HPMS - High Performance Monitoring System
Road roughness and rutting
survey
Road Geometry
Road geometrics profile
Video Logging
A desktop view of your
road network
Asset Inventory
Create an inventory of
roadside features for your entire network
Mobile Mapping
Construct or update existing
maps for Geographic Information System (GIS)
applications
Figure 23: Roadware Group Inc. “ARAN” Vehicle Capabilities (from Roadware, Inc., 2006)
Visual spectrum information from closed circuit television (CCTV) has been used for
decades to monitor road conditions and base maintenance decisions on the judgment of personnel viewing the information from the CCTV. However, accurate judgment highly depends on experience, gathering the information from operators and contractors, and digesting data from weather monitoring sources. The experience level of operators depends upon their training,
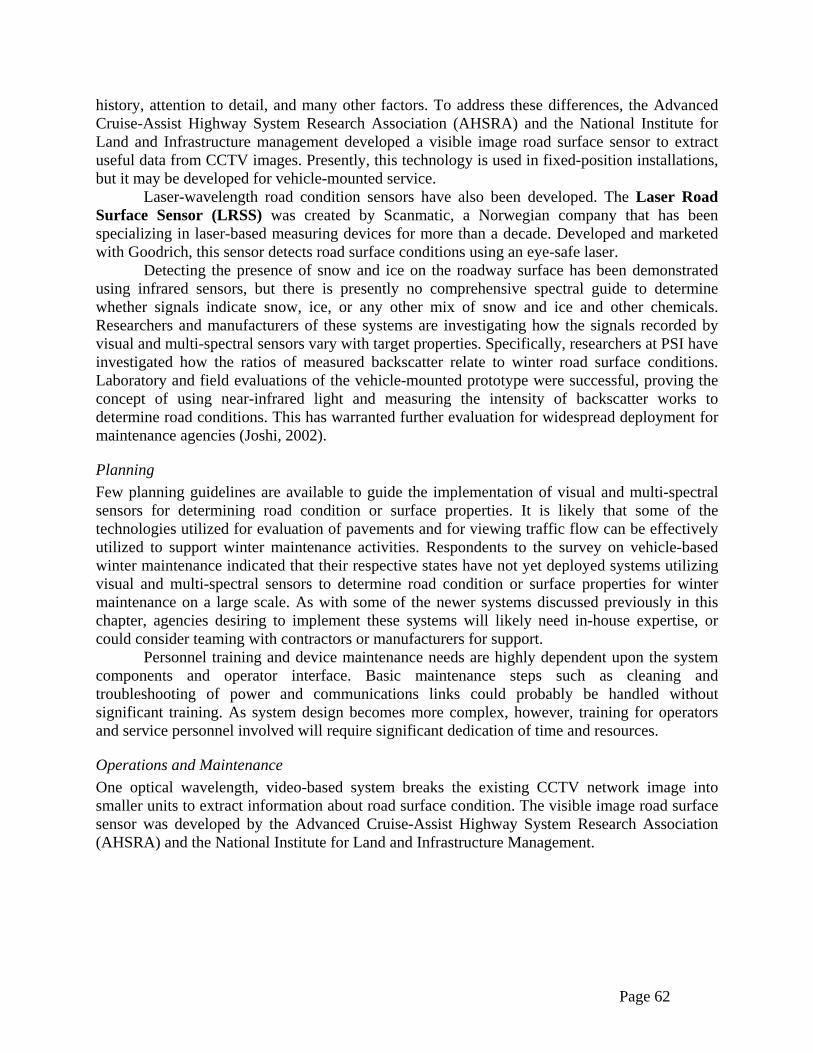
Page 62
history, attention to detail, and many other factors. To address these differences, the Advanced Cruise-Assist Highway System Research Association (AHSRA) and the National Institute for Land and Infrastructure management developed a visible image road surface sensor to extract useful data from CCTV images. Presently, this technology is used in fixed-position installations, but it may be developed for vehicle-mounted service.
Laser-wavelength road condition sensors have also been developed. The Laser Road Surface Sensor (LRSS) was created by Scanmatic, a Norwegian company that has been specializing in laser-based measuring devices for more than a decade. Developed and marketed with Goodrich, this sensor detects road surface conditions using an eye-safe laser.
Detecting the presence of snow and ice on the roadway surface has been demonstrated using infrared sensors, but there is presently no comprehensive spectral guide to determine whether signals indicate snow, ice, or any other mix of snow and ice and other chemicals. Researchers and manufacturers of these systems are investigating how the signals recorded by visual and multi-spectral sensors vary with target properties. Specifically, researchers at PSI have investigated how the ratios of measured backscatter relate to winter road surface conditions. Laboratory and field evaluations of the vehicle-mounted prototype were successful, proving the concept of using near-infrared light and measuring the intensity of backscatter works to determine road conditions. This has warranted further evaluation for widespread deployment for maintenance agencies (Joshi, 2002).
Planning Few planning guidelines are available to guide the implementation of visual and multi-spectral sensors for determining road condition or surface properties. It is likely that some of the technologies utilized for evaluation of pavements and for viewing traffic flow can be effectively utilized to support winter maintenance activities. Respondents to the survey on vehicle-based winter maintenance indicated that their respective states have not yet deployed systems utilizing visual and multi-spectral sensors to determine road condition or surface properties for winter maintenance on a large scale. As with some of the newer systems discussed previously in this chapter, agencies desiring to implement these systems will likely need in-house expertise, or could consider teaming with contractors or manufacturers for support.
Personnel training and device maintenance needs are highly dependent upon the system components and operator interface. Basic maintenance steps such as cleaning and troubleshooting of power and communications links could probably be handled without significant training. As system design becomes more complex, however, training for operators and service personnel involved will require significant dedication of time and resources.
Operations and Maintenance One optical wavelength, video-based system breaks the existing CCTV network image into smaller units to extract information about road surface condition. The visible image road surface sensor was developed by the Advanced Cruise-Assist Highway System Research Association (AHSRA) and the National Institute for Land and Infrastructure Management.
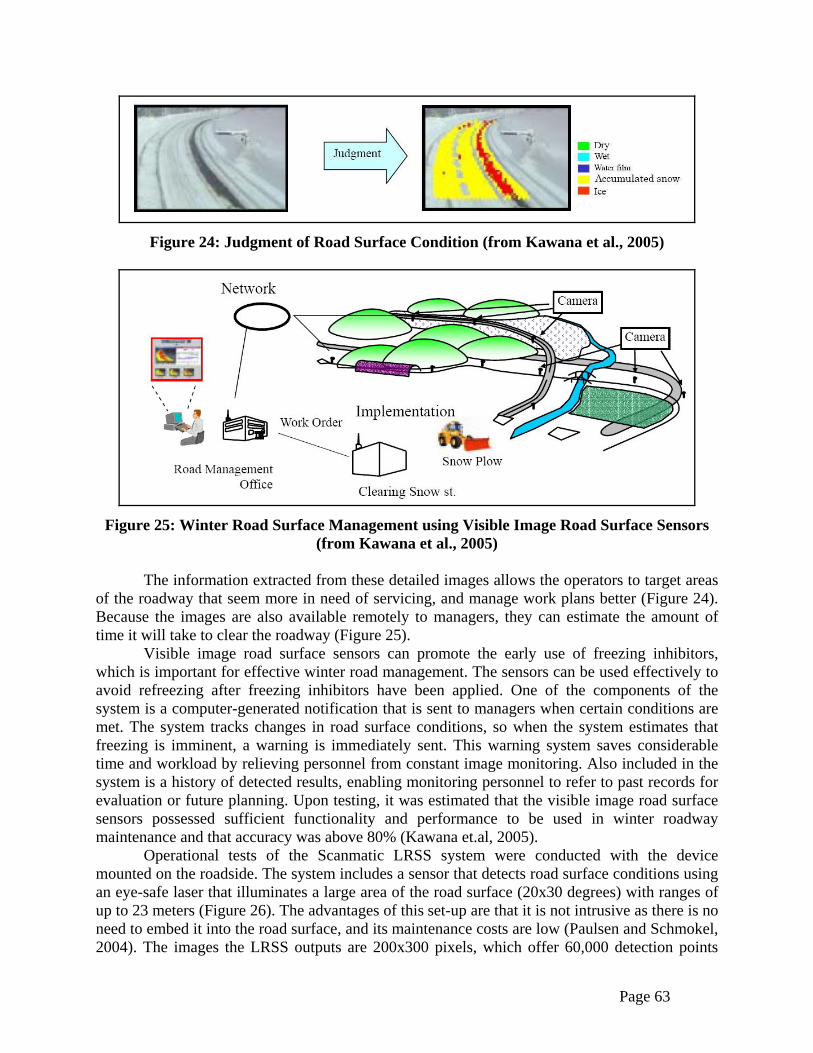
Page 63
Figure 24: Judgment of Road Surface Condition (from Kawana et al., 2005)
Figure 25: Winter Road Surface Management using Visible Image Road Surface Sensors
(from Kawana et al., 2005)
The information extracted from these detailed images allows the operators to target areas of the roadway that seem more in need of servicing, and manage work plans better (Figure 24). Because the images are also available remotely to managers, they can estimate the amount of time it will take to clear the roadway (Figure 25).
Visible image road surface sensors can promote the early use of freezing inhibitors, which is important for effective winter road management. The sensors can be used effectively to avoid refreezing after freezing inhibitors have been applied. One of the components of the system is a computer-generated notification that is sent to managers when certain conditions are met. The system tracks changes in road surface conditions, so when the system estimates that freezing is imminent, a warning is immediately sent. This warning system saves considerable time and workload by relieving personnel from constant image monitoring. Also included in the system is a history of detected results, enabling monitoring personnel to refer to past records for evaluation or future planning. Upon testing, it was estimated that the visible image road surface sensors possessed sufficient functionality and performance to be used in winter roadway maintenance and that accuracy was above 80% (Kawana et.al, 2005).
Operational tests of the Scanmatic LRSS system were conducted with the device mounted on the roadside. The system includes a sensor that detects road surface conditions using an eye-safe laser that illuminates a large area of the road surface (20x30 degrees) with ranges of up to 23 meters (Figure 26). The advantages of this set-up are that it is not intrusive as there is no need to embed it into the road surface, and its maintenance costs are low (Paulsen and Schmokel, 2004). The images the LRSS outputs are 200x300 pixels, which offer 60,000 detection points
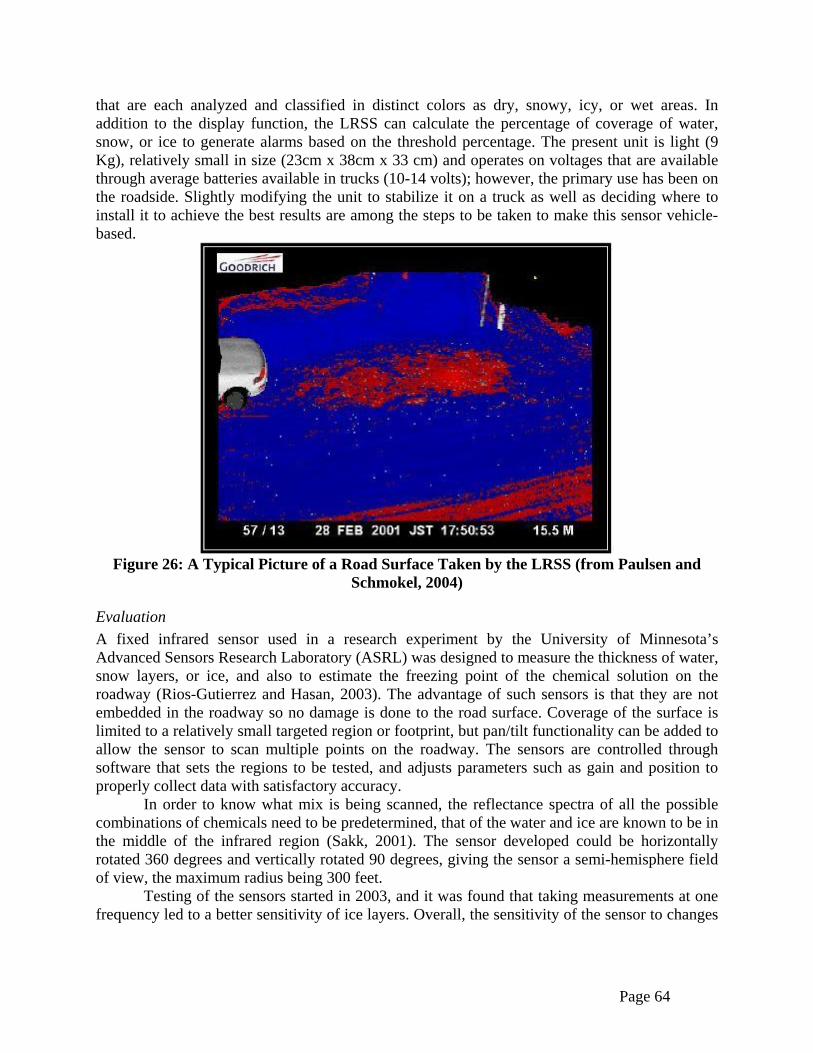
Page 64
that are each analyzed and classified in distinct colors as dry, snowy, icy, or wet areas. In addition to the display function, the LRSS can calculate the percentage of coverage of water, snow, or ice to generate alarms based on the threshold percentage. The present unit is light (9 Kg), relatively small in size (23cm x 38cm x 33 cm) and operates on voltages that are available through average batteries available in trucks (10-14 volts); however, the primary use has been on the roadside. Slightly modifying the unit to stabilize it on a truck as well as deciding where to install it to achieve the best results are among the steps to be taken to make this sensor vehicle-based.
Figure 26: A Typical Picture of a Road Surface Taken by the LRSS (from Paulsen and
Schmokel, 2004)
Evaluation A fixed infrared sensor used in a research experiment by the University of Minnesota’s Advanced Sensors Research Laboratory (ASRL) was designed to measure the thickness of water, snow layers, or ice, and also to estimate the freezing point of the chemical solution on the roadway (Rios-Gutierrez and Hasan, 2003). The advantage of such sensors is that they are not embedded in the roadway so no damage is done to the road surface. Coverage of the surface is limited to a relatively small targeted region or footprint, but pan/tilt functionality can be added to allow the sensor to scan multiple points on the roadway. The sensors are controlled through software that sets the regions to be tested, and adjusts parameters such as gain and position to properly collect data with satisfactory accuracy.
In order to know what mix is being scanned, the reflectance spectra of all the possible combinations of chemicals need to be predetermined, that of the water and ice are known to be in the middle of the infrared region (Sakk, 2001). The sensor developed could be horizontally rotated 360 degrees and vertically rotated 90 degrees, giving the sensor a semi-hemisphere field of view, the maximum radius being 300 feet.
Testing of the sensors started in 2003, and it was found that taking measurements at one frequency led to a better sensitivity of ice layers. Overall, the sensitivity of the sensor to changes

Page 65
on the road surface were very good and the sensor was able to distinguish between the different roadway surface conditions
A 2004 report from the Western Transportation Institute at Montana State University described the laboratory evaluation of an infrared sensing system planned for fixed-site deployment by the Oregon Department of Transportation (Bristow, 2004). The Oregon Department of Transportation (ODOT) remotely measures road weather conditions in order to help with winter maintenance operations. To improve on the accuracy of this field data, ODOT identified an infrared camera technology to be used in future studies, which reportedly measures the phase change of water on asphalt. Before deploying this camera (IceSight) on a widespread basis, ODOT sought to investigate how the camera recognized phase changes in a controlled laboratory environment. For this task, researchers from the Western Transportation Institute set up seven controlled experiments using Montana State University’s cold weather chamber. For each experiment, temperature and phase were measured every sixty seconds. Per this report, the camera showed difficulty in measuring the transition from water to ice, and in interpreting slush. However, it accurately identified most phase changes despite drastic temperature changes within the cold chamber. This report recommended further field testing prior to deployment. Conversion of this fixed-site technology to vehicle-mounted usage would likely require even more testing.
Future Enhancements Road condition measurements including ice presence, salinity measurement, freeze point and surface temperature are described earlier in this synthesis. Traction or friction measurement systems have been the subject of previous reports and are outside the scope of this document, but nonetheless, are attaining a degree of maturity and acceptance for vehicle-based winter maintenance use. In another related area, the sensing of pavement conditions with regard to asphalt surface roughness, crack presence and length, rutting, and other parameters is also a maturing field with several companies providing products and services. It is anticipated that additional attention will be focused on gathering winter road condition information, likely by adapting some of the technologies that have been developed for purposes other than winter road condition measurement. It is also likely that combinations of sensors will be packaged together in order to report comprehensive pavement/winter roadway conditions including temperature, ice, packed snow, traction, etc. – all in a single user-friendly package. This merging of sensor systems and technologies has shown promise in collision avoidance systems, and in other related fields.
Summary of Findings Visual and multi-spectral sensors have been successfully tested in several collision avoidance systems as well as roadway condition sensing devices. Active sensor systems such as LIDAR are commercially available in production vehicles as adaptive cruise control components. Passive thermal imaging technology has shown excellent utility in prototype systems for enhancing driver vision, and systems are in use for some emergency vehicle usage in low-visibility environments such as fog and smoke. Visual image acquisition systems (video, CCTV) are common in fixed-position applications and are now becoming available in vision systems using highway lane marking detection in lane departure warning applications. The potential and real advantages of using vehicle-mounted sensors for collision avoidance, obstacle awareness, and roadway conditions include safety for operators and the public, longevity of winter maintenance assets, lower insurance costs, limited down time, and better public relations. Present availability

Page 66
of these technologies in a form tailored specifically for winter maintenance use is somewhat limited, but those systems tested show promise in improving winter maintenance safety and effectiveness. As systems mature it is anticipated that data from field usage will provide winter maintenance users with better guidance regarding optimum configurations.
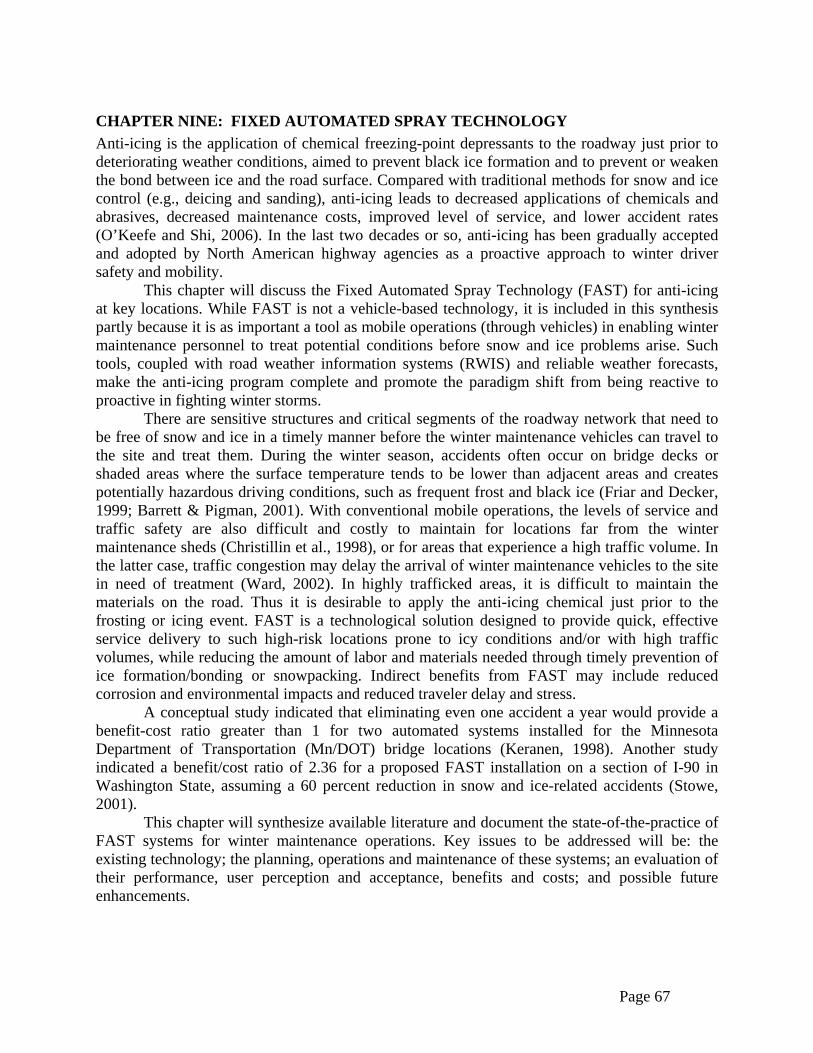
Page 67
CHAPTER NINE: FIXED AUTOMATED SPRAY TECHNOLOGY Anti-icing is the application of chemical freezing-point depressants to the roadway just prior to deteriorating weather conditions, aimed to prevent black ice formation and to prevent or weaken the bond between ice and the road surface. Compared with traditional methods for snow and ice control (e.g., deicing and sanding), anti-icing leads to decreased applications of chemicals and abrasives, decreased maintenance costs, improved level of service, and lower accident rates (O’Keefe and Shi, 2006). In the last two decades or so, anti-icing has been gradually accepted and adopted by North American highway agencies as a proactive approach to winter driver safety and mobility.
This chapter will discuss the Fixed Automated Spray Technology (FAST) for anti-icing at key locations. While FAST is not a vehicle-based technology, it is included in this synthesis partly because it is as important a tool as mobile operations (through vehicles) in enabling winter maintenance personnel to treat potential conditions before snow and ice problems arise. Such tools, coupled with road weather information systems (RWIS) and reliable weather forecasts, make the anti-icing program complete and promote the paradigm shift from being reactive to proactive in fighting winter storms.
There are sensitive structures and critical segments of the roadway network that need to be free of snow and ice in a timely manner before the winter maintenance vehicles can travel to the site and treat them. During the winter season, accidents often occur on bridge decks or shaded areas where the surface temperature tends to be lower than adjacent areas and creates potentially hazardous driving conditions, such as frequent frost and black ice (Friar and Decker, 1999; Barrett & Pigman, 2001). With conventional mobile operations, the levels of service and traffic safety are also difficult and costly to maintain for locations far from the winter maintenance sheds (Christillin et al., 1998), or for areas that experience a high traffic volume. In the latter case, traffic congestion may delay the arrival of winter maintenance vehicles to the site in need of treatment (Ward, 2002). In highly trafficked areas, it is difficult to maintain the materials on the road. Thus it is desirable to apply the anti-icing chemical just prior to the frosting or icing event. FAST is a technological solution designed to provide quick, effective service delivery to such high-risk locations prone to icy conditions and/or with high traffic volumes, while reducing the amount of labor and materials needed through timely prevention of ice formation/bonding or snowpacking. Indirect benefits from FAST may include reduced corrosion and environmental impacts and reduced traveler delay and stress.
A conceptual study indicated that eliminating even one accident a year would provide a benefit-cost ratio greater than 1 for two automated systems installed for the Minnesota Department of Transportation (Mn/DOT) bridge locations (Keranen, 1998). Another study indicated a benefit/cost ratio of 2.36 for a proposed FAST installation on a section of I-90 in Washington State, assuming a 60 percent reduction in snow and ice-related accidents (Stowe, 2001).
This chapter will synthesize available literature and document the state-of-the-practice of FAST systems for winter maintenance operations. Key issues to be addressed will be: the existing technology; the planning, operations and maintenance of these systems; an evaluation of their performance, user perception and acceptance, benefits and costs; and possible future enhancements.

Page 68
Technology Summary FAST systems (sometimes known as thawing agent spray systems) have been used in Europe more extensively than in North America. Since the mid-1980s, hundreds of automated anti-icing systems have been used throughout Europe as an established tool to battle snow and ice conditions on highways, bridges, and airports. In North America, FAST is a relatively new technology that has gained popularity since the late 1990s (SICOP, 2004). All nine respondents to the FAST survey conducted for this research project installed their first FAST system in 1995 or later, either as test and evaluation projects or based on regional deployment needs.
FAST systems aim to deliver the anti-icing chemical to key locations in a controlled manner, using pumps, piping, valves and nozzles (or discs). Ideally, the application should be fully automated, using the pre-programmed logic and real-time input from a number of atmospheric and pavement sensors on-site. When the sensors detect ice presence or an imminent frost or icing event, the nozzles will be automatically triggered to spray the anti-icing chemical at a pre-determined rate and pattern. Figure 27 shows a FAST system in action.
Figure 27: A FAST System in Action (Graphic Courtesy of the Ontario Ministry of
Transportation). While the concept is intuitive, its implementation is complex as the FAST system
“integrates sensing technology, fluid mechanics, data processing, and communications technology with the concrete and asphalt of a highway facility” (Bell et al., 2006). To reduce the level of sophistication and facilitate the implementation of FAST, systems with less automation are often deployed in the United States, particularly those with the capabilities of automatic detection and remote activation. Such systems sacrifice some of the FAST benefits for better system reliability. For instance, the fully automated FAST system may be able to treat short-lived frost events, whereas the remotely activated FAST system cannot. In addition, the fully automated system can improve the level of service at the installation site even when the winter maintenance personnel are not available.
A complete FAST system includes the spray subsystem that delivers the anti-icing chemical onto the road surface, and the control subsystem that triggers the spraying action. The spray subsystem consists of the following:
• Reservoirs to store an appropriate amount of anti-icing chemical in accessible areas. Anti-icing chemicals range from potassium acetate, calcium magnesium acetate, sodium chloride, calcium chloride and magnesium chloride, to IceBan/magnesium chloride mixture (SICOP, 2004), generally in liquid form.
• A set of pumps to deliver the chemical through the piping of the hydraulic system, which connects the nozzles to the reservoirs through valves. A pump station is often

Page 69
installed by the side of the FAST installation facility (e.g., a bridge deck) to house the valves, filters, and reservoir level sensors. Other sensitive equipment used to manage the FAST system’s power and communications and an interface that monitors the proper functioning of the system are also installed in the pump station, which is accessible only to authorized personnel.
• A series of valves that deliver the chemical to various point locations; and • A set of devices that spray the chemical onto the road surface in an appropriate
manner. They are flush nozzles, or spray nozzles, mounted on a barrier, curb, parapet, or bridge rail, or spray discs embedded in the pavement.
The control subsystem consists of the following: • RWIS or atmospheric and pavement sensors on-site for early frost or ice warning. If
they work properly, these sensors enable the FAST system to be fully automated and thus provide truly proactive treatment of the road surface in a timely manner. Pavement sensors usually collect data to detect snow, frost and ice presence; temperature of pavement surface and subsurface; pavement condition (dry, moist, or wet); chemical concentration of mixture; and freezing-point temperature of mixture. Passive sensors such as infrared road surface temperature sensors have been useful in predicting freezing-point temperatures; however, their accuracy has not been very satisfactory. Active sensors offer more accurate measurements as they collect a sample of liquid that is on the roadway. They often use a Peltier cell to cool and warm any moisture or liquid on top of them to determine its freezing point (Pyde, 2005), by measuring the energy released when the mixture melts.
• A remote processing unit (RPU) that is able to store a certain amount of data preset by the agency as well as observational data collected from the sensors for an extended period of time. The latter allows the agency to review the system performance and to plan for future operations. Maintenance personnel at the headquarters or shed level can also use a modem to access real-time data at the RPU and monitor the conditions. The RPU should allow maintenance personnel to choose from different spray configurations (i.e. rate, mix, and time) based on the observations or sensor readings, and offer the capability to remotely activate, stop or modify the configurations.
• A FAST data server to store the data at a physical location different from the RPU, to avoid potential disruption or security breaches to the control of the FAST system. A modem is typically used to dial out to the RPU and continuously backup the collected data in the database at the server.
• A software application to display the FAST data in graphic and tabular formats and to manage users and their privileges.
• Electronic control and triggering devices. For automated activation, when the atmospheric and pavement conditions meet the pre-determined parameters, the logic module triggers or stops the sprayers accordingly. When not in the automated mode, the activation signal for the FAST system can be sent remotely via a cellular phone call, a text message, or a command from a maintenance employee’s computer via dial-up or broadband connection. While rarely used, another manual activation option is a push-button at the installation site.

Page 70
Planning Through a review of relevant literature and survey responses, several lessons learned or best practices were identified in relation to planning FAST implementation.
Location Selection FAST is not a solution for the entire road network, but rather for key locations where it can derive the maximum benefits. Selection of the proper site is crucial to the success of any FAST system installation. The site should have unique characteristics such as high winter accident statistics, remote location away from the regular maintenance routine, or very high traffic volumes (CERF, 2005). A report summarizing the experience of the Kentucky Transportation Cabinet recommended that the FAST system be used in the following areas and/or conditions: (1) crash-prone areas, (2) isolated structures that require the deicing truck to travel an unreasonable distance to treat, (3) remote areas that are difficult to reach in bad weather, or (4) bridges over water which may be more susceptible to freezing moisture (Barrett & Pigman, 2001).
A methodology and a decision support tool were developed for the Nebraska Department of Roads to prioritize candidate bridge deck FAST installations, which considered accident history, bridge alignment, weather, traffic, and bridge distance from maintenance yard, among others (Khattak et al., 2003).
In-House vs. Vendor Before making the investment, the agency should consider various options for implementing FAST. For instance, the New York City DOT successfully designed and built their FAST system in-house (Ward, 2002). However, most DOTs have used a contractor to deploy their FAST systems, in which case performance and quality should be considered the most important criteria for the contractor selection. Currently there are only two FAST manufacturers with proven systems: Boschung and Quixote (Bell et al., 2006).
Considerations in System Design FAST is not an “off-the-shelf” system that can be purchased and installed right away at any given site. It requires customized design of the installation at each site after studying the site requirements and conditions (CERF, 2005), such as the specific spray logic. Feasibility studies are necessary to identify and address technical design and systems issues; structural and aesthetic concerns; and costs and warrants for the FAST installation (Pinet et al., 2001). Infrastructure needs should be considered before FAST installation, such as utilities to the site and communications between on-site sensors and the maintenance headquarters (Stewart, 2004).
A recent study recommended the following features to be part of each FAST installation: full RWIS instrumentation; full automatic detection and activation; active and passive roadway sensors; data recording for atmospheric and road surface conditions as well as system functions; manual activation (on-site or remote) or automatic activation; and alarm notification for system activation and system functions (e.g., leaks, pump failure, activation failure, low chemical level). Other desirable features include multiple firing and time cycles, ability to adjust firing sequences and chemical volume, and compatibility with the National Transportation Communications for ITS Protocol (NTCIP) (Bell et al., 2006).
Detailed specifications must be established for components of the FAST system that are prone to failure, such as storage reservoirs; pumps; pipes, valves and other delivery system

Page 71
components; nozzles; and triggering mechanism and associated components (Bell et al., 2006). A sufficient storage reservoir for chemical must be provided on site. During the fall, chemical levels may be low as a result of activations to address early morning frost (Pinet et al., 2001). Placing multiple sensors in the traffic lanes along the roadway might provide more reliable data on pavement conditions.
Information technology staff should be involved in the early stage of the contracting process. The FAST system should be designed with an open architecture to facilitate the integration of additional sensors in the future. The vendor should fully describe the FAST system decision logic, programs and default variables to the agency and licenses for proprietary user interface software must be flexible enough to allow for access by the full range and number of potential users (Pinet et al., 2001). The system data server should permit full access to atmospheric, pavement and FAST data and for data mining by the system administrators (Pinet et al., 2001).
The type and quality of the anti-icing chemical used for the FAST system can significantly affect the FAST performance (CERF, 2005), and its selection should consider potential contamination from the chemical applied on adjacent roadway. For instance, magnesium chloride may react with potassium acetate and form a precipitate (Stewart, 2004). The chemicals used should be verified to be non-corrosive to the reservoirs, pipes, valves, and nozzles. In addition, the procurement contract for anti-icing chemicals should take into account the holding capacity of the FAST system reservoirs (Stewart, 2004).
Construction and Warranties The construction process should be carefully inspected, particularly when the nozzles or discs are cored into the bridge or roadway surface. In the FAST installation contract, it is advantageous to require a 30-day “burn-in” period during the winter months and to include extended warranty.
A traffic control plan should be submitted by the contractor before the FAST installation (Stewart, 2004).
Operations and Maintenance The experience of several agencies has provided valuable information regarding successful operations and maintenance requirements of FAST systems.
Operations FAST is intended for anti-icing rather than to substitute for snow removal, and it works best for frost and light snow events. The spray operations should not be activated under certain inclement road weather conditions, such as when snow has accumulated, when temperatures are below the effective range of the chemical, or when a large volume of freezing rain is occurring (Roosevelt, 2004). In moderate to heavy snowfall (greater than 2 inches [5 cm] of accumulation), a plowing operation by vehicles becomes essential to ensure the roadway safety (CERF, 2005).
Maintenance Requirements Previous studies have documented several preventive maintenance requirements for FAST. Before the winter season, the RWIS or other sensors should be checked and serviced if necessary. The entire FAST system (including hardware and software) should be inspected and repaired if necessary, and the nozzles should be cleaned. Detailed preventative maintenance guidelines are needed for the FAST system to work properly (Roosevelt, 2004).

Page 72
During the winter season, the FAST system may not function properly due to technical problems associated with spray nozzles, pumps, and the triggering mechanism. The sensors may present false alarms and activate unnecessary anti-icing applications, due to malfunctioning sensors, excessive humidity, electrical problems, etc. The system may also fail to activate the anti-icing applications in a timely manner when frosting or icing events occur. Therefore, the agency should perform operational reviews during and after a winter event and document the system performance in monthly reports for future adjustments/improvements.
For manually activated systems, which are less complex and more affordable, agencies should have staff with expertise utilizing RWIS and anti-icing practices regularly monitor site conditions (Bell et al., 2006). For systems operated in a semi-automatic mode (remote activation) based on video monitoring of the site, a high-quality video camera and sufficient transmission rate for its data transmission are key to successful operations. For the fully automated systems, the upper edge of superelevated bridges should be cleared of snow. Otherwise, on sunny days the snow may melt and run across the structure and trigger unexpected sprays (Pinet et al., 2001).
During the winter season, the chemical level in reservoirs needs to be periodically checked, and the software needs to be monitored closely as it may give warnings when sensors are malfunctioning or provide information about the chemical level.
After the winter season, the anti-icing chemical should be removed from the reservoirs and replaced with water (Barrett & Pigman, 2001) or drained. The hydraulic system should be flushed with water. The entire FAST system (including hardware and software) should be inspected and repaired if necessary. Typical problems may be damages to the pipes, seals, spray discs or nozzles, and wiring utilities.
Several repair maintenance issues have also been identified. Many U.S. agencies have experienced problems with sensors such as power supply, maintenance, accuracy and reliability.
Training Survey responses indicated that even for automated FAST systems, agencies monitored them closely during winter storms to ensure the successful operation. When asked how much experience operators and managers needed in order to effectively use FAST, the average score of the six responses was 8.3 for operators and 6.2 for managers, with a “1” being “no training/novice” and a “10” being “expert”. Comments indicated that operators needed the training to understand when to activate the system and how to make adjustments, to monitor the system performance, and to maintain the system; while managers needed the training to know the capabilities of the system and to evaluate its effectiveness.
Adequate training should be provided to the maintenance personnel or contractor in charge of the FAST system so that they can operate and maintain the system in an effective and efficient manner. The training should be suitable to address a variety of levels of expertise and is required on an ongoing basis (Pinet et al., 2001). In addition, it is important to seek technical support from the vendor and perform the maintenance activities according to the manufacturer’s recommendations. The agency should work with the vendor to optimize the operational parameters such as spray pattern, angle, and pressure and to ensure proper spray area coverage for wheel paths, and to optimize the use of chemical and customize it for agency or local preferences (Pinet et al., 2001). The spray heads should be positioned properly so that they will not be clogged with debris.

Page 73
Costs Survey respondents indicated that the cost of FAST installations varied greatly between $22,000 and $4,000,000, depending on coverage area, site location, accessibility of existing utilities, the level of system sophistication, and market factors. Three case studies illustrating the median cost range are as follows. A FAST system installed on a bridge on Interstate 215 in Utah in 2003 was fully automated by both on-location active and passive sensors or by meteorological conditions. The system used 18 valves to spray potassium acetate onto the bridge via deck-mounted spray discs. The total cost for installation was $250,000. Traffic control costs amounted to $7,000. First full year of operation used 1,500 gallons of potassium acetate, costing approximately $4,500 (Stewart, 2004). For a demonstration FAST system installed in Ontario, Canada covering a total of 21,100 ft2 (1,960 m2) of bridge and its approach area, the actual construction cost and the annual operating cost (excluding maintenance of the spray system, pumps and systems) were $300,000 and $15,000, or $14.20/ft2 and $0.70/ft2, respectively (Pinet et al. 2001). For later deployment FAST systems in Ontario, however, the bid price of the basic spray systems ranged from $90/ft2 to $370/ft2 of two-lane structures and a cost of $93,000 was estimated for the ARWIS station associated with each FAST installation.
The costs to operate and maintain the FAST systems are relatively small compared to the installation costs. On-going costs include those related to labor, anti-icing chemicals, utilities, communications, scheduled and periodic cleaning of check valves, routine maintenance and repairs, and system modifications.
Evaluation The user experience of survey respondents indicated that many FAST systems in North America experienced problems with certain components or the communications, or needed adjustments and/or improvements during operations, particularly for the automated activation feature. When the FAST systems worked properly, however, they provided most of the anticipated benefits, such as quick response and timely treatment of the target area for frost, black ice or light snow conditions, accident reduction, cost savings, and environmental benefits due to the decreased amount of chemicals applied. It further confirms the findings from the literature that in North America FAST is still an evolving technology with mixed system performance and user acceptance, but has great potential. One respondent suggested that the implementation of a FAST system should not be intended for monetary savings but rather a step to enhance winter highway safety, while savings can be realized through reduced need to mobilize winter maintenance equipment, reduced corrosion impact on the bridge, environmental benefits, and accident reduction.
European Experience It is interesting to note that FAST has been considered a proven technology in Europe
and the systems deployed did not report any problems with the automated activation, in contrast with the user experience across North America (SICOP, 2004; Bell et al., 2006). A couple of studies have documented positive results of FAST deployments in Europe.
• A FAST system was installed in 1984 along a 3.7 mile (6 km) long, topographically and climatically challenging road section between Hagen and Lüdenscheid in Germany. The benefits regarding road safety were assessed by considering the annual number of accidents due to winter conditions (e.g. snow and icy patches) in two seven-year periods before and after the system installation. The number of accidents

Page 74
was reduced by 58 percent and traffic congestion was also reduced, leading to an estimated benefit-cost ratio of 1.9 (Gladbach, 1993). An analysis by the German Federal Highway Research Institute indicated a similar benefit-cost ratio for the various FAST systems deployed on the German Federal road system (Moritz, 1998).
• A FAST system was installed along an 5-mile (8-km) long road segment of a six-lane highway in Switzerland that had an average daily traffic (ADT) volume of 70,000 vehicles per day (vpd). The salt brine was stored in four main (3,170-gallon or 12,000-L) and eight intermediate (528-gallon or 2,000-L) tanks. The system could be either manually triggered, or automatically activated when the ice detection system of twelve active sensors detected ice or gave advanced warning of ice formation. A pre-installation analysis indicated a benefit-cost ratio of 1.45, considering capital, interest and depreciation costs, material costs, and savings due to accident reduction and avoided mobile maintenance operations (Zambelli, 1998).
North American Experience The effectiveness of a parapet-mounted, “home-built” FAST system installed on an interchange/overpass on I-215 in Salt Lake City, Utah was analyzed for the 1997-98 winter season. The system applied approximately 60 gallons/lane-mile/spray event of liquid magnesium chloride to the northbound lanes of the freeway bridge deck. Comparing the data during the 1997-98 winter with the five previous winters, a 64 percent reduction in snow and ice-related accidents was reported on the northbound lanes (Friar and Decker, 1999), at least part of which was attributable to the FAST system. For three remotely-activated FAST systems installed at various sites in the Minnesota DOT roadway network, the number of winter weather-related accidents dropped 82 percent from the 18 to 24 months before the FAST installations to a similar period after the installations (Keranen, 2000).
In Ontario, Canada, a FAST system was installed along a 550-ft (168-m) interchange ramp with an ADT of 3,000 vpd. The sensors in place detected the roadway and atmospheric conditions and either sounded an alarm so that the maintenance personnel manually triggered the sprayers, or the spray operations were activated automatically. The Ontario Ministry of Transportation was very pleased with the system performance as no winter weather-related accidents had occurred since the FAST installation (Pinet et al. 2001). Chemical costs for the potassium acetate, however, were approximately as twice as anticipated ($12,000 vs. $5-7,000 per year), partly due to unnecessary spray operations that occurred automatically.
A FAST system was installed on a bridge on southbound Interstate 75 at the north interchange to Corbin, Kentucky in October 1997. The system was remotely activated by the winter maintenance personnel through a dial-up connection, based on a combination of the RWIS information and visual observations from the video camera. The eleven parapet-mounted/bridge rail-mounted spray nozzles per side treated the two travel lanes and the approach plate with liquid calcium chloride at the rate of 8 gallons (30 liters) per application along the 600-ft (183-m) segment. After four winter seasons, the system had minimal problems associated with it, worked efficiently as expected and prevented the formation of icy conditions on the bridge deck. There was no noticeable driver reaction to the spraying as it occurred. However, the system was not as effective as anticipated since the location was neither prone to freezing conditions nor remote from maintenance sheds (Barrett & Pigman, 2001).
A FAST system was installed on a bridge on Interstate 68, over Street Road, in Allegany County, Maryland in the 1998-99 winter season to spray CMAK (a mixture of calcium
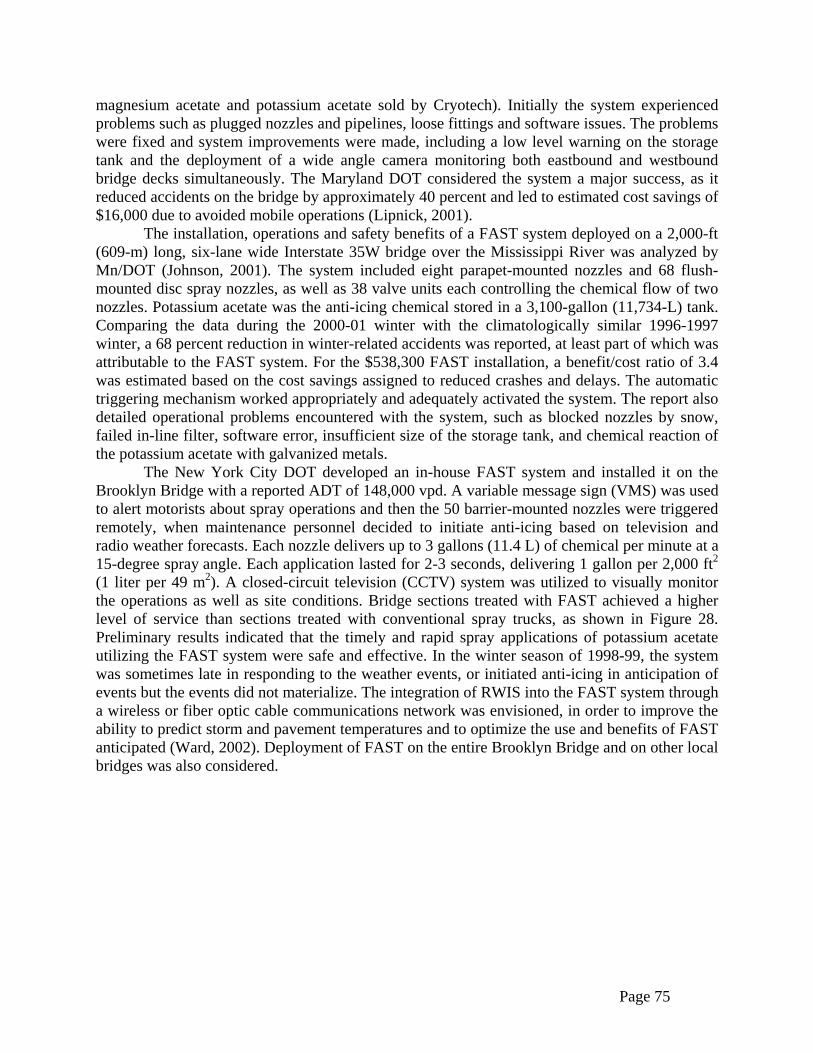
Page 75
magnesium acetate and potassium acetate sold by Cryotech). Initially the system experienced problems such as plugged nozzles and pipelines, loose fittings and software issues. The problems were fixed and system improvements were made, including a low level warning on the storage tank and the deployment of a wide angle camera monitoring both eastbound and westbound bridge decks simultaneously. The Maryland DOT considered the system a major success, as it reduced accidents on the bridge by approximately 40 percent and led to estimated cost savings of $16,000 due to avoided mobile operations (Lipnick, 2001).
The installation, operations and safety benefits of a FAST system deployed on a 2,000-ft (609-m) long, six-lane wide Interstate 35W bridge over the Mississippi River was analyzed by Mn/DOT (Johnson, 2001). The system included eight parapet-mounted nozzles and 68 flush-mounted disc spray nozzles, as well as 38 valve units each controlling the chemical flow of two nozzles. Potassium acetate was the anti-icing chemical stored in a 3,100-gallon (11,734-L) tank. Comparing the data during the 2000-01 winter with the climatologically similar 1996-1997 winter, a 68 percent reduction in winter-related accidents was reported, at least part of which was attributable to the FAST system. For the $538,300 FAST installation, a benefit/cost ratio of 3.4 was estimated based on the cost savings assigned to reduced crashes and delays. The automatic triggering mechanism worked appropriately and adequately activated the system. The report also detailed operational problems encountered with the system, such as blocked nozzles by snow, failed in-line filter, software error, insufficient size of the storage tank, and chemical reaction of the potassium acetate with galvanized metals.
The New York City DOT developed an in-house FAST system and installed it on the Brooklyn Bridge with a reported ADT of 148,000 vpd. A variable message sign (VMS) was used to alert motorists about spray operations and then the 50 barrier-mounted nozzles were triggered remotely, when maintenance personnel decided to initiate anti-icing based on television and radio weather forecasts. Each nozzle delivers up to 3 gallons (11.4 L) of chemical per minute at a 15-degree spray angle. Each application lasted for 2-3 seconds, delivering 1 gallon per 2,000 ft2 (1 liter per 49 m2). A closed-circuit television (CCTV) system was utilized to visually monitor the operations as well as site conditions. Bridge sections treated with FAST achieved a higher level of service than sections treated with conventional spray trucks, as shown in Figure 28. Preliminary results indicated that the timely and rapid spray applications of potassium acetate utilizing the FAST system were safe and effective. In the winter season of 1998-99, the system was sometimes late in responding to the weather events, or initiated anti-icing in anticipation of events but the events did not materialize. The integration of RWIS into the FAST system through a wireless or fiber optic cable communications network was envisioned, in order to improve the ability to predict storm and pavement temperatures and to optimize the use and benefits of FAST anticipated (Ward, 2002). Deployment of FAST on the entire Brooklyn Bridge and on other local bridges was also considered.
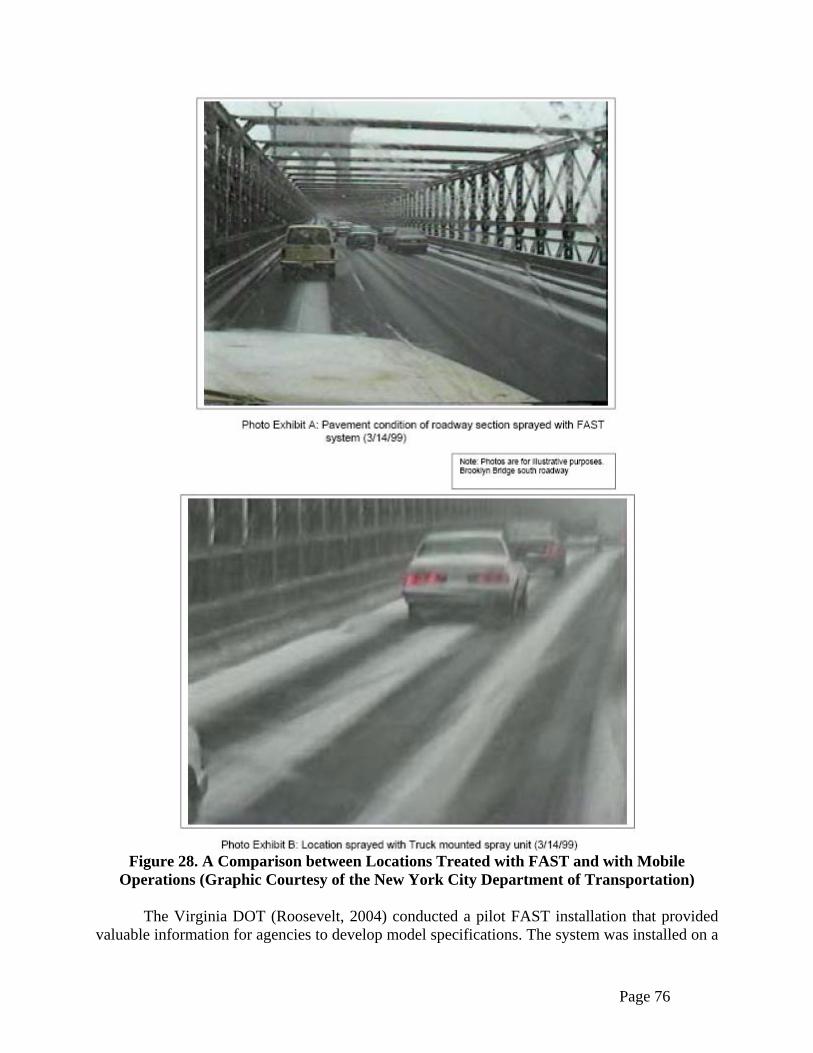
Page 76
Figure 28. A Comparison between Locations Treated with FAST and with Mobile
Operations (Graphic Courtesy of the New York City Department of Transportation) The Virginia DOT (Roosevelt, 2004) conducted a pilot FAST installation that provided
valuable information for agencies to develop model specifications. The system was installed on a
Page 77
30-ft (9.1-m) wide bridge on a roadway in Fairfax County, Virginia. The nozzles were placed in three configurations: parapet mounted, in-deck lane mounted, and in-deck centerline mounted, to spray magnesium chloride brine. The environmental sensor station for the installation, provided and installed by the Virginia DOT, was found to be unable to determine the chemical concentration on the structure; therefore, the system was unable to accurately determine the freezing-point temperature of the bridge surface. As such, the automated triggering mechanism could not work appropriately. No benefit-cost analysis could be performed for this study due to the lack of data. However, the FAST system was able to uniformly spray chemicals over the bridge with the assistance of traffic and was considered an effective option for initial delivery of anti-icing chemicals. It was suggested to place nozzles in the traffic lane(s) to maximize the spray coverage on the surface and to place multiple active sensors in the traffic lanes to improve the accuracy of measuring surface temperature, surface conditions and freezing-point temperature.
In addition to savings derived from reduced winter accidents and delays, the effectiveness and benefits of FAST can also be measured in terms of timeliness of operation, appropriateness of response, and achievement of desired results (Roosevelt, 2004).
Future Enhancements Survey respondents were asked about their future plans with respect to FAST implementation. Due to the technical issues that have been discussed earlier in this chapter, no respondents indicated that their agencies were moving forward with wide-spread implementation of the technology even though some respondents considered it a useful tool for improving winter road conditions and beneficial if implemented at the proper sites.
Respondents identified the following as desirable features for potential future enhancements of FAST:
• Reduced cost • Simplified installation and reduced maintenance needs • Improved system reliability. More work needs to be done to improve the sensor
accuracy and reliability as well as the activation logic. Eliminating or significantly reducing erratic responses to winter events should improve the safety and economic benefits that can be derived from FAST systems.
• Complete automation and better detection of road conditions • User-friendly interfaces • Better integration with RWIS, traffic cameras, weather forecasts and other tools.
Summary of Findings Experience with FAST systems in North America and Europe has revealed a mixed picture. On the one hand, several studies have indicated reductions in mobile operations costs and significant reductions in crash frequency, resulting in favorable benefit-cost ratios. On the other hand, there have been a variety of problems related to activation frequency, system maintenance and training. On balance, North American transportation agencies consider FAST to be an evolving technology, and are not planning significant new installations of FAST in the near future.
Installing a FAST system is complex and the challenges are often site-specific, and difficulties seem to be expected during the operations, particularly in areas related to software, activation process, and pumping system. However, the evaluations cited show that FAST
Page 78
systems can be cost-beneficial if their locations are carefully chosen and if the system is supported with reliable environmental sensors.
Future improvements in system design, hardware, software and installation techniques may help improve the reliability of FAST systems in the United States. As such, FAST systems may become a valuable tool for transportation agencies engaged in winter operations, as they can reduce the number of mobile winter applications and the amount of materials required. By proactively addressing icing problems, FAST systems can help reduce the number of crashes and traffic delays occurring during winter conditions. However, these systems are appropriate only at a highly localized level, and are best viewed as a supplement to mobile winter maintenance operations.
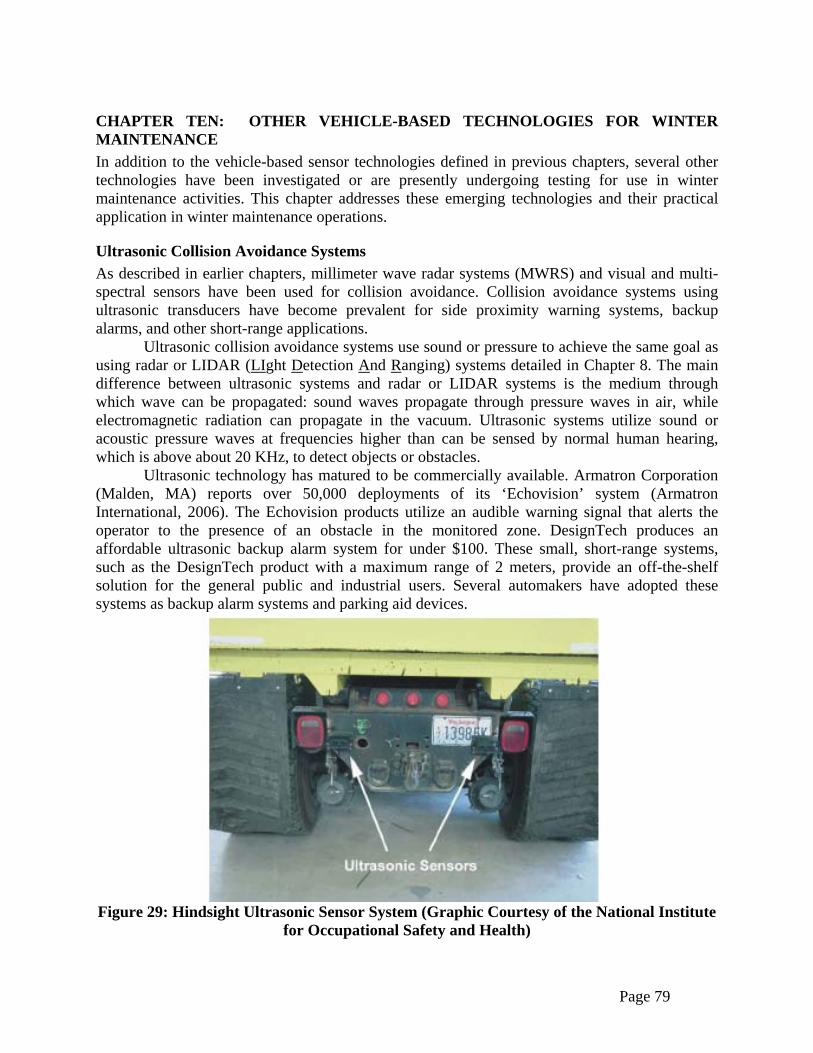
Page 79
CHAPTER TEN: OTHER VEHICLE-BASED TECHNOLOGIES FOR WINTER MAINTENANCE In addition to the vehicle-based sensor technologies defined in previous chapters, several other technologies have been investigated or are presently undergoing testing for use in winter maintenance activities. This chapter addresses these emerging technologies and their practical application in winter maintenance operations.
Ultrasonic Collision Avoidance Systems As described in earlier chapters, millimeter wave radar systems (MWRS) and visual and multi-spectral sensors have been used for collision avoidance. Collision avoidance systems using ultrasonic transducers have become prevalent for side proximity warning systems, backup alarms, and other short-range applications.
Ultrasonic collision avoidance systems use sound or pressure to achieve the same goal as using radar or LIDAR (LIght Detection And Ranging) systems detailed in Chapter 8. The main difference between ultrasonic systems and radar or LIDAR systems is the medium through which wave can be propagated: sound waves propagate through pressure waves in air, while electromagnetic radiation can propagate in the vacuum. Ultrasonic systems utilize sound or acoustic pressure waves at frequencies higher than can be sensed by normal human hearing, which is above about 20 KHz, to detect objects or obstacles.
Ultrasonic technology has matured to be commercially available. Armatron Corporation (Malden, MA) reports over 50,000 deployments of its ‘Echovision’ system (Armatron International, 2006). The Echovision products utilize an audible warning signal that alerts the operator to the presence of an obstacle in the monitored zone. DesignTech produces an affordable ultrasonic backup alarm system for under $100. These small, short-range systems, such as the DesignTech product with a maximum range of 2 meters, provide an off-the-shelf solution for the general public and industrial users. Several automakers have adopted these systems as backup alarm systems and parking aid devices.
Figure 29: Hindsight Ultrasonic Sensor System (Graphic Courtesy of the National Institute
for Occupational Safety and Health)

Page 80
A 2003 report by the Department of Health and Human Services, National Institute for Occupational Safety and Health evaluated backup monitoring equipment and short-range collision avoidance systems in harsh road construction environments. In the report, a Hindsight 20/20 Ultrasonic Sensor System (pictured in Figure 29) from Sonar Safety Systems (Santa Fe, CA) was tested and compared with devices using other sensor types, such as video and radar systems. While not specifically targeting winter maintenance vehicles, the testing did involve limited snow and ice exposure. The sensor was found overly sensitive to dust, which brought up concerns over false alarms in snow and rain. Concerns were also raised regarding the short detection range – 8 ft (2.4 m) – of the system, which would not provide adequate response time (Ruff, 2003). The hindsight detection zone of such sensors is shown in Figure 30.
Figure 30: Hindsight Detection Zone (Graphic Courtesy of the National Institute for Occupational Safety and Health)
A second study examined the effectiveness of ultrasonic technology in avoiding lateral
collision for vehicle and wind speeds lower than 25 mph (40km/hr) at a maximum range of 20 feet (6 m) (Song et al., 2004). In this study, the ultrasonic sensors were able to detect vehicles moving at speeds up to 25 mph (40 km/hr); however, reliable observations were not made for all the distances. To investigate wind effects, the sensors were tested at wind speeds of 21.6 mph (34.8 km/hr) that were generated in different configurations at different vehicle speeds. The ultrasonic sensors gave accurate readings within 2 cm for vehicle speeds of 18.6 mph (30 km/hr) for the detection range of 1.5-15 feet (0.4~4.0 m). When the vehicle speed and the set distance

Page 81
between the vehicle and obstacle were increased, the errors also increased to a maximum of 6 cm for head on wind. The study indicated that ultrasonic sensor collision warning systems perform satisfactorily at lower vehicle and wind speeds (below 40 km/hr for both), and that head-on wind causes larger distance estimation errors than lateral wind.
While ultrasonic technology works well for short-range collision avoidance applications, it tends to experience problems over longer distances. These problems can be attributed to the unfocused nature of the ultrasonic signal, failure to receive echoes from objects with convex or non-uniform surface profiles, and signal attenuation caused by transmitting signals through the air (Jackson and Burton, 2006). Such drawbacks limit the effective application of ultrasonic systems to relatively short-range systems, usually within 20 feet target distance. The Polaroid range-finding system addresses some of these issues by using multiple sound frequencies to increase the probability of signal reflection from a wide range of targets (Jackson and Burton, 2006).
Applicability of ultrasonic technology for winter maintenance vehicles would be more appropriate for lateral collision avoidance at lower speeds, which may be a relatively common scenario for plows clearing snow in the vicinity of guardrails or other fixed objects. The proximity sensors and short-range collision alarms that are now in common use on garbage trucks and transit buses may also have excellent applicability in snowplows, sanding trucks and anti-icing vehicles, providing a measure of safety and a warning system at a low cost, with trivial installation challenges and minimal training requirements. Potential problems with accumulations of spray, snow and ice on sensors mounted to vehicles operating in harsh winter maintenance environments versus potential benefits of installation will need more evaluation by the implementing agency.
GPS-based Slowdown Warning Systems GPS-based slowdown warning systems offer an alternative to the LIDAR-based collision avoidance systems detailed in Chapter 8. Similar to the light-based systems, GPS-based systems are meant to warn when a vehicle is closing too quickly to an object in front of it so that vehicles behind take appropriate measures to avoid crashes or at least decrease their severity. The main disadvantage of light-based collision avoidance systems is the dependence on adequate transmission of light to and from the target. With heavy fog or precipitation (rain and/or snow) light that leaves the transmitter might be immediately reflected back to the receiver and generate false alarms. Unfortunately, it is in low-visibility conditions such as fog, snow, and heavy mixed precipitation that these systems are most needed. The GPS systems must also utilize a communication link with computer-control systems in adjacent vehicles to share position data. GPS-based systems are theoretically less prone to visibility-induced error, although they can be susceptible to atmospheric disturbances that may cause disruption of satellite signal reception.
The slowdown warning system consists of a GPS receiver for location awareness, a laptop computer for data processing, and a wireless transmitter/receiver for coordination with other platoon vehicles. When an abrupt slowdown occurs, a warning signal that includes the past and present trajectory of the decelerating vehicle is broadcast. Other vehicle-borne computers in the platoon assess the relevance of the warning, depending upon their proximity to the slowing vehicle. A warning is issued when a danger is deemed imminent.
GPS-based slowdown warning systems combine the determination of precise vehicle location with a communication system, to convey slow-down warnings to adjacent vehicles and shorten or eliminate driver response time issues in platoons of vehicles. These systems can
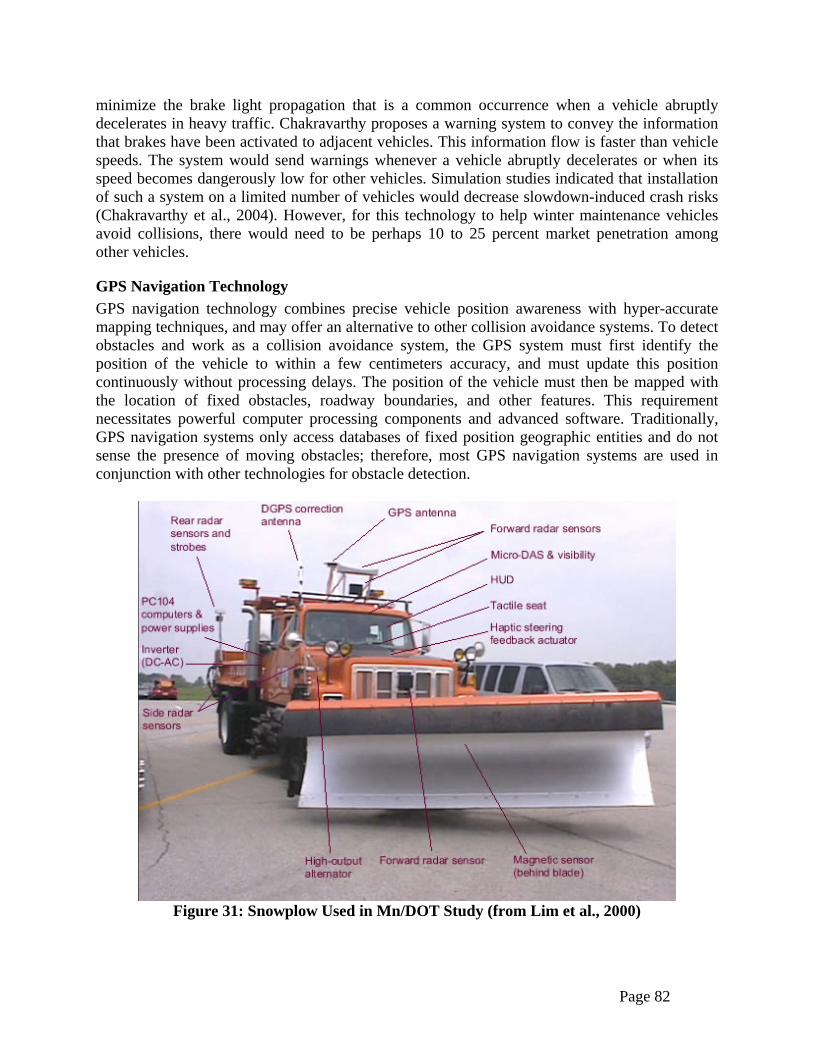
Page 82
minimize the brake light propagation that is a common occurrence when a vehicle abruptly decelerates in heavy traffic. Chakravarthy proposes a warning system to convey the information that brakes have been activated to adjacent vehicles. This information flow is faster than vehicle speeds. The system would send warnings whenever a vehicle abruptly decelerates or when its speed becomes dangerously low for other vehicles. Simulation studies indicated that installation of such a system on a limited number of vehicles would decrease slowdown-induced crash risks (Chakravarthy et al., 2004). However, for this technology to help winter maintenance vehicles avoid collisions, there would need to be perhaps 10 to 25 percent market penetration among other vehicles.
GPS Navigation Technology GPS navigation technology combines precise vehicle position awareness with hyper-accurate mapping techniques, and may offer an alternative to other collision avoidance systems. To detect obstacles and work as a collision avoidance system, the GPS system must first identify the position of the vehicle to within a few centimeters accuracy, and must update this position continuously without processing delays. The position of the vehicle must then be mapped with the location of fixed obstacles, roadway boundaries, and other features. This requirement necessitates powerful computer processing components and advanced software. Traditionally, GPS navigation systems only access databases of fixed position geographic entities and do not sense the presence of moving obstacles; therefore, most GPS navigation systems are used in conjunction with other technologies for obstacle detection.
Figure 31: Snowplow Used in Mn/DOT Study (from Lim et al., 2000)
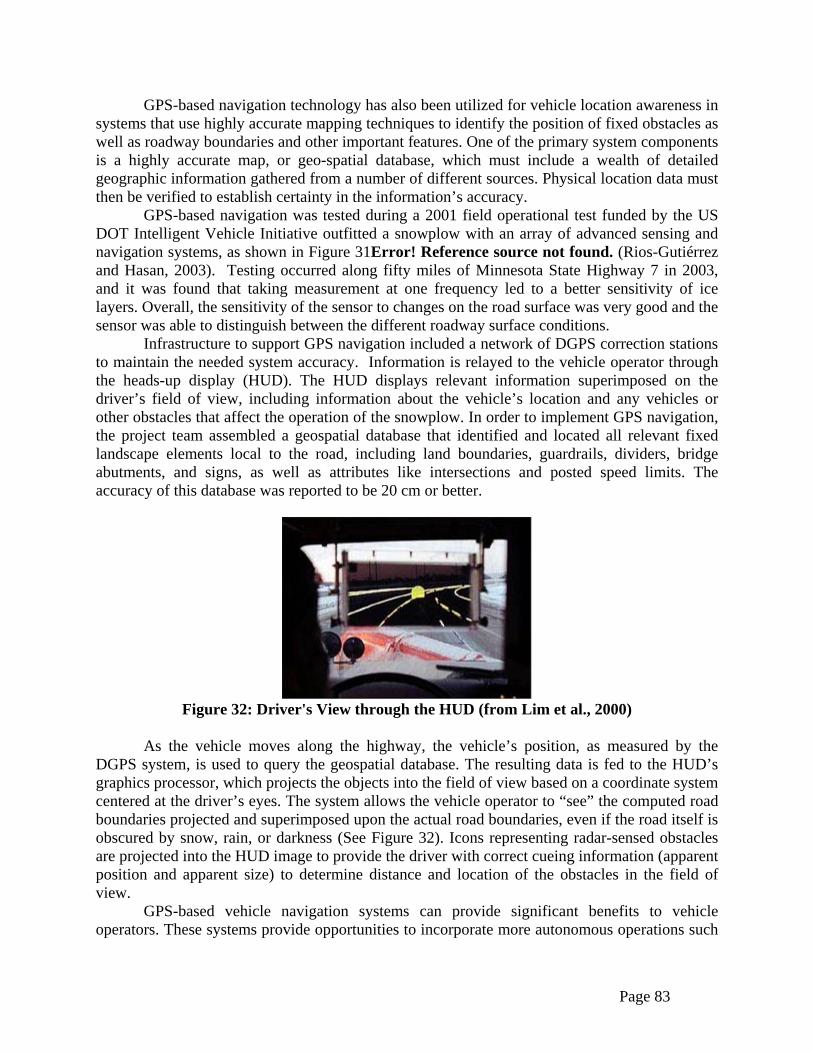
Page 83
GPS-based navigation technology has also been utilized for vehicle location awareness in systems that use highly accurate mapping techniques to identify the position of fixed obstacles as well as roadway boundaries and other important features. One of the primary system components is a highly accurate map, or geo-spatial database, which must include a wealth of detailed geographic information gathered from a number of different sources. Physical location data must then be verified to establish certainty in the information’s accuracy.
GPS-based navigation was tested during a 2001 field operational test funded by the US DOT Intelligent Vehicle Initiative outfitted a snowplow with an array of advanced sensing and navigation systems, as shown in Figure 31Error! Reference source not found. (Rios-Gutiérrez and Hasan, 2003). Testing occurred along fifty miles of Minnesota State Highway 7 in 2003, and it was found that taking measurement at one frequency led to a better sensitivity of ice layers. Overall, the sensitivity of the sensor to changes on the road surface was very good and the sensor was able to distinguish between the different roadway surface conditions.
Infrastructure to support GPS navigation included a network of DGPS correction stations to maintain the needed system accuracy. Information is relayed to the vehicle operator through the heads-up display (HUD). The HUD displays relevant information superimposed on the driver’s field of view, including information about the vehicle’s location and any vehicles or other obstacles that affect the operation of the snowplow. In order to implement GPS navigation, the project team assembled a geospatial database that identified and located all relevant fixed landscape elements local to the road, including land boundaries, guardrails, dividers, bridge abutments, and signs, as well as attributes like intersections and posted speed limits. The accuracy of this database was reported to be 20 cm or better.
Figure 32: Driver's View through the HUD (from Lim et al., 2000)
As the vehicle moves along the highway, the vehicle’s position, as measured by the
DGPS system, is used to query the geospatial database. The resulting data is fed to the HUD’s graphics processor, which projects the objects into the field of view based on a coordinate system centered at the driver’s eyes. The system allows the vehicle operator to “see” the computed road boundaries projected and superimposed upon the actual road boundaries, even if the road itself is obscured by snow, rain, or darkness (See Figure 32). Icons representing radar-sensed obstacles are projected into the HUD image to provide the driver with correct cueing information (apparent position and apparent size) to determine distance and location of the obstacles in the field of view.
GPS-based vehicle navigation systems can provide significant benefits to vehicle operators. These systems provide opportunities to incorporate more autonomous operations such

Page 84
as steering and/or braking to the existing suite of features. Nonetheless, most systems are complex and expensive and require a significant commitment of resources, manpower and time.
Snowplow Blade Position Sensors Winter maintenance operations require careful control of snowplow parameters. Several studies (Bahram, 2002; Booz-Allen and Hamilton Inc., 2000) have addressed various advanced snowplow sensors and features, and provided evaluations. An important element of snowplow operation is the position of the blade or auger with respect to the road surface, guardrail or other roadway hardware, and to the truck.
The Advanced Highway Maintenance and Construction Technology (AHMCT) Program
at the University of California at Davis developed and demonstrated an Advanced Snow Plow (ASP). In addition to collision avoidance devices, the ASP utilized a magnetic sensing system for determining blade position (Ravani, 1999). A similar system was utilized in the Advanced Rotary Plow developed by the California Partners for Advanced Transit and Highways (PATH). This system uses a magnetic sensor system to alert plow operators of the presence of a guardrail, and can then be switched into automatic steering to safely blow away snow within four inches of the rail. The vehicle is equipped with both a plow blade and a snow blower. A single engine rotary snowplow with full hydrostatics was modified to include a computer data acquisition and information processing unit, sensors to measure steering angle and vehicle movements, sensors to measure the field of magnetic markers installed in the roadway, a steering wheel actuator, and a driver-vehicle interface (DVI) (Figure 33).
Two primary technologies are being used in the Advanced Rotary Plow: one detecting the plow’s position relative to the guardrail, and the other providing automatic steering to within 4 inches (10 cm) from the guardrail. Sensors underneath the blower detect magnets on the road
Figure 33: Advanced Rotary Plow (from Tan, 2003)
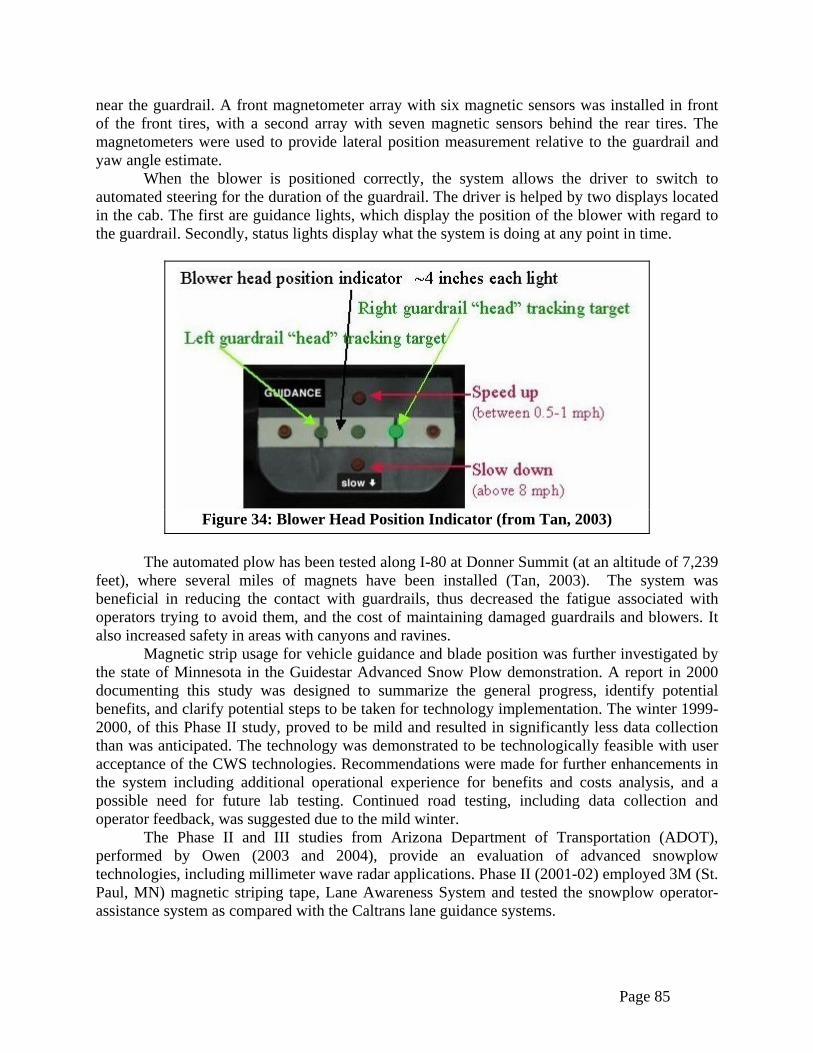
Page 85
near the guardrail. A front magnetometer array with six magnetic sensors was installed in front of the front tires, with a second array with seven magnetic sensors behind the rear tires. The magnetometers were used to provide lateral position measurement relative to the guardrail and yaw angle estimate.
When the blower is positioned correctly, the system allows the driver to switch to automated steering for the duration of the guardrail. The driver is helped by two displays located in the cab. The first are guidance lights, which display the position of the blower with regard to the guardrail. Secondly, status lights display what the system is doing at any point in time.
The automated plow has been tested along I-80 at Donner Summit (at an altitude of 7,239
feet), where several miles of magnets have been installed (Tan, 2003). The system was beneficial in reducing the contact with guardrails, thus decreased the fatigue associated with operators trying to avoid them, and the cost of maintaining damaged guardrails and blowers. It also increased safety in areas with canyons and ravines.
Magnetic strip usage for vehicle guidance and blade position was further investigated by the state of Minnesota in the Guidestar Advanced Snow Plow demonstration. A report in 2000 documenting this study was designed to summarize the general progress, identify potential benefits, and clarify potential steps to be taken for technology implementation. The winter 1999-2000, of this Phase II study, proved to be mild and resulted in significantly less data collection than was anticipated. The technology was demonstrated to be technologically feasible with user acceptance of the CWS technologies. Recommendations were made for further enhancements in the system including additional operational experience for benefits and costs analysis, and a possible need for future lab testing. Continued road testing, including data collection and operator feedback, was suggested due to the mild winter.
The Phase II and III studies from Arizona Department of Transportation (ADOT), performed by Owen (2003 and 2004), provide an evaluation of advanced snowplow technologies, including millimeter wave radar applications. Phase II (2001-02) employed 3M (St. Paul, MN) magnetic striping tape, Lane Awareness System and tested the snowplow operator-assistance system as compared with the Caltrans lane guidance systems.
Figure 34: Blower Head Position Indicator (from Tan, 2003)
Page 86
Application Rate Sensors Sensing the application rate of abrasives, deicers and anti-icers is critical to their effective usage in winter maintenance. Over-application of these materials can result in environmental problems and poor efficiency, while under-application can be ineffective and risky. Application rate sensors are used to measure the amount of snow and ice control materials applied to the roadway. To be accurate, such information must be connected to the vehicle’s speed. Application rate sensors that interface with vehicle speed are relatively mature, and their usage has been discussed at length in several documents (Transportation Association of Canada, 2003).
Application rate control is typically based upon wheel speed, as in units such as the Raven Spray Controls system (Accuspray, 2006). GPS-based systems like those developed for precision agriculture operations by Midwestern Technologies have direct applicability for distribution of abrasives, deicers and anti-icers (Midwest Technologies, 2006). The Midwestern Technologies unit provides a GPS-derived vehicle speed as a RADAR compatible ground speed signal for use with other control systems. This GPS system is presently in use for application rate control with ground speed and location determination in roadside herbicide spray units. Similar functionality is also available from other vendors.
Pavement Surface Treatments Roads can become hazardous during winter weather when frozen precipitation bonds to the road. Winter maintenance agencies have utilized a variety of tools to deal with snow and ice on the road, including proactive anti-icing, application of salts to lower the freezing point, addition of abrasives to increase vehicle traction, and plowing to remove excessive snow. Another approach is to consider treatments to the pavement in order to reduce the likelihood of ice bonding. This is an interesting alternative to FAST, in that it could be applied at select locations, and eliminates the reliance on weather forecasts or sensors for effective anti-icing.
SafeLaneTM overlay, marketed by Cargill Deicing Technology, combines an epoxy with an aggregate of limestone, and is designed to retain anti-icing chemicals for extended periods. The chemicals retained on the surface are expected to prevent ice from bonding to that surface. The overlay increases traffic traction and is expected to last for 15 years, with a material cost estimated at $5-6 per ft2 (Johnson, 2006).
A May 2006 evaluation report commissioned by the manufacturer describes performance of the overlay at nine sites in six states. Using anecdotal evidence and test results, the evaluation reported that there were “no concerns with chemical slickness or slipperiness arose even though chemical was applied on some occasions under weather conditions where such slickness might have been a concern.” The author observed that test sections remained clear of snow or ice under weather conditions when snow and ice were accumulating on control sections, bonding of snow and ice to the pavement was not observed, and that when accumulation did occur on the test sections the accumulation could be controlled by plowing and application of chemicals. The report claims that SafeLaneTM provides both safety and mobility benefits under winter weather conditions, while requiring less chemical usage (Nixon, 2006). The report’s conclusions have some interesting implications, although it is unclear how transferable these benefits would be to other locations where the overlay might be applied.
Summary of Findings This chapter provided a quick overview of several technologies that could used to supplement or substitute for other technologies examined earlier in this report. Ultrasonic transducer technology
Page 87
is a reliable off-the-shelf system that could assist winter maintenance vehicles with lateral collision avoidance challenges. The GPS-based collision avoidance technologies were also reviewed, but these technologies are generally considered to be supplemental to on-board sensors that can detect moving obstacles in real time. Additionally, GPS systems have cost and implementation challenges, requiring investments in precision mapping prior to use. Presently these GPS-based technologies appear to have limited applicability to winter maintenance. Snowplow blade position sensors have been successfully demonstrated and could be valuable in improving plow safety. Application rate sensors are available from a number of vendors, and have been integrated with AVL. Pavement overlay treatments may be a promising alternative to FAST in addressing localized icing challenges.
Page 88
CHAPTER ELEVEN: CONCLUSIONS In regions where precipitation and snowfall is frequent, providing safe driving conditions can be a difficult and cumbersome task for maintenance agencies. Operations often occur in extreme conditions of low visibility and slippery road surfaces, and the operators can face long, stressful shifts. Removing snow and ice from roadways requires a profound understanding of roadway conditions and structures to plan maintenance operations. Knowledge of the exact location of each vehicle with regard to the roadway and detailed characteristics of the roadway surface (e.g. temperature, freezing point, ice presence, salinity) facilitate improved roadway maintenance strategies. Agencies have traditionally “fixed” conditions such as black ice by treating the roadway after the condition exists. However, by using sensor technologies to determine the freezing point and salinity level of the road surface, and treating the roads accordingly (e.g. applying anti-icing chemicals), the formation of black ice may be prevented. Cutting-edge technologies can make the task of maintaining winter more efficient, safer and less costly. Numerous vehicle-based sensor technologies have been developed in recent years to achieve improvements in winter maintenance efficiency and safety.
Conducted through the NCHRP Project 20-7/Task 200, this report synthesizes information obtained from a comprehensive literature review and agency surveys on the state of development of several vehicle-based sensor technologies as well as the fixed automated spray technology (FAST) for winter maintenance. Of these technologies, AVL systems, road surface temperature measuring devices and FAST systems are the only ones that have matured and become fully operational, while the remainders are still in the development and testing phases. While some technologies reviewed may be considered “mainstream”, others have design or reliability issues that may inhibit greater use by transportation agencies. The advent of these technologies, however, has facilitated the management of operations and saved resources and time. Additionally, these technologies assist maintenance agencies in offering a higher level-of-service to roadway users, while being more sensitive to the surrounding environment.
While each of the advanced technologies may be used independently, their greatest benefit can be realized when they are integrated with one another to provide a greater depth of information. Difficulties faced when integrating the technologies included the interference between communication systems, incompatible hardware or software, and others.
Summary of the State-of-the-Practice
Automatic Vehicle Location Automatic vehicle location (AVL), reviewed in Chapter 3, is a technology that integrates vehicle location information with other information from the vehicle to provide temporally and spatially referenced information on a maintenance vehicle’s activities. AVL can assist in storm response through vehicle tracking and dispatching capabilities. It can also guide storm event planning by providing previous storm event histories. AVL can also help agencies simplify tracking and reporting requirements, thus decreasing the paperwork and time required to manage winter maintenance activities.
AVL is perhaps the most widely accepted and established system among the technologies reviewed in this synthesis. Consequently, there is a rich repository of documented experience on lessons learned and best practices. Some of the major themes identified in this synthesis include the need for thoughtful integration of AVL into an existing vehicle fleet and with the variety of

Page 89
expected users and sensor packages, and the need to consider the communications requirements of the various technologies.
Through several years of demonstration and evaluation, many of the problems which plagued earlier AVL deployments, such as sensor protection, communications availability, and GPS accuracy, have been addressed. The level of support from the vendor community has improved as AVL vendors have become flexible, adapting and customizing systems to fit specific customer requirements. Vendors also provide customized maps, statistical analysis, and reports as requested by the customer. AVL users generally plan to sustain or increase their use of the technology, and there are a number of transportation agencies performing AVL pilot projects to further the use of AVL in winter maintenance activities.
Mobile RWIS Technologies Chapters 4, 5 and 6 reviewed three technologies that, together, could be used to create a vehicle-based road weather information system (RWIS). The technologies evaluated in those chapters, if successfully implemented, could be integrated with the AVL to provide improved real-time knowledge of road and environmental conditions throughout a network, and not merely at points where pavement condition data are collected.
Surface temperature measurement devices, reviewed in Chapter 4, use non-contact infrared sensors to absorb infrared emissions from the road surface, and convert this information to a surface temperature. Advantages of using vehicle-mounted surface temperature measuring devices include the ability to measure the exact surface temperature along an entire roadway network and having real-time road surface temperature data to support decisions regarding chemical applications. This leads to optimizing the use of chemicals, and improving the level-of-service experienced by roadway users. Surface temperature measurement devices have matured. Future enhancements in the technology may improve how quickly it responds to changing conditions, as well as how it may successfully be integrated into an AVL platform. The accuracy of available sensors such as infrared surface temperature sensors, and the simplicity of installation have increased maintenance agencies interest in this technology. Numerous agencies are planning on incorporating this technology on their entire fleets.
On-board freezing point and ice-presence detection sensors, discussed in Chapter 5, are not as well established as some of the other technologies reviewed and have not been widely deployed for field use. One promising and relatively well-developed vehicle-mounted sensor technology used to measure freezing point and detect ice presence is Frensor. Similar to the in-pavement active sensors, Frensor contains a Peltier cell and the freezing point temperature is determined through a series of cyclic warming and cooling cycles of the moisture sample collected from the tire spray. There are many potential advantages of using vehicle-mounted freezing point and ice-presence detection sensors, including the ability to map the road surface conditions along an entire roadway network and detect localized ice patches as well as obtaining greater knowledge of the effects of deicing and anti-icing chemicals on the road surface. Frensor was successfully installed and tested on the Highway Maintenance Concept Vehicle; however, the project team identified a few issues related to its maintenance needs to be addressed before widespread deployment becomes possible. Other conceptual designs for measuring freezing point and ice detection have been proposed, but are still under development.
Salinity measuring sensors, reviewed in Chapter 6, can be used to monitor the residual salt concentrations on the road surface, helping maintenance managers make educated decisions related to chemical reapplication. Two main approaches have been demonstrated for this
Page 90
application, by measuring the optical refractive index and electrical conductivity of the moisture sample collected from the tire spray, respectively. Advantages of using vehicle-mounted salinity sensors include monitoring the salt concentration on a road surface along entire stretches of roadways to allow for more accurate chemical application rates, and potentially integrating measurements from salinity sensors to automatic spreader controls to apply the right amount of chemicals at the right time in the right place. Some sensors can monitor the salinity of the road surface even in dry conditions. This is extremely beneficial in the case of anti-icing, when chemicals are applied ahead of a winter storm event. Currently, available technologies are limited, but the technologies that are being tested show great promise for continuous measurement of the salinity of the road surface.
Millimeter Wave Radar Sensors As reviewed in Chapter 7, millimeter wave radar sensors (MWRS) work by sending out electromagnetic waves with wavelengths from 1 to 10 millimeters that reflect off objects in their path, and then detecting the echoes of signals that return. Radar can determine a number of properties of a distant object, such as its distance, speed, direction of motion, and shape. Radar can detect objects out of the range of sight and works in all weather conditions, making it a vital tool for collision warning and avoidance. Advantages of using MWRS systems include detecting obstacles in front of, behind, and to the side of vehicles. Another advantage is that this can be done over long ranges and in extreme conditions such as heavy rain and snowstorms. Research has shown that they provide longer range (300 ft) obstacle detection capabilities that are superior in winter conditions to other technologies such as Ultrasonic, LASER and LIDAR discussed in Chapter 8.
MWRS has had two notable field tests in the United States: RoadViewTM in California, and GuidestarTM in Minnesota. The most prevalent issue limiting widespread use of MWRS systems is the high frequency of false alarms, which may reduce the operator’s confidence in the system. It is important to note that the false alarms are triggered in curves, tight vehicle turns, or by heavy and wet snowfall and are not random false readings by the system itself. While solutions have been explored to minimize the occurrence of false alarms, the MWRS technology is not mature enough to come as a “black box” solution. MWRS systems continue to be refined, reducing the weight, size and cost of the product. Some agencies have installed simpler MWRS systems with a limited user interface that only warns of obstacles while backing up. Operator acceptance of these systems has been positive so far.
Visual and Multi-Spectral Sensors Sensors that utilize electromagnetic energy at various wavelengths, especially in the infrared and visible wavelength spectrum, are common in advanced transportation applications. Multi-modal sensing, or the use of multiple wavelengths or even multiple technologies (e.g., video with acoustic sensing) in a single sensing system, has some attractive attributes for solving a wide range of problems. Many applications using fixed-position roadside sensors have been developed; however, vehicle-mounted visual and multi-spectral sensors used for road condition evaluation and collision avoidance systems are not as mature.
As reviewed in Chapter 8, visual and multi-spectral sensors have been successfully tested in several collision avoidance systems (using LIDAR, thermal imagers, LASER, etc.) as well as roadway condition sensing devices (using visible image sensors, radiometer sensors, LRSS, etc.). Active sensor systems such as LIDAR are commercially available in production vehicles as
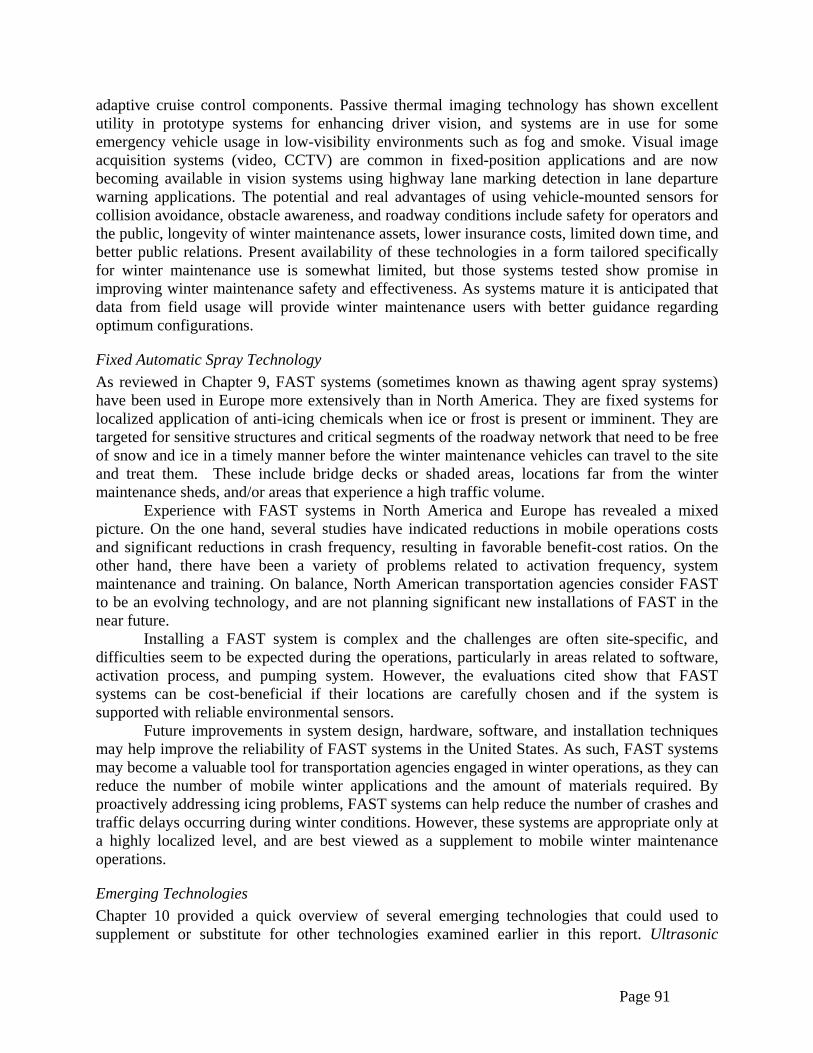
Page 91
adaptive cruise control components. Passive thermal imaging technology has shown excellent utility in prototype systems for enhancing driver vision, and systems are in use for some emergency vehicle usage in low-visibility environments such as fog and smoke. Visual image acquisition systems (video, CCTV) are common in fixed-position applications and are now becoming available in vision systems using highway lane marking detection in lane departure warning applications. The potential and real advantages of using vehicle-mounted sensors for collision avoidance, obstacle awareness, and roadway conditions include safety for operators and the public, longevity of winter maintenance assets, lower insurance costs, limited down time, and better public relations. Present availability of these technologies in a form tailored specifically for winter maintenance use is somewhat limited, but those systems tested show promise in improving winter maintenance safety and effectiveness. As systems mature it is anticipated that data from field usage will provide winter maintenance users with better guidance regarding optimum configurations.
Fixed Automatic Spray Technology As reviewed in Chapter 9, FAST systems (sometimes known as thawing agent spray systems) have been used in Europe more extensively than in North America. They are fixed systems for localized application of anti-icing chemicals when ice or frost is present or imminent. They are targeted for sensitive structures and critical segments of the roadway network that need to be free of snow and ice in a timely manner before the winter maintenance vehicles can travel to the site and treat them. These include bridge decks or shaded areas, locations far from the winter maintenance sheds, and/or areas that experience a high traffic volume.
Experience with FAST systems in North America and Europe has revealed a mixed picture. On the one hand, several studies have indicated reductions in mobile operations costs and significant reductions in crash frequency, resulting in favorable benefit-cost ratios. On the other hand, there have been a variety of problems related to activation frequency, system maintenance and training. On balance, North American transportation agencies consider FAST to be an evolving technology, and are not planning significant new installations of FAST in the near future.
Installing a FAST system is complex and the challenges are often site-specific, and difficulties seem to be expected during the operations, particularly in areas related to software, activation process, and pumping system. However, the evaluations cited show that FAST systems can be cost-beneficial if their locations are carefully chosen and if the system is supported with reliable environmental sensors.
Future improvements in system design, hardware, software, and installation techniques may help improve the reliability of FAST systems in the United States. As such, FAST systems may become a valuable tool for transportation agencies engaged in winter operations, as they can reduce the number of mobile winter applications and the amount of materials required. By proactively addressing icing problems, FAST systems can help reduce the number of crashes and traffic delays occurring during winter conditions. However, these systems are appropriate only at a highly localized level, and are best viewed as a supplement to mobile winter maintenance operations.
Emerging Technologies Chapter 10 provided a quick overview of several emerging technologies that could used to supplement or substitute for other technologies examined earlier in this report. Ultrasonic
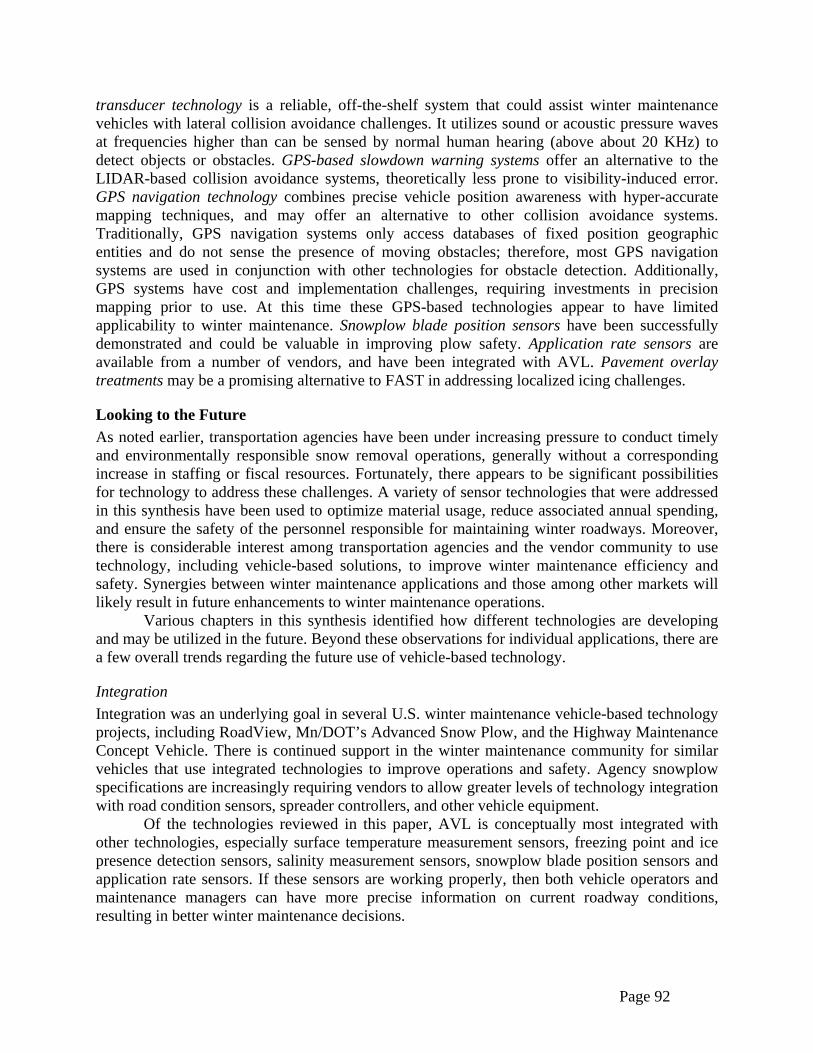
Page 92
transducer technology is a reliable, off-the-shelf system that could assist winter maintenance vehicles with lateral collision avoidance challenges. It utilizes sound or acoustic pressure waves at frequencies higher than can be sensed by normal human hearing (above about 20 KHz) to detect objects or obstacles. GPS-based slowdown warning systems offer an alternative to the LIDAR-based collision avoidance systems, theoretically less prone to visibility-induced error. GPS navigation technology combines precise vehicle position awareness with hyper-accurate mapping techniques, and may offer an alternative to other collision avoidance systems. Traditionally, GPS navigation systems only access databases of fixed position geographic entities and do not sense the presence of moving obstacles; therefore, most GPS navigation systems are used in conjunction with other technologies for obstacle detection. Additionally, GPS systems have cost and implementation challenges, requiring investments in precision mapping prior to use. At this time these GPS-based technologies appear to have limited applicability to winter maintenance. Snowplow blade position sensors have been successfully demonstrated and could be valuable in improving plow safety. Application rate sensors are available from a number of vendors, and have been integrated with AVL. Pavement overlay treatments may be a promising alternative to FAST in addressing localized icing challenges.
Looking to the Future As noted earlier, transportation agencies have been under increasing pressure to conduct timely and environmentally responsible snow removal operations, generally without a corresponding increase in staffing or fiscal resources. Fortunately, there appears to be significant possibilities for technology to address these challenges. A variety of sensor technologies that were addressed in this synthesis have been used to optimize material usage, reduce associated annual spending, and ensure the safety of the personnel responsible for maintaining winter roadways. Moreover, there is considerable interest among transportation agencies and the vendor community to use technology, including vehicle-based solutions, to improve winter maintenance efficiency and safety. Synergies between winter maintenance applications and those among other markets will likely result in future enhancements to winter maintenance operations.
Various chapters in this synthesis identified how different technologies are developing and may be utilized in the future. Beyond these observations for individual applications, there are a few overall trends regarding the future use of vehicle-based technology.
Integration Integration was an underlying goal in several U.S. winter maintenance vehicle-based technology projects, including RoadView, Mn/DOT’s Advanced Snow Plow, and the Highway Maintenance Concept Vehicle. There is continued support in the winter maintenance community for similar vehicles that use integrated technologies to improve operations and safety. Agency snowplow specifications are increasingly requiring vendors to allow greater levels of technology integration with road condition sensors, spreader controllers, and other vehicle equipment.
Of the technologies reviewed in this paper, AVL is conceptually most integrated with other technologies, especially surface temperature measurement sensors, freezing point and ice presence detection sensors, salinity measurement sensors, snowplow blade position sensors and application rate sensors. If these sensors are working properly, then both vehicle operators and maintenance managers can have more precise information on current roadway conditions, resulting in better winter maintenance decisions.
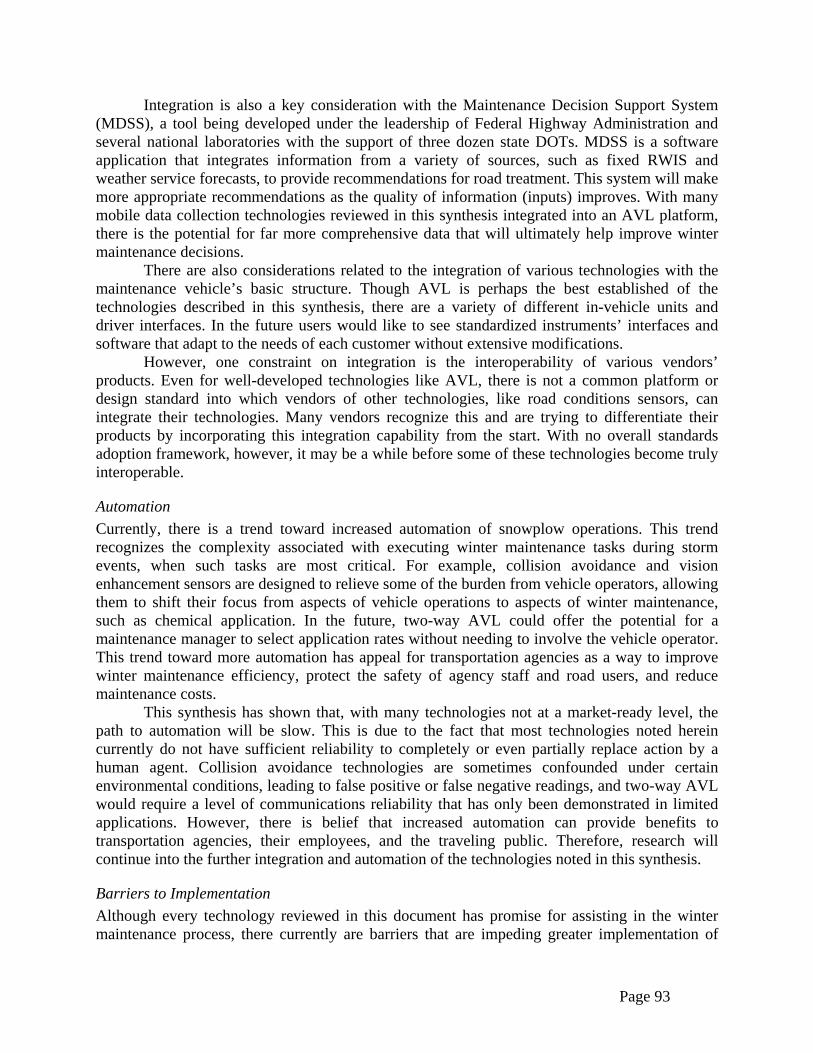
Page 93
Integration is also a key consideration with the Maintenance Decision Support System (MDSS), a tool being developed under the leadership of Federal Highway Administration and several national laboratories with the support of three dozen state DOTs. MDSS is a software application that integrates information from a variety of sources, such as fixed RWIS and weather service forecasts, to provide recommendations for road treatment. This system will make more appropriate recommendations as the quality of information (inputs) improves. With many mobile data collection technologies reviewed in this synthesis integrated into an AVL platform, there is the potential for far more comprehensive data that will ultimately help improve winter maintenance decisions.
There are also considerations related to the integration of various technologies with the maintenance vehicle’s basic structure. Though AVL is perhaps the best established of the technologies described in this synthesis, there are a variety of different in-vehicle units and driver interfaces. In the future users would like to see standardized instruments’ interfaces and software that adapt to the needs of each customer without extensive modifications.
However, one constraint on integration is the interoperability of various vendors’ products. Even for well-developed technologies like AVL, there is not a common platform or design standard into which vendors of other technologies, like road conditions sensors, can integrate their technologies. Many vendors recognize this and are trying to differentiate their products by incorporating this integration capability from the start. With no overall standards adoption framework, however, it may be a while before some of these technologies become truly interoperable.
Automation Currently, there is a trend toward increased automation of snowplow operations. This trend recognizes the complexity associated with executing winter maintenance tasks during storm events, when such tasks are most critical. For example, collision avoidance and vision enhancement sensors are designed to relieve some of the burden from vehicle operators, allowing them to shift their focus from aspects of vehicle operations to aspects of winter maintenance, such as chemical application. In the future, two-way AVL could offer the potential for a maintenance manager to select application rates without needing to involve the vehicle operator. This trend toward more automation has appeal for transportation agencies as a way to improve winter maintenance efficiency, protect the safety of agency staff and road users, and reduce maintenance costs.
This synthesis has shown that, with many technologies not at a market-ready level, the path to automation will be slow. This is due to the fact that most technologies noted herein currently do not have sufficient reliability to completely or even partially replace action by a human agent. Collision avoidance technologies are sometimes confounded under certain environmental conditions, leading to false positive or false negative readings, and two-way AVL would require a level of communications reliability that has only been demonstrated in limited applications. However, there is belief that increased automation can provide benefits to transportation agencies, their employees, and the traveling public. Therefore, research will continue into the further integration and automation of the technologies noted in this synthesis.
Barriers to Implementation Although every technology reviewed in this document has promise for assisting in the winter maintenance process, there currently are barriers that are impeding greater implementation of
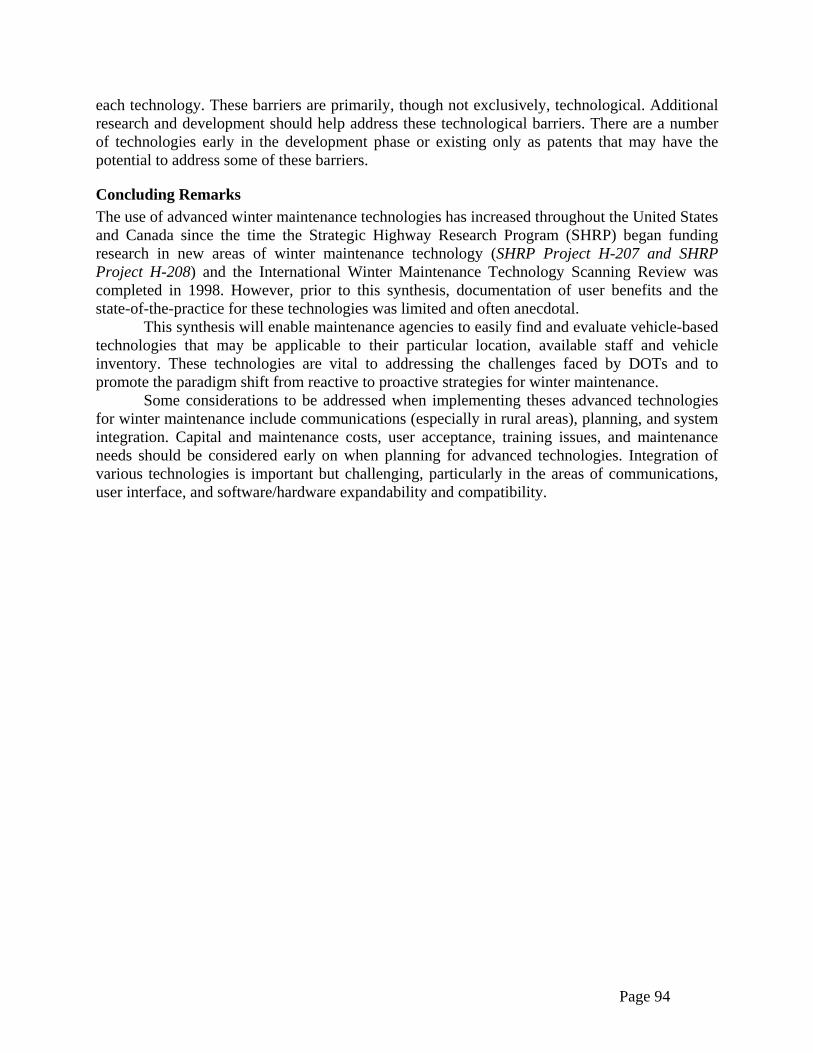
Page 94
each technology. These barriers are primarily, though not exclusively, technological. Additional research and development should help address these technological barriers. There are a number of technologies early in the development phase or existing only as patents that may have the potential to address some of these barriers.
Concluding Remarks The use of advanced winter maintenance technologies has increased throughout the United States and Canada since the time the Strategic Highway Research Program (SHRP) began funding research in new areas of winter maintenance technology (SHRP Project H-207 and SHRP Project H-208) and the International Winter Maintenance Technology Scanning Review was completed in 1998. However, prior to this synthesis, documentation of user benefits and the state-of-the-practice for these technologies was limited and often anecdotal.
This synthesis will enable maintenance agencies to easily find and evaluate vehicle-based technologies that may be applicable to their particular location, available staff and vehicle inventory. These technologies are vital to addressing the challenges faced by DOTs and to promote the paradigm shift from reactive to proactive strategies for winter maintenance.
Some considerations to be addressed when implementing theses advanced technologies for winter maintenance include communications (especially in rural areas), planning, and system integration. Capital and maintenance costs, user acceptance, training issues, and maintenance needs should be considered early on when planning for advanced technologies. Integration of various technologies is important but challenging, particularly in the areas of communications, user interface, and software/hardware expandability and compatibility.
Page 95
REFERENCES ABI Research, " Vehicle Safety Systems: World Markets for Stability Control, Adaptive
Cruise Control, Lane Departure Warning, and Other Next-Generation Technologies", Vehicle Safety Systems Market Research Report, 2005.
Accuspray, [Online]. Available: https://www.accuspray.com/productpages/raven_speed_sensors.php [30 July 2006].
AeroTech Telub, [Online]. Available: http://www.rwis.net/index.html [10 July 2006].
Allen, L. W. III., “United States Nationwide Differential Global Positioning System”, GPS Solutions, Volume 2, Issue 4, pp. 1-6, 1999.
Anderson, E. G., Southeast Michigan Snow and Ice Management System, Final Evaluation at End of Winter Season Year 2004, Advanced Information Engineering Services, Inc., August 2004.
Andrle, S. J., Kroeger, D., Gieseman, D., and N. Burdine, Highway Maintenance Concept Vehicle, Final Report: Phase Four, Center for Transportation Research and Education, Iowa State University, June 2002.
Anthony, B. T., “Winter Maintenance in Vaughan: Improving Operations and Communication through an AVL System,” APWA Reporter Online, October 2004 [Online]. Available: http://www.apwa.net/Publications/Reporter/ReporterOnline/index.asp?DISPLAY=ISSUE&ISSUE_DATE=102004&ARTICLE_NUMBER=915 [October 2004].
Armatron International, 15 Highland Avenue, Malden MA 02148 [Online]. Available: http://www.echovision.net/features.html [30 July 2006].
AT&T Wireless, Keeping Roads Clear and Costs Down with a Wireless Fleet Management Solution, Municipal Fleet Management Case Study, 2004.
Bahram, R., et. al., “A Rural Field Test of the RoadView System”, California Advanced Highway Maintenance and Construction Technology Research Center (AHMCT) Research Report UCD-ARR-02-06-30-01, June 2002.
Barrett, M. L. and J. G. Pigman, Evaluation of Automated Bridge Deck Anti-Icing System, Kentucky Transportation Cabinet Research Report # KTC-01-26/KH36-97-1F, December 2001.
Bell, G. T., Nixon, W. A., and R. D. Stowe, A Synthesis to Improve the Design and Construction of Colorado’s Bridge Anti-icing Systems, Final Report prepared for the Colorado Department of Transportation. Report No. CDOT-DTD-R-2005-19, April 2006.
Boehm, K., Road Recognition System, United States Patent application 20050252285, Assignee: DaimlerChrysler AG, Stuttgart, DE, November 17, 2005.
Booz-Allen & Hamilton Inc., “Phase II Evaluation-Trunk Highway 19 Snowplow Demonstration Project-Minnesota DOT Intelligent Vehicle Initiative-Winter 199-2000”, report to the Minnesota DOT, November 2000.
Bristow, J., “Findings on the In-Laboratory Evaluation of ODOT Infrared Camera”, Western Transportation Institute, 2004.

Page 96
Buckler, D.R. and G.E. Granato, Assessing Biological Effects from Highway Runoff Constituents, U.S. Department of Interior and U.S. Geological Survey Open-File Report 99-240, 1999.
Campbell Scientific, Inc., Forecasting Ice Formation on Italian Road Surfaces, Measurement News, AP No. 030, August 2004, [Online]. Available: http://www.apogee-inst.com/pdf_files/30italianice.pdf [11 July 2006].
Canadian Coast Guard, Canada Fisheries and Oceans, GPS/DGPS Made Easy, Ottawa, Ontario, Canada, 2005 [Online]. Available: http://www.ccg-gcc.gc.ca/dgps/guide/guide3_e.htm [22 June 2006].
CERF, Evaluation of the FreezeFree Anti-Icing System, Final Report by the Civil Engineering Research Foundation, Prepared for the U.S. Federal Highway Administration, April 22, 2005.
Chellappa, R., Qian G., Zheng Q., “Vehicle detection and tracking using acoustic and video sensors” Center for Autom. Res., Maryland Univ., College Park, MD, 17 May 2004.
Christillin, M., Ardemagni, C., and G. Trombella, “The Buthier Viaduct – A Different Approach to Road Network Maintenance in Winter,” Proceedings of the Tenth PIARC International Winter Road Congress, Vol.2, Lulea, Sweden, March 1998, 297-306 pp.
Commercial Vehicle Group, [Online]. Available: http://www.cvgrp.com/uploadedFiles/Pages/140_-_Electrical_Mechanical/Roadwatch_brochure(1).pdf [11 July 2006].
CompassCom, “CompassCom and SierraWireless Help Aurora (Colo.) Public Works Migrate to Next Generation Technology,” Press Release, September 22, 2003.
Control Products, Inc., “Solving Today’s Problems for Tomorrow’s Safety,” [Online]. Available: http://www.control-products-inc.com/PDFs/99j-prn.pdf [11 July 2006].
Cuelho, E., and Kack, D., “Needs Assessment and Cost/Benefit Analysis of the Roadview Advanced Snow Plow Technology System”, California Advanced Highway Maintenance and Construction Technology Research Center (AHMCT) Research Report UCD-ARR-02-06-30-02, June 2002.
Daniel, C., Oregon Department of Transportation, e-mail communications, June 28, 2006.
Delphi Corporation, [Online]. Available: http://investor.delphi.com/phoenix.zhtml?c=105758&p=irol-newsArticle&ID=755683&highlight= [30 July 2006].
Doherty, J.A., Vehicle Mounted Travel Surface and Weather Condition Monitoring System, United States Patent 6977597, December 20, 2005.
Eaton Vorad, [Online]. Available: http://www.vorad.com/jsp/home.jsp [30 July 2006].
Environment Canada, Code of Practice for the Environmental Management of Road Salts, EPS 1/CC/5, 2004.

Page 97
FHWA, City of Aurora, Colorado Maintenance Vehicle Management System, Best Practices for Road Weather Management Version 2.0, May 2003 [Online]. Available: http://www.ops.fhwa.dot.gov/weather/best_practices/casestudies/004.pdf [22 June 2006].
FHWA, Manual of Practice for an Effective Anti-icing Program: A Guide For Highway Winter Maintenance Personnel, U.S. Federal Highway Administration. Publication No. FHWA-RD-95-202, June 1996.
FHWA, Corrosion Costs and Preventative Strategies in the United States, Federal Highway Administration. Publication No. FHWA-RD-01-156, 2002.
FHWA, How Do Weather Events Impact Roads, Federal Highway Administration [Online]. Available: http://ops.fhwa.dot.gov/Weather/q1_roadimpact.htm [3 May 2005].
Friar, S. and R. Decker, Evaluation of a Fixed Anti-Icing Spray System, Transportation Research Record No. 1672, Paper # 99-0839, Transportation Research Board, Washington, D.C., 1999.
Garrick, N. W., Nikolaidis, N. P., and J. Luo, A Portable Method to Determine Chloride Concentration on Roadway Pavements, Final report: NETCR 17, Dept of Civil and Environmental Engineering, University of Connecticut, September 2002.
Gladbach, B., Efficacy and Economic Efficiency of Thawing Agents Spray Systems (Final Report), Translated from the Original German Text, December 1993 [Online]. Available: http://www.smartbridge.okstate.edu/new_information/fixed_automated_spraying_systems/GermanAnti-icingReport.pdf [10 July 2006].
Global Sensor Systems Incorporated [Online]. http://www.globalsensorsystems.com/index.asp [28 July 2006].
Gonzalez, P. J., Building Quality Intelligent Transportation Systems Through Systems Engineering, Report FHWA-OP-02-046, Intelligent Transportation Systems Joint Program Office, U.S. Department of Transportation, April 2002, 81 pp.
Griesinger, M., Process for Determining the Condition of a Road Surface and System for Implementing the Process, United States Patent 6049387, April 11, 2000.
Harling, G., Zhang, R., Pope, T., Picard, F., and A. Azelmad, Non-contacting Temperature Sensing Device, United States Patent Application 20010013831, Assignee: Goal Electronics, Inc., Quebec, August 16, 2001.
Howard County Maryland Bureau of Highways, Bureau of Highways: Snow Removal, 2005 [Online]. Available: http://www.co.ho.md.us/DPW/DPW_SnowRemoval.htm [22 September 2005].
Institute for Safety Analysis, Benefits and Costs in the Use of Salt to Deice Highways, U.S. Department of Transportation, Washington, D.C., 1976.
ITS Joint Program Office, ITS Deployment Statistics 2004 – Fleet Management Using Automatic Vehicle Location (AVL), U.S. Department of Transportation, Washington, D.C., 2005 [Online]. Available: http://www.itsdeployment.its.dot.gov/ResultsStateNational.asp?ID=805 [22 June 2006].
Page 98
ITS Joint Program Office, Architecture – ITS, U.S. Department of Transportation, Washington, D.C., 2006 [Online]. Available: http://www.its.dot.gov/arch/index.htm [22 June 2006].
Iteris Inc., Automotive Sensors [Online]. Available: http://www.iteris.com/av/na_commercial.html [30 July 2006].
Iwata, H., Yamamoto, K., Nishiduka, K., Higashi, H., Nakao, S., and Y. Miyazaki, “Development of an On-Vehicle Type Salinity Measurement Sensor for Controlling Winter Roadway Surfaces,” International Journal of ITS Research, Vol. 2, No. 1, October 2004, 297-306 pp.
Jackson, J. and Burton, J., “Ultrasonics and Robotics”, [Online]. Available: http://www.seattlerobotics.org/encoder/may97/sonar2.html, [30 July 2006].
Java Location Services Newsletter, “Howard County Bureau of Highways, Web-enabled Snowplow Tracking System”, 2003 [Online]. Available: http://www.jlocationservices.com/Newsletter/April.03/ESRI.AVL.pdf [April 2003].
Jet Propulsion Laboratory, National Aeronautics and Space Administration, How Does It Work?, 1998 [Online]. Available: http://scign.jpl.nasa.gov/learn/gps2.htm [22 June 2006].
Johnson, C., I-35W and Mississippi River Bridge Anti-Icing Project: Operational Evaluation Report, Minnesota Department of Transportation, Report # 2001-22, Office of Metro Maintenance Operations, 2001.
Johnson, G., "Smart Road Can De-Ice Itself: Pavement Overlay Releases Chemical in Bad Weather". The Calgary Herald, February 3, 2006. Available: http://www.cargillsafelane.com/documents/SafeLane_Pub_CalgaryNews.pdf. [31 July 2006].
Jones, Willie D., “Keeping Cars From Crashing,” 2001 [Online] Available: http://spectrum.ieee.org/archive/1418 [28 July 2006].
Joshi, P., A Mobile Road Condition Sensor as Winter Maintenance Aid, Final Report for ITS-IDEA Project 85, Transportation Research Board, National Research Council, Washington D.C., May 2002.
Kavaya, M., [Online]. Available: http://www.ghcc.msfc.nasa.gov/sparcle/sparcle_tutorial.html [30 July 2006].
Kawana, M., et. al., “The Application of Visible Image Road Surface Sensors to Winter Road Management”, Society of Automotive Engineers of Japan, Issue Number 3888, October 2005.
Keranen, P.F., “Automated Bridge Deicers for Increased Safety and Decreased Salt Use in Minnesota,” Proceedings of the Tenth PIARC International Winter Road Congress, Lulea, Sweden, Vol. 2, March 1998, 487-497 pp.
Keranen, P. “Automated Bridge Deicer in Minnesota,” Paper presented at the Transportation Research Board Fifth International Snow and Ice Technology Symposium, Roanoke, Virginia, September 4-7, 2000.
Khattak, A.J., Pesti, G., and V. Kannan, Guidelines for Prioritizing Bridge Deck Anti-Icing System Installations. Phase I and Phase II Report, Final Report SPR-P1-03-P555,

Page 99
University of Nebraska, Lincoln, NE, March 2003 [Online]. Available: http://www.ctre.iastate.edu/pubs/midcon2003/KhattakAntiicing.pdf [10 July 2006].
Khattak A., and Shamayleh, H., “Highway Safety Assessment through Geographic Information System-Based Data Visualization”, J. Comp. in Civ. Engrg., Volume 19, Issue 4, pp. 407-411, October, 2005.
Knollhoff, D. S., Takle E. S., Gallus W. A., and D. Burkheimer, “Use of Pavement Temperature Measurements for Winter Maintenance Decisions,” 1998 Transportation Conference Proceedings, 1998.
Kroeger, D. and R. Sinhaa, “Business Case for Winter Maintenance Technology Applications: Highway Maintenance Concept Vehicle,” Proceedings of the Sixth International Symposium on Snow Removal and Ice Control Technology, Transportation Research Circular Number E-C063, Spokane, Washington, June 7-9, 2004, 323-331 pp.
Lim H., Newstrom, B., Shankwitz, C., and Donath, M., "A Conformal Augmented Head Up Display for Driving under Low Visibility Conditions," Proceedings of the 5th International Symposium on Advanced Vehicle Control, Ann Arbor, August 2000.
Lipnick, M. Automated Bridge Anti-Icing System Interstate 68 over Street Road Allegany County, Maryland, Report published by the Winter Materials and Technologies Evaluation Team, State Highway Administration, Maryland Department of Transportation, July 2001.
McBride, J., Washington State Department of Transportation, telephone communications July 12, 2006.
McCall, B. M., and D. Kroeger, Highway Maintenance Concept Vehicle, Final Report: Phase Three, Center for Transportation Research and Education, Iowa State University, March 2001.
McFall, K., and T. Niittula, “Results of AV Winter Road Condition Sensor Prototype”, Proceedings from the 11th Standing International Road Weather Congress, Sapporo, Japan, January 2002.
Meier, G., Roppenecker, G., and Wurmthaler, C., “Automatic Lateral Vehicle Guidance Using Tracking Control,” Intelligent Vehicles Symposium, IEEE 2004.
Merrimac Industries Incorporation [Online]. Available: http://www.merrimacind.com/news/pr012202.html [30 July 2006].
Midwest Technologies, [Online]. Available: http://www.mid-tech.com/ms/midtech/ [30 July 2006].
Misener, J., "Investigation of an Optical Method to Determine the Presence of Ice on Road Surfaces." Working Papers: Paper UCB-ITS-PWP-98-17, California Partners for Advanced Transit and Highways (PATH), University of California, Berkeley, 1998 [Online]. Available: http://repositories.cdlib.org/its/path/papers/UCB-ITS-PWP-98-17
Missouri Department of Transportation, Test and Analysis 97-10: Mirror Mounted Pavement Temperature Sensors, Missouri Department of Transportation and IVAN CORP Research and Design Engineer’s Office, RDT 99-007, April 1999.

Page 100
Moritz, K. “Effectivity and Economy of De-icing Agent Spraying Systems,” Proceedings of the Tenth PIARC International Winter Road Congress, Lulea, Sweden, Vol. 2, March 1998, 307-315 pp.
Mussato, B.T. et al., Guidelines for the Selection of Snow and Ice Control Materials to Mitigate Environmental Impacts, Prepared for the NCHRP Project 6-16, 2003.
Myllyla, J., and Y. Pilli-Sihvola, “Floating Car Road Weather Monitoring,” 11th SIRWEC International Road Weather Congress, Sapporo, Japan, January 2002.
NCHRP, Report on the 1998 Scanning Review of European Winter Service Technology, National Cooperative Highway Research Program, Research Results Digest, Number 238, April 1999.
NHTSA, “Automotive Collision Avoidance System Field Operational Test,” Technical Report DOT HS 809 886,. NHTSA, US DOT, May 2005.
Nixon, W., “An Analysis of the Performance of the Safelane™ Overlay during Winter 2005-06” Submitted to: Bob Persichetti, Cargill, May 2006.
O’Keefe, K., and Shi, X., “Anti-icing and Pre-wetting: Improved Methods for Winter Highway Maintenance in North America,” Proceedings of the Transportation Research Board Annual Meeting, Washington, D.C., January 22-26, 2006.
Oak Ridge National Laboratory, ITS 2004 National Survey: Collecting Environmental/Pavement Data to Support Operational Decisions, Oak Ridge National Laboratory, Center for Transportation Analysis, prepared for the U.S. Department of Transportation’s ITS Joint Program Office, 2004 [Online]. Available: http://www.itsdeployment.its.dot.gov/ResultsStateNational.asp?ID=1151 [11 July 2006].
Omron Automotive, “Omron’s Introduces Laser Radar Sensor for Cruise Control that Automatically Adjusts Speed and Distance”, Novi, Michigan, 2005 [Online]. Available: http://www.omronauto.com/PDF/laser_radar_release%202.11.02%20Website.pdf [30 July 2006].
Paulsen, T., and Schmokel, P., “Laser Road Surface Sensor,” Proceeding of the 12th SIRWEC Conference, Germany, 2004.
Pinet, M., Comfort, T., and M. Griff, “Anti-Icing on Structures Using Fixed Automated Spray Technology (FAST)”. Paper presented at the Annual Conference of the Transportation Association of Canada, Halifax, Nova Scotia, May 1, 2001 [Online]. Available: http://www.mto.gov.on.ca/english/engineering/anti_ice/anti_ice.htm [28 June 2006].
Prakash, J., “A Mobile Road Condition Sensor as Winter Maintenance Aid”, Transportation Research Board, National Research Council Final Report for ITS-IDEA Project 85, May 2002.
PWRI, 2000. Test Ride and Exhibition at PWRI [Online]. Available: http://www.ahsra.or.jp/demo2000/eng/demo_e/pwri.htm [30 July 2006].
Pyde, D., “One Fleet for 1 Bridge,” Roads & Bridges Magazine, 43(4), April 2005 [Online]. Available: http://www.roadsbridges.com/rb/index.cfm/powergrid/rfah=%7Ccfap=/CFID/3391397/CFTOKEN/93547197/fuseaction/showArticle/articleID/5988 [10 July 2006].
Page 101
Ravani, B. et. al., “Advanced Snow Plow Development and Demonstration: Phase I: Driver Assistance”, Advanced Highway Maintenance and Construction Technology (AHMCT) Research Report, UCD-ARR-99-06-30-03, June 30, 1999.
Redman, B., Arete Associates Sherman Oaks CA , “Real-Time Obstacle Detection Using A Streak Tube Imaging LIDAR (STIL)” Final rept. 21 May-20 Nov 1999.
Reed, J., and B. Barbour, Remote Passive Road Ice Sensor System (RPRISS), Final Report for ITS-IDEA-34, Transportation Research Board, National Research Council, Washington D.C., September 1997.
Rendon, E., Method and system for detecting potential icy conditions on roads, US patent 5416476, May 16, 1995.
Rios-Gutiérrez, F. and Hasan, M. “Survey and Evaluation of Ice/Snow Detection Technologies”, Northland Advanced Transportation Systems Research Laboratories, 2003.
Road Commission for Oakland County, SEMSIM is Improving Interagency Coordination, Southeast Michigan Snow and Ice Management, Beverly Hills, Michigan, 2002 [Online]. Available: http://www.rcocweb.org/home/semsim.asp?page=coord [2006, June 22].
Roadware Group, Incorporated, http://spectrum.ieee.org/archive/1418 [28 July 2006]. Roosevelt, D. S., Hanson, R. A., and W. M. Campenni, Lessons Learned from a Pilot
Project of an Automatic Vehicle Location System in an Urban Winter Maintenance Operations Setting, Virginia Transportation Research Council, April 2002.
Roosevelt, D. S., A Bridge Deck Anti-Icing System in Virginia: Lessons Learned from a Pilot Study, Virginia Transportation Research Council Report No. VTRC 04-R26, June 2004.
Ruff, T., “Evaluation of Systems to Monitor Blind Areas Behind Trucks Used in Road Construction and Maintenance: Phase 1”, Report of Investigations #9660, Department of Health and Human Services, National Institute for Occupational Safety and Health (NIOSH), 2003.
Sakk, E., et. al, “Remote Sensors for Pavements Ice Detection Phase II SBIR Option”, Final Report, Innovative Dynamics, Ithaca New York, October 2001.
Salt Institute, Highway Deicing and Anti-icing for Safety and Mobility, [Online]. Available: http://www.saltinstitute.org/30.html [3 May 2005].
Scott, B., Minge, E., and S. Peterson, The Aurora Consortium: Laboratory and Field Studies of Pavement Temperature Sensors, Final Report: MN/RC – 2005-44, SRF Consulting Group, Inc., Minneapolis, MN, November 2005 [Online]. Available: http://www.lrrb.org/PDF/200544.pdf
Seiler, P., Song, B., Hedrick, J.K., “Development of a Collision Avoidance System”, Society of Automotive Engineers 98PC-417, 1998.
Shankwitz, C., Infrared Sensors for Driver Assistive Systems for Specialty Vehicles, Including Snowplows [Online]. Available: http://www.its.umn.edu/research/proposal/P2003020.html [30 July 2006].
Shao, J., Lister, P. J., Hart, G. D., and B. H. Pearson, “Thermal Mapping: Reliability and Repeatability,” Meteorological Applications, Vol. 3, 1996, 325-330 pp.
Shi, X., “The Use of Road Salts for Highway Winter Maintenance: An Asset Management Perspective,” 2005 ITE District 6 Annual Meeting, Kalispell, Montana, July 10-13,
Page 102
2005 [Online]. Available: http://www.coe.montana.edu/wti/wwwshare/corrosion/Highway_Winter_Mainteance_Asset_Management.pdf.
SICOP Fixed, Automated Anti-icing Spraying Systems, Snow and Ice Pooled Fund Cooperative Program, March 4, 2002 [Online]. Available: http://www.sicop.net/FAST%20Project.pdf [10 July 2006].
Smith, D. E., McCall, B. M., Kroeger, D., Zogg, J., Simodynes, T., and K. Giese, Highway Maintenance Concept Vehicle, Final Report: Phase Two, Center for Transportation Research and Education, Iowa State University, 1998.
Smith, D. E., Simodynes, T., and C. Monsere, Highway Maintenance Concept Vehicle, Final Report: Phase One, Center for Transportation Research and Education, Iowa State University, 1997.
Spies, B., and P. Woodgate, Salinity Mapping Methods in the Australian Context, Published by the Department of the Environment and Heritage; and Agriculture, Fisheries and Forestry, June 2005.
Staples, J.M., L. Gamradt, O. Stein, and X. Shi, Recommendations for Winter Traction Materials Management on Roadways Adjacent to Bodies of Water, October 25, 2004 [Online]. Available: http://www.coe.montana.edu/wti/wti/pdf/425081_Final_Report.pdf.
Stewart, R. “Fixed Automated Spray Technology (FAST) on Knudsen’s Corner Interim Report”. Utah Department of Transportation Research Division, Report No. UT-04.03, May 2004.
Stowe, R. “A Benefit/Cost Analysis of Intelligent Transportation System Applications for Winter Maintenance”. Paper # 01-0158, presented at the 80th Annual Meeting of the Transportation Research Board, Washington, D.C., January 7-11, 2001.
Strong, C. and J. Wolenetz, Pilot Test of Automatic Vehicle Location on Snow Plows: Technical Memorandum 1: Recommendations for Pilot Test, Western Transportation Institute, Montana State University, Bozeman, Montana, September 2005, 59 pp.
Tabler, D. R., “Effect of Blowing Snow and Snow Fences on Pavement Temperature and Ice Formation,” Proceedings of the Sixth International Symposium on Snow Removal and Ice Control Technology, Transportation Research Circular Number E-C063, Spokane, Washington, June 7-9, 2004, 401-413 pp.
Tabler, D. R., Comparison of RoadWatch® and Control Products, Inc., Model 999J Infrared Sensors, 2003 [Online]. Available: http://www.control-products-inc.com/PDFs/comparison.pdf [11 July 2006].
Talcott, S., “Let it snow, let it snow, let it snow: Snowplow drivers acknowledge Global Positioning is here to stay, expect fewer kinks,” Boston Globe, December 20, 2004.
Tan, H., “Advanced Rotary Plow”, California Partners for Advanced Transit and Highways, 2003. [Online]. Available: http://www.path.berkeley.edu/PATH/Research/blower/ [30 July 2006].
Page 103
Thirumalai, K., “Rural ITS Applications for Snow Maintenance and Winter Hazard Mitigation,” Proceedings of the 5th World Congress on Intelligent Transportation Systems, Seoul, Korea, 1998.
Tran, V. H., Road Recognition System, United States Patent 6807473, Assignee: Continental Teves, Inc., Auburn Hills, MI, October 19, 2004.
Transportation Association of Canada “Syntheses of Best Practices Road Salt Management”, Salt Management Plans, 2003.
Transportation Research Board, National Research Council, “New Ideas for Intelligent Transportation Systems: An Annual Progress Report of the ITS IDEA Program”, June 1999, 86 pp.
TRW Automotive: Active Safety Systems. [Online]. Available: http://www.trw.com/productsandtechnologies/main/0,1085,9_31%5E2%5E31%5E31,00.html. [29 July 2006].
Turner-Fairbank Highway Research Center, An Investigation of The Use of Global Positioning System (GPS) Technology and Its Augmentation Within State and Local Transportation Departments, Report FHWA-RD-00-093, Federal Highway Administration, McLean, Va., July 2000, 64 pp.
U.S. Department of Transportation, “What Have We Learned about Intelligent Transportation Systems?” December 2000 [Online]. Available: http://www.its.dot.gov/jpodocs/repts_te/@9w01!.pdf [22 June 2006].
U.S. Department of Transportation, “National ITS Architecture – Market Packages,” 2005 [Online]. Available: http://www.iteris.com/itsarch/html/mp/mpindex.htm [22 June 2006].
Vaisala, TimeStep Thermal Maps, [Online]. Available: http://www.vaisala.com/businessareas/solutions/roadandrailweather/products/vaisalathermalmappingandrouteoptimization/vaisalatimestepthermalmap [11 July 2006].
Ward, B. L. “Evaluation of a Fixed Anti-Icing Spray Technology (FAST) System,” Paper presented at the 81st Annual Meeting of the Transportation Research Board, Washington, D.C., January 2002
Yoda, S., Okabe, H., Takagi, J., and T. Yamashita, "Road Surface Recognition Sensor using an Optical Spatial Filter," Proceedings of the Intelligent Vehicles '95 Symposium, September 1995, 253-257 pp.
Zambelli, M., “Implementation of a Steady Plant for Automatically Spraying Chemical De-Icer on the Lausanne Bypass,” Proceedings of the Tenth PIARC International Winter Road Congress, Lulea, Sweden, Vol. 2, March 1998, 447-458 pp.

Page 104
APPENDIX A: SURVEY INSTRUMENTS
Preliminary Survey: Vehicle-Based Winter Roadway Maintenance Technologies This survey is part of a project for the National Cooperative Highway Research
Program (NCHRP) to inquire about Vehicle-Based Winter Roadway Maintenance Technologies that will help determine the status of testing or use of certain winter roadway maintenance technologies.
Thanks in advance for participating! 1. Please enter your name, job title, contact information (email and phone number) and
the name of the organization you are working for (Your personal information will be kept confidential)
2. Which of the following describes best the type of organization you work for? Federal Agency State Agency County AgencyCity AgencyPlanning AgencyRecreational ServiceEmergency Response ServiceLaw EnforcementPublic TransportationOther (please specify) 3. Which of the following best describes your responsibilities? OperationsMaintenancePlanningAdvisoryDevelopmentProductionManagementOther (please specify)

Page 105
4. Please indicate the familiarity of your organization with the following Winter Roadway Maintenance Technologies
Never heard of
Heard of but have never
used
Used in pilot project but no longer in use
Currently in pilot project
Regularly used
Not sure/Don't
know
Does your organization use AVL (Automatic Vehicle Location)?Does your organization use On-Board Freezing Point ?Does your organization use Ice-Presence Detection Systems?Does your organization use Surface Temperature Measuring Devices?Does your organization use MWRS (Millimeter Wavelength Radar Sensors)?Does your organization use Salinity Measuring Sensors?Does your organization use Visual and Multi-Spectral Sensors?Does your organization use FAST (Fixed Automatic Spray Technology)?
Thank you for completing our survey! 5. May we follow-up with you (through email or phone call) to discuss your answers in
further details? Please, feel free to email me Please, give me a call No, thanks Other (please specify) 6. If your answer for the previous question was “No, Thanks” or if you think that another
person besides you in your organization is more appropriate to answer our questions, please give us their contact information.
Thank you very much for taking the time to answer our questions; we appreciate your
participation.
Page 106
Automatic Vehicle Location Questionnaire Extent
1. When did your agency start using automatic vehicle location (AVL)?
2. What is the extent of your agency’s deployment of AVL? (feasibility testing-demonstration,
pilot test, regional deployment, full-scale deployment; approximate number of vehicles, percent of maintenance sections)
Planning
3. Why did your agency select AVL as part of your agency’s winter maintenance program? What specific problem(s) did your agency hope to solve, and what outcomes or benefits were envisioned?
Selection and Design
4. Describe the technological components involved in your AVL system.
In-vehicle user interface Vehicle sensors integrated with in-vehicle unit Vehicle location method (e.g. GPS) Communications (e.g. cellular, satellite) Central software Other
5. Why are you using this particular configuration for your AVL system?
Operations and Maintenance
6. Describe specifically how your agency uses AVL.
7. Using a 1-to-10 scale, with 1 being “no training/novice” and 10 being “expert”, how much
experience do operators and managers need to effectively use AVL? Please explain.
Ranking Explanation Operators Managers
8. What are the initial costs (capital or implementation) of using AVL?
Cost estimate or range Types of costs incurred
9. What are the costs and activities for operations and maintenance associated with using AVL?
Page 107
Cost estimate or range Types of costs incurred Maintenance needs
Evaluation
10. What are the advantages your agency experienced while using AVL? Under what conditions (road, weather, traffic, communications) is AVL most beneficial?
11. Has any formal evaluation of the benefits of AVL to your agency been conducted (e.g.
benefit-cost analysis, customer surveys)? If so, could you provide us with a copy of the findings?
12. What problems or issues did your agency face (past or present) in terms of developing,
testing or deploying AVL, and how were they solved?
13. If your agency could start over, what would your agency do differently in terms of planning,
procuring, testing, or deploying AVL?
Future
14. Looking into the future, does your agency plan to increase, maintain or decrease deployment levels? Why?
15. What type of innovation(s) in AVL would be most beneficial to your agency over the next
five or ten years?
Other
16. Are there other innovative vehicle-based technologies that your agency uses or is considering using for winter highway maintenance? If so, please list them.
Please provide your name, agency, e-mail address and phone number, so that if we have
further questions, we may contact you.
Name:
Agency:
Phone:
E-mail:
Page 108
Surface Temperature Measurement Devices Questionnaire Extent
1. When did your agency start using surface temperature sensors?
2. What is the extent of your agency’s deployment of surface temperature sensors?
(feasibility testing-demonstration, pilot test, regional deployment, full-scale deployment; approximate number of vehicles, percent of maintenance sections)
Planning
3. Why did your agency select surface temperature sensors as part of your agency’s winter maintenance program? What specific problem(s) did your agency hope to solve, and what outcomes or benefits were envisioned?
Selection and Design
4. What particular surface temperature sensor configuration is your agency currently using? Why?
Operations and Maintenance
5. Describe specifically how your agency uses surface temperature sensors.
6. Using a 1-to-10 scale, with 1 being “no training/novice” and 10 being “expert”, how
much experience do operators and managers need to effectively use surface temperature sensors? Please explain.
Ranking Explanation Operators Managers
7. What are the initial costs (capital or implementation) of using surface temperature sensors?
Cost estimate or range Types of costs incurred
8. What are the costs and activities for operations and maintenance associated with using surface temperature sensors?
Cost estimate or range Types of costs incurred Maintenance needs

Page 109
Evaluation
9. What are the advantages your agency experienced while using surface temperature sensors? Under what conditions (road, weather, traffic, communications) are surface temperature sensors most beneficial?
10. Has any formal evaluation of the benefits of surface temperature sensors to your agency
been conducted (e.g. benefit-cost analysis, customer surveys)? If so, could you provide us with a copy of the findings?
11. What problems or issues did your agency face (past or present) in terms of developing,
testing or deploying surface temperature sensors, and how were they solved?
12. If your agency could start over, what would your agency do differently in terms of
planning, procuring, testing, or deploying surface temperature sensors?
Future
13. Looking into the future, does your agency plan to increase, maintain or decrease deployment levels? Why?
14. What type of innovation(s) in surface temperature sensors would be most beneficial to
your agency over the next five or ten years?
Other
15. Are there other innovative sensor technologies that your agency uses or is considering using for winter highway maintenance? If so, please list them.
Please provide your name, agency, e-mail address and phone number, so that if we have
further questions, we may contact you.
Name:
Agency:
Phone:
E-mail:
Page 110
On-Board Freezing Point and Ice Presence Detection Systems Questionnaire Extent
1. When did your agency start using freezing-point and ice-presence sensor technologies?
2. What is the extent of your agency’s deployment of freezing-point and ice-presence sensor
technologies? (feasibility testing-demonstration, pilot test, regional deployment, full-scale deployment; approximate number of vehicles, percent of maintenance sections)
Planning
3. Why did your agency select freezing-point and ice-presence sensor technologies as part of your agency’s winter maintenance program? What specific problem(s) did your agency hope to solve, and what outcomes or benefits were envisioned?
Selection and Design
4. What particular freezing-point and ice-presence sensor configuration is your agency currently using? Why?
Operations and Maintenance
5. Describe specifically how your agency uses freezing-point and ice-presence sensor technologies.
6. Using a 1-to-10 scale, with 1 being “no training/novice” and 10 being “expert”, how
much experience do operators and managers need to effectively use freezing-point and ice-presence sensor technologies? Please explain.
Ranking Explanation Operators Managers
7. What are the initial costs (capital or implementation) of using freezing-point and ice-presence sensor technologies?
Cost estimate or range Types of costs incurred
8. What are the costs and activities for operations and maintenance associated with using freezing-point and ice-presence sensor technologies?
Cost estimate or range Types of costs incurred Maintenance needs

Page 111
Evaluation
9. What are the advantages your agency experienced while using freezing-point and ice-presence sensor technologies? Under what conditions (road, weather, traffic, communications) are freezing-point and ice-presence sensor technologies most beneficial?
10. Has any formal evaluation of the benefits of freezing-point and ice-presence sensor
technologies to your agency been conducted (e.g. benefit-cost analysis, customer surveys)? If so, could you provide us with a copy of the findings?
11. What problems or issues did your agency face (past or present) in terms of developing,
testing or deploying freezing-point and ice-presence sensor technologies, and how were they solved?
12. If your agency could start over, what would your agency do differently in terms of
planning, procuring, testing, or deploying freezing-point and ice-presence sensor technologies?
Future
13. Looking into the future, does your agency plan to increase, maintain or decrease deployment levels? Why?
14. What type of innovation(s) in freezing-point and ice-presence sensor technologies would
be most beneficial to your agency over the next five or ten years?
Other
15. Are there other innovative sensor technologies that your agency uses or is considering using for winter highway maintenance? If so, please list them.
Please provide your name, agency, e-mail address and phone number, so that if we have
further questions, we may contact you.
Name:
Agency:
Phone:
E-mail:

Page 112
Salinity Measurement Sensors Questionnaire Extent
1. When did your agency start using salinity sensors?
2. What is the extent of your agency’s deployment of salinity sensors? (feasibility testing-
demonstration, pilot test, regional deployment, full-scale deployment; approximate number of vehicles, percent of maintenance sections)
Planning
3. Why did your agency select salinity sensors as part of your agency’s winter maintenance program? What specific problem(s) did your agency hope to solve, and what outcomes or benefits were envisioned?
Selection and Design
4. What particular salinity sensor configuration is your agency currently using? Why?
Operations and Maintenance
5. Describe specifically how your agency uses salinity sensors.
6. Using a 1-to-10 scale, with 1 being “no training/novice” and 10 being “expert”, how
much experience do operators and managers need to effectively use salinity sensors? Please explain.
Ranking Explanation Operators Managers
7. What are the initial costs (capital or implementation) of using salinity sensors?
Cost estimate or range Types of costs incurred
8. What are the costs and activities for operations and maintenance associated with using salinity sensors?
Cost estimate or range Types of costs incurred Maintenance needs

Page 113
Evaluation
9. What are the advantages your agency experienced while using salinity sensors? Under what conditions (road, weather, traffic, communications) are salinity sensors most beneficial?
10. Has any formal evaluation of the benefits of salinity sensors to your agency been
conducted (e.g. benefit-cost analysis, customer surveys)? If so, could you provide us with a copy of the findings?
11. What problems or issues did your agency face (past or present) in terms of developing,
testing or deploying salinity sensors, and how were they solved?
12. If your agency could start over, what would your agency do differently in terms of
planning, procuring, testing, or deploying salinity sensors?
Future
13. Looking into the future, does your agency plan to increase, maintain or decrease deployment levels? Why?
14. What type of innovation(s) in salinity sensors would be most beneficial to your agency
over the next five or ten years?
Other
15. Are there other innovative sensor technologies that your agency uses or is considering using for winter highway maintenance? If so, please list them.
Please provide your name, agency, e-mail address and phone number, so that if we have
further questions, we may contact you.
Name: Agency: Phone: E-mail:

Page 114
Millimeter Wave Radar Sensor (MWRS) Questionnaire Extent
1. When did your agency start using millimeter wavelength radar sensors (MWRS)?
2. What is the extent of your agency’s deployment of MWRS? (feasibility testing-
demonstration, pilot test, regional deployment, full-scale deployment; approximate number of vehicles, percent of maintenance sections)
Planning
3. Why did your agency select MWRS as part of your agency’s winter maintenance program? What specific problem(s) did your agency hope to solve, and what outcomes or benefits were envisioned?
Selection and Design
4. What MWRS technology (e.g., portable, truck-mounted) is your agency currently using? Why?
Operations and Maintenance
5. Describe specifically how your agency uses MWRS.
6. Using a 1-to-10 scale, with 1 being “no training/novice” and 10 being “expert”, how
much experience do operators and managers need to effectively use MWRS? Please explain.
Ranking Explanation Operators Managers
7. What are the initial costs (capital or implementation) of using MWRS?
Cost estimate or range Types of costs incurred
8. What are the costs and activities for operations and maintenance associated with using MWRS?
Cost estimate or range Types of costs incurred Maintenance needs

Page 115
Evaluation
9. What are the advantages your agency experienced while using MWRS? Under what conditions (road, weather, traffic, communications) is MWRS most beneficial?
10. Has any formal evaluation of the benefits of MWRS to your agency been conducted (e.g.
benefit-cost analysis, driver surveys)? If so, could you provide us with a copy of the findings?
11. What problems or issues did your agency face (past or present) in terms of developing,
testing or deploying MWRS, and how were they solved?
12. If your agency could start over, what would your agency do differently in terms of
planning, procuring, testing, or deploying MWRS?
Future
13. Looking into the future, does your agency plan to increase, maintain or decrease deployment levels? Why?
14. What type of innovation(s) in MWRS would be most beneficial to your agency over the
next five or ten years?
Other
15. Are there other innovative vehicle-based technologies that your agency uses or is considering using for winter highway maintenance? If so, please list them.
Please provide your name, agency, e-mail address and phone number, so that if we have
further questions, we may contact you.
Name:
Agency:
Phone:
E-mail:

Page 116
Visual and Multi-Spectral Sensors (VMSS) Questionnaire Extent
1. When did your agency start using visual and multi-spectral sensors (VMSS)?
2. What is the extent of your agency’s deployment of VMSS? (feasibility testing-
demonstration, pilot test, regional deployment, full-scale deployment; approximate number of vehicles, percent of maintenance sections)
Planning
3. Why did your agency select VMSS as part of your agency’s winter maintenance program? What specific problem(s) did your agency hope to solve, and what outcomes or benefits were envisioned?
Selection and Design
4. What particular VMSS configuration (e.g., visual, audio, radio radiation; portable [location], road embedded) is your agency currently using? Why?
Operations and Maintenance
5. Describe specifically how your agency uses VMSS.
6. Using a 1-to-10 scale, with 1 being “no training/novice” and 10 being “expert”, how
much experience do operators and managers need to effectively use VMSS? Please explain.
Ranking Explanation Operators Managers
7. What are the initial costs (capital or implementation) of using VMSS?
Cost estimate or range Types of costs incurred
8. What are the costs and activities for operations and maintenance associated with using VMSS?
Cost estimate or range Types of costs incurred Maintenance needs

Page 117
Evaluation
9. What are the advantages your agency experienced while using VMSS? Under what conditions (road, weather, traffic, communications) is VMSS most beneficial?
10. Has any formal evaluation of the benefits of VMSS to your agency been conducted (e.g.
benefit-cost analysis, customer surveys)? If so, could you provide us with a copy of the findings?
11. What problems or issues did your agency face (past or present) in terms of developing,
testing or deploying VMSS, and how were they solved?
12. If your agency could start over, what would your agency do differently in terms of
planning, procuring, testing, or deploying VMSS?
Future
13. Looking into the future, does your agency plan to increase, maintain or decrease deployment levels? Why?
14. What type of innovation(s) in VMSS would be most beneficial to your agency over the
next five or ten years?
Other
15. Are there other innovative vehicle-based technologies that your agency uses or is considering using for winter highway maintenance? If so, please list them.
Please provide your name, agency, e-mail address and phone number, so that if we have
further questions, we may contact you.
Name:
Agency:
Phone:
E-mail:

Page 118
Fixed Automatic Spray Technology (FAST) Questionnaire Extent
1. When did your agency start using fixed automated spray technology (FAST)?
2. What is the extent of your agency’s deployment of FAST? (feasibility testing-
demonstration, pilot test, regional deployment, full-scale deployment; approximate number of systems)
Planning
3. Why did your agency select FAST as part of your agency’s winter maintenance program? What specific problem(s) did your agency hope to solve, and what outcomes or benefits were envisioned?
Selection and Design
4. What particular FAST configuration (e.g., automated or remotely controlled anti-icing) is your agency currently using? Why?
Operations and Maintenance
5. Describe specifically how your agency uses FAST.
6. Using a 1-to-10 scale, with 1 being “no training/novice” and 10 being “expert”, how
much experience do operators and managers need to effectively use FAST? Please explain.
Ranking Explanation Operators Managers
7. What are the initial costs (capital or implementation) of using FAST?
Cost estimate or range Types of costs incurred
8. What are the costs and activities for operations and maintenance associated with using FAST?
Cost estimate or range Types of costs incurred Maintenance needs

Page 119
Evaluation
9. What are the advantages your agency experienced while using FAST? Under what conditions (road, weather, traffic, communications) is FAST most beneficial?
10. Has any formal evaluation of the benefits of FAST to your agency been conducted (e.g.
benefit-cost analysis, customer surveys)? If so, could you provide us with a copy of the findings?
11. What problems or issues did your agency face (past or present) in terms of developing,
testing or deploying FAST, and how were they solved?
12. If your agency could start over, what would your agency do differently in terms of
planning, procuring, testing, or deploying FAST?
Future
13. Looking into the future, does your agency plan to increase, maintain or decrease deployment levels? Why?
14. What type of innovation(s) in FAST would be most beneficial to your agency over the
next five or ten years?
Other
15. Are there other innovative sensor technologies that your agency uses or is considering using for winter highway maintenance? If so, please list them.
Please provide your name, agency, e-mail address and phone number, so that if we have
further questions, we may contact you.
Name:
Agency:
Phone:
E-mail:
Page 120
Follow-up Survey on Vehicle-Based Winter Roadway Maintenance Technologies
I. AVL Experience 1. What was your user experience with Automatic Vehicle Location (Positive, Neutral, or
Negative)? And Why? 2. Your contact information (name, title, organization, email, and phone number) II. Vehicle-Mounted Freezing Point and Ice-Presence Detection Systems (not RWIS) 1. What was your user experience with Vehicle-Mounted Freezing Point and Ice-
Presence Detection Systems (Positive, Neutral, or Negative)? And Why? 2. Your contact information (name, title, organization, email, and phone number) III. Vehicle-Mounted Surface Temperature Measurement Devices (not RWIS) 1. What was your user experience with Vehicle-Mounted Surface Temperature
Measurement Devices (Positive, Neutral, or Negative)? And Why? 2. Your contact information (name, title, organization, email, and phone number) IV. Millimeter Wave Radar Sensor for Winter Maintenance 1. What was your user experience with Millimeter Wave Radar Sensor for Winter
Maintenance (Positive, Neutral, or Negative)? And Why? 2. Your contact information (name, title, organization, email, and phone number) V. Vehicle-Mounted Salinity Measurement Sensors 1. What was your user experience with Vehicle-Mounted Salinity Measurement Sensors
(Positive, Neutral, or Negative)? And Why? 2. Your contact information (name, title, organization, email, and phone number) VI. Vehicle-Mounted Visual and Multi-Spectral Sensors to Detect Roadway Condition 1. What was your user experience with Vehicle-Mounted Visual and Multi-Spectral
Sensors to Detect Roadway Condition (Positive, Neutral, or Negative)? And Why? 2. Your contact information (name, title, organization, email, and phone number) VII. Fixed Automatic Spray Technology

Page 121
1. What was your user experience with Fixed Automatic Spray Technology (Positive,
Neutral, or Negative)? And Why? 2. Your contact information (name, title, organization, email, and phone number)
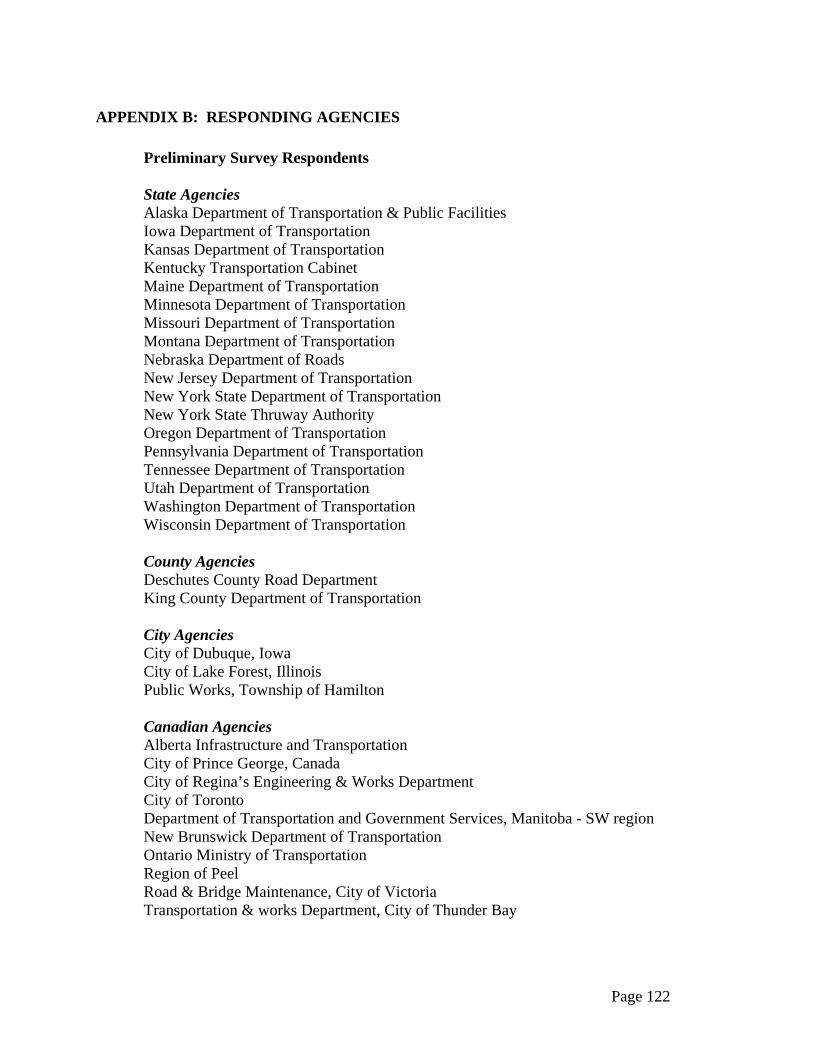
Page 122
APPENDIX B: RESPONDING AGENCIES Preliminary Survey Respondents State Agencies Alaska Department of Transportation & Public Facilities Iowa Department of Transportation Kansas Department of Transportation Kentucky Transportation Cabinet Maine Department of Transportation Minnesota Department of Transportation Missouri Department of Transportation Montana Department of Transportation Nebraska Department of Roads New Jersey Department of Transportation New York State Department of Transportation New York State Thruway Authority Oregon Department of Transportation Pennsylvania Department of Transportation Tennessee Department of Transportation Utah Department of Transportation Washington Department of Transportation Wisconsin Department of Transportation County Agencies Deschutes County Road Department King County Department of Transportation City Agencies City of Dubuque, Iowa City of Lake Forest, Illinois Public Works, Township of Hamilton Canadian Agencies Alberta Infrastructure and Transportation City of Prince George, Canada City of Regina’s Engineering & Works Department City of Toronto Department of Transportation and Government Services, Manitoba - SW region New Brunswick Department of Transportation Ontario Ministry of Transportation Region of Peel Road & Bridge Maintenance, City of Victoria Transportation & works Department, City of Thunder Bay
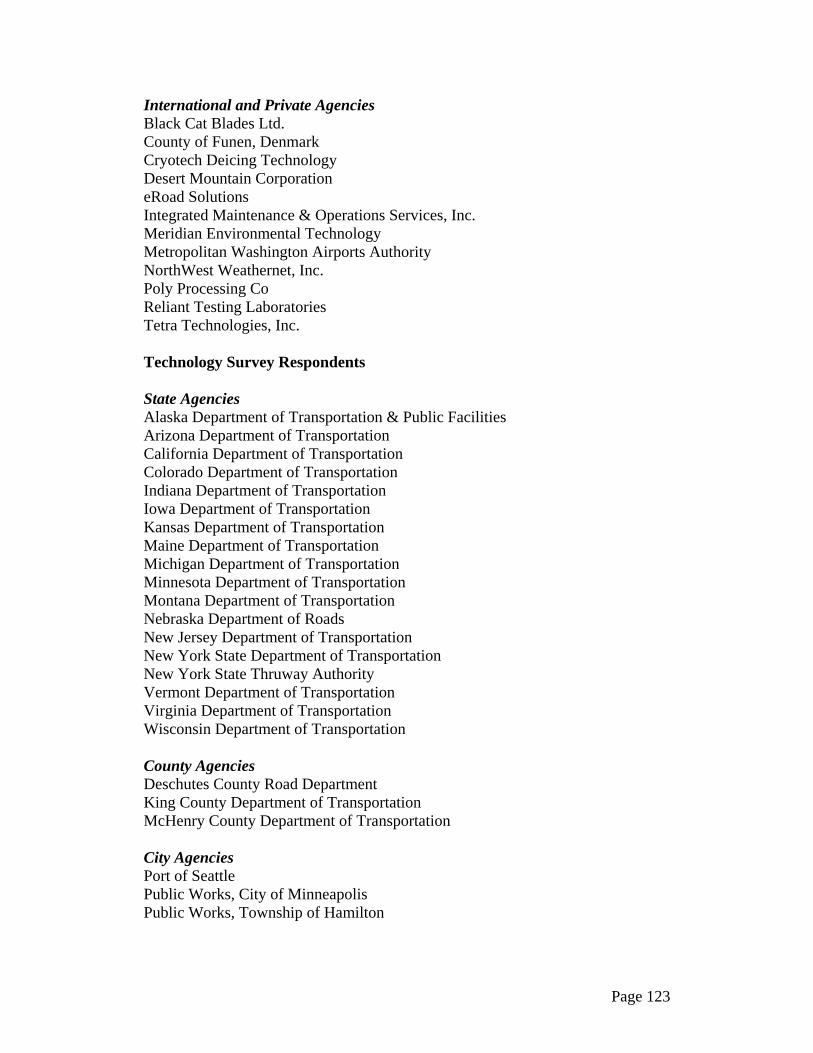
Page 123
International and Private Agencies Black Cat Blades Ltd. County of Funen, Denmark Cryotech Deicing Technology Desert Mountain Corporation eRoad Solutions Integrated Maintenance & Operations Services, Inc. Meridian Environmental Technology Metropolitan Washington Airports Authority NorthWest Weathernet, Inc. Poly Processing Co Reliant Testing Laboratories Tetra Technologies, Inc. Technology Survey Respondents State Agencies Alaska Department of Transportation & Public Facilities Arizona Department of Transportation California Department of Transportation Colorado Department of Transportation Indiana Department of Transportation Iowa Department of Transportation Kansas Department of Transportation Maine Department of Transportation Michigan Department of Transportation Minnesota Department of Transportation Montana Department of Transportation Nebraska Department of Roads New Jersey Department of Transportation New York State Department of Transportation New York State Thruway Authority Vermont Department of Transportation Virginia Department of Transportation Wisconsin Department of Transportation County Agencies Deschutes County Road Department King County Department of Transportation McHenry County Department of Transportation City Agencies Port of Seattle Public Works, City of Minneapolis Public Works, Township of Hamilton

Page 124
Canadian Agencies Ontario Ministry of Transportation Alberta Infrastructure and Transportation City of Lake Forest Region of Peel International Agencies Federal Highway Research Institute, Germany Follow-up Survey Respondents State Agencies New York State Department of Transportation Iowa Department of Transportation Illinois Department of Transportation Wisconsin Department of Transportation Utah Department of Transportation Kentucky Transportation Cabinet Arizona Department of Transportation Indiana Department of Transportation Missouri Department of Transportation California Department of Transportation County Agencies Deschutes County Road Department City Agencies Public Works, Township of Hamilton Public Works, West Des Moines Public Works, Village of Wilmette Town of Deerfield, New Hampshire City of Lake Forest, Illinois Canadian Agencies City of Edmonton, Canada Public Works, Region of Peel