vegetative life on venus? or investigations with algae
TRANSCRIPT
VEGETATIVE LIFE ON VENUS? OR I N V E S T I G A T I O N S WITH ALGAE WHICH GROW UNDER PURE C 0 2 IN HOT ACID MEDIA
AND AT ELEVATED PRESSURES*
JOSEPH SECKBACH and W. F. LIBBY Institute of Geophysics and Planetary Physics and Dept. of Chemistry, University of California at
Los Angeles, Calif, U.S.A.
Abstract. Experiments are described with algae grown in a new environment of pure C0 2 under pressure and in an acidic nutrient medium at elevated temperatures. One species found in hot-springs was observed to grow. If the planet Venus has acidic polar seas as we suggest, they may harbor photosynthetic life.
1. Introduction
A. THE POSSIBILITIES OF LIFE ON VENUS
Studies on the survival and growth of terrestrial life forms in simulated extraterrestrial environments have been attempted in several laboratories. However, to our knowledge little, if any, research has been reported concerning an environment close to that existing on Venus. In size and density, Venus shows more similarity to the Earth than to any other planet in the solar system [1, 2, 2a]. The analyses of the data on Venus obtained recently from Mariner V and the three Venera missions indicate that the Cytherean atmosphere consists in the main of some 50 to 100 atm of C 0 2 and that the equatorial surface is extremely hot near 500 °C. At first sight it appears that the odds against any kind of life on the Earth's sister planet are quite high. But the information on the Venusian atmosphere was obtained mainly from the equatorial regions and not the poles which may be relatively cooler. In an attempt to preserve the chemical similarity principle, Libby suggested [1] that the Venus polar zones might have ice caps equivalent to our seas but in view of the latest evidence it seems that the temperature is too high for that, so we now think of warm acidic polar seas, the acid preventing the precipitation of the atmospheric carbon dioxide. Argument for these polar seas has been given recently [2]. It depends principally on the volatility of acids as compared to bases.
Plummer and Strong [5] suggested that Venus may not be unfavorable to life. Based on older data they [5] also proposed a model of Venus which contains ice caps at the polar regions and has lakes or seas which may have escaped detection. Sagan commented [6] in a paper concerning life on the Cytherean surface that the "strictures against life at the very poles may be slightly relaxed." In an earlier illuminating article on Venus, Sagan [7] hypothesized on "microbiological planetary engineering" for the composition and meteorology of the Cytherean atmosphere "for comfortable human habitation." He contemplated seeding the upper Venus atmosphere with * This research was supported by NASA 05-007-003 and AFOSR 1255-67A.
Sagan et al. (eels.), Planetary Atmospheres, 62-83. All Rights Reserved. Copyright %; 1971 by the l.A.U.
available at https://www.cambridge.org/core/terms. https://doi.org/10.1017/S0074180900102645Downloaded from https://www.cambridge.org/core. IP address: 65.21.228.167, on 21 Mar 2022 at 04:59:55, subject to the Cambridge Core terms of use,
VEGETATIVE LIFE ON VENUS? 63
blue-green algae which should finally reduce the temperature and permit surface photosynthesis [7]. More recently Morowitz and Sagan assumed [8] further theoretical postulations about life-forms in Venus cloud levels. In addition, Kvashin and Miroshnichenko [9] summarized the Cytherean life possibilities and suggested that photosynthetic organisms may exist below the clouds and obtain their water from rain and mineral particles ejected from the Venusian surface. Further exploration over the Venus polar regions both by earth based optical and radar observation and space probes is necessary to answer questions about their conditions and possibly to answer finally the question of life on this 'morning star'.
B. THE EXTREME RANGES OF LOWER FORMS OF LIFE
Several microorganisms show optimal adaptation to relatively extreme conditions [10,11] such as acid media or high temperatures (i.e., in sulfuric hot springs). They can grow under elevated hydrostatic pressure (i.e., Barophilic microbes in the depths of the ocean). Also many can tolerate anaerobic conditions (i.e., within animal intestine, sewage plants, H2S, etc.). However, algae are the only microorganism which photo-synthesize and evolve molecular oxygen. In addition some thermophilic algae can tolerate extremely acidic media as for example 1 NH 2 S0 4 [12]. Other extreme conditions for microbial growth were recently reviewed by Brock [10] and Vallentyne [11].
1. Life Under Pure CO 2
The first and main question pertinent to the possibility of Cytherean life seems to be whether plants can live in a C 0 2 atmosphere. The inhibitory effects of higher concentrations of C0 2 on plants is reviewed in several sources [13,14]. Rabinowitch suggested [13] that the inhibitory effect of higher doses of C0 2 is due to narcotic poisoning and acidification of the cellular content. The photosynthetic bacteria reduce C0 2 through an anaerobic mechanism [15] but without any evolution of 0 2 . Higher concentration of C0 2 inhibits or even prevents mold growth [16] while filamentous Phycomycetes show yeast-like development which is induced with a high concentration of C0 2 [17]. Also, the existence of water molds adapted to an anaerobic environment rich in C0 2
has been recently reported [18]. The fungus Blastocladia pringsheimii grows well under tank C0 2 which is used for the formation of resistant sporangia [19]. Among the higher green plants such high levels of C0 2 are toxic and observations in our laboratory have confirmed this with some hydrophytes (lemna, Saqitaria), desert plants (cacti, Atriplex) and seed germination tests (rice, Saqitaria). Ewart reported in the last century [20] that in an atmosphere of pure C0 2 moss plants (Bryophyta) may remain living in darkness for weeks; our studies with the bryophyte Marchantia polymorpha under light could not confirm this observation. Experiments with plant roots by Jacobson et al. show that above 95% C0 2 both oxygen and K+ uptake decrease rapidly and the protoplasmic streaming is stopped [21]. Anion uptake is also severely inhibited by the presence of C0 2 [22]. Algae produce 0 2 during photosynthesis and are therefore not usually associated with environments of low 0 2 . Nevertheless several
6—P.A.
available at https://www.cambridge.org/core/terms. https://doi.org/10.1017/S0074180900102645Downloaded from https://www.cambridge.org/core. IP address: 65.21.228.167, on 21 Mar 2022 at 04:59:55, subject to the Cambridge Core terms of use,
64 JOSEPH SECKBACH AND W. F. LIBBY
algae are capable of performing highly specialized anaerobic metabolism, such as assimilation of C0 2 with H2, H2S or organic H donor [23].
2. HIGHER PRESSURE TREATMENT OF MICROORGANISMS
Effects of elevated pressures on microbial systems were recently reviewed [11, 24, 25]. Hydrostatic pressure is an important environmental parameter in life which exists in the depths of the oceans and subterranean areas. Because of the limit of light in that zone most of the species involved are bacteria or other heterotrophic organisms rather than photosynthetic plants. Most of the higher pressure experiments resulted in a negative effect on the organism tested. ZoBell [10, 11, 24, 46] isolated very few pure cultures of obligate barophiles from enrichment cultures of deep-sea samples. Biological materials exposed to increasing pressures slow down their growth and reproduction [10, 24, 25], and the ability to undergo bacterial cell-division is often lost which results in retardation of activity or death [26]. In contrast, a sudden compression and decompression of the hydrostatic pressure may not injure the microorganism [24]. When a high pressure of gas is suddenly released the bursting of over 90% of the tested bacteria cells was reported by Fraser [27]. Furthermore, the most severe effects were obtained with ca. 33 atm of C0 2 gas [27]. In a review on "environmental biophysics and microbial ubiquity" Vallentyne (11) emphasizes that "scientists are inclined to study single factors taken one at a time." When two or more environmental factors show antagonistic effects... "one expects to find an increased tolerance to each factor using combined action." ZoBell [11] reported that the maximum temperature for thermophiles is increased by compression. Heden's studies [25] suggest that nucleic acids are probably the target of hydrostatic pressure. A fairly elevated pressure increases the melting temperature of DNA and protects the biological activity against thermal inactivation [25]. Similar effects were observed earlier with enzymes and recently reviewed by Mortia [24]. Regnard [26, 28] observed many years ago that botanical material continues to function (evolution of 02) under fairly high compression. Under hydrostatic pressure of 400 atmospheres, 0 2 production proceeds slowly and after several days the tested algae cells were decomposed [28]. More recently Gross [29] observed severe color mutation in a green alga culture after being subjected to higher pressure. These Euglena cells show a higher percentage of mutants permanently lacking chlorophyll and having altered carotenoids when the treatment took place in darkness [29 J.
We now report on experiments with unicellular algae which thrive in conditions close to those possibly existing in the Venus polar regions. Pure cultures and mixtures of microorganisms (from greenhouse scrapes, soil, or ponds) were initially assayed in order to find the selected C 0 2 adapted alga. A newly isolated green alga {Scenede-sums sp.) was also examined. After selecting the algae which can thrive in a C02-rich environment we tested their tolerance to higher temperature and pressures as well as towards acidic media. Results obtained with the thermophilic-acidophilic alga -Cyanidium caldarium - may indicate some clues for supporting assumptions about Venusian life. Primary reports of this study were recently written and presented [30 to 32].
available at https://www.cambridge.org/core/terms. https://doi.org/10.1017/S0074180900102645Downloaded from https://www.cambridge.org/core. IP address: 65.21.228.167, on 21 Mar 2022 at 04:59:55, subject to the Cambridge Core terms of use,

VEGETATIVE LIFE ON VENUS? 65
2. Methods and Materials
A. CULTURE AND MEDIA
The condition of growth and pigment determination for Cyanidium caldarium were recently described [30]. Algal samples were collected at acid sulphate springs of Yellowstone National Park (Wyoming) and were cultured in a double strength, Allen [12], medium pH 2-3, gassed with pure C0 2 . The growth flasks were always agitated inside water bath (40 to 50 °C) under continuous fluorescent illumination (ca. 450 ft-c). For each C0 2 flask an air control was grown, otherwise both were treated similarly. Green algae were grown in mineral nutrition media [33, but mostly as 33a]. The algal flasks were agitated on rotating or wrist action shakers at 25-27 °C, and their C0 2
treatment followed basically that of Cyanidium.
B. ALGAE CELLS AND CHLOROPHYLL DATA
Growth values were determined both by turbidity of the cells (O.D. 580 imz) and the volume of packed cells measured in graduated Hopkins centrifuge tubes. Pigments were extracted from Cyanidium with dimethylformamide (DMFA): the specific absorption coefficient for chlorophyll at 665 m/x in this solvent is 13.86 /xg/ml [34]. The green algal chlorophyll was determined on a methanol extract using the constants obtained by Mackinney [35].
1. Dry Algae Powder and Chemical Analysis The algae were harvested by centrifugation and washed twice with distilled water to remove all soluble materials. The concentrated cell-precipitate was frozen in acetone-dry ice and lyophilized at - 50 °C in a vacuum of 5 \x overnight or longer. Then the dry algal powder was placed in the oven at 40-50 °C or at room temperature inside a vacuumed desiccator. The determination of C and H followed the classical micro Pregel method.
2. Morphology Light, fluorescent, and electron microscopical examinations were made. The cell diameter was measured and the standard deviation was calculated from prints taken with a Zeiss Ultraphoto II light microscope. For the fine structural studies the cells were fixed with unbuffered KMn04 , embedded in polyester resin (Westopal W) and the blocks were sectioned with a LKB Ultratome and the tissue reviewed in a Hu 11 A Hitachi electron microscope.
3. High Pressure Experiment Cyanidium caldarium cells were transferred to plexiglass cylinders (Figure 1) placed in room temperature or in 45-50 °C (water bath) and connected to C0 2 and argon tanks. All containers were exposed to relatively low light intensity of ca. 50-100 foot candles obtained from fluorescent desk lamps. The algal suspension was subjected to increasing pressures of C0 2 and Ar at a rate illustrated in Figure 2. When the final pressure was
available at https://www.cambridge.org/core/terms. https://doi.org/10.1017/S0074180900102645Downloaded from https://www.cambridge.org/core. IP address: 65.21.228.167, on 21 Mar 2022 at 04:59:55, subject to the Cambridge Core terms of use,
6 6 JOSEPH SECKBACH AND W. F. LIBBY
A B i l i S V l P * / £ « d w .
^ I * 1 1 J w i B 4fi J 1—•M~'!—3^ ° £
^^^^H ^^"•li ^^MB: ; ■ ■ ■ ■ ^ ^ ^ H iMPI ^E iQI^^^H °*i I ' i l l 1
^ ^ ^ ^ ^ ^ B ~ j ^ ^ ^ H — ff )) - |— *
\ I / 2 n \ / < o
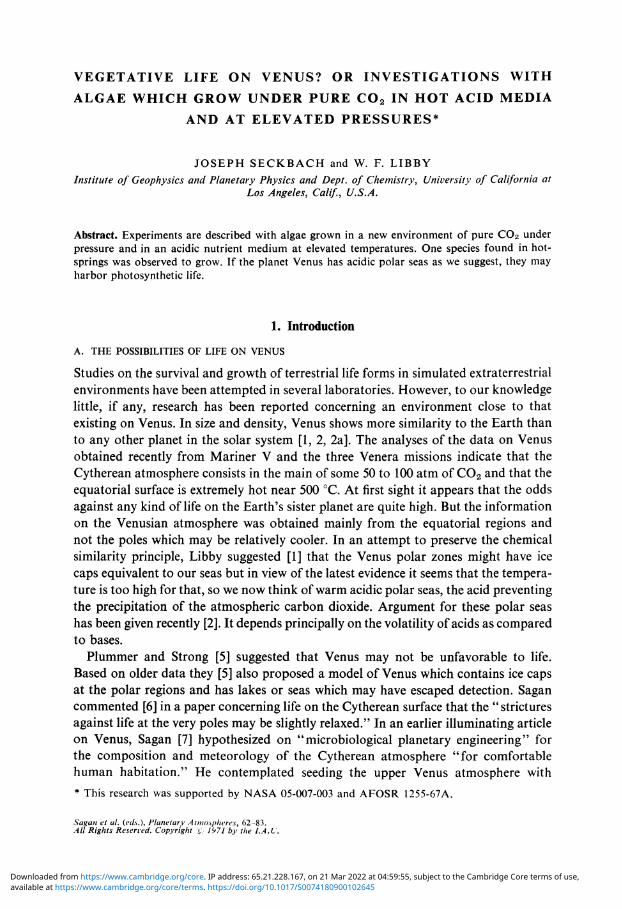
\ ^ i ^ X 0© Fig. 1. The high pressure vessel for growing algae at various temperatures and under illumination while subjected to the gaseous pressure. These containers were designed to fit into a Cary 14 recording spectrophotometer. Each plexiglass pressure cylinder was tested at 200 atm at room temperature prior to the experiment. (A) a general view, (B) cross-section of the cylindrical
pressure chamber and its dimensions.
reached the algae were kept for periods up to 15 days under high pressure (50 atm). At the end of this treatment the algae cells were examined for their number, pigment spectra and appearance in the microscope. Subcultures were transferred into 1 atm of C 0 2 for determining the restored growth after the high pressure treatment.
available at https://www.cambridge.org/core/terms. https://doi.org/10.1017/S0074180900102645Downloaded from https://www.cambridge.org/core. IP address: 65.21.228.167, on 21 Mar 2022 at 04:59:55, subject to the Cambridge Core terms of use,

VEGETATIVE LIFE ON VENUS?
50
10 20 25 30 TIME (days)
Fig. 2. Pressurization rate of alga cells under C02 or/and Ar and the decompression during the experimental period.
3. Results and Discussions A. GROWTH RATES
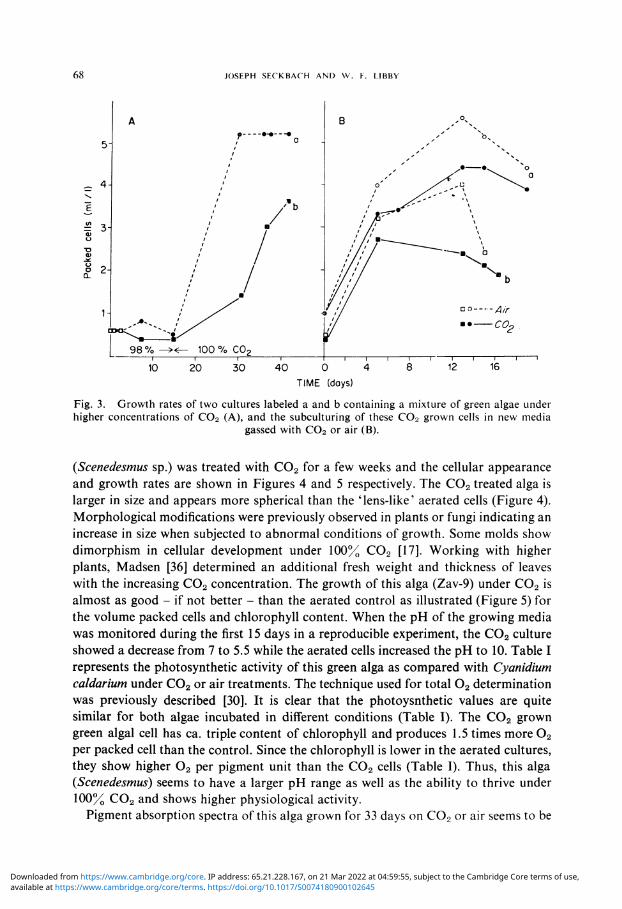
Results obtained with a mixture of microorganisms (algae and bacteria) treated for 40 days with a higher concentration of C0 2 (Figure 3A) show a lag period for ca. two weeks with almost no obvious increase of cellular material. After this adaptation period, a rapid promotion of cellular volume takes place for the following three weeks (Figure 3A). Subcultures of the previous C0 2 grown cells in new nutrient media [33] gassed with C0 2 or air result in a prompt acceleration of all the cells for the first five days, regardless of the gas source (Figure 3B). The cultures grown under C0 2 show lower growth than the aerated controls; this decline is more pronounced with the duration of this treatment (Figure 3B). Identification* of the predominant algae surviving after the pure C 0 2 treatment suggested a few species from the Chloro-coccalean unicellular members (Chlorella, Chlorococcum, Scenedesmus, and Cocomyxd). Thus, it was established that at room temperature a steady growth occurs with several green algae in an agitated culture supplied with a constant stream of C0 2 .
The next step was to begin with a pure Chlorococcalean culture and examine the response to pure C 0 2 application. A newly isolated pure green algal culture f * We acknowledge the assistance of Professor H. C. Bold (University of Texas, Austin): R. A. Lewis (University of California, San Diego, Scripps Institution of Oceanography, La Jolla). H. S. Forest (State University College, Geneseo, New York), and to F. R. Trainor (University of Connecticut, Storrs) who identified the algal cultures. t This alga was isolated by Dr. G. A. Zavarzin (Institute of Microbiology Academy of Sciences, Moscow, U.S.S.R.) from rain water accumulated at his country house near Moscow. He innocu-lated it into mineral medium under H2. Further purifications by Prof. R. A. Lewin (Scripps Institution of Oceanography, La Jolla, Calif.), resulted in a bacteria-free culture which was kindly given to us and labelled as 'Zav-9\ Additional taxonomical examinations suggested (see previous acknowledgement) that this alga is probably Scenedesmus sp. We wish to thank all who assisted us with this organism.
40k
6
UJ
ZD CO CO
Q.
,0r
67
available at https://www.cambridge.org/core/terms. https://doi.org/10.1017/S0074180900102645Downloaded from https://www.cambridge.org/core. IP address: 65.21.228.167, on 21 Mar 2022 at 04:59:55, subject to the Cambridge Core terms of use,
68 JOSEPH SECKBACH AND VV. F. LTBBY
98 % - ^ < - 100 % C02 1 1 1 I 1 1 1 1 1 1 I I I I I
10 20 30 40 0 4 8 12 16 TIME (days)
Fig. 3. Growth rates of two cultures labeled a and b containing a mixture of green algae under higher concentrations of C02 (A), and the subculturing of these C02 grown cells in new media
gassed with C02 or air (B).
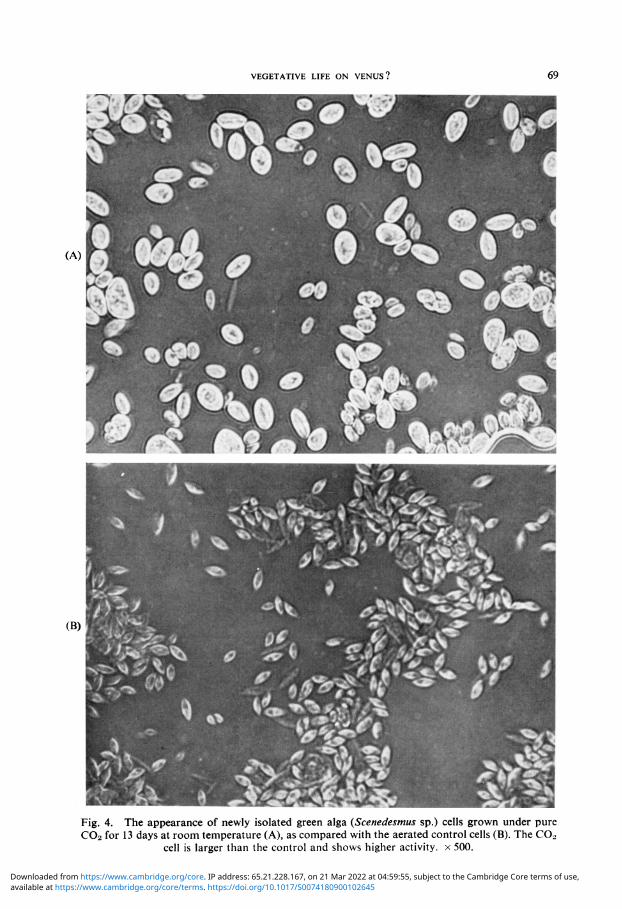
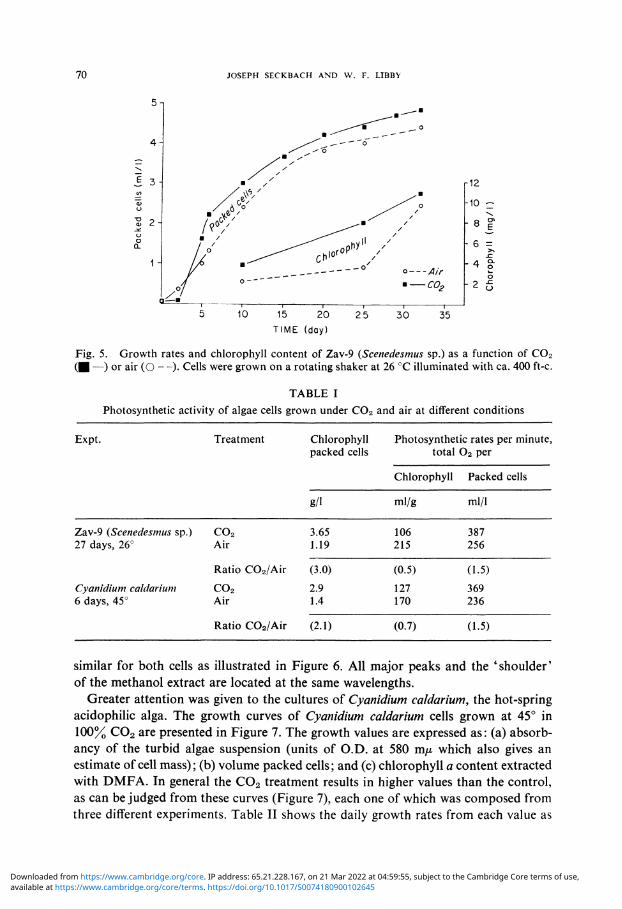
(Scenedesmus sp.) was treated with C 0 2 for a few weeks and the cellular appearance and growth rates are shown in Figures 4 and 5 respectively. The C0 2 treated alga is larger in size and appears more spherical than the 'lens-like' aerated cells (Figure 4). Morphological modifications were previously observed in plants or fungi indicating an increase in size when subjected to abnormal conditions of growth. Some molds show dimorphism in cellular development under 100% C0 2 [17]. Working with higher plants, Madsen [36] determined an additional fresh weight and thickness of leaves with the increasing C0 2 concentration. The growth of this alga (Zav-9) under C0 2 is almost as good - if not better - than the aerated control as illustrated (Figure 5) for the volume packed cells and chlorophyll content. When the pH of the growing media was monitored during the first 15 days in a reproducible experiment, the C 0 2 culture showed a decrease from 7 to 5.5 while the aerated cells increased the pH to 10. Table I represents the photosynthetic activity of this green alga as compared with Cyanidium caldarium under C0 2 or air treatments. The technique used for total 0 2 determination was previously described [30]. It is clear that the photoysnthetic values are quite similar for both algae incubated in different conditions (Table I). The C 0 2 grown green algal cell has ca. triple content of chlorophyll and produces 1.5 times more 0 2
per packed cell than the control. Since the chlorophyll is lower in the aerated cultures, they show higher 0 2 per pigment unit than the C0 2 cells (Table I). Thus, this alga {Scenedesmus) seems to have a larger pH range as well as the ability to thrive under 100% C 0 2 and shows higher physiological activity.
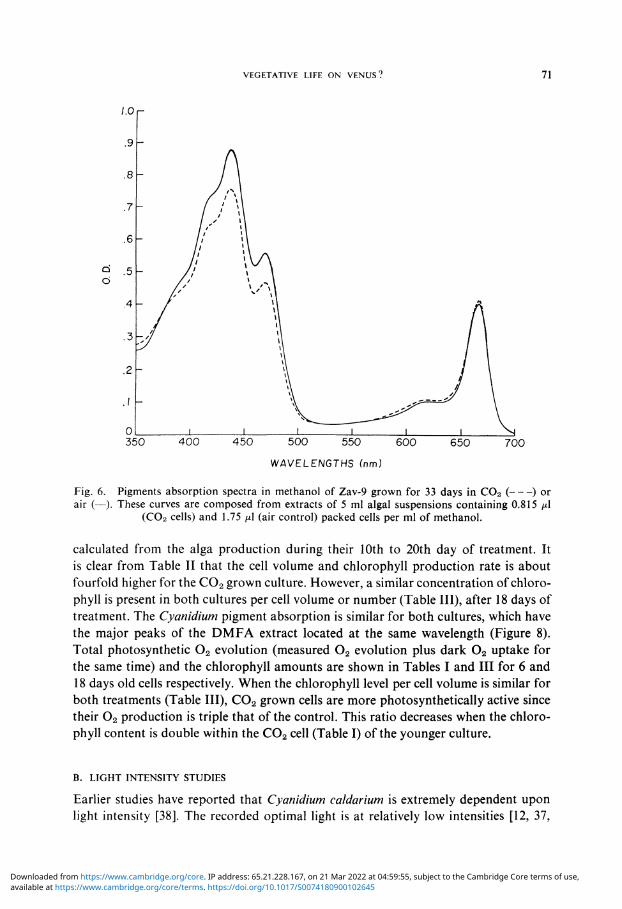
Pigment absorption spectra of this alga grown for 33 days on C0 2 or air seems to be
available at https://www.cambridge.org/core/terms. https://doi.org/10.1017/S0074180900102645Downloaded from https://www.cambridge.org/core. IP address: 65.21.228.167, on 21 Mar 2022 at 04:59:55, subject to the Cambridge Core terms of use,
VEGETATIVE LIFE ON VENUS .' 69
Fig. 4. The appearance of newly isolated green alga {Scenedesmus sp.) cells grown under pure C02 for 13 days at room temperature (A), as compared with the aerated control cells (B). The C02
cell is larger than the control and shows higher activity, x 500.
available at https://www.cambridge.org/core/terms. https://doi.org/10.1017/S0074180900102645Downloaded from https://www.cambridge.org/core. IP address: 65.21.228.167, on 21 Mar 2022 at 04:59:55, subject to the Cambridge Core terms of use,
70 JOSEPH SECKBACH AND W. F. LIBBY
S 3
15 20 TIME (day)
Fig. 5. Growth rates and chlorophyll content of Zav-9 (Scenedesmus sp.) as a function of C02 ( ■ —) or air (O — ) . Cells were grown on a rotating shaker at 26 °C illuminated with ca. 400 ft-c.
TABLE I Photosynthetic activity of algae cells grown under C02 and air at different conditions
Expt.
Zav-9 (Scenedesmus sp.) 27 days, 26°
Cyanidium caldarium 6 days, 45°
Treatment
co2 Air
Ratio C02/Air co2 Air
Ratio COa/Air
Chlorophyll packed cells
g/1
3.65 1.19
(3.0) 2.9 1.4
(2.1)
Photosynthetic rates per minute, total 0 2 per
Chlorophyll
ml/g
106 215
(0.5) 127 170
(0.7)
Packed cells
ml/1
387 256
(1.5) 369 236
(1.5)
similar for both cells as illustrated in Figure 6. All major peaks and the 'shoulder' of the methanol extract are located at the same wavelengths.
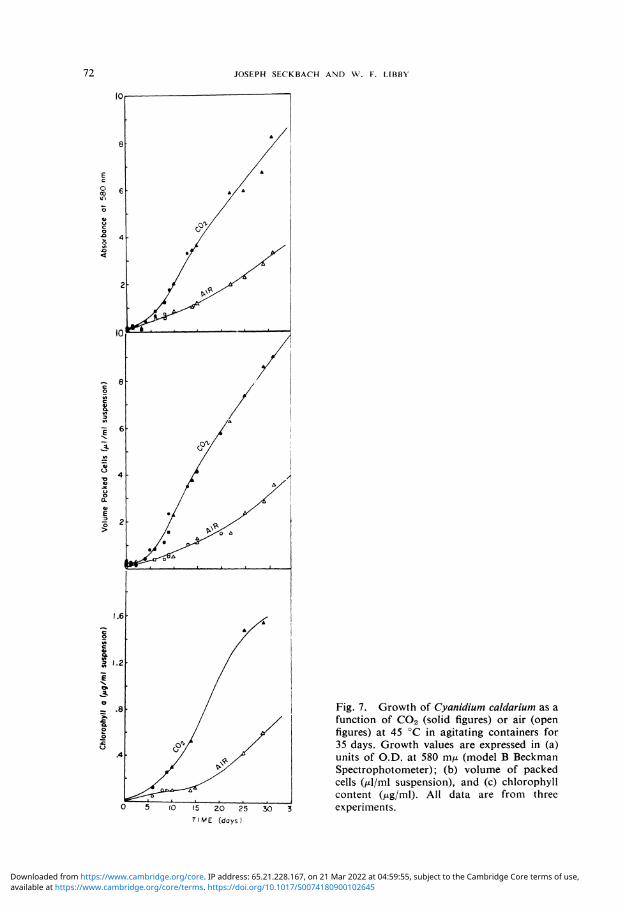
Greater attention was given to the cultures of Cyanidium caldarium, the hot-spring acidophilic alga. The growth curves of Cyanidium caldarium cells grown at 45° in 100% C0 2 are presented in Figure 7. The growth values are expressed as: (a) absorb-ancy of the turbid algae suspension (units of O.D. at 580 m^ which also gives an estimate of cell mass); (b) volume packed cells; and (c) chlorophyll a content extracted with DMFA. In general the C0 2 treatment results in higher values than the control, as can be judged from these curves (Figure 7), each one of which was composed from three different experiments. Table II shows the daily growth rates from each value as
available at https://www.cambridge.org/core/terms. https://doi.org/10.1017/S0074180900102645Downloaded from https://www.cambridge.org/core. IP address: 65.21.228.167, on 21 Mar 2022 at 04:59:55, subject to the Cambridge Core terms of use,
VEGETATIVE LIFE ON VENUS? 71
350 400 450 500 550 600 650 700
WAVELENGTHS (nm)
Fig. 6. Pigments absorption spectra in methanol of Zav-9 grown for 33 days in C02 ( ) or air (—). These curves are composed from extracts of 5 ml algal suspensions containing 0.815 /ul
(C02 cells) and 1.75 (JL\ (air control) packed cells per ml of methanol.
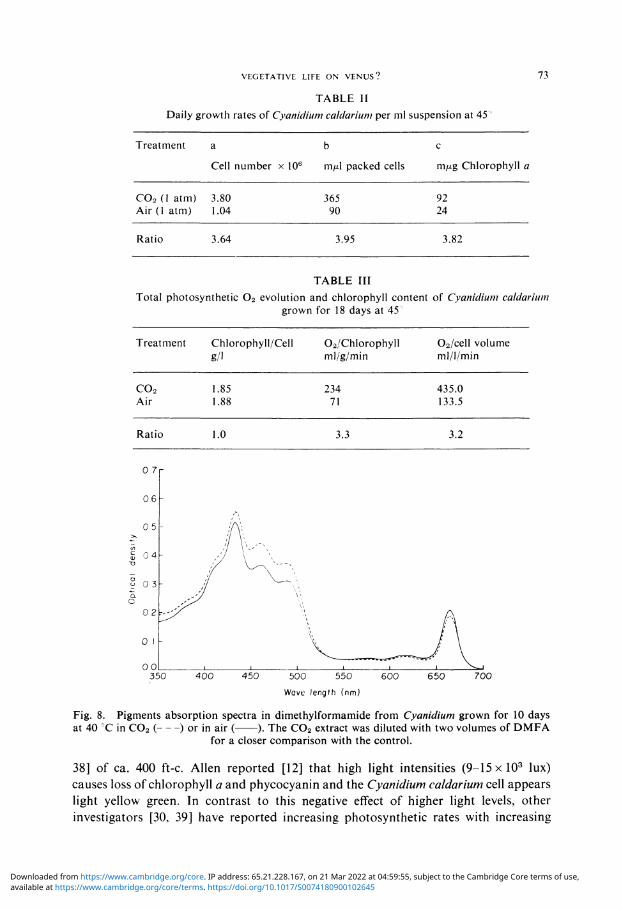
calculated from the alga production during their 10th to 20th day of treatment. It is clear from Table II that the cell volume and chlorophyll production rate is about fourfold higher for the C 0 2 grown culture. However, a similar concentration of chlorophyll is present in both cultures per cell volume or number (Table III), after 18 days of treatment. The Cyanidium pigment absorption is similar for both cultures, which have the major peaks of the DMFA extract located at the same wavelength (Figure 8). Total photosynthetic 0 2 evolution (measured 0 2 evolution plus dark 0 2 uptake for the same time) and the chlorophyll amounts are shown in Tables I and III for 6 and 18 days old cells respectively. When the chlorophyll level per cell volume is similar for both treatments (Table III), C 0 2 grown cells are more photosynthetically active since their 0 2 production is triple that of the control. This ratio decreases when the chlorophyll content is double within the C0 2 cell (Table I) of the younger culture.
B. LIGHT INTENSITY STUDIES
Earlier studies have reported that Cyanidium caldarium is extremely dependent upon light intensity [38]. The recorded optimal light is at relatively low intensities [12, 37,
available at https://www.cambridge.org/core/terms. https://doi.org/10.1017/S0074180900102645Downloaded from https://www.cambridge.org/core. IP address: 65.21.228.167, on 21 Mar 2022 at 04:59:55, subject to the Cambridge Core terms of use,
7 2 JOSEPH SECKBACH AND W. F. LIBBY
lo, ■ 1
8| / '
O cL /A \ 00 for * / 10 / I § c°7 * 4 / o /
s I -f S\
I0F3-L ' ' ' ' '—A
I / 1 6 / !
• I / A / £ r / A ' «> / X I 6 • / ><
/ 4 ^ ^
'•6r /I i / I *> r / 5 » 2 ^ / 6 / o» r / I 3» / I
° I / ^» I / • i a / / \ o I / j /
^ I <?/ /
/ J^ ^ ^
0 5 10 /5 2 0 25 3 0 3 T I M E (days)
Fig. 7. Growth of Cyanidium caldarium as a function of C0 2 (solid figures) or air (open figures) at 45 °C in agitating containers for 35 days. Growth values are expressed in (a) units of O.D. at 580 m/u. (model B Beckman Spectrophotometer); (b) volume of packed cells Ozl/ml suspension), and (c) chlorophyll content (/xg/ml). All data are from three experiments.
available at https://www.cambridge.org/core/terms. https://doi.org/10.1017/S0074180900102645Downloaded from https://www.cambridge.org/core. IP address: 65.21.228.167, on 21 Mar 2022 at 04:59:55, subject to the Cambridge Core terms of use,
VEGETATIVE LIFE ON VENUS .' 73
TABLE II Daily growth rates of Cyanidium caldarium per ml suspension at 45''
Treatment
CO s (1 atm) Air (1 atm)
Ratio
a
Cell number x 106
3.80 1.04
3.64
b
m/xl packed cells
365 90
3.95
c
m/xg Chlorophyll a
92 24
3.82
TABLE III Total photosynthetic 0 2 evolution and chlorophyll content of Cyanidium caldarium
grown for 18 days at 45
Treatment
co2 Air
Ratio
Chlorophyll/Cell g/1
1.85 1.88
1.0
Oa/Chlorophyll ml/g/min
234 71
3.3
02/cell volume ml/l/min
435.0 133.5
3.2
0 7c
350 400 450 500 550 600 Wove length (nm)
650 700
Fig. 8. Pigments absorption spectra in dimethylformamide from Cyanidium grown for 10 days at 40 CC in C02 ( ) or in air ( ). The C02 extract was diluted with two volumes of DMFA
for a closer comparison with the control.
38] of ca. 400 ft-c. Allen reported [12] that high light intensities (9-15 x 103 lux) causes loss of chlorophyll a and phycocyanin and the Cyanidium caldarium cell appears light yellow green. In contrast to this negative effect of higher light levels, other investigators [30, 39] have reported increasing photosynthetic rates with increasing
available at https://www.cambridge.org/core/terms. https://doi.org/10.1017/S0074180900102645Downloaded from https://www.cambridge.org/core. IP address: 65.21.228.167, on 21 Mar 2022 at 04:59:55, subject to the Cambridge Core terms of use,
74 JOSEPH SECKBACH AND W. F. LIBBY
T , 1 1
5 10 15 18 TIME (days)
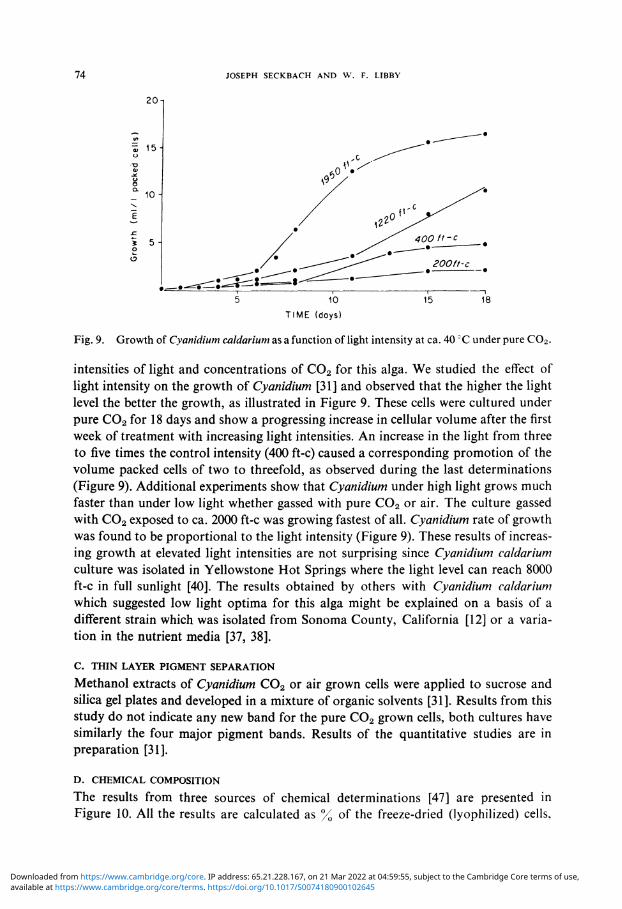
Fig. 9. Growth of Cyanidium caldarium as a function of light intensity at ca. 40 CC under pure C02 .
intensities of light and concentrations of C0 2 for this alga. We studied the effect of light intensity on the growth of Cyanidium [31] and observed that the higher the light level the better the growth, as illustrated in Figure 9. These cells were cultured under pure C0 2 for 18 days and show a progressing increase in cellular volume after the first week of treatment with increasing light intensities. An increase in the light from three to five times the control intensity (400 ft-c) caused a corresponding promotion of the volume packed cells of two to threefold, as observed during the last determinations (Figure 9). Additional experiments show that Cyanidium under high light grows much faster than under low light whether gassed with pure C0 2 or air. The culture gassed with C0 2 exposed to ca. 2000 ft-c was growing fastest of all. Cyanidium rate of growth was found to be proportional to the light intensity (Figure 9). These results of increasing growth at elevated light intensities are not surprising since Cyanidium caldarium culture was isolated in Yellowstone Hot Springs where the light level can reach 8000 ft-c in full sunlight [40]. The results obtained by others with Cyanidium caldarium which suggested low light optima for this alga might be explained on a basis of a different strain which was isolated from Sonoma County, California [12] or a variation in the nutrient media [37, 38].
C. THIN LAYER PIGMENT SEPARATION
Methanol extracts of Cyanidium C 0 2 or air grown cells were applied to sucrose and silica gel plates and developed in a mixture of organic solvents [31]. Results from this study do not indicate any new band for the pure C0 2 grown cells, both cultures have similarly the four major pigment bands. Results of the quantitative studies are in preparation [31].
D. CHEMICAL COMPOSITION
The results from three sources of chemical determinations [47] are presented in Figure 10. All the results are calculated as % of the freeze-dried (lyophilized) cells,
CKJ
• 15 J o "D 0)
• * ■
3 - 1 01 I o
available at https://www.cambridge.org/core/terms. https://doi.org/10.1017/S0074180900102645Downloaded from https://www.cambridge.org/core. IP address: 65.21.228.167, on 21 Mar 2022 at 04:59:55, subject to the Cambridge Core terms of use,

VEGETATIVE LIFE ON VENUS? 75
excluding the C and H which are based on the ash-free fraction. The ash content from the C0 2 culture is only half the control, while the C + H levels (52% + 7.5% respectively) are similar for both treatments. Some minerals are detected only in air grown culture (Mo, Na, Va), or are more abundant within these cells (Mn, Ca, Fe, S, Si), while other elements are within a close range (Cu, Zn, Mg, P, N, C, H). The ash-rich control fraction contains mainly cations belonging to the trace nutrients (Mn, Nz, Cu, Mo, Va, Ca, Fe) and less from the macronutrients (Na, K). The fact that the chlorophyll content per cell volume is similar in both cultures (Figure 7 and Table III) is confirmed here by its components (H, C, N, and Mg) detected at close levels for both treatments.
100 E
10 h
A AIR • C02
A
c 1 E
- in - iL -10"
A &
A A • •
A A 1 A
4 t
A • A
A
io-2
10'3
m4
•
f A
I
A
I
A
A
I
• •
I
• •
•
I 1
• • A
1 1 1 1
• • •
1 1 1 1 1 1 1 l B V MoCu CaMnZnNaMg K Si P S Fe N Ash H C
Elements analyzed in lyophilized Cyanidium Caldarium
Fig. 10. The percentage of chemical elements analyzed from the lyophilized Cyanidium cells. The values for C and H are calculated for an ash-free weight while the rest are expressed per lyophilized
powder. The chemicals were detected by three different sources.
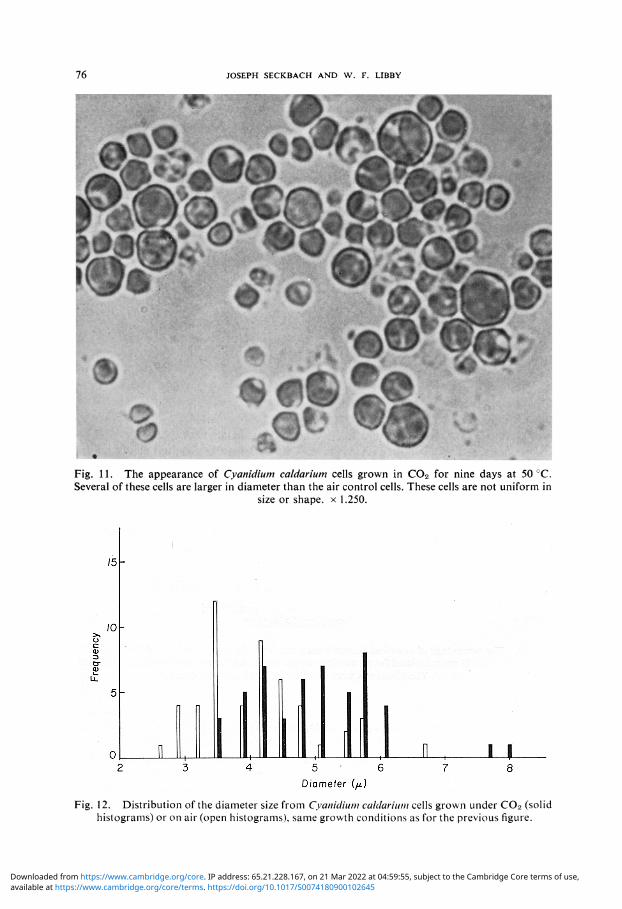
E. CELLULAR MORPHOLOGY The general appearance of Cyanidium grown at 50° (Figure 11) shows that cells vary in size and extend from 3.5 to 8 /x in diameter. The histograms of the cell distribution (Figure 12) illustrates that the C0 2 grown cell reaches a larger diameter range than the air control. The average diameter of the C0 2 treated cell is 4.78 + 0.86 /x, whereas the control cell reaches a size of 3.88 + 0.77 /x. Additional observations with the fluorescent microscope demonstrated a bright red color from both cultures which
c (D
E
o 1< 0) co CTJ
§ 1C a;
Q.
1C
available at https://www.cambridge.org/core/terms. https://doi.org/10.1017/S0074180900102645Downloaded from https://www.cambridge.org/core. IP address: 65.21.228.167, on 21 Mar 2022 at 04:59:55, subject to the Cambridge Core terms of use,
76 JOSEPH SECKBACH AND W. F. LIBBY
Fig. 11. The appearance of Cyanidium caldarium cells grown in C02 for nine days at 50 °C. Several of these cells are larger in diameter than the air control cells. These cells are not uniform in
size or shape, x 1.250.
c
15
10
5
0 DJ H—1 U ^ » — L y u ■ H L_ U 2 3 4 5 6 7 8
Diameter (/*) Fig. 12. Distribution of the diameter size from Cyanidium caldarium cells grown under C02 (solid
histograms) or on air (open histograms), same growth conditions as for the previous figure.
available at https://www.cambridge.org/core/terms. https://doi.org/10.1017/S0074180900102645Downloaded from https://www.cambridge.org/core. IP address: 65.21.228.167, on 21 Mar 2022 at 04:59:55, subject to the Cambridge Core terms of use,

VEGETATIVE LIFE ON VENUS? 77
indicates active chlorophyll. When these cells grow at room temperature (25°) the C0 2 culture reveals also larger cells than the control.
The fine structure of the C0 2 grown cell is shown in Figure 13. One cell is in the division stage and three out of the four autospores are visible. One endospore has a mitochondrium (Mit) which gives further evidence of its presence within this genus [41 ]. Several electronmicrographs from both cultures (unpublished observations) illustrate clearly mitochondria, relatively small vacuoles, and conspicuously large plastids. Several chloroplasts as shown here (Figure 13) may occupy almost all the entire
Fig. 13. The fine structure of Cyanidium caldarium cell grown on C02 at 40°C for nine days. The cell at the right contains a large chloroplast (ch) which has eight lamillar bands. The left cell is dividing into autospores (AS), which illustrate the cellular organelles [i.e. the nucleus (N), chloroplast (ch), mitochondrium (Mit), and storage granules (S)]. All the endospores are still within the
mother cell wall (CW). x 53 000, unstained.
cytoplasmic volume. On the other hand, other publications of this genus' ultra-structure [42, 43] show relatively large vacuoles and small parietal plastids. No striking differences in the fine structure were observed between the two treatments, however the C0 2 group seems to contain a larger number of storage granules. Confirmations of earlier studies indicate that the starch content of leaves from certain species is found to be higher with enriched C0 2 concentrations than when they were placed in atmospheric air [36]. Also the total content of carbohydrates measured in
available at https://www.cambridge.org/core/terms. https://doi.org/10.1017/S0074180900102645Downloaded from https://www.cambridge.org/core. IP address: 65.21.228.167, on 21 Mar 2022 at 04:59:55, subject to the Cambridge Core terms of use,
78 JOSEPH SECKBACH AND W. F. LIBBY
plants increased in proportion to the concentration of C0 2 in the surrounding air [36]. Starch accumulation was observed in Oedogonium after C0 2 application. The higher storage material observed in the electronmicrographs of the C0 2 treated cells (Figure 13) could possibly serve as a mechanism to control the mineral uptake via a starch-glucose osmotic pressure regulator. The presence of starch should reduce the uptake, and indeed the C0 2 cell is lower in chemicals (Figure 10). The presence of many lamillar bands within these chloroplasts and their rich orientation suggests active photosynthetic functions.
F. HIGH PRESSURE STUDIES
We undertook the growing of Cyanidium under pure carbon dioxide at elevated temperatures for supporting assumptions about the Cytherean life theory. We have found that this acidic hot-spring alga thrives better under COa than in air, also the rate of photosynthesis (0 2 evolution), cell's size and number exceed the aerated control.
Initial studies with a few blue-green hot-spring algae (Mastiqocladus laminosum, Synechococcus lividus clones Y52 and 53), under C0 2 at 45° [33a] resulted in a discoloration and bleaching of these anaerobic treated cultures within the first two weeks. Similar results were obtained with fresh water blue-green algae (Nostoc sp. 588, Anabaena cylindrica Lem B 629, supplied from the collection of algae, Indiana University, Bloomington, Ind.) and with some marine species (Dunaliella sp., Prym-nesium and Chlamydomonas sp.) which were cultured under high doses of C0 2 at 26° in mineral enriched sea-water. Accelerated growth always occurred in the aerated controls.
In order to approach further the extraterrestrial conditions of Venus' poles we have tested Cyanidium in elevated pressures of COa, acidic media and at 25 to 50 °C. Several experiments were conducted with this hot-spring alga at higher pressures (up to 50 atm). The rates of pressurization and decompression is shown in Figure 2. We found that when the pressure is built up within a very short period of time it kills the culture. Furthermore, Frasser [27] developed a system of bursting microorganisms by a rapid release of the high C0 2 pressures. Higher pressure of air (49 atm plus 1 atm C02) causes a faster damage to Cyanidium than 50 atm of C02 . This super-oxidation effect was not obtained with lower 0 2 levels (3.5 atm 0 2 to cells previously gassed with COa). As judged from the coloration of a series of algae which were subjected to increasing C0 2 pressures at 25°, it seems that additional pressure from 1 to 10 atm does not damage this alga. Variation in the 'in vivo' absorption spectra was observed in cells which were subjected to from 20 to 50 atm C0 2 for ca. 10 days. The phyco-cyanin absorption peak (620 m/*) is very reduced or completely removed while the chlorophyll peak (675 m/x) is detectable. When the cells from the high pressure treatment were returned to atmospheric pressure of C0 2 (or air) they resumed a slow growth and have normal absorption spectra patterns (Figure 14). Thus, it seems that the high C02 pressure arrests the algae growth and reduces the cellular diameter to ca. 70% as compared with their initial size. It was noticed that higher light intensities causes a discoloration of the algal suspensions under the high C0 2 pressure while this
available at https://www.cambridge.org/core/terms. https://doi.org/10.1017/S0074180900102645Downloaded from https://www.cambridge.org/core. IP address: 65.21.228.167, on 21 Mar 2022 at 04:59:55, subject to the Cambridge Core terms of use,

VEGETATIVE LIFE ON VENUS? 79
B .8
5 otm C02 25°
QD. ^ 50 otm C02 45° ^
•6H
'E 3 .5 <D
50 atm 45°
20 atm 45°
20 atm C02 45° Q
•3H
5 atm 25°:
1atm 45° \ ' i
350 450 550 650 750
Wavelength (m/j)
350 450 550 650 750 Wavelength (m/j)
Fig. 14. Pigments absorption spectra from Cyanidium caldarium cells which were subjected to higher pressures of C02 for a few days and then transferred to 1 atm for an additional period of a few weeks. All the peaks are similar to the control culture (grown under 1 atm C02) which indicates normal pigmentation as determined with a DMFA extract (A), or from the 'in vivo'
spectra of the algal suspensions (B).
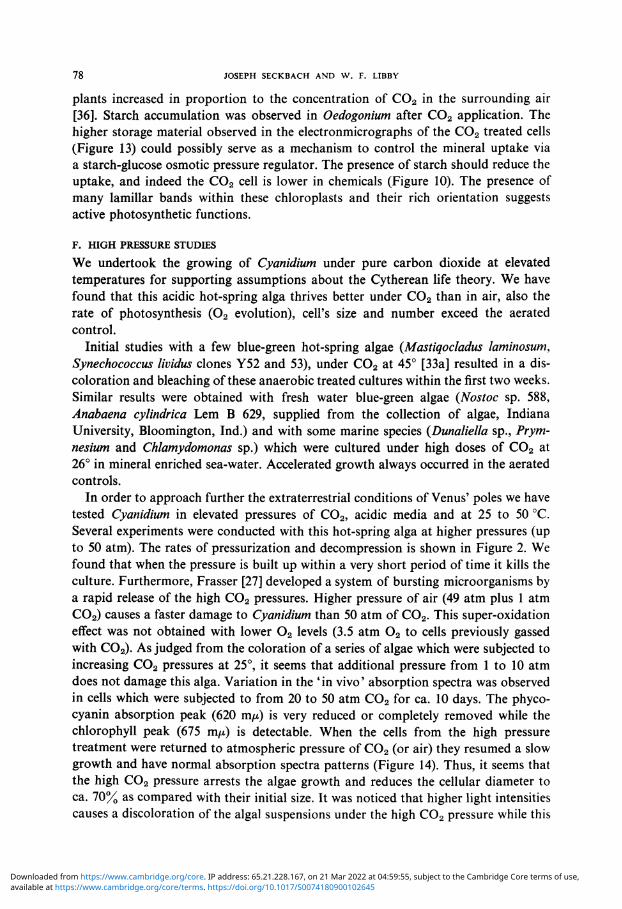
was delayed with lower levels of illumination. Later, these treatments took place under relatively low light intensities of ca. 50 to 100 ft-c. The high pressure of C0 2 alters not only the 'in vivo' absorption spectra of Cyanidium cells, but also a shift in the pigment absorption peak from 432 m/x to 413 m/x was observed within DMF extracts (Figure 15). The absorption at these wavelengths is related to the carotenoids and chlorophyll a contribution. It was shown [44] that bacteria cells may alter their carotenoid content due to higher concentrations of COs. Also Gross [29] reported on pigment mutation of the green alga Euglena under higher hydrostatic pressures.
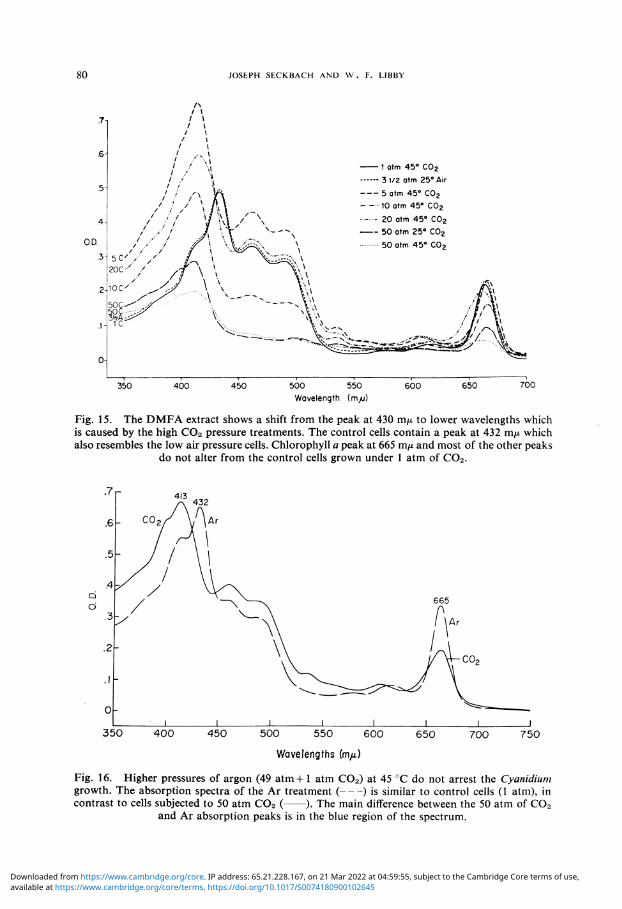
The question was asked whether the suppression effect of 50 atm of C 0 2 is due to the C0 2 elevated dose or to high pressure 'per se'. Since higher pressures of 0 2 have been shown to be toxic to this alga, we treated Cyanidium with 49 atm argon and 1 atm C02. Results of this are presented in Figure 16 and Table IV. There is a continuation of growth under high pressures of Ar which provides a hydrostatic pressure due to its
7 — P . A.
available at https://www.cambridge.org/core/terms. https://doi.org/10.1017/S0074180900102645Downloaded from https://www.cambridge.org/core. IP address: 65.21.228.167, on 21 Mar 2022 at 04:59:55, subject to the Cambridge Core terms of use,
80 JOSEPH SECKBACH AND W . F. LIBBY
O.D.
7-
6-
.5-
4-
.3
2-
.1-
.0-
/ \ / \ / \ / \ f \
1 \
l/\ 1 i \
I i A ft / / / \A\ / ; / / \ ■
5 C / ^ / ^ \ 200 -' / / / \ \ ioc ' ' " ^ / \ \ 5 0 C ^ ^
^ ^ \ 1C \
/ ~ \ -' \ s \ \ . ■ < < - - : • • . \
^ ^ X - v . \
\\\ \\\ — ' ■•v., \ \ \
~"N v'w VV\ \ xx
^ ^^
A <g£g£r
1 otm 45° C0 2
31/2 otm 25° Air
5 atm 45° C02
10 atm 45° C0 2
20 atm 45° C0 2
50 atm 25° C02
50 atm 45° C0 2
/ S /-\\ / / / V
^J^JZ^£^^Zs$&J> ^ k ^
350 400 450 500 550 Wavelength (m/j)
600 650 700
Fig. 15. The DMFA extract shows a shift from the peak at 430 m/x to lower wavelengths which is caused by the high C02 pressure treatments. The control cells contain a peak at 432 m/x which also resembles the low air pressure cells. Chlorophyll a peak at 665 m/x and most of the other peaks
do not alter from the control cells grown under 1 atm of C02 .
350 400 450 500 550 600 650 700 750 Wavelengths (m/i)
Fig. 16. Higher pressures of argon (49 atm+ 1 atm C02) at 45 °C do not arrest the Cyanidium growth. The absorption spectra of the Ar treatment ( ) is similar to control cells (1 atm), in contrast to cells subjected to 50 atm C02 ( ). The main difference between the 50 atm of C02
and Ar absorption peaks is in the blue region of the spectrum.
available at https://www.cambridge.org/core/terms. https://doi.org/10.1017/S0074180900102645Downloaded from https://www.cambridge.org/core. IP address: 65.21.228.167, on 21 Mar 2022 at 04:59:55, subject to the Cambridge Core terms of use,
VEGETATIVE LIFE ON VENUS? 81
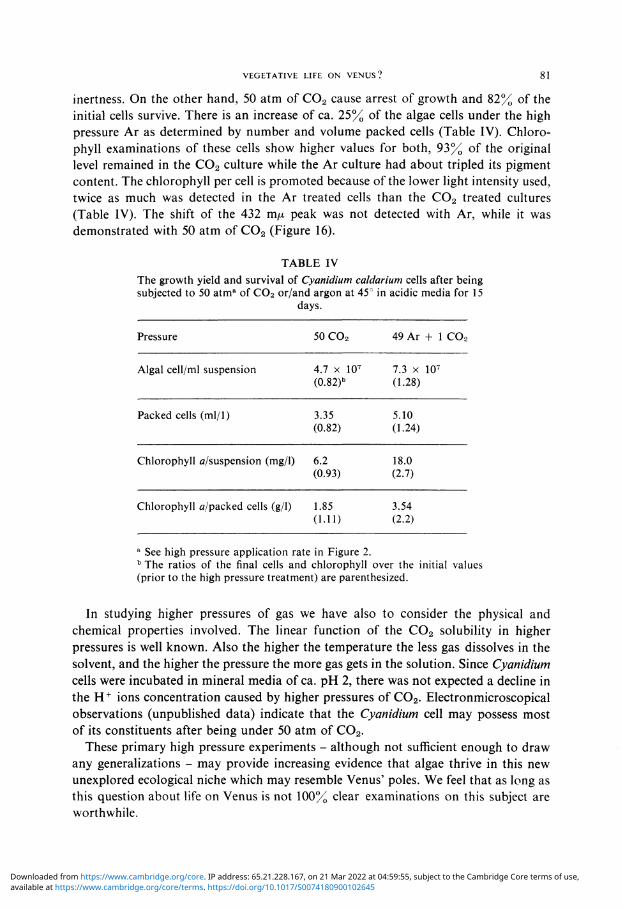
inertness. On the other hand, 50 atm of C0 2 cause arrest of growth and 82% of the initial cells survive. There is an increase of ca. 25% of the algae cells under the high pressure Ar as determined by number and volume packed cells (Table IV). Chlorophyll examinations of these cells show higher values for both, 93% of the original level remained in the C0 2 culture while the Ar culture had about tripled its pigment content. The chlorophyll per cell is promoted because of the lower light intensity used, twice as much was detected in the Ar treated cells than the C0 2 treated cultures (Table IV). The shift of the 432 m/x peak was not detected with Ar, while it was demonstrated with 50 atm of C 0 2 (Figure 16).
TABLE IV The growth yield and survival of Cyanidium caldarium cells after being subjected to 50 atma of C0 2 or/and argon at 45° in acidic media for 15
days.
Pressure
Algal cell/ml suspension
Packed cells (ml/1)
Chlorophyll a/suspension (mg/1)
Chlorophyll ^/packed cells (g/1)
50CO2
4.7 x 10⁷
(0.82)b
3.35 (0.82)
6.2 (0.93)
1.85 (1.11)
49 Ar + 1 C02
7.3 x 10⁷
(1.28)
5.10 (1.24)
18.0 (2.7)
3.54 (2.2)
a See high pressure application rate in Figure 2. b The ratios of the final cells and chlorophyll over the initial values (prior to the high pressure treatment) are parenthesized.
In studying higher pressures of gas we have also to consider the physical and chemical properties involved. The linear function of the C0 2 solubility in higher pressures is well known. Also the higher the temperature the less gas dissolves in the solvent, and the higher the pressure the more gas gets in the solution. Since Cyanidium cells were incubated in mineral media of ca. pH 2, there was not expected a decline in the H + ions concentration caused by higher pressures of C0 2 . Electronmicroscopical observations (unpublished data) indicate that the Cyanidium cell may possess most of its constituents after being under 50 atm of COa.
These primary high pressure experiments - although not sufficient enough to draw any generalizations - may provide increasing evidence that algae thrive in this new unexplored ecological niche which may resemble Venus' poles. We feel that as long as this question about life on Venus is not 100% clear examinations on this subject are worthwhile.
available at https://www.cambridge.org/core/terms. https://doi.org/10.1017/S0074180900102645Downloaded from https://www.cambridge.org/core. IP address: 65.21.228.167, on 21 Mar 2022 at 04:59:55, subject to the Cambridge Core terms of use,

82 JOSEPH SECKBACH AND W. F. LIBBY
G. FINAL COMMENTS
The search for life outside the Earth intensifies with the capacity of man to travel and enter into deep space. Venus with its extreme conditions might provide milder ecological environments for lower vegetation at its cooler poles. Our studies with Cyanid-ium caldarium show that this acidic hot-spring alga thrives in pure C0 2 and under higher pressures. This raises the question of the adaptation range for photosynthetic microorganisms and suggests the study of their biological behavior under the extreme conditions on Venus. It also emphasizes the danger of contamination (or colonization) of other planets with terrestrial microbes.
According to Rubey [45] the primitive Earth was very acidic and abundantly rich with C0 2 (ca. 90%) and the pressure at the initial stage was > 14 atm. A gradual increase of terrestrial C0 2 may cause the organisms to "adapt themselves by generations of evolutionary changes... [so] the effect would be much less disastrous" [45]. Thus, there may have been organisms suitable to Venus in the earliest stages of life on earth.
Acknowledgments
We are indebted to: Professor S. M. Siegel for his active interest and valuable suggestions toward this project; Professor P. D. Voth for the Marchantia plants; Professor R. W. Castenholz for the thermophilic blue green algae; Professors F. A. Eiserling and J. M. Christie for light and electron microscopy, respectively; Miss H. King for C and H determination; and Mr. H. Kappel and Mr. J. Vanek for technical assistance with the high pressure setup.
References
[1] Libby, W. F . : 1968, Science 159, 1097; 1969, Umsch. Wissensch. Tech. 13, 420; Sky Telescope 35, 296.
[2] Raman, A., Corneil, P., and Libby, W. F . : 1969, unpublished report. [2a] Fabian, P. and Libby, W.F. : 1969, Z. Geophys. 35, 1. [3] Tass: 1967, Pravda, No. 295 (17977), 6 (October 22); 1967, in Izvestia, No. 257 (15651,
October 31); Reese, D. E. and Swan, P. R.: 1968, Science 159, 1228; Vinogradov, A. P. Surkov, Yu. A., Florenskiy, K. P., and Andreychikov, B. M.: 1968, Dokl. Akad. SSSR 179, 37; 1968: / . Atmospheric Sci. 25, 535.
[4] Tass: 1969, Pravda, No. 155 (18568), June 4; Brichant, A. L.: * Analysis of Essential Data from Venera 5 and 6' , NASA, Goddard Space Flight Center, Contract No. NAS-512487; Hindley, K.: 1969, New Scientist 42, 700.
[5] Plummer, W. T. and Strong, J.: 1965, Astron. Acta 11, 375. [6] Sagan, C : 1967, Nature 216, 1198. [7] Sagan, C : 1961, Science 133, 849. [8] Morowitz, H. and Sagan, C : 1967, Nature 215, 1259. [9] Kvashin, A.N. and Miroshnickenko, L. I.: 1968, Priroda-(Nature) No. 11, 77.
[10] Brock, T. D. : 1969, Symp. Soc. Gen. Microbiol. (Microbial Growth) 19, 15. [11] Vallentyne, J. R.: 1963, NY. Acad. Sci. 108, 342. [12] Allen, M. B.: 1959, Arch. Mikrobiol. 32, 270. [13] Rabinowitch, E. I.: 1945, Photosynthesis and Related Processes, Vol. I, p. 330; 1951, Vol. II
(pt. 1), p. 903. Interscience Publishers Inc., New York.
available at https://www.cambridge.org/core/terms. https://doi.org/10.1017/S0074180900102645Downloaded from https://www.cambridge.org/core. IP address: 65.21.228.167, on 21 Mar 2022 at 04:59:55, subject to the Cambridge Core terms of use,

VEGETATIVE LIFE ON VENUS? 83
[14] Osterlind, S.: 1949, Symp. Bot. UpsoL 10, 123; Gessner, F.: 1959, Hydrobotanik Deut. Verlag. der Wissensch. Berlin 2, 232; Stalfelt, M. G.: 1960, in Encyclop. Plant PhysioL 5 (pt. 2), 5, 81, Springer Verlag, Berlin.
[15] Gest, H. and Kamen, M. D.: 1960, Encycloped. Plant PhysioL {ibid.) 5, (pt. 2), 568. [16] Golding, N. S.: 1940, / . Dairy Sci. 23, 891. [17] Bartnicki-Garcia, S.: 1963, Bacteriol. Rev. 27, 293; Bartnicki-Garcia, S. and Nickerson, W. J.:
1962, / . Bacteriol. 84, 829. [18] Held, A. A., Emerson, R., Fuller, M. S., and Gleason, F. H.: 1969, Science 165, 706. [19] Emerson, R. and Cantino, E. C : 1948, Am. J. Botany 35, 157. [20] Ewart, A. J.: 1896, / . Linnean Soc. London, Bot. 31, 404. [21] Jacobson, L., Schaedle, M., Cooper, B., and Young, L. C. T.: 1968, PhysioL Plant. 21, 119. [22] Jacobson, L., Schaedle, M., Cooper, B., and Young, L. C. T.: 1967, in Use of Isotopes in
Plant Nutrition and Physiology, IAEA/FAO. Vienna, p. 303. [23] Spruit, C. J. P.: 1962, in PhysioL and Biochem. of Algae (ed. by R. A. Lewin), Academic
Press, New York and London, p. 47. [24] Morita, R. Y.: 1967, Oceanogr. Mar. Ann. Rev. 5, 187. [25] Heden, C-G.: 1964, Bacteriol. Rev. 28, 14. [26] McKeen, C: 1936, Biol. Rev. Cambridge Phill. Soc. 11, 441. [27] Frasser D.: 1951, Nature Ul9 33. [28] Regnard, P.: 1884, Compt. Rend. Soc. BioL, Paris 36, 164. [29] Gross, J. A.: 1965, Science 147, 741. [30] Seckbach, J., Shugarman, P. M., and Baker, F. A.: 1969, unpublished report. [31] Seckbach, J., Nathan, M. B., and Gross, H.: 1969, unpublished report. [31a] Seckbach, J. and Kaplan, T. R.: 1969, unpublished report. [32] Seckbach, J.: 1969, Plant PhysioL Sup. 44; Seckbach, J. and Libby, W. F., ibid.; Seckbach, J.
and Libby, W. F., XI International Botanical Cong., Seattle, Wash., Aug.-Sept. 1969. [33] Green Algae Nutrient Solution (Chlamydomonas) described by Levine, R. P. and Ebersold,
W. T.: 1958, Vererbung 89, 631. [33a] Blue-green algae medium described by Castenholz, R. W.: 1967, Nature 215, 1285, was
used one half strength of green algae. [34] Volk, S. L. and Bishop, N. I.: 1968, Photochem. Photobiol. 8, 213. [35] Mackinney, G.: 1941, / . Biol. Chem. 140, 315. [36] Madsen, E.: 1968, PhysioL Plantarum 21, 168. [37] Halldal, P. and French, C. S.: 1958, Plant PhysioL 33, 249. [38] Brown, T. E. and Richardson, F. L.: 1968, / . PhycoL 4, 38. [39] Fukuda, I.: 1958, Botan. Maq. Tokyo 71, 70. [40] Brock, T. C. and Brock, M. L.: 1969, Limnol. Oceanogr. 14, 334. [41] Klein, R. M. and Conquist, A.: 1967, Quart. Rev. Biol. 42, 219. [42] Rosen, W. G. and Seigesmund, K. A.: 1961, / . Biophys. Biochem. Cytol. 9, 910. [43] Mercer, F. V., Bogorad, L., and Mullens, R.: 1962, / . Cell Biol. 13, 393. [44] Cost, H. R. and Gray, E.: 1968, Bacter. Proc. p. 47. [45] Rubey, W. W.: 1964, in The Origin and Evolution of Atmospheres and Oceans (ed. by P. J.
Brancazio, and A. G. W. Cameron), J. Wiley and Sons, Inc., pp. 1-63. [46] ZoBell, C. E.: 1952, Science 115, 507; ZoBell, C. E. and Johnson, F. H.: 1949, / . Bacter. 57,
179; ZoBell, C. E. and Morita, R. Y.: 1957, / . Bacter. 73, 563. [47] The chemicals were analyzed by Elec. Microanalytical Laboratories at Torrance, Calif., and
by Pacific Spectrochemical Laboratory, Inc., Los Angeles, Calif.
Discussion
Sagan: The polar temperature you think possible in your previous paper is about 200 °C or higher. Have you grown organisms at 100 atm pressure and at these temperatures?
Libby: No, our high pressure experiments were done at about 50 C or less.
available at https://www.cambridge.org/core/terms. https://doi.org/10.1017/S0074180900102645Downloaded from https://www.cambridge.org/core. IP address: 65.21.228.167, on 21 Mar 2022 at 04:59:55, subject to the Cambridge Core terms of use,