vegetation-hydrology interactions · 2009-04-27 · vegetation-hydrology interactions 39 (1) a high...
TRANSCRIPT

T WO
DAVID G. WILLIAMS
AND RUSSELL L. SCOTT
IntroductionRiparian vegetation intercepts surface and subsurface water fl owing from
drainage basins and forms a functionally important interface between terres-
trial and aquatic ecosystems. The infl uence of riparian vegetation on hydro-
logical processes (Malanson 1993, Tabacchi et al. 2000) and, conversely, the
impact of hydrological processes on riparian vegetation (Rood and Mahoney
1990, Auble et al. 1994, Johnson 2000; and see chap. 1) have been the focus
of considerable scientifi c investigation. Through such investigations, ecolo-
gists and hydrologists have formed productive, collaborative relationships
and together have generated broad conceptual understanding of hydrological
factors controlling riparian ecosystem structure and function and associated
feedbacks with stream hydrology and geomorphology (Vannote et al. 1980,
Minshall et al. 1985, Junk et al. 1989, Gregory et al. 1991, Stromberg et al.
1993).
Riparian vegetation infl uences hydrological processes through effects
on runoff and through control of uptake, storage, and return of water to
the atmosphere (Tabacchi et al. 2000). Interactions between riparian vegeta-
tion and hydrological processes are especially strong in arid and semi-arid
basins where the quantity and spatio-temporal distribution of water clearly
Vegetation-Hydrology Interactions
DYNAMICS OF RIPARIAN PLANT WATER USE
UAP-Stromberg-part1-ToPress3.indd 37UAP-Stromberg-part1-ToPress3.indd 37 1/30/2009 3:45:46 PM1/30/2009 3:45:46 PM

38 Williams and Scott
determine the composition and structure of vegetation and associated
biogeochemical processes. The stream catchment is commonly used as the
fundamental unit for hydrological study, and it is within this unit that ecolo-
gists and hydrologists make measurements at a compatible scale.
This chapter describes the current state of knowledge of vegetation-
hydrology interactions in riparian ecosystems of arid and semi-arid basins,
focusing on studies conducted along the upper San Pedro River. We high-
light some key concepts related to the infl uence of riparian plants on stream
hydrology, describe patterns of water use by dominant vegetation communi-
ties along the San Pedro River, and evaluate some of the principal method-
ologies used to make these determinations. The upper portion of this river
near the international border with Mexico has been the focus of numerous
ecohydrological studies (D. Williams et al. 1998, Goodrich, Chehbouni et al.
2000, Goodrich, Scott et al. 2000, Schaeffer et al. 2000, R. Scott et al. 2000a,
2004, R. Scott, Goodrich et al. 2003, R. Scott, Goodrich et al. 2006, Snyder
and Williams 2000, 2003, Yepez et al. 2003, Hultine et al. 2004). The princi-
pal goal of this research is to understand the impact of climate variability,
land-cover variation and change, and hydrogeology on the water balance of
riparian vegetation. These studies have focused particularly on evapotrans-
piration by riparian vegetation with special emphasis on groundwater use by
velvet mesquite (Prosopis velutina) and sacaton (Sporobolus spp.) bunchgrass on
terraces and Fremont cottonwood (Populus fremontii) on fl oodplains. These
three, together with Goodding’s willow (Salix gooddingii), and the shrubs
seepwillow (Baccharis salicifolia) and saltcedar (Tamarix sp.), are the dominant
vascular plants along primary and secondary channels, fl oodplains, and ter-
races of the river (see chap. 1).
The hydrogeomorphic, geologic, and climatic setting of the upper San
Pedro River is complex (see chaps. 13 and 15). Variation in the type and depth
of underlying bedrock, texture and composition of alluvial materials, and
channel morphology produces substantial spatial heterogeneity in depth
to groundwater, streamfl ow, and unsaturated zone hydraulic properties.
Layered over this complex spatial geomorphology and hydrology is ripar-
ian vegetation characterized by heterogeneous patterns and agents of dis-
turbance. Precipitation, an important driver of ecohydrologic patterns and
processes, is seasonally and interannually variable in this semi-arid environ-
ment. The complexity of riparian vegetation structure, hydrogeomorphic
setting, and climate in the upper San Pedro River basin creates signifi cant
challenges and opportunities for research aimed at understanding processes
linking vegetation and hydrology and scaling these processes to the catch-
ment level (Goodrich, Scott et al. 2000, R. Scott, Goodrich et al. 2006).
The need for better understanding and modeling of vegetation-hydrology
interactions in riparian zones of arid and semi-arid basins is critical because
UAP-Stromberg-part1-ToPress3.indd 38UAP-Stromberg-part1-ToPress3.indd 38 1/30/2009 3:45:46 PM1/30/2009 3:45:46 PM

Vegetation-Hydrology Interactions 39
(1) a high level of regional biological diversity in dry landscapes occurs
within riparian ecosystems, (2) riparian vegetation plays an important role
in nutrient biogeochemistry affecting water quality (Peterjohn and Correll
1984; and see chap. 18), (3) riparian environments are valuable to humans for
recreation and aesthetic appeal, and (4) abstraction of groundwater or diver-
sion of streamfl ow for other human uses requires quantitative and objective
evaluation of potential impacts on vegetation (Rood and Mahoney 1990,
Hughes and Rood 2003).
Vegetation-Hydrology Interactions in Riparian EcosystemsThe role of riparian plants in stream hydrologic processes is best illustrated
using the concept of a hydrologic balance (eq. 1).
Qin + Gnet + P – Qout – ET – ΔS = 0 [eq. 1]
Here, Qin and Qout are streamfl ow into and out of the defi ned reach, Gnet is net
input of groundwater, P is precipitation occurring within the defi ned reach,
ET is evapotranspiration from plants, soil and open water, and ΔS is the
change in water storage in the alluvial fl oodplain deposits. Riparian plants
can physically infl uence the hydraulic properties of the streambed and fl ood-
plain surface, thereby affecting transmission and storage of water in alluvium
(Tabacchi et al. 2000). Further, the structural and physiological characteris-
tics of dominant riparian plants control patterns, sources, and rates of ET at
the landscape scale (Sala et al. 1996).
THROUGHFALL, STEMFLOW, AND INFILTRATION
Riparian plants infl uence the capture and cycling of precipitation. That frac-
tion of precipitation falling on vegetation which does not quickly evaporate
passes through the canopy as throughfall or is routed via stemfl ow to the
plant base, where it can infi ltrate the soil (Crockford and Richardson 2000).
Living and dead plant roots and coarse debris at the ground surface create
and alter infi ltration fl ow paths, facilitating rapid transmission of direct pre-
cipitation, throughfall, and stemfl ow to deeper soil layers.
HYDRAULIC REDISTRIBUTION
Roots create macro-pores for infi ltration and percolation and also modify
water transport processes in riparian fl oodplains through “hydraulic redis-
tribution” (Dawson and Pate 1996, S. Burgess et al. 2001, Hultine, Cable et
al. 2003, Hultine, Williams et al. 2003, Hultine et al. 2004). When living
root systems span soil layers with different moisture levels, water is passively
redistributed along gradients from wet to dry soil layers through uptake and
leakage by fi ne roots (Caldwell et al. 1998). Hydraulic redistribution, known
as “hydraulic lift,” when soil water is transported upward in the soil profi le,
UAP-Stromberg-part1-ToPress3.indd 39UAP-Stromberg-part1-ToPress3.indd 39 1/30/2009 3:45:47 PM1/30/2009 3:45:47 PM
40 Williams and Scott
typically occurs at night when root water potentials (the relative potential
energy of water) rise as transpiration-induced tension on plant xylem water
is reduced. The rise in energy of root water compared to water in the sur-
rounding soil allows water to move passively from inside the root to the soil,
in the opposite direction from daytime patterns. The wetted soil stimulates
microbial activity, facilitating mineralization of important plant nutrients
(Caldwell et al. 1998). Although the ecological signifi cance of hydraulic redis-
tribution may, to a large degree, be associated with effects on nutrient avail-
ability, the amount of water redistributed by plant root systems is not trivial
(D. Smith et al. 1999, Hultine et al. 2004, Ryel et al. 2004).
It is still questionable whether hydraulic redistribution substantially
alters landscape-level hydrologic balances. Hultine et al. (2004) revealed that
sustained periods of downward hydraulic redistribution by velvet mesquite
-10
-5
0
5
10
Sap
flow
(lite
rs/n
ight
)
July August September0
10
20
30
40
50
Prec
ipita
tion
(mm
)
lateral root
tap root
a)
b)
-9
-8
-7
-6
-5
-4
-3
-2
-1
0
50 0.05 0.10 .15
Heavy clay layer
Dep
th (m
)
Change in soil water content (v/v)
c)
Date, 2002
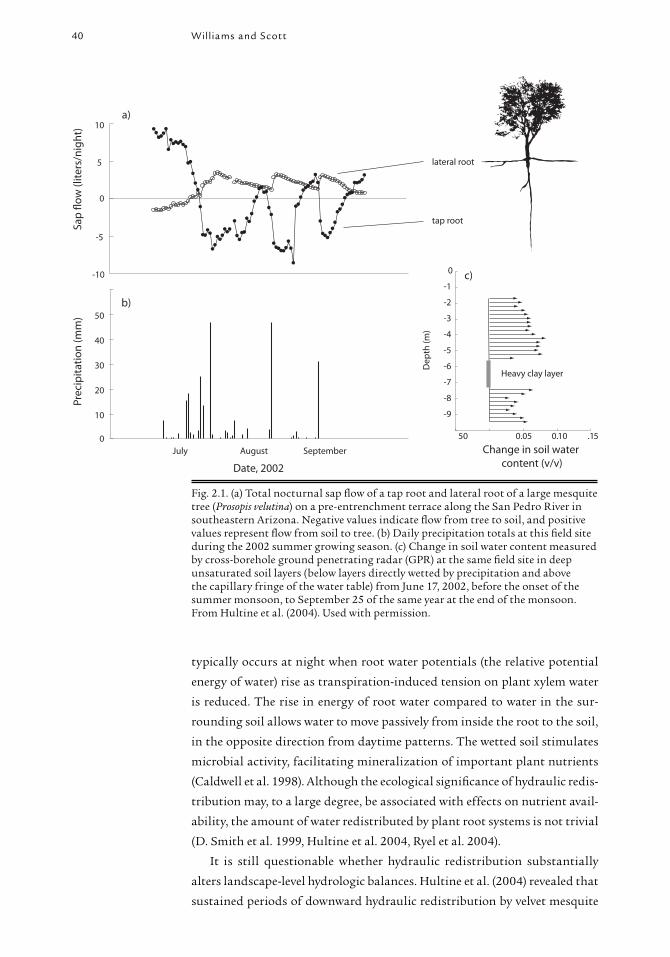
Fig. 2.1. (a) Total nocturnal sap fl ow of a tap root and lateral root of a large mesquite tree (Prosopis velutina) on a pre-entrenchment terrace along the San Pedro River in southeastern Arizona. Negative values indicate fl ow from tree to soil, and positive values represent fl ow from soil to tree. (b) Daily precipitation totals at this fi eld site during the 2002 summer growing season. (c) Change in soil water content measured by cross-borehole ground penetrating radar (GPR) at the same fi eld site in deep unsaturated soil layers (below layers directly wetted by precipitation and above the capillary fringe of the water table) from June 17, 2002, before the onset of the summer monsoon, to September 25 of the same year at the end of the monsoon. From Hultine et al. (2004). Used with permission.
UAP-Stromberg-part1-ToPress3.indd 40UAP-Stromberg-part1-ToPress3.indd 40 1/30/2009 3:45:47 PM1/30/2009 3:45:47 PM

Vegetation-Hydrology Interactions 41
on upper river terraces of the San Pedro during the summer monsoon cor-
responded to progressive accumulation of water deep in unsaturated alluvial
substrates (fi g. 2.1). If this accumulation at depth was strictly a function of
hydraulic redistribution of groundwater and rainfall by mesquite roots,
as the data suggest, and not rapid transmission of rainfall through soil
macro-pores, then widespread conversion of sacaton grassland to mesquite-
dominated communities may profoundly alter the relationships between
precipitation, moisture storage in shallow and deep soil layers, and ET in
riparian fl oodplain environments. Increased moisture storage in deep unsat-
urated layers resulting from hydraulic redistribution by mesquite would
enhance the available water for this deep-rooted shrub during dry periods.
Hydraulic redistribution by mesquite root systems takes place also during
winter months when mesquite canopies are dormant and leafl ess; thus, mes-
quite presence potentially affects the spatial and temporal dynamics of both
winter and summer precipitation storage (ΔS) and use within these ecosys-
tems (Hultine et al. 2004).
EVAPOTRANSPIRATION OVERVIEW
Evapotranspiration is a dominant, but poorly characterized, component of
the riparian corridor water balance. ET includes water taken up and trans-
pired by plants to the atmosphere and direct evaporation of water from the
stream, soil, and living and dead plant surfaces. Evaporation of precipitation
intercepted by plant canopies is included within this term and can account
for as much as 30 percent of the total ET, depending on microclimatic
conditions, plant species composition, and rainfall intensity and duration
(Shuttleworth 1988, Crockford and Richardson 2000). Evaporation from soil
surfaces and interception constitutes a substantial fraction of ET release in
upland ecosystems of arid and semi-arid environments; however, in riparian
ecosystems of drylands, transpiration is by far the most important compo-
nent of ET (Yepez et al. 2003).
Riparian plants control transpiration rates by regulating stomatal
pores on leaf surfaces. Excessively high rates of transpiration are avoided
through closure of stomatal apertures to prevent tension-induced breakage
(cavitation) of the continuous hydraulic connection that exists from soil,
through roots and up to leaf surfaces (Sperry 1995, Sperry et al. 1998). The
embolisms (i.e., the air-fi lled and dysfunctional xylem conduits) formed as
a result of cavitation reduce the water-conducting capacity of the xylem,
potentially exacerbating physiological stress in the plant. Indeed, tension-
induced cavitation is likely the cause of branch dieback and tree mortality
in riparian cottonwoods subjected to water table decline (Tyree et al. 1994).
Riparian plant species such as mesquite, saltcedar, willow, and cottonwood
differ in their vulnerability to tension-induced xylem cavitation (Pockman
UAP-Stromberg-part1-ToPress3.indd 41UAP-Stromberg-part1-ToPress3.indd 41 1/30/2009 3:45:47 PM1/30/2009 3:45:47 PM

42 Williams and Scott
and Sperry 2000) and regulate stomata to different degrees when subjected
to soil or atmospheric drought (S. D. Smith et al. 1991, Horton et al. 2001a).
Such species-specifi c stomatal behaviors and drought-stress vulnerabilities
infl uence species’ distributions and vegetation-hydrology interactions at a
large scale.
In arid and semi-arid environments, ET of riparian vegetation greatly
exceeds precipitation due to access to groundwater by deep-rooted plants (R.
Scott et al. 2004, R. Scott, Goodrich et al. 2006). Potential ET in the San
Pedro basin along the river corridor is ∼1.8 m per year (R. Scott, Goodrich
et al. 2006), and when the water table is shallow, actual ET in riparian veg-
etation approaches this maximum potential ET set by the available energy
driving the vaporization of water (Gazal et al. 2006). Actual ET generally
is less than potential ET due to stomatal limitation (Gazal et al. 2006, R.
Scott, Goodrich et al. 2006), leaf phenology patterns of cold-deciduous spe-
cies, and disequilibria between vegetation successional development and
water availability (Gregory et al. 1991). Under conditions of high atmospheric
evaporative demand or low soil-water availability, riparian vegetation tran-
spires at rates well below potential ET (R. Scott, Watts et al.2003, Gazal et
al. 2006). As a result, simple models relying strictly on potential ET do not
adequately predict uptake and release of water to the atmosphere by riparian
vegetation.
Water Sources of Dominant Plant SpeciesThe key vegetation process affecting riparian zone hydrology is uptake of
water from the phreatic zone (groundwater) by deep-rooted plants followed by
release of this water to the atmosphere. Unfortunately, groundwater uptake
is one of the more diffi cult processes to characterize. Obligate phreatophytes
(e.g., cottonwood and willow) are plant species that do not survive without
access to groundwater. Facultative phreatophytes (e.g., mesquite and saltce-
dar) are plants that take up groundwater if it is available but are capable of
using alternative water sources (e.g., rainfall) and can survive without access
to groundwater.
Because of their structural dominance in riparian ecosystems of the
American Southwest, the physiological ecology and water relations of wil-
low, cottonwood, mesquite, and saltcedar have been intensively studied (S. D.
Smith et al. 1991, Busch et al. 1992, Busch and Smith 1995, Sala et al. 1996,
Cleverly et al. 1997, Devitt et al. 1997, Glenn et al. 1998, Snyder and Williams
2000, 2003, J. Horton et al. 2001a, Nagler et al. 2003, Hultine et al. 2004,
Glenn and Nagler 2005, Gazal et al. 2006). Stable isotope tracer studies,
which take advantage of variation in the abundance of deuterium (2H) and 18O in different source waters (Ehleringer et al. 2000), confi rm that transpira-
tion by willow and cottonwood originates predominantly from the phreatic
UAP-Stromberg-part1-ToPress3.indd 42UAP-Stromberg-part1-ToPress3.indd 42 1/30/2009 3:45:47 PM1/30/2009 3:45:47 PM

Vegetation-Hydrology Interactions 43
zone (Busch et al. 1992, Snyder and Williams 2000). However, where water
table depths for cottonwood exceeded 4 m, approaching the depth threshold
for survival (see chap. 1), cottonwood obtained a signifi cant proportion (>20
percent) of transpiration water from unsaturated soil layers wetted by rain-
fall (Snyder and Williams 2000) (fi g. 2.2).
The facultative phreatophytes mesquite and saltcedar switch water
sources more readily than cottonwood and willow, depending on depth to
groundwater and availability of water in unsaturated alluvial soils (Busch et
al. 1992, Snyder and Williams 2000, 2003). Across a gradient of water table
depth from 1.8 to 4.2 m, Snyder and Williams (2000) observed shifts in the
contribution of groundwater to mesquite transpiration from 100 to less than
50 percent (fi g. 2.2). Saltcedar is similar to mesquite in its capacity to tolerate
drought stress and its fl exibility to use moisture either from groundwater or
unsaturated soil layers (Busch and Smith 1995). Not fully resolved is whether
uptake of rainfall by these riparian species replaces or adds to water taken
from groundwater. This last point is important for understanding the infl u-
ence of riparian phreatophytes on groundwater resources.
Unraveling the complex controls on actual ET and identifying sources
of plant transpiration (groundwater, surface water, soil water, etc.) in the
riparian fl oodplain are the two critical pieces of information needed to
understand how riparian vegetation infl uences the groundwater hydrology
of stream catchments. Identifying and partitioning plant water sources is
fairly straightforward using stable isotope tracer methods (Ehleringer and
0
10
20
30
40
50
60
70
Groundwater depth (m)
Sour
ce w
ater
from
pre
cip
itatio
n (%
)
Prosopis
Populus
Salix
1 2 3 4
Fig. 2.2. Percentage of total plant transpiration in populations of mesquite (Prosopis velutina), cottonwood (Populus fremontii), and willow (Salix gooddingii) obtained from recent rainfall inputs at three sites along the San Pedro River in southeastern Arizona. The sites represented a gradient in depth to groundwater and reveal the heterogeneous nature of vegetation-water interactions in riparian ecosystems. From K. Snyder and Williams (2000). Used with permission.
UAP-Stromberg-part1-ToPress3.indd 43UAP-Stromberg-part1-ToPress3.indd 43 1/30/2009 3:45:47 PM1/30/2009 3:45:47 PM

44 Williams and Scott
Dawson 1992, Ehleringer et al. 2000); however, measuring and predicting ET
and its source across a complex landscape is somewhat more challenging.
Quantifi cation of Evapotranspiration in Riparian EcosystemsAn accounting of ET across the riparian landscape requires fairly sophis-
ticated measurement and modeling approaches. The techniques we review
here have been employed in research on the upper San Pedro River. These
include water budget, in situ measurement, modeling, and remote sensing
approaches.
WATER BUDGET APPROACHES
Researchers use various forms of the water balance equation (eq. 1) to quan-
tify riparian ET (Freethey 1982, Corell et al. 1996, Goodrich, Scott et al.
2000). To do this, ET is determined as the residual of the balance between
infl ow and outfl ow terms over a defi ned river reach and over a specifi ed
time interval. Because of the diffi culty of estimating many of the equation’s
components over a river reach, a number of simplifying assumptions are
often made to reduce the number of terms. For example, along the upper
San Pedro River, researchers have used long-term streamfl ow data to com-
pute an estimate of ET from groundwater by comparing the river basefl ows
( groundwater-derived streamfl ow) during winter months, when transpira-
tion by the riparian vegetation is minimal, to those of summer, when the veg-
etation is active (e.g., Corell et al. 1996). On a smaller reach and for a shorter
period, Goodrich, Scott et al. (2000) synthesized independent estimates for
each term in eq. 1 for a 90-day, dry-season period and found that the water
balance was within 5 percent of total infl ows. However, such a detailed water
balance is not feasible over larger reaches and longer time intervals due to the
dynamics of precipitation, net groundwater inputs, and storage terms.
DIRECT MEASUREMENTS
Direct measurements of ET are necessary for validating and calibrating indi-
rect measurement and for providing data input for modeling approaches (see
next section). Direct approaches to measure riparian vegetation ET include
sap fl ow and micrometeorological approaches.
Sap fl ow techniques. Sap fl ow techniques are used widely in riparian vegetation
research because of their remote fi eld portability, low cost, and capacity for
high temporal and spatial resolution targeted to individual plants (Schaeffer
et al. 2000, Nagler et al. 2003, Hultine et al. 2004, Gazal et al. 2006, R. Scott,
Goodrich et al. 2006). This technique has advantages over other direct mea-
surement techniques because it does not require a large, homogeneous patch
of vegetation for application. It is well suited for strips of streamside vegeta-
UAP-Stromberg-part1-ToPress3.indd 44UAP-Stromberg-part1-ToPress3.indd 44 1/30/2009 3:45:47 PM1/30/2009 3:45:47 PM

Vegetation-Hydrology Interactions 45
tion (Schaeffer et al. 2000) where micrometeorological approaches present
diffi cult challenges (Hipps et al. 1998).
The approach measures (1) the velocity of a heat pulse introduced to the
fl owing sap (Barret et al. 1995), and (2) the dissipation of heat applied con-
tinuously from heaters inserted into the wood (Granier 1987) or completely
enveloping a branch (Baker and van Bavel 1987). When calibrated properly
for variation in wood properties and damage from probe insertion, sap fl ow
techniques provide highly reliable and accurate data. The diffi culty with this
approach lies in scaling the very localized point measurements on a tree to
the stand and landscape levels. Compounded errors associated with spatial
scaling can be signifi cant (+/- ca. 10 to 20 percent), but not insurmountable
(Schaeffer et al. 2000).
Micrometeorological techniques. Micrometeorological techniques, including the
Bowen ratio and eddy covariance methods, monitor patch-scale ET in ripar-
ian areas (Devitt et al. 1997, Cleverly et al. 2002, Dahm et al. 2002, R. Scott
et al. 2000a, 2004, R. Scott, Goodrich et al. 2006). These techniques involve
measuring above-canopy meteorological conditions over a relatively homoge-
neous and extensive (>∼200 – 500 m) patch of land (fi g. 2.3), which limits their
applicability in many riparian settings (Baldocchi et al. 1988, Schmid 1997).
The advantages of micrometeorological data are their high temporal (often <1
hour) resolution, near-continuous sampling (data sets can be collected over
months to years), and patch-scale spatial resolution, which is readily amenable
to scaling up spatially. The disadvantages are its high cost ($15,000 – $45,000)
and low portability.
The Bowen ratio technique is simpler and less costly than eddy covariance
measurement but requires complete measurements of the surface energy
balance to determine ET. Over the last several years, the eddy covariance
technique has become the predominant micrometeorological technique for
measuring ecosystem ET. While the instruments are expensive and the data
analysis sophisticated, it has the advantages of measuring ET directly and
not requiring assumptions about energy balance. As a bonus, many eddy
covariance setups can also estimate carbon dioxide exchange between the
atmosphere and the land surface to understand the relationship between
ecosystem productivity and water use (Baldocchi et al. 2001, R. Scott et al.
2004, R. Scott, Huxman et al. 2006).
The accuracy of micrometeorological techniques for estimating ET
depends on many site-specifi c factors and is generally diffi cult to ascertain.
This is especially true for riparian ET measurements because one cannot
rely on a simple surface water balance (ET = P − ΔS) as a check since the
contributions from the groundwater source are unknown. For eddy covari-
ance measurements, a standard check is to evaluate how the surface energy
UAP-Stromberg-part1-ToPress3.indd 45UAP-Stromberg-part1-ToPress3.indd 45 1/30/2009 3:45:47 PM1/30/2009 3:45:47 PM

46 Williams and Scott
balance is closed. Along the San Pedro River, the eddy covariance sites have
not demonstrated complete closure (R. Scott, Goodrich et al. 2006). Yet, this
is a common occurrence for most sites around the world, and there has been
no consensus as to whether this indicates the possibility that ET is under-
estimated using this approach (Wilson et al. 2002).
Fig. 2.3. (top; 2.3a): A 14-m tall micro-
meteorological tower measures evapo-
transpiration from a riparian mesquite woodland along the
San Pedro River. (bottom; 2.3b):
Micro meteorological instrumentation
to measure evapo-transpiration from
a fl oodplain sacaton grassland along the
San Pedro River. Photo credits: Russell
Scott, USDA – ARS.
UAP-Stromberg-part1-ToPress3.indd 46UAP-Stromberg-part1-ToPress3.indd 46 1/30/2009 3:45:47 PM1/30/2009 3:45:47 PM
Vegetation-Hydrology Interactions 47
MODELING APPROACHES
There is a huge array of models that range from simple empirical relation-
ships to very detailed ecohydrology land-surface models that estimate ET
for specifi c vegetation types (Shuttleworth 1991). The simplest are based on
derived empirical relationships between more easily measured atmospheric
measurements — like air temperature, relative humidity, wind speed, and
solar radiation — and ET measurements. However, it is often problematic to
apply empirical relationships developed for a specifi c site and vegetation type
elsewhere, and these models should be proven locally to validate their appli-
cation. For example, the Arizona Department of Water Resources (ADWR
1991) modeled annual ET for several vegetation types over a large reach of the
San Pedro River using a map of riparian vegetation and an empirical model
(Blaney and Criddle 1950) driven by mean monthly air temperatures and the
monthly percentage of daytime hours of the year (see R. Scott et al. 2000a
for a summary of these model-based estimates). The vegetation-specifi c ET
parameters for this model were derived from a study on the lower Gila River
Valley in Arizona (Gatewood et al. 1950), and the results of this study were
not validated due to the lack of data on the San Pedro. Numerous measure-
ments of annual ET made later (table 2.1) are considerably less (500 mm yr-1
less for some vegetation types) and reveal the danger of using unsubstanti-
ated model results.
The more complex models are physically based and try to represent the
key physical mechanisms that control the ET process, yet applying these
models is diffi cult due to the greater number of vegetation-specifi c param-
eter values required. Thus, it is often necessary to perform model calibration
(again, requiring direct measurements for comparison) to determine the
often unknown, or even unmeasurable, parameters to ensure the model’s
accuracy. For example, Goodrich, Scott et al. (2000) used sap fl ow estimates
of cottonwood/willow ET (Schaeffer et al. 2000) to calibrate the stomatal
resistance term in the well-known Penman-Monteith model (Monteith 1965).
The calibrated model was then used with hourly air temperature, relative
humidity, wind speed, and solar radiation to determine annual cottonwood/
willow ET (fi g. 2.4).
REMOTE SENSING
Remote sensing has the promise of making measurements of land-surface
variables (e.g., surface temperature, solar radiation, soil moisture, absorbed
photosynthetically active radiation, vegetation greenness) relevant to the ET
process over large areas and at regular intervals (from sub-hourly to weeks).
Researchers have developed many ways to utilize remote sensing measure-
ments to drive ET models, ranging from empirical to physically based mod-
els. An example of an empirical approach is a regression relationship between
UAP-Stromberg-part1-ToPress3.indd 47UAP-Stromberg-part1-ToPress3.indd 47 1/30/2009 3:45:48 PM1/30/2009 3:45:48 PM

TA
BLE
2.1
. Es
tim
ates
of t
otal
gro
win
g se
ason
ET
and
ET
from
gro
undw
ater
alo
ng t
he S
an P
edro
Riv
er.
Cov
er t
ype
Stre
amfl o
w
Geo
mor
phic
surf
ace
Vege
tati
on
note
sD
ate
Dep
th t
o G
W
[m]
ET
[mm
]
ET g
w
[mm
]
Can
opy
cove
r
[%]
ET'
gw
[mm
]
Cot
tonw
ood/
W
illow
Pere
nnia
lFl
oodp
lain
1997
0.5–
275
575
510
075
5
Cot
tonw
ood
Pere
nnia
lFl
oodp
lain
Mat
ure
stan
d20
031.
696
696
610
096
6
Inte
rmit
tent
Floo
dpla
inM
atur
e st
and
2003
3.3
484
410
100
410
Mes
quit
eIn
term
itte
ntFl
oodp
lain
Woo
dlan
d20
01–2
003
1063
8–69
448
8–51
074
532–
689
Pere
nnia
lFl
oodp
lain
Den
se s
hrub
land
2003
6.5
565
380
5569
1
Pere
nnia
lFl
oodp
lain
Spar
se s
hrub
land
1997
9.5
330
157
3249
1
Saca
ton
Pere
nnia
lFl
oodp
lain
1997
>3.5
272
0N
A0
Floo
dpla
in20
032.
555
437
465
575
Seep
will
owPe
renn
ial
Floo
dpla
inC
otto
nwoo
d un
ders
tory
2003
1–1.
581
9N
A10
0N
A
Ope
n w
ater
Pere
nnia
lC
hann
elU
nder
mix
ed
cott
onw
ood
cano
py20
03N
A11
5611
56N
A11
56
UAP-Stromberg-part1-ToPress3.indd 48UAP-Stromberg-part1-ToPress3.indd 48 1/30/2009 3:45:48 PM1/30/2009 3:45:48 PM

Vegetation-Hydrology Interactions 49
a vegetation index and ET, whereas a more physically based approach would
use remote sensing to estimate light absorption or surface temperature as
inputs in models that specifi cally represents the surface energy balance
(Bastiaanssen et al. 1998, Davis and Roberts 2000, Kustas et al. 2003, Nagler,
Cleverly et al. 2005).
With the increased availability of remote sensing products from pro-
grams like NASA’s Earth Observing System, there have been many recent
attempts to use remote sensing to assess transpiration from riparian plant
canopies. One approach is to determine ET indirectly from remotely sensed
canopy temperature and in situ air temperature (Qi et al. 1998, Nagler et al.
2003). This approach is based on the cooling effect of transpiration on leaf
surfaces and the remote measurement of canopy temperature (Tc) relative to
surrounding air (Ta) ( Jackson et al. 1981).
Another empirical approach is to use relationships between satellite-
derived vegetation indices and ET. For example, Nagler, Cleverly et al. (2005)
found strong correlations between MODIS-derived indices (Huete et al.
2002) and riparian ET along the Rio Grande and developed an empirical
model using these indices and local air temperature to skillfully predict ET.
This regression relationship has been updated (Nagler, Scott et al. 2005) with
additional measurements of different cover types along the San Pedro and
0
2
4
6
8
10
12
14
16
18
223 224 225 226 227
Modeled ETET scaled from sapflow
Day of year
ET (m
m d
-¹)
0
5
10
15
20
0 5 10 15 20
1:1
Modeled ET (mm d-1)
ET
scal
ed fr
om
sap
flow
(mm
d-¹)
Fig. 2.4. Comparison of calibrated Penman-Monteith model for cottonwood/willow evapotranspiration versus scaled sap fl ow estimates for a fi ve-day period during the monsoon in 1997. The study site was along a perennial section of the upper San Pedro River with a dense, but structurally heterogeneous, canopy of riparian trees. From Goodrich, Scott et al. (2000). Used with permission.
UAP-Stromberg-part1-ToPress3.indd 49UAP-Stromberg-part1-ToPress3.indd 49 1/30/2009 3:45:48 PM1/30/2009 3:45:48 PM

50 Williams and Scott
lower Colorado Rivers. They found that one relationship could be used to
predict ET from a range of riparian cover types from different Western rivers,
and they used this relationship to predict ET for entire reaches.
In contrast to these empirical approaches, Bastiaanssen et al. (1998) devel-
oped a more physically based model that uses radiances recorded by satellite-
based sensors, plus ordinary meteorological data, to solve the energy balance
at the earth’s surface. This model is currently being applied and tested over
many different riparian vegetation types (http://www .sebal.us). One advan-
tage of this more physical approach is that the model does not require that
the vegetation be well watered, which might be the reason why the vegetation
index approach of Nagler, Scott et al. (2005) has worked in its application so
far but might not work for riparian vegetation along ephemeral fl owing rivers
that experience more seasonal water stress. One possible setback to the use of
remote sensing for riparian ET is that the 0.25 – 1 km scale of many of the satel-
lite measurements like surface temperature or some vegetation indices can be
greater than the scale of homogeneous riparian vegetation patches of interest.
Patterns of Evapotranspiration in the Upper San Pedro Riparian EcosystemMany of the in situ estimates of riparian ET along the upper San Pedro
River come from the Semi-arid Land-Surface-Atmosphere (SALSA) Program
(Goodrich, Chehbouni et al. 2000), the National Science Foundation’s
Sustainability of Semi-arid Hydrology and Riparian Areas (SAHRA) center,
and the Upper San Pedro Partnership (USPP) Water Needs Study (Leenhouts
et al. 2006). For these studies, the amount of ET derived from groundwater was
quantifi ed so that the total groundwater use by phreatophytes in the basin,
an important component of the basin’s groundwater budget, could be deter-
mined. ET rates, summarized in table 2.1 and shown diagramatically in fi gure
2.5, were quantifi ed for various vegetation types in a range of hydrogeomorphic
settings (Schaeffer et al. 2000, Goodrich, Scott et al. 2000, R. Scott et al. 2000a,
2004, R. Scott, Goodrich et al. 2006). In addition to seasonal ET, estimates
were made for the amount of ET derived from groundwater (ETgw, table 2.1)
using a mass balance approach for the micrometeorological studies (R. Scott,
Goodrich et al. 2006) or by isotopic identifi cation of source water (Snyder and
Williams 2000). Finally, ETgw, normally given in units of water volume per land
surface area per time, was divided by the fractional phreatophyte cover in order
to provide an estimate of total riparian groundwater use for 100 percent land
cover (ET’gw) so that a total ET for a reach could be determined.
INTER-ANNUAL VARIABILITY
For vegetation types with multi-year ET estimates (the cottonwoods along a
perennial reach and the mesquite woodland), there was considerable inter-
UAP-Stromberg-part1-ToPress3.indd 50UAP-Stromberg-part1-ToPress3.indd 50 1/30/2009 3:45:48 PM1/30/2009 3:45:48 PM

Vegetation-Hydrology Interactions 51
annual variability (table 2.1). We speculate that most of this variability is
controlled by climate, namely, spring and fall temperatures (frost events)
and precipitation. The spring and fall temperatures determine the length
of the transpirational growing season and are quite variable from year to
year (R. Scott, Goodrich et al. 2006). The amount of precipitation within
the growing season also impacts total ET due to use of shallow soil water
sacaton
sacaton cottonwood patch
seepwillow patch
semi-shaded open water
sparse mesquite shrubland
dense mesquite shrubland
~300 mm ~300 mm ~600 mm ~500 mm ~1000 mm ~800 mm ~1200 mm
Perennial Reach
Fig. 2.5. Stylized representation of growing season evapotranspiration (ET) rates for riparian vegetation types (and open water) on different fl uvial surfaces (fl ood-plains and terraces) and in perennial and intermittent reaches of the San Pedro River riparian corridor (values are based on measurements given in table 2.1). ET values are not available for vegetation patches shown in gray. Illustration credit: Mike Buffi ngton.
~700 mm ~500 mm
Intermittent Reach
sacaton
seasonalopen watersacaton cottonwood
patchseepwillow
patch
mesquite woodland
sparse mesquite shrubland
UAP-Stromberg-part1-ToPress3.indd 51UAP-Stromberg-part1-ToPress3.indd 51 1/30/2009 3:45:48 PM1/30/2009 3:45:48 PM

52 Williams and Scott
by plants such as mesquite. Wintertime precipitation also appears to play a
role in the functioning of mesquite later in the year, likely through storage of
water by hydraulic redistribution (Hultine et al. 2004, R. Scott et al. 2004).
VARIATION IN ET WITHIN AND AMONG PLANT COMMUNITIES
In general, the highest rates of ET along the upper San Pedro River are for
open water surfaces followed by cottonwood, seepwillow, mesquite, and saca-
ton (table 2.1). For cottonwoods, ET and ETgw were higher along a perennial
reach with shallow groundwater but markedly reduced along an intermittent
reach with a greater depth to, and fl uctuation in, groundwater. ET was highly
variable among mesquite communities, but ETgw was less variable, indicating
that the groundwater use by mesquite trees was similar across sites with dif-
ferent depths to groundwater (R. Scott, Goodrich et al. 2006). Sacaton had
high ET and used groundwater at one site but had low ET and did not use
groundwater at another site with a greater depth to groundwater; a depth to
groundwater of 3 m is a likely cutoff that determines whether this grass does
or does not use substantial quantities of groundwater. Finally, seepwillow
ET was large, despite the reduced atmospheric demand present in the cot-
tonwood understory occupied by these shrubs. Apparently, the cottonwood
canopy structure allows suffi cient (radiative and/or advected) energy to reach
the understory shrubs, allowing them to transpire at high rates.
Evapotranspiration in Stands of Saltcedar (Tamarix spp.)Reported estimates of saltcedar ET vary widely. Variable environmental con-
ditions and differing structural characteristics observed among saltcedar
stands may explain these differences. Evapotranspiration in any riparian
vegetation type is spatially and temporally variable due to differences in
vegetation density, groundwater depth, seasonal plant phenology, and avail-
able energy. Collectively, studies reporting ET in saltcedar reveal magnitudes
and levels of temporal and spatial variability comparable to those reported
for stands of native riparian woody vegetation (Robinson 1970, Weeks et al.
1987, Sala et al. 1996, Devitt et al. 1998, Cleverly et al. 2002, Dahm et al.
2002). On a per leaf area or plant basis, saltcedar has transpiration rates sim-
ilar to native riparian taxa (Busch and Smith 1995, Sala et al. 1996, Cleverly
et al. 2002, Dahm et al. 2002). Where saltcedar occurs at very high densities
and has a high leaf area index, its ET may be greater than for other riparian
vegetation (Sala et al. 1996, Nagler et al. 2004).
However, several recent studies employing eddy covariance methods show
that saltcedar ET is not greater than riparian stands dominated by native
woody taxa (Weeks et al. 1987, Cleverly et al. 2002, Dahm et al. 2002). Total
annual ET of saltcedar stands ranged from 74 cm in an unfl ooded stand to
122 cm in a fl ooded stand (Cleverly et al. 2002). For comparison, total grow-
UAP-Stromberg-part1-ToPress3.indd 52UAP-Stromberg-part1-ToPress3.indd 52 1/30/2009 3:45:48 PM1/30/2009 3:45:48 PM

Vegetation-Hydrology Interactions 53
ing season ET was 48 to 97 cm in unfl ooded stands of cottonwood and 33 to
69 cm in unfl ooded stands of mesquite along the San Pedro River (table 2.1).
Clearly, saltcedar is not an extraordinary water user in all situations. Indeed,
leaf area index, a measure of the evaporative surface area of leaves per unit of
ground area, which is highly correlated to actual ET in riparian vegetation
(Sala et al. 1996, Schaeffer et al. 2000, Cleverly et al. 2002), was, on average,
lower in stands of saltcedar than in stands of cottonwood and willow along
the lower Colorado River (Nagler et al. 2004).
Scaling Evapotranspiration up to the Catchment LevelRiparian ET at the stream reach or catchment level can be a major compo-
nent of the surface water and groundwater budgets of watersheds in arid and
semi-arid environments, and ET at these scales is often the most relevant for
watershed stakeholders. Often the surface water and groundwater budgets
are determined independently, so it is important to identify the riparian
ET source water so that ET can be partitioned into surface water (ETsw) and
groundwater (ETgw) sources. In the Sierra Vista subbasin of the upper San
Pedro River basin, the focus has been on determining groundwater use by
riparian vegetation because perennial fl ow in the river, the condition of the
riparian vegetation, and people living in the basin all depend on water from
this aquifer source.
Prior to the SALSA Program (Goodrich, Chehbouni et al. 2000), numer-
ous estimates of upper San Pedro River riparian corridor groundwater
usage were derived indirectly using conceptual and numerical models (e.g.,
Freethey 1982, Vionnet and Maddock 1992, Corell et al. 1996). More recently,
Goodrich, Chehbouni et al. (2000) and R. Scott, Goodrich et al. (2006) have
quantifi ed riparian corridor groundwater use from direct measurements of
ET (see Quantifi cation of Evapotranspiration in Riparian Ecosystems, p.44).
These estimates of ETgw (table 2.1) for each vegetation type were multiplied
by the area within the riparian corridor covered by that vegetation and then
totaled to determine riparian groundwater use. A major advantage to this
approach is that it is based on actual measurements rather than on model
outputs, which have considerable uncertainty at large scales. A major disad-
vantage stems from the implicit assumption that ET of a particular vegeta-
tion type can be accurately represented from measurements at a few loca-
tions. Site-to-site heterogeneity in vegetation age, density, and environmental
conditions is the rule along most rivers, and the effects of this heterogeneity
on ET are often unknown. Instrumentation networks need to be expanded
to sample the range of conditions occupied by each particular vegetation
type, but the costs and feasibility of such sampling can be prohibitive.
Table 2.2 presents a detailed riparian groundwater-use budget for the San
Pedro River from the international border to the Tombstone gage during
UAP-Stromberg-part1-ToPress3.indd 53UAP-Stromberg-part1-ToPress3.indd 53 1/30/2009 3:45:49 PM1/30/2009 3:45:49 PM

54 Williams and Scott
2003 (R. Scott, Goodrich et al. 2006). The median estimate of 2003 ground-
water withdrawal by riparian vegetation along the San Pedro and within the
Sierra Vista subwatershed is 10,089,000 m3 yr-1 (table 2.2), and the natural
groundwater recharge estimated to have occurred in 2002 within this basin
is 22,203,000 m3 yr-1 (ADWR 2005a). This reveals the importance of riparian
ET in the water budget.
The estimates of riparian groundwater use from R. Scott, Goodrich et
al. (2006) and Goodrich, Scott et al. (2000), the two most recent studies
that used a similar approach, differ by nearly 3,000,000 m3 yr-1 or 27 per-
cent of the larger amount. The difference between these two studies can be
explained by revisions and improvements made by R. Scott, Goodrich et al.
(2006) to the approach of Goodrich, Scott et al. (2000) including (1) revised
estimates of water use of different cover types, based on improved measure-
ment methodology and sampling of a greater number of sites and a greater
range of hydrologic conditions, and (2) use of a more detailed vegetation
map. The difference in vegetation areas between the two vegetation maps
TABLE 2.2. Riparian groundwater use in 2003 along the main stem of the San Pedro River from the international border to the Tombstone gaging station (from R. Scott, Goodrich et al. 2006).
Cover type
Minimum
amountd
[ha]
Maximum
amountd
[ha]
2003 ETgw
[mm yr-1]
Min. GW Use
[1000 m3 yr-1]
Max. GW Use
[1000 m3 yr-1]
Mesquite 723 973 689 4983 6706
Cottonwood/Willow (perennial fl ow) 253 253 966 2444 2444
Cottonwood/Willow (intermittent fl ow) 118 118 410 484 484
Sacaton (<3 m to groundwater) 113 167 575 650 961
Open water 43 43 1156 497 497
Saltcedara 1 3 689 7 21
Total 9065 11112
Total from Corell et al. (1996)b 8758
Total from Goodrich, Scott et al. (2000)c 8130aSaltcedar ET was not measured and assumed the same as mesquite. bUsing basefl ow information from the Palominas, Charleston, and Tombstone gages and subtracting their estimate of 600 ac-ft/yr for the Babocomari River.cFrom the international border to the Tombstone Gage.dVegetation amounts vary due to the polygon-based map, which did not specify exact percentages of vegetation cover for some of the sacaton and mesquite polygons.
UAP-Stromberg-part1-ToPress3.indd 54UAP-Stromberg-part1-ToPress3.indd 54 1/30/2009 3:45:49 PM1/30/2009 3:45:49 PM

Vegetation-Hydrology Interactions 55
is alarming. This type of scaling depends on an accurate vegetation map,
and differences between the two maps highlight the diffi culty in vegetation
classifi cation.
Uncertainty in the estimates of R. Scott, Goodrich et al. (2006) is dif-
fi cult to quantify and arises from measurement errors, the application of
site-specifi c measurements across the reach, and uncertainty in vegetation
amounts. Given these complications, uncertainty will always be a part of
these and future reach-scale estimates even while we hope that their accuracy
improves with each successive iteration.
Conclusions and Challenges for Future ResearchDue to spatial and temporal heterogeneity in water availability and a high-
frequency pulse-disturbance fl ood regime, the structure and hydrologic
function of riparian plant communities in arid and semi-arid environments
are extremely dynamic. Understanding the effects and feedbacks associated
with spatio-temporal heterogeneity and scaling these responses to the catch-
ment level represent great challenges to researchers focused on ecohydrologi-
cal interactions in riparian ecosystems. Riparian vegetation infl uences the
hydrologic cycle directly through controls on interception, soil water redistri-
bution, and evapotranspiration, and indirectly through effects on stream geo-
morphology and accumulation of coarse woody debris. Evapotranspiration is
particularly diffi cult to quantify and model in riparian ecosystems. However,
the combined application of sap fl ow, eddy covariance, isotope, and remote
sensing techniques has greatly reduced the uncertainty in estimates of ET
and clarifi ed our understanding of vegetation- groundwater relationships.
We still have limited understanding of how riparian vegetation water
use responds to discrete pulses of rainfall, fl ood events, and rapid ground-
water fl uctuations. A more complete integration of plant ecophysiological
properties and vegetation dynamics within a hydrological context will lead
to models of vegetation-hydrology interactions that include pulsed resource
and disturbance processes. Such models, when calibrated with landscape
characteristics and vegetation parameterizations, offer researchers a valu-
able scientifi c tool for synthesizing information on key processes and iden-
tifying limitations to conceptual understanding. For stakeholders who wish
to negotiate the most prudent policies for managing riparian vegetation and
groundwater resources, such models could form the basis for identifying
risks and potential outcomes of management activities.
An accurate accounting of riparian ET is required to properly apportion
water for both human and environmental needs, especially along rivers in
dryland regions like the southwestern United States. Accordingly, efforts to
estimate riparian ET similar to those used for the San Pedro have been, or
UAP-Stromberg-part1-ToPress3.indd 55UAP-Stromberg-part1-ToPress3.indd 55 1/30/2009 3:45:49 PM1/30/2009 3:45:49 PM

56 Williams and Scott
are being, employed in the middle Rio Grande and lower Colorado basins
(Brower 2004, USBOR 2002). A common approach of using state-of-the-art
direct measurements of ET over representative vegetation types to calibrate
and improve models driven with local meteorological and/or remote sensing
measurements has emerged in these efforts. As these efforts progress, a more
general understanding of the riparian ET process and how to quantify this
process will emerge.
UAP-Stromberg-part1-ToPress3.indd 56UAP-Stromberg-part1-ToPress3.indd 56 1/30/2009 3:45:49 PM1/30/2009 3:45:49 PM