vedanta ltd. credit report...vedanta ltd. average of top 6 competitors source -bloomberg working...
TRANSCRIPT


Company Snapshot
Business Description
Corporate Governance
Industry Overview & Competitive Analysis
Financial Analysis
Capital Structure
Liquidity Analysis
Investment Summary
Investment Recommendation
AGENDA

COMPANY SNAPSHOT
1954
2007
2011
2015
Evolution of Vedanta Ltd.
•
•
•
Key Highlights Financials

Company Snapshot
Business Description
Corporate Governance
Industry Overview & Competitive Analysis
Financial Analysis
Capital Structure
Liquidity Analysis
Investment Summary
Investment Recommendation
AGENDA

ALUMINIUM
• BALCO
• Jharsuguda
• Lanjigarg
ZINC
• HZL
• Zinc International
• Gamsberg
OIL & GAS
• CAIRN
• Raageshwari Deep Gas
• Bhagyam & Aishwariya
COPPER
• Tuticorin
• Mt Lyell (Australia)
IRON ORE
• Codli Goa
• Narrain(Karnataka)
POWER
• Talwandi Sabo Power Plant
• Jharsuguda
KEY BUSINESS AREAS
ALUMINIUM
28%
ZINC28%
COPPER24%
IRON ORE7%
OIL & GAS4%
POWER7%
OTHERS2%
SECTOR WISE REVENUE CONTRIBUTION
BUSINESS DESCRIPTION

BUSINESS MODEL
.
Exploration of Mines
1
Cutting EdgeTechnology
3
Economiesof Scale
4
5
Efficient SupplyChain
DEMANDSUPPLY
CommunityDevelopment 2

• Demand
increased by 3%
• Price Increased by
6.2%
• Industries: Rods,
billets, foundry
• Countries:
Europe, North &
South America
• Estimated Prod. in
FY2017-18 is 1.6
MTS
• Reduction in hot
metal
40% MARKET SHARE
1.25 MTS PRODUCTION
40%MARKET CUSTOMERS OUTLOOK
ALUMINIUM

• Demand
increased by 8%
• Prices decreased
by 1%
• Industries: Cable,
transformers
manufactures
• Countries: China,
Vietnam, UAE
• Sustain current
production and
reduce the cost
profile
35% MARKET SHARE
402KMTS PRODUCTION
(Increase by 5%)
35%MARKET CUSTOMERS OUTLOOK
COPPER
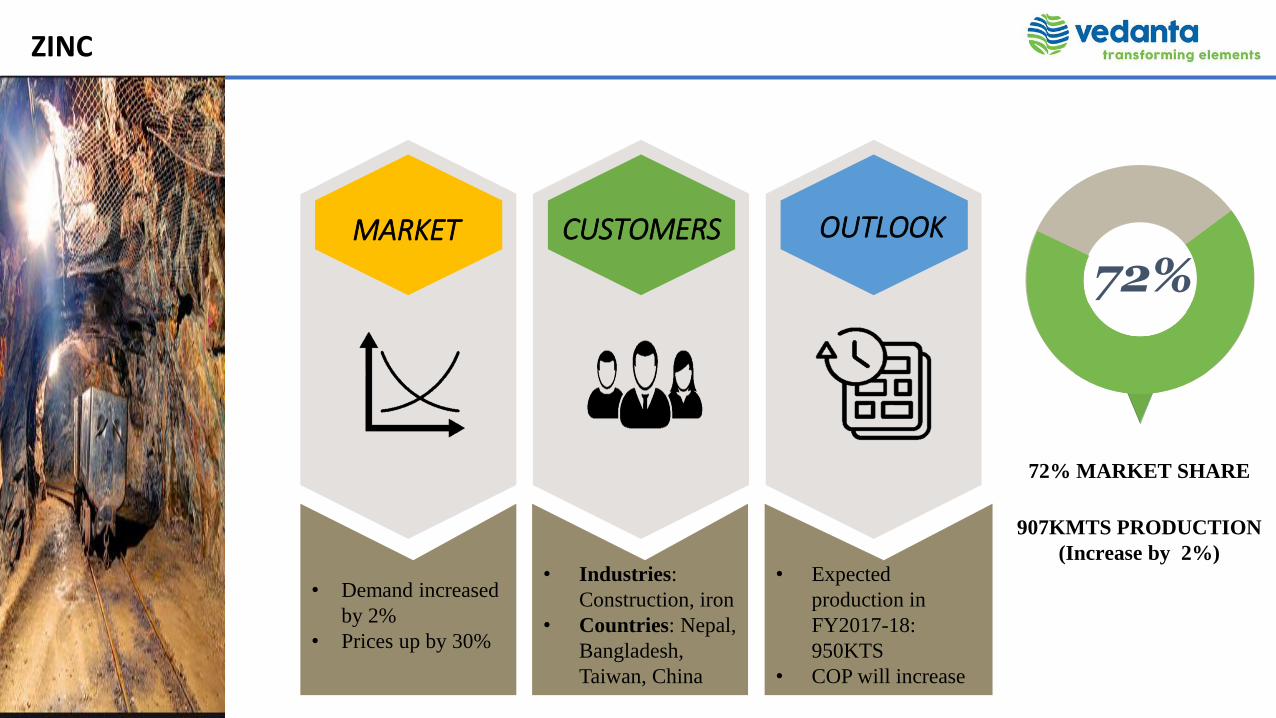
• Demand increased
by 2%
• Prices up by 30%
• Industries:
Construction, iron
• Countries: Nepal,
Bangladesh,
Taiwan, China
• Expected
production in
FY2017-18:
950KTS
• COP will increase
72% MARKET SHARE
907KMTS PRODUCTION
(Increase by 2%)
72%MARKET CUSTOMERS OUTLOOK
ZINC

GLOBAL PRESENCE
ALUMINIUM
COPPER
ZINC
IRON ORE
North America
South America
China
Malaysia
VietnamUAE
Nepal
Bangladesh
Taiwan
Sri Lanka
South Korea
Europe

Company Snapshot
Business Description
Corporate Governance
Industry Overview & Competitive Analysis
Financial Analysis
Capital Structure
Liquidity Analysis
Investment Summary
Investment Recommendation
AGENDA

Stakeholder relationship committee
CSR Committee
Nomination & Remuneration
committee
Risk Management
Committee
Committee of directors
Key Highlights:
Audit Committee
•
•
•
•
•
•
•
•
•
•
MANAGEMENT & CORPORATE GOVERNANCE
Company Snapshot
Business Description
Corporate Governance
Industry Overview & Competitive Analysis
Financial Analysis
Capital Structure
Liquidity Analysis
Investment Summary
Investment Recommendation
AGENDA

INDUSTRY OVERVIEW & COMPETITIVE POSITIONING
INDUSTRY COMPETITION
Al
Cu
Zn
• High caustic soda consumption• Increase in Graphite electrode price
Host of cost saving initiatives
• Smart cities mission, Railway modernization
• Declining global steel production
• Import from ASEAN countries with zero import duty
• High cost of working capital
• Closest competitor Hindalco (1.19MTS)• Global leader China: 55% market share
• Closest competitor: Binani zinc (0.03 MMTPA)
• Global leader – China: 37% market share
• Closest competitor:Hindustan Copper Ltd.
• Global leader – Chile: 34% market share

Company Snapshot
Business Description
Corporate Governance
Industry Overview & Competitive Analysis
Financial Analysis
Capital Structure
Liquidity Analysis
Investment Summary
Investment Recommendation
AGENDA

0.00
5.00
10.00
15.00
20.00
25.00
30.00
35.00
-
10,000
20,000
30,000
40,000
50,000
60,000
70,000
80,000
2014-15 2015-16 2016-17
EBIT
DA
Mar
gin
(%
)
INR
In C
rore
s
Revenue, EBITDA & EBITDA Margin
Revenue EBITDA EBITDA Mrgin(%)
FINANCIAL PERFORMANCE OF VEDANTA LTD.
12% 41% 25%
Source -Bloomberg
0.0
50,000.0
1,00,000.0
1,50,000.0
2,00,000.0
2,50,000.0
INR
Mill
ion
s
Revenue by Segments
FY 2015 FY 2016 FY 2017

Source -BloombergSource –Annual Report
Increased Capacity
FINANCIAL PERFORMANCE OF VEDANTA LTD.
0
1000
2000
3000
4000
5000
6000
7000
8000
Pri
ces
in $
/mt
LME Commodity Pricing
LME Zinc LME Aluminum LME Copper Price
Improved Commodity Prices
18%
1 2

Cost Efficiency
FINANCIAL PERFORMANCE OF VEDANTA LTD.
3
14%
7%
57%
14%
8%
SEGMENT-WISE CONTRIBUTION TO COST SAVINGS (%)
ZINC COPPER ALUMINIUM & POWER OIL & GAS IRON ORE

COMPETITORS FOR PEER COMPARISON
Anglo AmericanHindalco Industies
Rio Tinto Group
BHP Biliton Ltd.National AluminiumCompany
Hindustan Copper

Source -Bloomberg
-
20,000
40,000
60,000
80,000
1,00,000
1,20,000
1,40,000
1,60,000
FY 14 FY 15 FY 16 FY 17
INR
in C
rore
s
Revenue from Operations
Vedanta Ltd. Average of top 6 competitors
-
10,000
20,000
30,000
40,000
50,000
60,000
FY 14 FY 15 FY 16 FY 17
INR
in C
rore
s
EBITDA
Vedanta Ltd. Average of top 6 competitors
30.97 30.05
23.77
29.78
0.00
5.00
10.00
15.00
20.00
25.00
30.00
35.00
FY 14 FY 15 FY 16 FY 17
EBITDA Margin (%)
Vedanta Ltd. Average of top 6 competitors
•
•
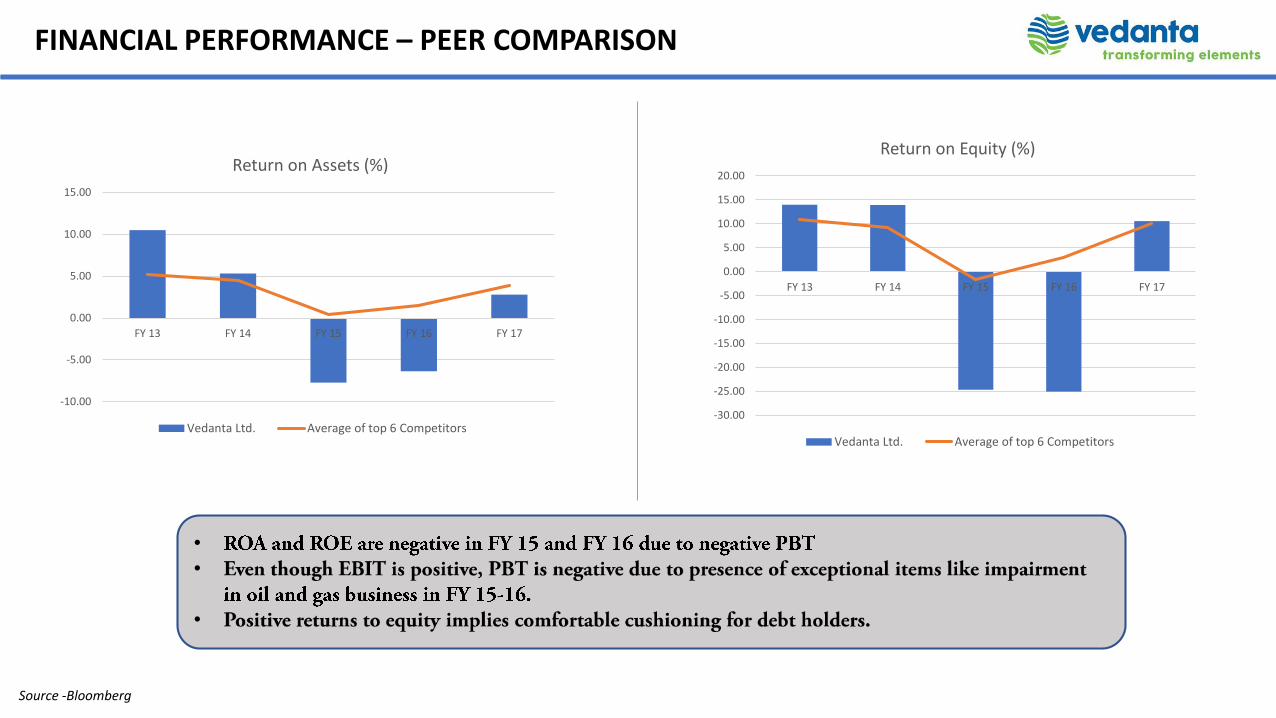
FINANCIAL PERFORMANCE – PEER COMPARISON
Source -Bloomberg
-10.00
-5.00
0.00
5.00
10.00
15.00
FY 13 FY 14 FY 15 FY 16 FY 17
Return on Assets (%)
Vedanta Ltd. Average of top 6 Competitors-30.00
-25.00
-20.00
-15.00
-10.00
-5.00
0.00
5.00
10.00
15.00
20.00
FY 13 FY 14 FY 15 FY 16 FY 17
Return on Equity (%)
Vedanta Ltd. Average of top 6 Competitors
FINANCIAL PERFORMANCE – PEER COMPARISON
•
•
•

Company Snapshot
Business Description
Corporate Governance
Industry Overview & Competitive Analysis
Financial Analysis
Capital Structure
Liquidity Analysis
Investment Summary
Investment Recommendation
AGENDA

60%
33%
7%
SHAREHOLDING PATTERN AS ON 31ST
MARCH, 2017
TOTAL PROMOTER TOTAL PUBLIC ADR
Source: Company Annual Report
CAPITAL STRUCTURE
Particulars INR CRORES
Cash and cash equivalents 9,863.71
Other bank balances 4,259.03
Non-current bank deposits 2,779.27
Current investments 46,889.18
Total (a) 63,791.19
Non-current borrowings 30,255.14
Current borrowings 32,244.87
Current maturities of non-current borrowing 9,069.00
Total (b) 71,569.01
Net debt (c=(b-a)) 7,777.82
Total equity (d) 74,428.04
Total capital (e = equity + net debt) 82,205.86
Gearing ratio (c/e) 0.09

TERM
LOAN- USD
10%
TERM LOAN-
RUPEE
31%
EXTERNAL COMMERCIAL
BORROWINGS
3%
REDEEMABLE NON-
CONVERTIBLE
DEBENTURES
19%
COMMERCIAL
PAPER
33%
WORKING CAPITAL LOAN
2%
OTHERS
2%
TOTAL BORROWINGS BREAKDOWN
Source: Company Annual Report
1.13
0.630.48
0
0.2
0.4
0.6
0.8
1
1.2
DEBT TO EQUITY
X t
imes
Debt to Equity
FY 2015 FY 2016 FY 2017
0.62
0.40.29
00.10.20.30.40.50.60.7
Long-term Debt to Equity
X t
imes
Long-term Debt to Equity
2015 2016 2017
DEBT ANALYSIS

02468
10121416
Average Cost Of Debt falling due to increased borrowings in USD
Weighted AverageCost of Debt Weighted Average Cost of Cap
Weighted AverageCost of Equity
Source: Bloomberg
COST OF BORROWINGS
•
•

1.49
0.720.54
0
0.2
0.4
0.6
0.8
1
1.2
1.4
1.6
2015 2016 2017
NET DEBT/EBITDA (PEER COMPARISON)
VEDL TOP COMPETITORS
2.19
1.65 1.74
0.00
0.50
1.00
1.50
2.00
2.50
FY 2015 FY 2016 FY 2017
X T
IMES
DSCR of Vedanta Ltd.
•
•
•
•
•
•
Source: Bloomberg Source: Company Annual Report
DEBT SERVICABILITY

Company Snapshot
Business Description
Corporate Governance
Industry Overview & Competitive Analysis
Financial Analysis
Capital Structure
Liquidity Analysis
Investment Summary
Investment Recommendation
AGENDA

0.00
5.00
10.00
15.00
20.00
25.00
30.00
35.00
FY 14 FY 15 FY 16 FY 17
No
. of
day
s
Accounts Receivable Turnover Days
Vedanta Ltd. Average of top 6 competitors
0.00
50.00
100.00
150.00
200.00
250.00
300.00
FY 14 FY 15 FY 16 FY 17
No
. of
day
s
Inventory Days
Vedanta Ltd. Average of top 6 competitors
0.00
50.00
100.00
150.00
200.00
250.00
300.00
FY 14 FY 15 FY 16 FY 17
No
. of
day
s
Accounts Payable Turnover Days
Vedanta Ltd. Average of top 6 competitors
-150.00
-100.00
-50.00
0.00
50.00
100.00
150.00
FY 14 FY 15 FY 16 FY 17
No
. of
day
s
Working Capital Conversion Cycle
Vedanta Ltd.
Average of top 6competitors
Source -Bloomberg
WORKING CAPITAL – PEER COMPARISON

0
0.5
1
1.5
2
2.5
3
FY 14 FY 15 FY 16 FY 17
X t
imes
Current Ratio
Vedanta Ltd. Average of top 6 competitors
0
0.2
0.4
0.6
0.8
1
1.2
1.4
1.6
FY 14 FY 15 FY 16 FY 17
X t
imes
Quick Ratio
Vedanta Ltd. Average of top 6 competitors
0.00
0.10
0.20
0.30
0.40
0.50
0.60
FY 14 FY 15 FY 16 FY 17
X t
imes
Asset Turnover Ratio
Vedanta Ltd. Average of top 6 Competitors
Source -Bloomberg
LIQUIDITY PERFORMANCE – PEER COMPARISON
•
•

0
5
10
15
20
25
30
FY 14 FY 15 FY 16 FY 17
%
CFO to Sales
Vedanta Ltd. Average of top 6 competitors
0.00
0.10
0.20
0.30
0.40
0.50
0.60
FY 14 FY 15 FY 16 FY 17
X t
imes
CFO to Total Debt
Vedanta Ltd. Average of top 6 competitors
0.00
5000.00
10000.00
15000.00
20000.00
25000.00
30000.00
35000.00
FY 14 FY 15 FY 16 FY 17
INR
in C
rore
s
Free Cash Flow
Vedanta Ltd. Average of top 6 competitors
0.00
0.20
0.40
0.60
0.80
1.00
1.20
1.40
FY 14 FY 15 FY 16 FY 17
X t
imes
CFO to EBITDA
Vedanta Ltd. Average of top 6 competitors
Source -Bloomberg
•
•
LIQUIDITY PERFORMANCE – PEER COMPARISON

Company Snapshot
Business Description
Corporate Governance
Industry Overview & Competitive Analysis
Financial Analysis
Capital Structure
Liquidity Analysis
Investment Summary
Investment Recommendation
AGENDA
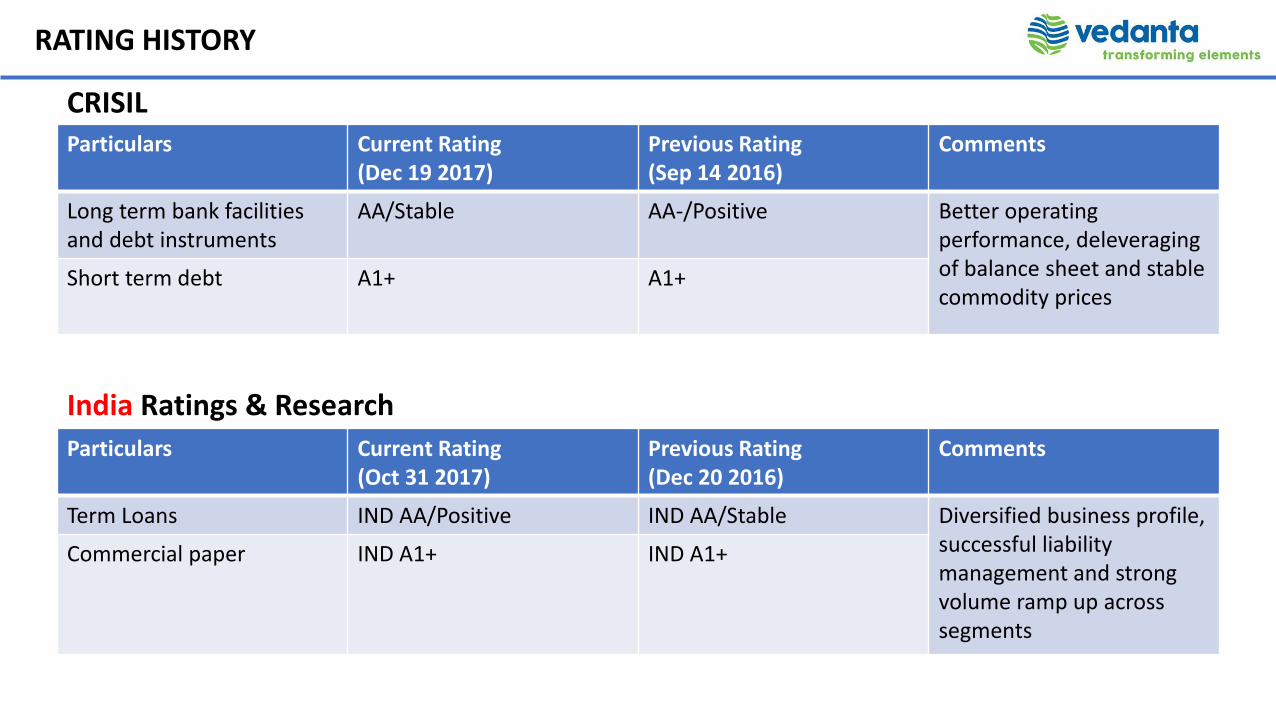
RATING HISTORY
Particulars Current Rating (Dec 19 2017)
Previous Rating (Sep 14 2016)
Comments
Long term bank facilities and debt instruments
AA/Stable AA-/Positive Better operating performance, deleveraging of balance sheet and stable commodity prices
Short term debt A1+ A1+
Particulars Current Rating (Oct 31 2017)
Previous Rating (Dec 20 2016)
Comments
Term Loans IND AA/Positive IND AA/Stable Diversified business profile, successful liability management and strong volume ramp up across segments
Commercial paper IND A1+ IND A1+
India Ratings & Research
CRISIL

KEY RATING DRIVERS
Merger with CAIRN
Diverse Company
Profile
High past Capex
funded by debt
UncertainProduction
Capacity Expansion
Cost Efficiency
Increasing Short Term Obligation-falling CR
Growing EBITDA
Excellent safety and
security Mgmt
CAIRN Tax Obligation
Deleverage – falling
debt equity ratio
KEY RATING DRIVERS

Merger with CAIRN
Diverse Company
Profile
Capacity Expansion
Cost Efficiency
Growing EBITDA
Excellent safety and
security Management Deleverage
– falling debt equity
ratio
LOW MEDIUM HIGH
IMPACT ASSESSMENT –KEY RATING DRIVERS

LOW MEDIUM HIGH
UncertainProduction
High past Capex
funded by debt
CAIRN Tax Obligation
Increasing Short Term Obligation-falling CR
IMPACT ASSESSMENT - KEY RATING DRIVERS

0.00
0.05
0.10
0.15
0.20
0.25
Q1 2017-18 Q2 2017-18 Q3 2017-18
x ti
mes
Debt Service Coverage Ratio
0
500
1000
1500
2000
2500
Q1 2017-18 Q2 2017-18 Q3 2017-18
INR
in C
rore
s
EBITDA
0
2000
4000
6000
8000
10000
12000
14000
Q1 2017-18 Q2 2017-18 Q3 2017-18
INR
in C
rore
s
Revenue from Operations
Source –Unaudited Quarterly Reports
PERFORMANCE OF VEDANTA LTD. OVER FY 17-18 (3 QTRS)

Company Snapshot
Business Description
Corporate Governance
Industry Overview & Competitive Analysis
Financial Analysis
Capital Structure
Liquidity Analysis
Investment Summary
Investment Recommendation
AGENDA

Credit Rating Corresponding Score
AAA 10
AA+ 9
AA8
(Existing Rating)
AA- 7
A+ 6
A 6
A- 5
BBB+ 4
BBB 3
BBB- 2
BB+ 1
BB 1
BB- 1
•
•
Final Recommendation
Overweight = Buy Neutral = Hold Underweight = Sell
RATING AND RECOMMENDATION

THANK YOU