vecima networks inc
TRANSCRIPT

Management’s Discussion and Analysis
and
Audited Annual Consolidated Financial Statements of
VECIMA NETWORKS INC. For the years ended June 30, 2021 and 2020

Vecima Networks Inc. 2021 Letter to the Shareholders Page 1
Dear Fellow Shareholders, Fiscal 2021 was the breakout year we have long envisioned for Vecima. Following multiple years of investment, innovation, and persistence, our next-generation products are capturing the first wave of our industry’s widescale migration to distributed access architecture, or DAA, and Vecima has emerged as a global industry leader in the rapidly growing DAA market. We now boast the industry’s single strongest portfolio of high-speed data access network products for cable and fiber, which we are deploying with a large and rapidly growing global base of Tier 1, 2, and 3 customers. And while we are still in the early days of what we expect will be an extraordinary growth trajectory for DAA, our financial results are clearly beginning to reflect our momentum. A Record Year for Vecima I am very proud to report that we achieved the single highest sales results in Vecima’s 33-year history in fiscal 2021, with annual sales climbing 31% year-over-year to $124.2 million. This record topline growth was led by our Entra portfolio, which is supporting a number of the world’s largest cable operators that are using Vecima’s DAA to build their networks of the future. It also reflects the resounding success of our landmark acquisition of the Nokia Distributed Access Architecture (DAA) and Fiber-to-the-Home (FTTH) portfolio, a transaction we completed early in this pivotal fiscal year. The acquisition dramatically accelerated a key component of our strategy to lead the cable industry’s evolution to DAA just as the market was beginning its strong trajectory of wide adoption. Specifically, it built on our earlier successful efforts in Remote-PHY technology and saved years of planned further investment by immediately expanding our Entra portfolio with market-ready 10G fiber-to-the-home access capabilities and Remote MACPHY cable access solutions, the last two highly important, additional pieces of the cable DAA ecosystem. With our portfolio significantly expanded and Vecima able to address the widest possible range of our customers’ DAA needs, our sales accelerated quarter-over-quarter throughout the year, culminating in full-year Entra revenue of $42.6 million, seven times higher than what we achieved in fiscal 2020. Buoyed by this momentum, our Video and Broadband Solutions segment went on to outperform in fiscal 2021, with segment sales growing by 110% to $75.3 million. Approximately 57% of these sales came from our next-generation DAA products, a remarkable achievement given that DAA represented less than 15% of VBS segment sales a year ago. The balance of our VBS revenue was supported by continued solid performance from our commercial video product families, Terrace and TerraceQAM, which together contributed $31.4 million of revenue in fiscal 2021.

Vecima Networks Inc. 2021 Letter to the Shareholders Page 2
Succeeding Under Challenging Conditions I want to note that we achieved our record fiscal 2021 results amidst the global COVID-19 pandemic. On a positive note, the pandemic demonstrated the importance and necessity of a digitally connected world and our own critical role in helping our cable access and IPTV network customers meet the insatiable and ever-growing demand for data. It also highlighted the resilience of our employees, who adapted quickly to remote work and maintained their professionalism and dedication to advancing our objectives every step of the way. As our results and achievements attest, Vecima’s execution was very strong this year, irrespective of the pandemic. But the pandemic brought operating challenges as well. Global supply chain constraints for certain components delayed lead times and weighed on our gross profit margins. And in our Content Delivery and Storage segment, Covid-19 restrictions at some of our customers’ operations slowed the integration and expansion of the record new business wins of the prior year, constraining this segment’s growth potential in fiscal 2021. Despite these impacts, our Content Delivery and Storage segment achieved solid annual revenues of $43.4 million. It also fulfilled the largest-ever contract for MediaScaleX solutions with a Tier 1 customer in the Asia Pacific region and went on to win an additional five new customers during the year. Ultimately, the pandemic has highlighted several of Vecima’s core strengths, including our essential position in a market with an ever-increasing appetite for faster speeds and more content. This was supported by our ability to adapt rapidly to a changing macro environment and our rock-solid foundation, including a very strong financial position and excellent customer and supplier relationships, which enabled us to strategically manage through a difficult supply situation. I am pleased to report that we ended the year with $28.9 million in cash, working capital of $44.8 million, and virtually no debt, even after investing in organic and acquisitions-based growth and continuing to reward investors with dividends of $0.22 per share in fiscal 2021. We will continue to leverage this financial strength to increase inventories and manage supply chain challenges as we respond to the significant growth in demand we are anticipating in fiscal 2022. An Inflection Point in Our 33-year History As we look forward, we recognize that Vecima is now at an inflection point. We have captured a clear leadership position in a market estimated in the billions of dollars, and we are positioned to maintain and build on our lead. We have the world’s most complete DAA portfolio, based on

Vecima Networks Inc. 2021 Letter to the Shareholders Page 3
technologies pioneered by us and backed by our 33-year track record as a trusted and proven supplier to some of the world’s largest MSOs. We are currently engaged with 71 customers for our DAA products worldwide, including 38 customers that have already placed orders. Many of these customers are now transitioning to scale deployments as they build out their DAA networks, which in turn will fuel strong demand for our Entra products in fiscal 2022 and beyond. Our remaining 33 customer engagements represent additional near-term opportunities for design wins and follow-on deployments, adding to the projected demand. At the same time, we are steadily adding new customer engagements as additional MSOs initiate their own DAA transitions and turn to Vecima as a potential technology partner. This is a true technology wave that will only gain momentum. And those that capture the first wave are exceptionally well positioned to benefit from not just the initial network build-outs but the years of augmentation and upgrades that follow. Vecima has successfully captured the first wave and is emerging as a leading, global Tier 1 broadband network solutions provider in the DAA space. Keep in mind that this is just one of our growth engines. Our Content Delivery and Storage segment represents significant additional opportunities for Vecima as we address the rapidly growing managed IPTV and “over the top” (OTT) markets for streaming services like video on demand and cloud DVR. The global IPTV market is on pace to nearly double in size by 2026 and will depend on reliable and scalable solutions like those provided by our MediaScaleX portfolio. Overall, we anticipate the year ahead will be an exciting one for Vecima as the DAA market takes off and IPTV demand continues to build. While we anticipate that ongoing global supply chain challenges could temper our growth and margin potential, particularly in the near term, we are extremely confident in our market position and in Vecima’s ability to capture the major opportunities ahead of us. For many years now, we have remained steadfast in our vision for the networks of tomorrow while bringing them to life today. Through a combination of invention, development, and curation via successful consolidation, we have assembled the best technology in the industry. This has put us in an extremely advantageous position, and I can think of no other time in Vecima’s 33-year history that the opportunity has been so great or so immediately upon us. The industry has taken notice and is

Vecima Networks Inc. 2021 Letter to the Shareholders Page 4
embracing our DAA and IPTV leadership. In the weeks, months, and years to come, I look forward to demonstrating how this will translate into results. In closing, I want to sincerely thank all of our Vecima employees for their work in bringing in another remarkable year and for continuing to outperform during these challenging times. As always, I am honoured by their dedication and commitment to our success. On behalf of the Board of Directors, I also want to thank you, our shareholders, for your continued support. We are highly energized about what lies ahead for Vecima and looking forward to exciting new achievements in fiscal 2022. I am truly honoured to be your representative as Vecima embarks on this exciting trajectory of growth. Sincerely,
Sumit Kumar President and CEO

Vecima Networks Inc.
MANAGEMENT'S DISCUSSION AND ANALYSIS
September 21, 2021
Vecima Networks Inc. 2021 Annual Report Page 5
This Management’s Discussion and Analysis (MD&A) provides a review of significant developments that have affected the performance of Vecima Networks Inc. (“Vecima” or the “Company”) during the year ended June 30, 2021.
Our MD&A supplements, but does not form part of, our audited consolidated financial statements and related notes for the years ended June 30, 2021 and 2020. Consequently, the following discussion and analysis of the financial condition and results of operations should be read in conjunction with the audited consolidated financial statements and accompanying notes for the years ended June 30, 2021 and 2020 which have been prepared in accordance with International Financial Reporting Standards (IFRS) as issued by the International Accounting Standards Board. Our MD&A also includes certain non-IFRS financial measures which we use as supplemental indicators of our operating performance and financial position, as well as for internal planning purposes.
The content of this MD&A contains forward-looking statements, which are subject to risks and uncertainties that could cause our actual results to differ materially from the forward-looking statements. Forward-looking statements include, but are not limited to, our expectations related to general economic conditions and market trends and their anticipated effects on our business segments, our expectations related to customer demand and the impacts of the novel coronavirus pandemic (“COVID-19”). For additional information related to forward-looking statements and material risks associated with them, please see the “Additional Information - Forward-Looking Information” section of this MD&A.
Additional information regarding Vecima, including our Annual Information Form, can be found on SEDAR at www.sedar.com.
Table of Contents 1. Company Overview ..................................................................................................................... 5 2. Industry Developments............................................................................................................... 7 3. Fiscal 2021 Full-Year and Q4 Highlights.................................................................................... 8 4. Outlook ........................................................................................................................................ 9 5. COVID-19 Business Update ...................................................................................................... 10 6. Discontinued Operations .......................................................................................................... 10 7. Consolidated Results of Operations ........................................................................................ 11 8. Summary of Quarterly Results of Operations ......................................................................... 14 9. Segmented Information ............................................................................................................ 15 10. Liquidity and Capital Resources .............................................................................................. 21 11. Off-Balance Sheet Arrangements ............................................................................................ 23 12. Transactions Between Related Parties .................................................................................... 23 13. Proposed Transactions ............................................................................................................ 23 14. Critical Accounting Estimates .................................................................................................. 23 15. Accounting Pronouncements and Standards ......................................................................... 26 16. Disclosure Controls and Procedures ...................................................................................... 27 17. Internal Control over Financial Reporting ............................................................................... 27 18. Business Combination ............................................................................................................. 28 19. Legal Proceedings .................................................................................................................... 28 20. Risks and Uncertainties and COVID-19 ................................................................................... 28 21. Outstanding Share Data ........................................................................................................... 29 22. Additional Information .............................................................................................................. 30
1. Company Overview
Vecima Networks Inc. (TSX: VCM) is a Canadian company founded in 1988 in Saskatoon, Saskatchewan. Today, Vecima has a global presence with offices in Vancouver, Atlanta, Raleigh, San Jose, Qingdao, Shanghai, Tokyo, Amsterdam, and a manufacturing facility in Saskatoon. Vecima's corporate head office is located in Victoria, British Columbia.

Vecima Networks Inc. 2021 Annual Report Page 6
Vecima is a global leader focused on developing integrated hardware and scalable software solutions for broadband access, content delivery, and telematics. We enable the world's leading innovators to advance, connect, entertain, and analyze. We build technologies that provide internet video delivery and storage (IPTV) and next-generation high-speed broadband network access.
Vecima's business is organized into three segments:
1) Video and Broadband Solutions (VBS) includes platforms that process data from the cable network and deliver high-speed internet connectivity to homes over cable and fiber as well as adapt video services to formats suitable to be consumed on televisions in commercial properties.
a. Our next-generation Entra™ family of products and platforms addresses the network migration to a Distributed Access Architecture (as described below under Industry Developments). The Entra Distributed Access Architecture platform is Vecima's realization of the next generation of hybrid fiber coaxial (HFC) and fiber to the home (FTTH) nodes as optical transport moves away from analog distribution to fully digital distribution. Our goal is to provide the market’s most flexible and complete portfolio of broadband access infrastructure products driving the future of ultra-high speed networks to multi-gigabit per second symmetrical access.
The Entra Distributed Access Architecture (DAA) family of products is divided into five core categories:
• EntraPHY - Multiple variants of the Entra Access Node that can operate as Remote PHY, providing a modular highly interoperable platform for deployment of access technologies, leveraging billions of dollars of investment in coaxial cable;
• EntraMAC - Multiple variants of the Entra Access Node that can operate as Remote MAC-PHY, providing the full next-generation access network within the Entra digital node, leveraging billions of dollars of investment in coaxial cable;
• EntraOptical - Consists of both chassis and node based FTTH access technologies in areas of the service provider network where FTTH is practical and advantageous;
• EntraControl – a virtual cloud-based platform with centralized orchestration and control across all Entra products:
• The Entra Remote PHY Monitor (RPM), which offers unified control software for management, service assurance and monitoring of access nodes;
• The Entra Video QAM Manager (VQM), which allows for the integration of video in a DAA environment, leveraging existing video generation infrastructure by providing a direct pathway for video through to the Entra node; and
• The Entra Access Controller (EAC) virtualizes all of the control components allowing for the distribution of the data processing to the edge and into the Entra MAC and Entra Optical nodes; and
• EntraVideo – a suite of products facilitating the migration from legacy architectures to next-generation distributed access architectures:
• The Entra Legacy QAM Adapter (LQA) and DV-12, which provide a simple solution to adapt existing video QAM infrastructure for distributed access; and
• The Entra Interactive Video Controller (IVC), which supports essential two-way network connectivity for legacy set-top boxes that are heavily deployed and in service today.
b. Our Terrace and TerraceQAM product families meet the unique needs of the business services vertical, including MDU (multi-dwelling units) and hospitality (including hotels, motels and resorts) by adapting video services to the individual business requirements and leveraging existing televisions in rooms.
2) Content Delivery and Storage (CDS) includes solutions and software, under the MediaScaleX™ brand, for service providers and content owners that focus on ingesting, producing, storing, delivering and streaming video for live linear, Video on Demand (VOD), network Digital Video Recorder (nDVR) and time-shifted services over the internet.
MediaScaleX™
• Transcode: transforms live and OnDemand content utilizing state-of-the-art GPU technology, creating beautiful, cost-effective content for any device;
• Origin: packages and secures video for streaming over-the-top (OTT) or through a service provider managed network, regardless of network technology;
• Storage: captures live, OnDemand, and DVR content, holds it indefinitely, and allows for future streaming, rewind, fast-forward and pause; and

Vecima Networks Inc. 2021 Annual Report Page 7
• Cache: highly scalable, streaming platform, providing the ability to serve content to all IP and legacy devices, including Streaming Video Alliance Open Cache technology to allow operators to cache and monetize OTT content. Strategically geographically located to minimize network latency and optimize the end user streaming experience.
3) Telematics provides fleet managers with the key information and analytics they require to optimally manage their mobile and fixed assets under the Contigo and Nero Global Tracking brands. Vecima’s Telematics solutions allow fleets and high value assets to be tracked, managed, reported on and optimized over a subscription-based cloud portal serving commercial and municipal government customers.
2. Industry Developments
Video and Broadband Solutions
Over the last several years, the cable industry has been transitioning towards Distributed Access Architectures (DAA) under the latest data over cable system interface specification (DOCSIS) standards. Multiple top-tier and mid-tier players have initiated a roll-out of this new platform with further large-scale deployments anticipated over the next several years. DAA is a critical evolution for the industry in that it unlocks gigabit broadband speeds over existing coaxial cable by allowing data transmission up to 10 Gigabits per second (Gbps) for download speed and 3 Gbps for upload speed today and growing to 10 Gbps upload in the future. The speed provided by DAA using coaxial cable is comparable to that of fiber optic connections, thereby allowing cable operators to leverage their systems without the significant added infrastructure costs of building fiber to the home. Global cable operators expect to benefit from a flexible migration given that DOCSIS 3.1 modems can coexist with older versions and build on top of their previously deployed capacity. The higher efficiency of DAA technology also enables significant cost-per-bit reductions relative to legacy DOCSIS network solutions.
Starting in calendar 2020, the cable market began a broad shift towards DAA, as more operators recognized its suitability for market needs in terms of speed, agility, user experience and cost savings. The impacts of the COVID-19 pandemic have further increased demands on network bandwidth, accelerating the push towards distributed access solutions.
In 2020, Cable Television Laboratories or CableLabs, a not-for-profit innovation and research and development lab that works in cooperation with cable companies and cable equipment manufacturers, released the DOCSIS 4.0 specifications which includes full duplex DOCSIS (FDX) and extended spectrum DOCSIS (ESD), allowing multi-system operators (MSO) to significantly increase their total capacity while leveraging their past coaxial infrastructure investment.
Increasingly, service providers are strategically extending their networks with an all-fiber architecture using cable specific fiber to the home (10G EPON) technology. Further, government funding is being made available to subsidize widescale fiber network buildouts with an emphasis on rural areas that are currently underserved. Operators have favoured architectures and products that allow them to cohesively orchestrate both coaxial and fiber access networks over a common cloud management platform.
Content Delivery and Storage
Global demand for Internet Protocol (IP) video content delivery and storage is growing, driven by the rapidly increasing consumption of IP video as consumers turn to streaming services, and cable operators make vast arrays of new IP video content available to subscribers. Service providers are also pursuing new DVR opportunities that shift delivery and storage away from traditional set-top storage to cloud-based models.
According to the latest industry analysis in the Cisco Visual Networking Index™, consumer Video on Demand traffic is expected to double by 2022 with IP video comprising 82% of all IP traffic. Content owners and broadcasters are also leveraging IPTV technologies to deliver services directly to subscribers using over the top (OTT) business models. Open cache technology, such as that being standardized by the streaming video alliance is aimed at consolidating IPTV traffic utilizing strategically placed cache capacity that reduces cost and network latency.
Telematics
Traditional vehicle telematics is widely available for commercial fleets, but operations managers increasingly demand additional value to improve productivity of personnel and investment in the entire asset base. This has created additional opportunities to leverage asset tracking technology used in the Internet of Things to cost-effectively monitor mobile or fixed assets in the field, particularly in service based industries where asset utilization can drive a stronger profit margin. Managers in these asset-intensive industries can use key information and analytics to optimally manage their mobile and fixed assets using subscription-based cloud portals.
Vecima Networks Inc. 2021 Annual Report Page 8
Our Strategy
Our growth strategy focuses on the development of our core technologies, including next-generation platforms such as our Entra DAA platform, as well as our IP video storage and distribution technologies being sold and deployed under the MediaScaleX brand within the Content Delivery and Storage segment. We will continue to pursue profitable growth both organically and when appropriate, through value-enhancing strategic acquisitions.
3. Fiscal 2021 Full-Year and Q4 Highlights
Financial and Corporate Highlights
• Achieved the best annual and quarterly revenue results in Vecima’s history, with fiscal 2021 consolidated sales climbing 31% year-over-year to $124.2 million; and, fourth quarter consolidated sales increasing 37% to $35.3 million
• Generated full-year gross profit of $56.6 million and Q4 gross profit of $15.0 million, up 10% and 20%, respectively, from same periods in fiscal 2020
• Full-year gross profit margin of 46% and Q4 gross profit margin of 42% were below our targeted range of 49% to 53%, primarily reflecting pandemic-related delays in rollout schedules in the CDS segment, the impact of global supply chain constraints, and the negative foreign exchange impact of a stronger Canadian dollar
• Generated full-year adjusted EBITDA of $12.3 million, compared to $18.3 million in fiscal 2020. Grew fourth quarter adjusted EBITDA by 48% to $5.7 million, from $3.8 million last year
• Recorded adjusted full-year EPS of $(0.10) per share, from $0.06 per share in fiscal 2020. Increased fourth quarter adjusted EPS to $0.06 per share, from $(0.06) per share in Q4 fiscal 2020
• Ended the fiscal year in strong financial position with $28.9 million in cash and working capital of $44.8 million at June 30, 2021, compared to $34.5 million and $55.3 million, respectively, at December 31, 2020
• Declared annual dividends of $0.22 per share, including a fourth quarter dividend of $0.055 per share payable on November 1, 2021 to shareholders of record on October 8, 2021. This represents a cumulative $34.9 million returned to shareholders through regular dividends since we initiated our dividends in October 2014
Video and Broadband Solutions (VBS)
• Generated strong segment sales with annual VBS revenue increasing 110% to $75.3 million and Q4 VBS sales growing 124% to $23.5 million year-over-year
Entra Family
• Deployments of next-generation Entra products accelerated to $42.6 million in fiscal 2021 and $16.6 million in the fourth quarter, a sevenfold increase for both, from the same periods in fiscal 2020
• Successfully acquired, integrated and operated the Nokia cable access portfolio, expanding Vecima’s next-generation product offering with market-leading DAA and 10Gig FTTH solutions. The new portfolio significantly exceeded expectations, contributing strong sales of $19.7 million in fiscal 2021 and $9.2 million in the fourth quarter
• Increased total customer engagements for Entra to 71 MSOs worldwide, compared to 25 at the beginning of the year. Thirty-eight of these customers, including multiple Tier 1 operators, have ordered Entra products (versus three at the beginning of fiscal 2021), setting the stage for multi-year product, support and capacity increases with these customers
• Carried out multiple Tier 1 customer deployments for Entra Remote PHY nodes, Remote MAC-PHY nodes, and 10G EPON FTTH solutions, including the delivery of over 4,900 cable and fiber access nodes combined, covering over 8,900 next-generation service groups and passing 12.5 million homes
• Delivered multiple new DAA product and software releases during the year, including the industry’s first fully segmentable, double-density Remote PHY node
• Significantly enhanced Vecima’s industry-leading DAA cable access nodes (EntraPHY and EntraMAC) with numerous leading features including:
• even higher download and upload capacity, over the multigigabit speeds already offered, driving significant cost savings by leveraging pre-existing and widely deployed coaxial cable access networks;
• localized regional variants matching unique customer needs in multiple geographies;
• increased interoperability with network ecosystem technologies (an area that Vecima has always lead); and
• redundancy additions that further augment the mission-critical durability of our Entra DAA nodes which are being leveraged globally by customers for core broadband internet service

Vecima Networks Inc. 2021 Annual Report Page 9
• Multiple in-demand features were added to Vecima’s EntraControl platforms that provide key cloud-native network configuration and management orchestration, including mass-scalability enhancements and statistics that help operators manage large access networks on a “millions of homes” scale
• Widened lead of EntraOptical fiber to the home DAA platforms with added regional product variants, industry-leading in-home FTTH modem ecosystem support and interoperability, and numerous other customer-specific features
Commercial Video Family
• Increased full-year TerraceQAM sales by 34% to $17.1 million and Q4 sales by 21% to $4.4 million, as the lead Tier 1 MSO continued to widen its extensive hospitality services platform built on the TerraceQAM
• Terrace family sales provided $14.3 million of contribution in fiscal 2021 as Tier 1 customers neared full coverage, leading to the anticipated migration to the next-generation TerraceIQ platform
• Delivered initial orders of next-generation TerraceIQ to a North American Tier 1 customer, a deployment win tied to the unique IPTV input, transcoding and digital rights management capabilities of TerraceIQ, driving the future of commercial video services
Content Delivery and Storage (CDS)
• Achieved annual CDS segment sales of $43.4 million and Q4 sales of $10.4 million, despite COVID-19 related delays in project rollouts and the negative impact of global supply chain constraints
• Grew full-year CDS segment services revenue by 4% year-over-year
• Added five new customers for Vecima’s MediaScaleX IPTV solutions in fiscal 2021
• Divested ContentAgent workflow management business during the year, resulting in a pre-tax gain of approximately US$1.6 million
Telematics
• Continued deployments with municipal government customers, with expansions adding 630 new subscribers in fiscal 2021
• Released new software to enable optional vehicle routing for customers, expanding recurring monthly revenue from existing and new customers
• Continued to penetrate the moveable assets market, including entry into the emergency management systems segment where assets, such as defibrillators and stretchers, are monitored. Added 15 new customers and 439 additional vehicle subscriptions in fiscal 2021, with the total number of moveable assets being monitored growing to over 11,000 units.
4. Outlook
Around the globe, high levels of utilization across our customers' cable and IPTV networks are requiring that operators continue to expand capacity across their networks. Vecima is responding to this demand with an industry-leading portfolio of Distributed Access Architecture (DAA), commercial video and IPTV solutions that enable our customers to expand their capacity and network offerings.
In our Video and Broadband Solutions (VBS) segment, we anticipate strong organic revenue growth in fiscal 2022, led by our next-generation Entra DAA products. With the industry’s strongest and most relevant portfolio of DAA Remote PHY, Remote MAC-PHY, access controller and 10G EPON solutions, and expanding relationships with over 70 cable operators worldwide, including some of the world’s largest Tier 1 MSOs, we anticipate a continued sharp growth trajectory for Entra products in fiscal 2022. We expect Entra sales will dominate Vecima’s product mix in the year ahead, but emphasize that we are still in the early stages of DAA adoption. We see an extraordinary and lengthy growth runway for Entra and are focused on leveraging our industry-leading product portfolio, strong customer relationships and growing global reach to continue capturing market share in this large and rapidly growing market.
In addition to Entra growth, we expect fiscal 2022 to bring continued demand for our TerraceQAM solution and emerging opportunities for our next-generation Terrace IQ solution.
In our Content Delivery and Storage segment, demand for our IPTV and open caching solutions remains robust. We anticipate steady improvement in our ability to integrate new business wins in fiscal 2022, including the five new customers added for our MediaScaleX solutions in fiscal 2021.
In the Telematics segment, we anticipate incremental growth in demand from the fleet tracking market in fiscal 2022, along with continued gradual growth in demand for our asset tracking services.
We expect gross margins will strengthen as our product mix shifts to include a larger proportion of higher-margin product and license sales in future quarters.

Vecima Networks Inc. 2021 Annual Report Page 10
We note that global supply chain challenges have the potential to constrain our revenue growth and put continued pressure on gross margins if they persist through the year. We are focused on managing these industry challenges strategically, leveraging our strong financial position and excellent supplier relationships to support our inventory needs.
5. COVID-19 Business Update
Amidst the ongoing COVID-19 pandemic, we remain sharply focused on protecting the health of our employees, partners and customers while maintaining the continuity of our business operations. Utilization across our customers’ cable and IPTV networks has remained at elevated levels since the start of the pandemic, and as a manufacturer of communications solutions that expand our customers’ networks, our operations are deemed essential and demand for our products and services has grown.
Employee Health and Safety: Our highest priority continues to be the well-being of our employees, more than 80% of whom are able to perform their job functions outside of a Vecima facility and are working remotely. A small number of Vecima employees, primarily those in our Saskatoon manufacturing facility, have roles whose physical presence is required to perform their job function. These employees continue to report to work but are subject to strict protocols intended to reduce the risk of transmission, including social distancing, increased cleaning and availability of personal protective equipment as necessary.
Supply Chain Challenges: Ongoing global supply chain tightness from key component suppliers has been a key challenge emerging from the pandemic and it has the potential to constrain our ability to fully deliver and meet demand for our products, while also negatively impacting our gross margins. As discussed in “Outlook” above, we are carefully managing these challenges, leveraging our strong financial position and excellent supplier relationships to support our component inventory needs.
Uncertainties: The COVID-19 pandemic continues to rapidly evolve, and it is difficult to predict what economic, supply chain, network development or other impacts it may have on our business going forward. We will continue to closely monitor the effects of the pandemic on our business in all regions that we serve, and make adjustments to our business as necessary. Please see "Risks and Uncertainties and COVID-19" and "Forward Looking Information" for more information on COVID-19 as it pertains to our business.
6. Discontinued Operations
On March 31, 2021, we completed the sale of our ContentAgent operations in an all-cash transaction for proceeds of US$2.1 million. As a result, we reclassified amounts related to the announced sale for the previous periods to discontinued operations in our consolidated statements of comprehensive income (loss) and consolidated statements of cash flows to make them consistent with the presentation for the current period.
As at March 31, 2021, we recorded a gain on the sale, net of income taxes, of $1.8 million. The capital gain related to the sale is partially offset by the recognition of previously unrecognized capital loss carry forwards.

Vecima Networks Inc. 2021 Annual Report Page 11
7. Consolidated Results of Operations
Amounts are presented in thousands of Canadian dollars except percentages, employees, dividends and per share amounts. This information should be read in conjunction with our financial statements for the relevant periods, including the related notes, and the balance of this MD&A.
Consolidated Statements of Comprehensive (Loss) Income Data Years ended June 30,
2021 2020 2019
Sales $ 124,177 100 % $ 94,882 100 % $ 84,894 100 %
Cost of sales 67,535 54 % 43,605 46 % 40,107 47 %
Gross profit 56,642 46 % 51,277 54 % 44,787 53 %
Operating expenses
Research and development(1) 26,247 21 % 21,595 23 % 18,909 22 %
Sales and marketing 13,720 11 % 13,304 14 % 14,065 17 %
General and administrative 17,937 14 % 15,869 17 % 16,565 20 %
Restructuring costs - - % - - % 2,176 3 %
Share-based compensation 1,420 1% 59 - % 112 - %
Other income (1,512) - % (479) (1)% (418) - %
57,812 47 % 50,348 53 % 51,409 61 %
Operating (loss) income (1,170) (1)% 929 1 % (6,622) (8)%
Finance income 69 - % 636 1 % 879 1 %
Foreign exchange (loss) gain (2,973) (2)% 1,328 1 % (61) - %
(Loss) income before taxes (4,074) (3)% 2,893 3 % (5,803) (7)%
Income tax (recovery) expense (1,889) (1)% 391 - % (2,402) (3)%
Net (loss) income from continuing operations (2,185) (2)% 2,502 3 % (3,401) (4)%
Net income (loss) from discontinued operations 1,854 2 % (696) (1)% (59) - %
Net (loss) income (331) - % 1,806 2 % (3,460) (4)%
Other comprehensive (loss) income (3,196) (3)% 1,088 1 % (66) - %
Comprehensive income (loss) $ (3,527) (3)% $ 2,894 3 % $ (3,526) (4)%
Net income (loss) per share(2)
Basic – total $ (0.02) $ 0.08 $ (0.15)
Basic – continuing operations $ (0.10) $ 0.11 $ (0.15)
Diluted – total $ (0.02) $ 0.08 $ (0.15)
Diluted – continuing operations $ (0.10) $ 0.11 $ (0.15)
Other Data
Total research and development expenditures(3) $ 35,023 $ 24,993 $ 29,270
Adjusted EBITDA(4) $ 12,323 $ 18,273 $ 8,177
Adjusted (loss) earnings per share(5) $ (0.10) $ 0.06 $ (0.09)
Number of employees(6) 481 377 364
(1) Net of investment tax credits and capitalized development costs.
(2) Based on weighted average number of common shares outstanding.
(3) Amounts are from continuing operations. See "Total Research and Development Expenditures".
(4) Adjusted EBITDA does not have any standardized meaning prescribed by IFRS and may not be comparable to similar measures presented
by other issuers. See "EBITDA and Adjusted EBITDA".
(5) Adjusted Earnings per Share does not have any standardized meaning prescribed by IFRS and may not be comparable to similar measures
presented by other issuers. See "Adjusted Earnings per Share".
(6) The number of employees is determined as of the end of the period.

Vecima Networks Inc. 2021 Annual Report Page 12
Consolidated Statements of Financial Position June 30, June 30, June 30,
(unaudited – in thousands of dollars except common share data) 2021 2020 2019
Cash and cash equivalents $ 28,909 $ 17,350 $ 19,834
Short-term investments $ - $ 17,165 $ 24,569
Working capital $ 44,792 $ 55,280 $ 58,286
Total assets $ 214,732 $ 210,298 $ 200,770
Long-term debt(1) $ 4,107 $ 4,613 $ 1,729
Shareholders’ equity $ 174,920 $ 179,762 $ 180,768
Number of common shares outstanding(2) 22,748,826 22,411,612 22,362,031
(1) Since fiscal 2020 long-term debt now includes lease liabilities per IFRS 16.
(2) Based on weighted average number of common shares outstanding.
Adjusted Net Income and Adjusted Earnings per Share
The following table reconciles net income for the period to adjusted net income as well as earnings per share to adjusted earnings per share. The term “adjusted net income” refers to net income or net loss as reported in the IFRS financial statements, excluding any amounts included in net income or net loss for gains and losses on the sale of non-core property, plant and equipment ("PP&E"), intangible assets, and assets held for sale, impairments of intangible assets, restructuring costs, and the tax effect of these adjusted items. We believe that adjusted net income and adjusted earnings per share provides supplemental information for management and our investors because they provide for the analysis of our results exclusive of certain items which do not directly correlate to our business of selling broadband access products, content delivery and storage products and services or supplying telematic services. Adjusted net income and adjusted earnings per share do not have a standardized meaning prescribed by IFRS and may not be comparable to similar measures presented by other issuers.
Calculation of Adjusted Earnings per Share Years ended June 30,
(unaudited – in thousands of dollars except per share amounts) 2021 2020 2019
Net (loss) income $ (331) $ 1,806 $ (3,460)
Gain on sale of non-core PP&E, net of tax (2,007) (397) -
Gain on sale of non-core intangibles, net of tax - - (176)
Restructuring costs, net of tax - - 1,623
Adjusted net (loss) income $ (2,338) $ 1,409 $ (2,013)
Net (loss) income per share $ (0.02) $ 0.08 $ (0.15)
Gain on sale of non-core PP&E, net of tax (0.08) (0.02) -
Gain on sale of non-core intangibles, net of tax - - (0.01)
Restructuring costs, net of tax - - 0.07
Adjusted earnings per share(1)(2) $ (0.10) $ 0.06 $ (0.09)
(1) Adjusted earnings per share includes non-cash share-based compensation of $(0.3) million or $(0.01) per share for the three months
ended June 30, 2021, and $1.4 million or $0.06 per share for the year ended June 30, 2021. The non-cash share-based compensation primarily reflects certain performance-based vesting thresholds achieved under the Company’s Performance Share Unit Plan.
(2) Adjusted earnings per share includes foreign exchange loss of $0.7 million or $0.03 per share for the three months ended June 30, 2021
and $3.0 million or $0.13 per share for the year ended June 30, 2021.

Vecima Networks Inc. 2021 Annual Report Page 13
EBITDA and Adjusted EBITDA
The following table reconciles net income (loss) for the period to EBITDA and Adjusted EBITDA. The term “EBITDA” refers to net income or net loss as reported in the IFRS financial statements, excluding any amounts included in net income or net loss for income taxes, interest expense, and depreciation and amortization for PP&E, right-of-use assets, deferred development and intangible assets. The term “Adjusted EBITDA” refers to EBITDA adjusted for: gains and losses on sale of PP&E, intangible assets, and assets held for sale; impairment of PP&E; impairment of deferred development costs and other intangible assets; restructuring costs; and share-based compensation expense. We believe that Adjusted EBITDA is useful supplemental information for management and for our investors because it provides for the analysis of our results exclusive of certain non-cash items and other items which do not directly correlate to our business of selling broadband access products, content delivery and storage products and services or supplying telematic services. EBITDA and Adjusted EBITDA are not recognized measures under IFRS and, accordingly, investors are cautioned that EBITDA and Adjusted EBITDA should not be construed as alternatives to net income, determined in accordance with IFRS, or as indicators of our financial performance or as measures of our liquidity and cash flows.
Calculation of Adjusted EBITDA Years ended June 30,
2021 2020 2019
Net income (loss) from continuing operations $ (2,185) $ 2,502 $ (3,401)
Income tax (recovery) expense (1,889) 391 (2,402)
Interest expense 225 295 201
Depreciation of PP&E 2,346 2,182 2,336
Depreciation of right-of-use assets 1,523 1,375 0
Amortization of deferred development costs 7,567 8,681 5,531
Amortization of intangible assets 3,319 3,762 3,793
EBITDA from discontinued operations 2,351 (519) (49)
EBITDA 13,257 18,669 6,009
(Gain) loss on sale of property, plant and equipment (302) (455) 82
Gain on sale of intangible assets - - (202)
Restructuring costs - - 2,176
Gain on disposal of discontinued operations (2,052) - -
Share-based compensation 1,420 59 112
Adjusted EBITDA $ 12,323 $ 18,273 $ 8,177
Percentage of sales 10% 19% 10%
Total Research and Development Expenditures
The following table reconciles research and development expenses reported in accordance with IFRS as shown on the consolidated statements of comprehensive income (research and development) to our actual cash research and development expenditures (total research and development expenditure) below:
Calculation of Research and Development Expenditures from Continuing Operations Years ended June 30,
2021 2020 2019
Research and development per statement of income $ 26,247 $ 21,595 $ 18,909
Deferred development costs 16,205 11,972 16,057
Investment tax credits 138 205 67
Amortization of deferred development costs (7,567) (8,681) (5,531)
Government grants - (98) (232)
Total research and development expenditures $ 35,023 $ 24,993 $ 29,270
Percentage of sales 28% 26% 34%

Vecima Networks Inc. 2021 Annual Report Page 14
8. Summary of Quarterly Results of Operations
The following information has been derived from our consolidated financial statements for the years ended June 30, 2021 and 2020 in accordance with IFRS. This information should be read in conjunction with those financial statements and their related notes as well as with the balance of this MD&A.
Fiscal Year 2021 Fiscal 2020
Q4 Q3 Q2 Q1 Q4 Q3 Q2 Q1
Sales $ 35,320 $ 31,861 $ 29,673 $ 27,323 $ 25,714 $ 24,728 $ 24,759 $ 19,681
Cost of Sales 20,348 17,535 14,964 14,688 13,204 11,953 8,950 9,498
Gross profit 14,972 14,326 14,709 12,635 12,510 12,775 15,809 10,183
Operating expenses
Research and development 5,418 7,520 7,044 6,265 6,731 5,578 4,411 4,875
Sales and marketing 3,625 3,644 3,474 2,977 2,976 3,505 3,265 3,558
General and administrative 4,327 4,357 4,560 4,693 3,940 3,983 4,063 3,883
Share-based compensation (296) 267 1,210 239 12 14 16 17
Other (income) expense (1,462) (50) 3 (3) (349) 25 (145) (10)
11,612 15,738 16,291 14,171 13,310 13,105 11,610 12,323
Operating income (loss) 3,360 (1,412) (1,582) (1,536) (800) (330) 4,199 (2,140)
Finance (expense) income (51) (45) 2 163 110 (236) 554 208
Foreign exchange (loss) gain (704) (830) (1,218) (221) (453) 1,953 (461) 289
Income (loss) before income taxes 2,605 (2,287) (2,798) (1,594) (1,143) 1,387 4,292 (1,643)
Income tax expense (recovery) 1,170 (2,692) 432 (799) (275) 555 549 (438)
Net income (loss) from: Continuing operations 1,435 405 (3,230) (795) (868) 832 3,743 (1,205)
Discontinued operations - 1,784 112 (42) (169) (166) (182) (179)
Net income (loss) 1,435 2,189 (3,118) (837) (1,037) 666 3,561 (1,384)
Other comprehensive (loss) income (396) (650) (1,538) (612) (1,125) 2,416 (426) 223
Comprehensive income (loss) 1,039 $ 1,539 $ (4,656) $ (1,449) $ (2,162) $ 3,082 $ 3,135 $ (1,161)
Net income (loss) per share
Basic – continuing operations $ 0.06 $ 0.02 $ (0.14) $ (0.04) $ (0.04) $ 0.04 $ 0.16 $ (0.05)
Basic – total $ 0.06 $ 0.10 $ (0.14) $ (0.04) $ (0.05) $ 0.03 $ 0.16 $ (0.06)
Diluted – continuing operations $ 0.06 $ 0.02 $ (0.14) $ (0.04) $ (0.04) $ 0.04 $ 0.16 $ (0.05)
Diluted - total $ 0.06 $ 0.10 $ (0.14) $ (0.04) $ (0.05) $ 0.03 $ 0.16 $ (0.06)
Adjusted EBITDA as reported $ 5,677 $ 1,963 $ 2,476 $ 2,207 $ 3,827 $ 5,617 $ 7,042 $ 1,785
Quarter-to-Quarter Sales Variances
There are many factors that may contribute to the overall variances of our sales. Traditionally, one of the main factors has been that we continually develop new products to replace products that are reaching the end of their lifecycle. The timing of development can vary based on the size of the projects. The timing of regulatory certification and customer acceptance of new products can also affect the timing of sales.
Within the industry, spending by cable operators is impacted by major new technology adoption such as the industry-wide migration to distributed access architecture. The budgeting cycles of larger cable operators can also result in quarter-to-quarter variability in customer orders as do their installation schedules and any adjustments thereof. We are currently experiencing a transition in demand for some of our legacy Video and Broadband Solutions products as customers complete their digital networks and migrate their focus to distributed access architecture and next-generation commercial video platforms.
Our Content Delivery and Storage segment also influences potential variations of our quarterly sales. Pronounced quarterly sales fluctuations are typical of this business due to the typically large size of customer orders and associated IPTV projects that are subject to customer timing adjustments. Demand for CDS solutions is also prone to seasonal demand fluctuations with the first and third quarters typically carrying slower customer activity.

Vecima Networks Inc. 2021 Annual Report Page 15
9. Segmented Information
Sales
Three months ended June 30, Years ended June 30,
Segment 2021 2020 2021 2020
Video and Broadband Solutions $ 23,458 $ 10,466 $ 75,273 $ 35,859
Content Delivery and Storage 10,419 13,927 43,410 53,666
Telematics 1,443 1,321 5,494 5,357
Total Sales $ 35,320 $ 25,714 $ 124,177 $ 94,882
Three-Month Sales
Total sales grew to $35.3 million in the fourth quarter of fiscal 2021, up 37% from $25.7 million in Q4 fiscal 2020 and 11% higher than the $31.9 million generated in Q3 fiscal 2021. Our strong year-over-year sales growth reflects an increase in Video and Broadband product sales, partially offset by lower sales in our Content Delivery and Storage segment.
The Video and Broadband Solutions segment delivered significant revenue growth in the fourth quarter, with sales climbing to $23.5 million, an increase of 124% from $10.5 million in Q4 fiscal 2020 and 8% higher than the $21.8 million generated in Q3 fiscal 2021. These increases primarily reflect customers beginning their transition to next-generation networks using Vecima’s solutions.
• Fourth quarter sales of next-generation Entra products accelerated to $16.6 million, up $14.6 million, or a sevenfold increase, from $2.1 million in Q4 fiscal 2020 and up $3.9 million, or 31%, from $12.7 million in Q3 fiscal 2021. Increased customer engagements and a shift to scale deployments were the key factors in this growth, with multiple Tier 1 customers deploying our Entra Remote PHY nodes, Remote MAC-PHY nodes and 10G EPON solutions across their networks during the quarter. The Nokia portfolio of cable access solutions acquired by Vecima early in fiscal 2021 contributed $9.2 million of the fourth quarter Entra revenues, up from the $6.0 million in Q3 fiscal 2021.
• TerraceQAM sales climbed to $4.4 million in the fourth quarter, up 21% from $3.6 million in the same period last year, but 16% lower than the $5.2 million generated in Q3 fiscal 2021. The year-over-year growth reflects healthy demand for the TerraceQAM platform as operators continue their commercial rollout for the current generation, while preparing for the next-generation TerraceIQ platform. The quarter-over-quarter variance primarily reflects the timing of large orders.
• Fourth quarter Terrace family sales were $2.4 million, compared to $4.1 million in Q4 fiscal 2020 and $3.5 million in Q3 fiscal 2021, a decrease of 42% and 32%, respectively. The slowdown in Terrace Family sales was anticipated and reflects tapering demand for our legacy TC600 and TC600E products.
Our Content Delivery and Storage segment generated fourth quarter sales of $10.4 million, which was 25% below the exceptionally strong $13.9 million generated in Q4 last year, but 19% higher than the $8.8 million achieved in Q3 fiscal 2021. The year-over-year decrease reflects typical quarterly revenue fluctuations related to order timing and size, as well as COVID-19 restrictions which have slowed on-site systems integration activity at some of our customer sites. Segment sales for the Q4 fiscal 2021 period included $6.0 million of product sales and $4.4 million of services revenue.
Fourth quarter Telematics sales of $1.4 million were slightly higher than the $1.3 million achieved in Q4 fiscal 2020 and on par with the $1.4 million achieved in Q3 fiscal 2021. Results for the quarter were in line with our expectations.
Twelve-Month Sales
For the year ended June 30, 2021 total sales increased 31% to $124.2 million, from $94.9 million in fiscal 2020. The year-over-year sales growth primarily reflects a strong contribution from our Video and Broadband Solutions segment, partially offset by lower sales in the Content Delivery and Storage segment.
Video and Broadband Solutions sales increased 110% to $75.3 million, from $35.9 million in fiscal 2020, as customers began their transition to our next-generation solutions.

Vecima Networks Inc. 2021 Annual Report Page 16
• Full-year Entra deployments accelerated to $42.6 million, up $37.3 million, or a sevenfold increase, from $5.3 million in fiscal 2020. Vecima carried out multiple Tier 1 customer deployments for Entra Remote PHY nodes, Remote MAC-PHY notes and 10G EPON solutions during the year, including delivery of over 4,900 nodes and PON line cards and over 8,900 next-generation service groups with current or future 10G capability. Our fiscal 2021 Entra results included $19.7 million of sales from our new portfolio of direct access solutions, which we acquired from Nokia in the first quarter of the 2021 fiscal year.
• Sales of TerraceQAM increased by $4.3 million, or 34%, to $17.1 million in fiscal 2021, from $12.8 million in fiscal 2020. We experienced healthy demand for our TerraceQAM hospitality platform throughout the year, with operators continuing their commercial rollout for the current generation, while preparing for the next-generation TerraceIQ platform.
• As anticipated, demand for our legacy Terrace family products continued to taper off in fiscal 2021, as customers began the shift to our next-generation solutions. Terrace family sales of $14.3 million were 13% lower than the $16.5 million generated in fiscal 2020, and largely reflect lower purchasing activity for legacy TC600 products.
Fiscal 2021 sales from our Content Delivery and Storage segment decreased 19% to $43.4 million in fiscal 2021, from $53.7 million in fiscal 2020. This change reflects quarterly sales variances in Q3 and Q4 of the current year, compared to record sales activity during the same period in fiscal 2020, as well as COVID-19 related operational delays at some customer premises, which slowed our efforts to consolidate the record new business wins of fiscal 2020. Sales in the current period included $25.6 million of product sales and $17.8 million of services revenue.
Telematics sales were slightly higher at $5.5 million in fiscal 2021, compared to $5.4 million in the same period of fiscal 2020. These results were in line with our expectations.
Cost of Sales
Cost of sales consists primarily of product manufacturing and assembly expenses, with component parts, employee and third-party supplier costs representing a significant portion of these costs. Costs associated with Video and Broadband Solutions sales include related overhead, compensation, final assembly, quality assurance, inventory management costs, and sales commissions, as well as support costs and payments to contract manufacturers that perform printed circuit board assembly functions. Costs associated with Content Delivery and Storage sales include the cost of the computer systems sold, including amortization of software development costs, depreciation, labour, material, overhead and third-party product costs, as well as the salaries, benefits and other costs of the maintenance, service and help desk personnel associated with product installation, support activities and sales commissions. Costs associated with Telematics sales consist of hardware amortization, inventory management costs, order fulfillment, wireless fees, server hosting services, mapping licenses and sales commissions.
Three months ended June 30, Years ended June 30,
Segment 2021 2020 2021 2020
Video and Broadband Solutions $ 14,161 $ 6,375 $ 43,640 $ 18,914
Content Delivery and Storage 5,720 6,433 22,087 23,017
Telematics 467 396 1,808 1,674
Total cost of sales $ 20,348 $ 13,204 $ 67,535 $ 43,605
Three-Month Results
For the three months ended June 30, 2021, total cost of sales was $20.3 million, a 54% increase from $13.2 million in Q4 fiscal 2020 and 16% above the $17.5 million in Q3 fiscal 2021. The year-over-year increase was impacted by the significant increase in sales in the Video and Broadband Solutions segment, the increase in sales in the Telematics segment, partially offset by the lower sales in the Content Delivery and Storage segment. Product mix and supply chain constraints experienced during the period also were factors in the increase in cost of sales.
Fourth quarter cost of sales in the Video and Broadband Solutions segment grew 122% to $14.2 million from $6.4 million in Q4 fiscal 2020 and 14% from $12.4 million from Q3 fiscal 2021. The year-over-year increase was a result of the significant increase in sales as well as product mix and supply chain constraints resulting in increased expedite costs.
In the Content Delivery and Storage segment, fourth quarter cost of sales decreased by 11% to $5.7 million, from $6.4 million in the prior-year quarter. On a sequential quarterly basis, CDS cost of sales were 24% higher than the $4.6 million in Q3 fiscal 2021. The year-over-year change in cost of sales reflects the decrease in sales and product mix.

Vecima Networks Inc. 2021 Annual Report Page 17
Fourth quarter cost of sales from the Telematics segment was $0.5 million, up slightly from the $0.4 million incurred in Q4 fiscal 2020 and similar to the $0.5 million in Q3 fiscal 2021.
Twelve-Month Results
For the year ended June 30, 2021, total cost of sales was $67.5 million, a 55% increase from $43.6 million in fiscal 2020. The year-over-year increase was impacted by the significant increase in sales in the Video and Broadband Solutions segment, the increase in sales in the Telematics segment, partially offset by the significantly lower sales in the Content Delivery and Storage segment. Product mix and supply chain constraints experienced during the current year were also factors in the increase in cost of sales.
Cost of sales in the Video and Broadband Solutions segment grew 131% to $43.6 million in fiscal 2021 from $18.9 million in fiscal 2020. The year-over-year increase was a result of the significant increase in sales as well as product mix and supply chain constraints resulting in increased expedite costs.
In the Content Delivery and Storage segment, cost of sales decreased by 4% to $22.1 million, from $23.0 million. The year-over-year decrease in cost of sales reflects the decrease in sales and product mix. Sales in the prior year had a higher concentration of software sales, which had a lower corresponding cost of sales.
Cost of sales from the Telematics segment in fiscal 2021 was $1.8 million up from the $1.7 million in 2020 reflecting the higher sales year-over-year.
Gross Profit and Gross Margin
Three months ended June 30, Years ended June 30,
Segment 2021 2020 2021 2020
Video and Broadband Solutions $ 9,297 $ 4,091 $ 31,633 $ 16,945
Content Delivery and Storage 4,699 7,494 21,323 30,649
Telematics 976 925 3,686 3,683
Total gross profit $ 14,972 $ 12,510 $ 56,642 $ 51,277
Video and Broadband Solutions 39.6% 39.1% 42.0% 47.3%
Content Delivery and Storage 45.1% 53.8% 49.1% 57.1%
Telematics 67.6% 70.0% 67.1% 68.8%
Total gross margin 42.4% 48.7% 45.6% 54.0%
Three-Month Results
For the three months ended June 30, 2021, total gross profit grew to $15.0 million, a 20% increase from $12.5 million in Q4 fiscal 2020 and 5% above the $14.3 million achieved in Q3 fiscal 2021. Gross margin for the fourth quarter was 42%, compared to 49% in Q4 fiscal 2020 and 45% in Q3 fiscal 2021. We target a gross margin of 49% to 53%. Gross margin was impacted by lower sales in the Content Delivery and Storage segment, continued foreign exchange headwinds related to a strengthening Canadian dollar, and product mix and supply chain constraints experienced during the period.
Fourth quarter gross profit from the Video and Broadband Solutions segment grew 127% to $9.3 million (gross profit margin of 40%), from $4.1 million (gross profit margin of 39%) in Q4 fiscal 2020 and was on par with Q3 2021 gross profit of $9.3 million (gross profit margin of 43%). The year-over-year increase in gross profit reflects significantly higher sales, paired with a slightly higher gross margin.
In the Content Delivery and Storage segment, fourth quarter gross profit decreased by 37% to $4.7 million (gross profit margin of 45%), from $7.5 million (gross profit margin of 54%) in the same period last year. On a sequential quarterly basis, CDS gross profit was 14% higher than the $4.1 million (gross profit margin of 47%) generated in Q3 fiscal 2021. The year-over-year changes in gross profit and gross margin reflect the decrease in sales and a lower percentage of high-margin software sales in the product mix.
Fourth quarter gross profit from the Telematics segment was $1.0 million (gross profit margin of 68%), similar to the $0.9 million (gross margin of 70%) generated in Q4 fiscal 2020 and $0.9 million (gross margin of 66%) in Q3 fiscal 2021. The year-over-year decrease in gross margin is mainly the result of higher product costs in the current quarter.

Vecima Networks Inc. 2021 Annual Report Page 18
Twelve-Month Results
For the year ended June 30, 2021, total gross profit increased by $5.4 million, or 10%, to $56.6 million, from $51.3 million in the same period last year. This improvement reflects higher sales, partially offset by a lower gross margin percentage. Full-year gross margin decreased to 46%, from 54% in fiscal 2020, primarily reflecting different product mixes and lower software and service sales between the two fiscal years.
Gross profit from the Video and Broadband Solutions segment increased by $14.7 million, or 87%, to $31.6 million (gross margin of 42%), from $16.9 million (gross margin of 47%) in fiscal 2020. The higher gross profit dollars reflect increased sales, while the lower gross margin reflects the decrease in software sales year-over-year and increased sales of next-generation node products which are at overall lower margins.
The Content Delivery and Storage segment generated a gross profit of $21.3 million (gross margin of 49%) in fiscal 2021, compared to $30.6 million (gross margin of 57%) last year. The decrease in gross profit and gross margin primarily reflects lower sales and a shift in customer and product mix.
The Telematics segment generated gross profit of $3.7 million (gross margin of 67%) for the year ended June 30, 2021, which was similar to the $3.7 million (gross margin of 69%) achieved in fiscal 2020. Results from the segment were in line with our expectations.
Operating Expenses
Three months ended June 30, Years ended June 30,
Segment 2021 2020 2021 2020
Video and Broadband Solutions $ 6,069 $ 6,630 $ 32,595 $ 23,242
Content Delivery and Storage 4,871 5,998 22,568 24,060
Telematics 672 682 2,649 3,046
Total operating expense $ 11,612 $ 13,310 $ 57,812 $ 50,348
Three-Month Results
For the three months ended June 30, 2021, total operating expenses were lower at $11.6 million, in comparison to the $13.3 million in the same period last year. The decrease primarily reflects lower operating expenses in the Content Delivery and Storage and the Video and Broadband Solutions segments.
Video and Broadband Solutions operating expenses decreased to $6.1 million, from $6.6 million in Q4 fiscal 2020. The $0.5 million decrease primarily reflects the U.S. federal tax credits received in the current quarter and the adjustment to share-based compensation expense for performance share unit amortization adjusted for excess amortization in the prior quarters, partially offset by the addition of operating expenses related to the newly acquired Nokia DOCSIS DAA and EPON/DPoE cable access technology portfolio.
Content Delivery and Storage operating expenses were lower at $4.9 million in Q4 fiscal 2021, compared to $6.0 million in Q4 fiscal 2020 and $5.5 million in Q3 fiscal 2021. The decrease year-over-year reflects lower research and development expense and sales and marketing expense.
Telematics operating expenses of $0.7 million were on par with the $0.7 million recorded in Q4 fiscal 2020. On a sequential quarterly basis, Telematics operating expenses were $0.03 million higher than the $0.64 million recorded in Q3 fiscal 2021, reflecting slightly higher research and development expenses.
Research and development expenses for Q4 fiscal 2021, decreased to $5.4 million, or 15% of sales, from $6.7 million, or 26% of sales in the same period of fiscal 2020. This decrease primarily reflects lower amortization of deferred development costs, partially offset by the addition of product lines acquired from Nokia. Our investment in research and development supports the launch of new products. Until these products are in commercial production, the development costs are deferred to future periods. Total research and development costs before deferrals, amortization of deferred development costs and income tax credits for Q4 fiscal 2021 increased to $8.9 million, or 25% of sales, from $6.6 million, or 26% of sales in Q4 fiscal 2020. The increase reflects higher staffing costs related to the acquisition, as well as increased software licensing costs in the current year quarter as our next-generation product families moved closer toward commercial deployment.
Sales and marketing expenses were $3.6 million, or 10% of sales in Q4 fiscal 2021, compared to $3.0 million, or 12% of sales in the same period last year. The increase in sales and marketing expense primarily reflects higher staffing costs related to the addition of the product portfolio acquired from Nokia.
General and administrative expenses increased to $4.3 million from $3.9 million in Q4 fiscal 2020. The year-over-year increase primarily reflects additional costs associated with the operations acquired from Nokia.

Vecima Networks Inc. 2021 Annual Report Page 19
Stock-based compensation expense was $(0.3) million in Q4 fiscal 2021, compared to $0.01 million in Q4 fiscal 2020. This decrease is a result of the adjustment of amortization of performance-based units expense for previous quarters in the current year.
Other income was $1.5 million in Q4 fiscal 2021, an increase from $0.3 million in Q4 fiscal 2020 due to U.S. federal grant credits received in the current period.
Twelve-Month Results
For the year ended June 30, 2021, total operating expenses increased to $57.8 million, from $50.3 million in fiscal 2020. This increase primarily reflects higher operating expenses in the Video and Broadband Solutions segment, partially offset by lower operating expenses in the Content Delivery and Storage and Telematics segments.
Video and Broadband Solutions operating expenses for the year ended June 30, 2021 increased to $32.6 million, from $23.2 million in fiscal 2020. The $9.5 million increase primarily reflects the addition of operating expenses related to the acquired Nokia DOCSIS DAA and EPON/DPoE cable access technology portfolios and the increase in share-based compensation resulting from the vesting of the first tranche of the performance-based units.
Content Delivery and Storage operating expenses of $22.6 million for the year ended June 30, 2021 were lower than the $24.1 million recorded in fiscal 2020. Reduced expenses for trade shows, travel and entertainment, partially offset by lower deferred development costs, were the main factors in this decrease.
Telematics operating expenses of $2.6 million in fiscal 2021 were lower than the $3.0 million recorded last year. This $0.4 million decrease primarily reflects a reduction in research and development expenses due to increased deferrals year-over-year.
Research and development expenses for the year ended June 30, 2021 increased to $26.2 million, or 21% of sales, from $21.6 million, or 23% of sales in fiscal 2020. This mainly reflects the increased costs of research and development related to our Nokia portfolio acquisition. Our investment in research and development supports the launch of new products. Until these products are in commercial production, the development costs are deferred to future periods. Total research and development costs before deferrals, amortization of deferred development costs and income tax credits for the year ended June 30, 2021 increased to $35.0 million, or 28% of sales, from $25.0 million, or 26% of sales for the fiscal 2020 period. This increase reflects higher staffing costs due to the acquisition, software licensing costs and subcontracting costs as our next-generation product families move closer to commercial deployment.
Sales and marketing expenses increased to $13.7 million, or 11% of sales in fiscal 2021, from $13.3 million, or 14% of sales last year. The slight increase in sales and marketing expense primarily reflects higher staffing costs related to the Nokia portfolio acquisition.
General and administrative expenses increased to $17.9 million in fiscal 2021, from $15.9 million in fiscal 2020. The year-over-year increase primarily reflects the one-time acquisition costs from the Nokia portfolio acquisition and additional costs associated with the acquired operations.
Stock-based compensation expense was $1.4 million in fiscal 2021 compared to $0.06 million for fiscal 2020. This increase is a result of the issuance of performance-based units in the current fiscal year.
Other income increased to $1.5 million for the year ended June 30, 2021, from $0.5 million in fiscal 2020 due a U.S. federal grant received in the current year and as a result of the gain on sale of property, plant and equipment in the current year.
Operating Income (Loss)
Three months ended June 30, Years ended June 30,
Segment 2021 2020 2021 2020
Video and Broadband Solutions $ 3,228 $ (2,539) $ (962) $ (6,297)
Content Delivery and Storage (172) 1,496 (1,245) 6,588
Telematics 304 243 1,037 638
Total operating income (loss) $ 3,360 $ (800) $ (1,170) $ 929
Three-Month Results
Operating income increased to $3.4 million in Q4 fiscal 2021, from an operating loss of $0.8 million in Q4 fiscal 2020. The $4.2 million increase in operating income was mainly driven by the $5.8 million increase in contribution from the Video and Broadband Solutions segment and the $0.1 million increase in contribution from the Telematics segment year-over-year, partially offset by the $1.7 million decrease in contribution from the Content Delivery and Storage segment.

Vecima Networks Inc. 2021 Annual Report Page 20
The Video and Broadband Solutions segment generated fourth quarter operating income of $3.2 million, compared to an operating loss of $2.5 million in Q4 fiscal 2020. This reflects the $5.2 million increase in gross profit and $0.6 decrease in operating expenses.
Content Delivery and Storage generated an operating loss of $0.2 million in the fourth quarter of fiscal 2021, compared to operating income of $1.5 million in the same period of fiscal 2020. The year-over-year decrease primarily reflects the $2.8 million decrease in gross profit, partially offset by the $1.1 million decrease in operating expenses.
Telematics operating income increased to $0.3 million in Q4 fiscal 2021, from $0.2 million in Q4 fiscal 2020. This reflects a $0.1 million increase in gross profit year-over-year.
Finance (expense) income was $0.05 million of expense in Q4 fiscal 2021, compared to $0.11 million of income in the same period last year. This reflects decreased income from short-term investments, partially offset by lower interest paid related to lease liabilities and mortgages.
Foreign exchange loss for the fourth quarter was $0.7 million, compared to $0.5 million in the prior-year period.
Income tax expense (recovery) was a $1.2 million expense in Q4 fiscal 2021, compared to a $0.3 million recovery in Q4 fiscal 2020.
Net income (loss) from continuing operations for Q4 fiscal 2021 increased to $1.4 million of net income or $0.06 per share, from a net loss of $0.9 million or $(0.04) per share in Q4 fiscal 2020.
Net loss from discontinued operations for Q4 2020 was $0.2 million or $(0.01) per share. There were no discontinued operations for the fourth quarter of fiscal 2021.
Other comprehensive loss was $0.4 million in Q4 fiscal 2021, compared to $1.1 million in the same period in fiscal 2020. The year-over-year change reflects foreign exchange differences on the translation of the foreign operations of our Content Delivery and Storage segment to Canadian dollars.
Comprehensive income (loss) for Q4 fiscal 2021 grew to $1.0 million of income, from a $2.2 million loss in Q4 fiscal 2020. The increase year-over-year is a result of the changes described above.
Twelve-Month Results
For the year ended June 30, 2021, we generated an operating loss of $1.2 million, compared to operating income of $0.9 million in fiscal 2020. The year-over-year change mainly reflects a decreased contribution from the Content Delivery and Storage segment, partially offset by improved performance from the Video and Broadband Solutions segment and Telematics segments.
Video and Broadband Solutions reported an operating loss of $1.0 million during the current year, compared to an operating loss of $6.3 million in fiscal 2020. The year-over-year change reflects an increase in gross profit of $14.7 million, partially offset by an increase in operating expenses of $9.4 million.
Content Delivery and Storage reported an operating loss of $1.2 million during the current year, compared to operating income of $6.6 million in fiscal 2020. The segment was impacted by the $9.3 million year-over-year decrease in gross profit, partially offset by a decrease in operating expenses of $1.5 million.
Telematics operating income increased to $1.0 million for the year ended June 30, 2021, from $0.6 million in the prior-year period. The $0.4 million year-over-year improvement reflects a $0.4 million decrease in operating expenses.
Finance income decreased to $0.1 million during fiscal 2021, from $0.6 million in the previous year reflecting a decrease in short-term investment income year-over-year.
Foreign exchange (loss) gain for the year ended June 30, 2021 was a loss of $3.0 million, compared to a gain of $1.3 million in fiscal 2020.
Income tax (recovery) expense was a $1.9 million recovery for the year ended June 30, 2021, compared to a $0.4 million income tax expense in fiscal 2020.
Net (loss) income from continuing operations for the year ended June 30, 2021 was a net loss of $2.2 million or $(0.10) per share, compared to net income of $2.5 million or $0.11 per share in fiscal 2020.
Net income (loss) from discontinued operations for the year ended June 30, 2021 increased to net income of $1.9 million or $0.08 per share, from a net loss of $0.7 million or $(0.03) per share in fiscal 2020.

Vecima Networks Inc. 2021 Annual Report Page 21
Other comprehensive (loss) income was a $3.2 million loss in the year ended June 30, 2021, compared to other comprehensive income of $1.1 million in fiscal 2020. The year-over-year change reflects foreign exchange differences on the translation of the foreign operations of our Content Delivery and Storage segment to Canadian dollars.
Comprehensive (loss) income for the year ended June 30, 2021 decreased to a comprehensive loss of $3.5 million, from comprehensive income of $2.9 million in fiscal 2020.
Operating Activities
For the three months ended June 30, 2021, cash flow from operating activities increased to $12.9 million, from cash provided of $2.5 million for the three months ended June 30, 2020. The $10.4 million increase reflects a $9.2 million increase in cash flow from non-cash working capital, and a $1.2 million increase in operating cash flow.
For the year ended June 30, 2021, cash flow from operating activities of $20.0 million increased significantly from $9.8 million for the year ended June 30, 2020. The $10.2 million increase primarily reflects the $16.0 million increase in cash flow from non-cash working capital and the $5.6 million decrease in operating cash flow.
Investing Activities
For the three months ended June 30, 2021, cash flow used in investing activities increased to $5.4 million from cash used of $3.1 million in the same period last year. This increase reflects the net sale of short-term investments of $nil (Q4 fiscal 2020 – net purchases of $0.2 million), deferred development expenditures of $5.3 million (Q4 fiscal 2020 - $3.4 million), the purchase of property, plant and equipment of $0.4 million (Q4 fiscal 2020 - $0.4 million), and the purchase of intangibles of $nil (Q4 fiscal 2020 - $0.04 million).
For the year ended June 30, 2021, cash flow used in investing activities decreased to $5.0 million from cash used of $6.0 million in fiscal 2020. The cash used in investing activities represents the purchase of the DOCSIS DAA and EPON/DPoE cable access technology portfolios from Nokia Corporation for $5.9 million, proceeds from the sale of ContentAgent operations of $2.6 million, the net sale of short-term investments of $17.2 million (fiscal 2020 – $7.4 million), deferred development expenditures of $16.2 million (fiscal 2020 - $12.3 million), the purchase of property, plant and equipment of $2.2 million (fiscal 2020 - $2.1 million), and the purchase of intangibles of $0.6 million (fiscal 2020 - $0.1 million).
Financing Activities
In the three months ended June 30, 2021, we repaid $0.06 million of our long-term debt (Q4 fiscal 2020 - $0.06 million repaid). We received proceeds from exercised options of $0.1 million (Q4 fiscal 2020 - $0.4 million), paid dividends of $1.3 million (Q4 fiscal 2020 - $1.2 million) and we repaid lease liabilities of $0.4 million (Q4 fiscal 2020 - $0.7 million).
In the year ended June 30, 2021, we repaid $0.3 million of our long-term debt (fiscal 2020 - $0.3 million repaid). We received proceeds from exercised options of $2.3 million (fiscal 2020 - $0.9 million), proceeds from issuing shares of $0.7 million (fiscal 2020 - $nil), proceeds from government grants of $nil (fiscal 2020 - $0.1 million), paid dividends of $5.0 million (fiscal 2020 - $4.9 million), paid withholding taxes on PSUs of $0.8 million (fiscal 2020 - $nil), and we repaid lease liabilities of $1.6 million (fiscal 2020 - $1.7 million).
10. Liquidity and Capital Resources
We manage our liquidity and capital resources to ensure that there is sufficient cash to meet all financial commitments and obligations as they fall due. We believe that our current cash and cash equivalents of $28.9 million, together with anticipated cash flow from operations, will be sufficient to meet our working capital requirements and capital expenditure requirements for the foreseeable future.
As at June 30, 2021, we had access to our full revolving loan facility of $14.0 million ($14.0 million at June 30, 2020), of which $nil was drawn as an operating line of credit (June 30, 2020 - $nil was drawn). We had term credit of $1.5 million as at June 30, 2021 (June 30, 2020 - $1.7 million).
Capital expenditures for Q4 fiscal 2021 were $0.4 million, compared to $0.4 million in Q4 fiscal 2020.

Vecima Networks Inc. 2021 Annual Report Page 22
Working Capital
Working capital represents current assets less current liabilities. Our working capital decreased to $44.8 million at June 30, 2021, from $55.3 million at June 30, 2020. We note that working capital balances can be subject to significant swings from quarter to quarter. Our product shipments are "lumpy", reflecting the requirements of our major customers. It is not unusual to ship $5 to $6 million of product in a one-week period. If this level of sales occurs in the first week of a succeeding quarter, we would expect to experience an increase in inventory levels and a drop in receivables in the prior quarter. Other timing issues, like contracts with greater than 30-day payment terms, also affect working capital, particularly if shipments are backend weighted for a quarter.
Accounts receivable balance increased to $28.8 million at June 30, 2021, from $24.9 million at June 30, 2020. This increase reflects the higher sales in Q4 fiscal 2021 compared to Q4 fiscal 2020, and the timing of sales in Q4 fiscal 2021 compared to Q4 fiscal 2020.
Income tax receivable balance was relatively flat at $0.4 million at June 30, 2021 ($0.3 million as at June 30, 2020). This balance represents income tax receivable in the Content Delivery and Storage segment.
Inventories decreased by $1.6 million to $15.6 million at June 30, 2021, from $17.2 million as at June 30, 2020. The decrease represents the utilization of inventory related to the ramp up of new product inventory in previous quarters. Finished goods inventories were $8.5 million at June 30, 2021, compared to $6.4 million at June 30, 2020. Raw material inventory decreased to $6.4 million at June 30, 2021, from $7.0 million at June 30, 2020. Work-in-progress inventories decreased to $0.7 million as at June 30, 2021, from $3.8 million at June 30, 2020. We manufacture and assemble products, with the result that inventory levels will be substantially higher than other companies in the industry that outsource manufacturing and assembly.
Investment tax credits were $24.3 million at June 30, 2021, down slightly by $0.1 million from $24.4 million at June 30, 2020. For every dollar we spend on eligible research and development in Canada, we generate approximately 15 cents in income tax credits. These credits are used to offset our income tax payable.
Accounts payable and accrued liabilities increased to $22.3 million at June 30, 2021, from $17.1 million at June 30, 2020.
Long-term debt, including the current portion, was reduced to $5.7 million at June 30, 2021, from $6.3 million at June 30, 2020. This decrease represents principal payments made year-to-date.
Dividends
Declaration Date
Dividend Amount (per share) Record Date Payable Date
September 20, 2020 $0.055 October 9, 2020 November 2, 2020
November 10, 2020 $0.055 November 27, 2020 December 21, 2020
February 9, 2021 $0.055 February 26, 2021 March 29, 2021
May 11, 2021 $0.055 May 21, 2021 June 14, 2021
Contractual Obligations
Lease liabilities reported in our consolidated statements of financial position, as at June 30, 2021 were $4.3 million. Our lease liabilities do not include short-term leases and low-value asset leases, as permitted under IFRS 16, and are of nominal value.
As at June 30, 2021, our undiscounted future cash payments in respect of our lease liabilities are as follows: due within one year is $1.5 million; due between two to five years is $2.5 million; and thereafter is $0.6 million.
The Nokia portfolio acquisition includes the assumption of a contract with a third-party supplier. As at June 30, 2021, the contractual obligation, based on forecasted commitments, is estimated to be $5.5 million; of which, $1.0 million is deemed to be onerous.

Vecima Networks Inc. 2021 Annual Report Page 23
Contingencies
In March 2017, we received a re-assessment from the CRA regarding the eligibility of certain Scientific Research and Experimental Development ("SR&ED") claims on our 2015 tax return. The CRA re-assessment would result in a reduction of SR&ED expenditures claimed of $1.3 million. We and our advisors have reviewed the applicable tax law and believe our original treatment of these SR&ED claims was appropriate. We filed a Notice of Objection in regard to this matter in June 2017. We received a Notice of Confirmation in February 2020 that our Notice of Objection was denied. We have recorded the adjustment in our fiscal Q3 and Q4 2020 financial statements. The impact of this adjustment was a $1.3 million increase in deferred development amortization expense. We have filed a Notice of Appeal in April 2020 to defend our original tax treatment of these SR&ED claims.
Foreign Exchange
Approximately 95% of our revenues are denominated in U.S. dollars. We translate U.S. dollar sales to Canadian dollars on the date of delivery and subsequently when the accounts receivable is collected. If the U.S. dollar appreciates relative to the Canadian dollar after we collect the accounts receivable in U.S. dollars, we will receive more Canadian dollars when the U.S. dollars are converted to Canadian dollars in subsequent months. We also enjoy a natural hedge since the majority of our materials and components purchased are in U.S. dollars.
As at June 30, 2021, the exchange rate on the Canadian dollar relative to the U.S. dollar strengthened to $1.239 from $1.366 as at June 30, 2020. This $0.127 exchange difference decreased the value of our $57.7 million U.S. dollar net assets by approximately $7.3 million Canadian.
Financial Instruments
We periodically enter into forward contracts to partially manage our exposure to currency fluctuations between Canadian and U.S. dollars. Forward contracts are entered into based on our projected requirements for converting U.S. to Canadian dollars. We do not recognize these contracts in the consolidated financial statements when they are entered into, nor do we account for them as hedges. Instead, the contracts are marked to fair value at each balance sheet date. Changes to fair value are recorded in income. The fair value of these contracts is included in accounts receivable when in an asset position or accounts payable when in a liability position.
As at June 30, 2021, we did not have any forward contracts in an asset position (June 30, 2020 - $0.1 million).
11. Off-Balance Sheet Arrangements
We do not have any off-balance sheet arrangements that have, or are reasonably likely to have, a current or future effect on our financial performance or financial condition.
12. Transactions Between Related Parties
On March 31, 2021, Mr. Derek Elder, a member of the Board of Directors purchased 50,000 common shares of the Company at a subscription price of $14.25 per common share (the TSX closing price as at March 16, 2021), for a total aggregate subscription price of $0.7 million.
13. Proposed Transactions
There are no proposed asset or business acquisitions or dispositions that our Board of Directors have decided to proceed with or for which our senior management believes confirmation by the Board of Directors is probable.
14. Critical Accounting Estimates
The preparation of our consolidated financial statements, in conformity with IFRS, requires management to make estimates, assumptions and judgments that affect the reported amounts of assets and liabilities at the date of the financial statements and the reported amounts of revenues and expenses during the reporting period. Uncertainty about these assumptions and estimates could result in outcomes that require material adjustments in future periods to the carrying amount of the affected asset or liability. Actual results could differ from those estimates.
Vecima Networks Inc. 2021 Annual Report Page 24
Functional currency
The Company assesses the primary economic environment in which we operate by considering factors such as the currency for which sales of goods and services are denominated and settled, the country whose competitive forces and regulations mainly determine the sales prices of its goods and services and the currency that mainly influences labour, material and other costs of providing goods and services.
Sales by Vecima Networks Inc., and Vecima Networks (USA) Inc. are primarily transacted in U.S. dollars ("USD"). The cost of materials is denominated in both Canadian and U.S. dollars. The labour cost is denominated fully in Canadian dollars. Management pays close attention to gross margin, and the setting of prices in USD is influenced by costs which are primarily influenced by the Canadian dollar. Due to the mix of indicators for its primary economic environment, the Company assesses the secondary indicators of finance activities and receipts from operations. Equity and debt financing activities are both denominated in Canadian dollars and receipts from operations are retained primarily in Canadian dollars. Based on all these factors, the Company determined that the functional currency for the entities listed above is the Canadian dollar.
Sales by Vecima Technology Inc. (a subsidiary of the Company) are primarily transacted in USD. The cost of materials is denominated in USD. The labour cost is denominated fully in USD. Equity and debt financing activities are both denominated in USD and receipts from operations are retained primarily in USD. Based on all these factors, the Company determined that the functional currency for Vecima Technology Inc. is USD.
Sales by Concurrent Content Solutions Corporation (a subsidiary of the Company) are primarily transacted in Japanese Yen. The cost of materials is denominated in Japanese Yen; however, certain purchases of inventory are made in USD. The labour cost is denominated fully in Japanese Yen. Equity and intercompany financing activities are denominated in both Japanese Yen and USD and receipts from operations are retained in Japanese Yen. Based on all these factors, the Company determined that the functional currency for Concurrent Content Solutions Corporation is the Japanese Yen.
Sales by Vecima Technology (UK) Ltd. (a subsidiary of the Company) are primarily transacted in Great British Pounds (GBP). The cost of materials is denominated in GBP. The labour cost is denominated fully in GBP. Equity and intercompany financing activities are denominated in either GBP or USD and receipts from operations are retained primarily in GBP. Based on all these factors, the Company determined that the functional currency for Vecima Technology (UK) Ltd. is GBP.
Sales by Vecima Technology B.V. (a subsidiary of the Company) are primarily transacted in Euro. The cost of materials is denominated in Euro. The labour costs is denominated fully in Euro. While equity transactions are denominated in Canadian dollars, intercompany financing activities and receipts from operations are denominated in Euro. Based on all these factors, the Company determined that the functional currency for Vecima Technology B.V. is Euro.
Sales by Vecima Technology (Qingdao) Co., Ltd. and Vecima Technology (Shanghai) Co., Ltd., (subsidiaries of the Company) are transacted in Renminbi (“RMB”). The cost of materials and labour costs are denominated in RMB. Equity and debt financing activities are both denominated in RMB and receipts from operations are retained in RMB. Based on all of these factors, the Company determined that the functional currency for Vecima Technology (Qingdao) Co., Ltd. and Vecima Technology (Shanghai) Co., Ltd. is RMB.
Revenue from contracts with customers and deferred revenue
Significant judgment may be required in determining the distinct performance obligations within a contract and the allocation of transaction price to multiple element performance obligations. When multiple performance obligations are identified in a contract, the transaction price is allocated based on the stand-alone selling price for each. If the stand-alone selling price is not observable, the Company estimates the stand-alone selling price for each distinct performance obligation based on a related cost plus margin, taking into account reasonably available information relating to the market conditions, entity-specific factors, and the class of customer.
Deferred revenue consists of service contracts and upfront customer activation and connection fees where billings are recorded and received prior to the rendering of the associated service. Deferred revenue may be impacted by the allocation of the transaction price where a component of the contract includes such services. Billings for services are recognized as revenue in the period in which the services are provided. Upfront customer activation and connection fees are recognized over the expected term of the customer relationship.

Vecima Networks Inc. 2021 Annual Report Page 25
Deferred development costs
Development costs are capitalized in accordance with our accounting policy. Capitalization of costs is initiated based on management's judgment that technological and economic feasibility is confirmed, usually when the research project is approved to begin development. In assessing whether these costs are impaired, management makes assumptions regarding the expected future cash flows from the project, discount rates to be applied and the expected periods of benefit.
Impairment of non-financial assets
Impairment exists when the carrying value of a tangible asset, intangible asset or cash-generating unit, including goodwill, exceeds its recoverable amount, which is the higher of its fair value less cost of disposal and its value-in-use. The value-in-use calculation is based on a discounted cash flow model, where the cash flow is derived from the budget extrapolated over the next three to five years, exclusive of restructuring activities or significant future investments to enhance the asset's performance. The recoverable amount is most sensitive to the discount rate used as well as the expected future cash inflows and growth rate used to extrapolate beyond the three to five years.
Share-based compensation
We measure the cost of share-based compensation transactions with reference to the fair value of the options issued at the date they were granted. Estimated fair value for share-based compensation transactions requires the determination of the most appropriate valuation model, which is dependent on the terms and conditions of the grant. This estimate also requires the determination of the most appropriate inputs to the valuation model including the expected life of the share option and the volatility.
The assumptions and models used for estimating fair value for share-based compensation are as follows:
Years ended June 30, 2021 2020
Weighted average share price $ 12.30 $ 8.25 Expected option life 6.00 years 6.00 years Risk-free rate of return 0.35% 1.33% Volatility factor 23.75% 23.78% Expected dividends 1.79% 2.65% Forfeiture rate 2.38% 2.07%
Income taxes
The amounts of deferred tax assets and liabilities are estimated with consideration given to the timing, source and amounts of future taxable income together with tax planning strategies. We make certain judgments in interpreting tax rules and regulations when we compute income tax expense; and when we evaluate whether a deferred tax asset can be recovered based on an assessment of existing tax laws, estimates of future profitability and tax planning strategies.
Allocation of purchase consideration to acquired assets and assumed liabilities
We allocate the purchase price of an acquisition to the tangible and intangible assets acquired and liabilities assumed as of the business combination date in accordance with IFRS 3. The purchase price allocation process requires that we use significant estimates and assumptions, including fair value estimates, as of the acquisition date.
Leases
We estimate the lease term by considering the facts and circumstances that creates an economic incentive to exercise an extension option, or not exercise a termination option. Certain qualitative and quantitative assumptions are made when determining the value of the economic incentives.
The application of IFRS 16 requires us to make estimates that affect the measurement of right-of-use assets and liabilities, including:
• Identifying or determining if a contract is or contains an identified asset – the identified asset should be physically distinct or represent all or substantially all of the capacity of the asset, and should provide the right to all or substantially all of the economic benefits from the use of the identified asset;
• determining which interest rate to use in measuring the present value of the lease liability for each lease – the incremental borrowing rate should reflect the interest that would have to be paid to borrow at a similar term and with similar security; and
• determining, with reasonable certainty, whether the Company will exercise an option to extend or an option not to terminate a lease contract – this will be based on an assessment of the expected economic return from the lease.

Vecima Networks Inc. 2021 Annual Report Page 26
Other areas
Other key areas of estimation where management is required to make subjective estimates, often as a result of matters that are inherently uncertain, include:
• the assessment of the carrying values of allowances for doubtful accounts and inventory obsolescence;
• the capitalization of overhead;
• the useful lives of property, plant and equipment; and the useful lives of intangible assets;
• provisions, contingent liabilities and the fair value of financial assets; and
• the future effects of the COVID-19 pandemic.
15. Accounting Pronouncements and Standards
Adoption of New Accounting Standards in 2021
We adopted the following accounting standards and amendments that were effective for the interim and annual consolidated financial statements commencing July 1, 2020.
IAS 1 - Presentation of Financial Statements; and IAS 8 - Accounting Policies, Changes in Accounting Estimates and Errors
Effective July 1, 2020, we adopted IAS 1 and IAS 8, which was amended to clarify the definition of “material” and how it should be applied. The amendments also improve the explanation of the definition and ensure consistency across all IFRS standards. The new definition states that information is material if omitting, misstating or obscuring it could reasonably be expected to influence decisions that the primary users of general purpose financial statements make on the basis of those financial statements. The adoption of this amendment did not have a material effect on our financial statements.
IFRS 3 - Business Combinations
In October 2018, the IASB issued an amendment to IFRS 3 – Business Combinations (IFRS 3). The amendment clarifies the definition of a business and assists entities to determine whether an acquisition is a business combination or an acquisition of a group of assets. The amendment emphasizes that the output of a business is to provide goods and services to customers and also to provide supplementary guidance. The amendment to IFRS 3 may affect whether the future acquisitions are accounted for as a business combination or asset acquisition, along with the resulting allocation of the purchase price between the identifiable assets acquired and goodwill. These amendments did not have any impact on our financial statements. However, they may affect whether future acquisitions are accounted for as a business combination or asset acquisition, depending on the facts and circumstances of any future acquisition transactions.
Amendment to IFRS 16 - Leases
On May 28, 2020, the IASB published Covid-19-Related Rent Concessions (Amendments to IFRS 16), amending the standard to provide lessees with an exemption from assessing whether a COVID-19-related rent concession is a lease modification. We did not adopt the option relief provided in this amendment.
IFRS 9 - Financial Instruments; IAS 39 - Financial Instruments: Recognition and Measurement; and IFRS 7 - Financial Instruments: Disclosures
Amendments to these accounting standards provides temporary, but mandatory, relief from specific hedge accounting requirements to address potential effects of the uncertainty in the lead up to interbank offer rates reform (IBOR reform). The adoption of this amendment did not have a material effect on our financial statements.
Standards and Amendments to Standards Issued but not yet Effective
Amendments to IAS 1 – Presentation of financial statements (IAS1)
On January 23, 2020, the IASB issued amendments to IAS 1 in respect of the classification of liabilities as current or non-current. The amendments aim to promote consistency in applying the requirements by helping entities determine whether, in the statement of financial position, debt and other liabilities with an uncertain settlement date should be classified as current (due or potentially due to be settled within one year) or non-current. The amendments become effective for annual reporting periods beginning on or after January 1, 2023.
Vecima Networks Inc. 2021 Annual Report Page 27
Amendments to IAS 16 – Property, plant and equipment – proceeds before intended use
On May 14, 2020, the IASB issued amendments to IAS16, which prohibits deducting from the cost of an item of property, plant and equipment, any proceeds from selling items produced while bringing that asset to the location and condition necessary for it to be capable of operating in the manner intended by management. Instead, an entity recognizes the proceeds from selling such items, and the cost of producing those items, in profit or loss. The amendments become effective for annual reporting periods beginning on or after January 1, 2022.
IFRS 17 – Insurance contracts (IFRS 17)
IFRS 17 is a new standard that replaces IFRS 4 – Insurance contracts. IFRS 17 aims to provide consistency and transparency in the application of accounting for insurance contracts. This standard becomes effective for annual reporting periods beginning on or after January 1, 2023.
Amendments to IAS 37 – Provisions (IAS 37)
On May 14, 2020 the IASB issued Onerous Contracts – Cost of Fulfilling a Contract (Amendments to IAS 37), amending the standard regarding costs a company should include as the cost of fulfilling a contract when assessing whether a contract is onerous. These amendments are effective for annual reporting periods beginning on or after January 1, 2022, with early application permitted.
We do not expect IFRS 17 will have an effect on our consolidated financial statements. We are assessing the impacts, if any, the remaining standards or amendments will have on our consolidated financial statements.
16. Disclosure Controls and Procedures
Disclosure controls and procedures were designed to provide reasonable assurance that material information relating to Vecima is made known by us to others, particularly during the period in which annual filings are being prepared, and information required to be disclosed by us in our annual filings, interim filings or other reports filed or submitted by us under securities legislation is recorded, processed, summarized and reported within the time periods specified in securities legislation.
Our Chief Executive Officer ("CEO") and Chief Financial Officer ("CFO") have evaluated the effectiveness of our disclosure controls and procedures as defined under rules adopted by the Canadian securities regulatory authorities. Based on that evaluation, our CEO and CFO have concluded that our disclosure controls and procedures were effective as at June 30, 2021.
17. Internal Control over Financial Reporting
Internal controls over financial reporting ("ICFR") were designed to provide reasonable assurance regarding the reliability of financial reporting and the preparation of financial statements for external reporting purposes in accordance with IFRS. There are inherent limitations to the effectiveness of any system of internal controls, including the possibility of human error and the circumvention or overriding of internal controls. Because of its inherent limitations, internal controls over financial reporting may not prevent or detect misstatements. Accordingly, even if internal controls are effective, they can only provide reasonable assurance of achieving their controls.
Our CEO and CFO have evaluated the effectiveness of the internal control over financial reporting as at June 30, 2021 in accordance with Internal Control - Integrated Framework (2013), published by the Committee of Sponsoring Organizations of the Treadway Commission ("COSO"). Based on this evaluation, our CEO and CFO have determined that the internal control over financial reporting is effective as at June 30, 2021. There has been no change in the internal controls over financial reporting that occurred during the period beginning on April 1, 2021 and ended on June 30, 2021 that has materially affected, or is reasonably likely to materially affect our internal controls on financial reporting
Our CEO and CFO have limited the scope of their design of disclosure controls and procedures and internal control over financial reporting to exclude controls, policies and procedures of the business we acquired from Nokia, which we acquired on August 7, 2020. We have accordingly availed ourselves of provision 3.3(1)(b) of National Instrument 52-109, which permits exclusion of this acquisition in the design and operating effectiveness assessment of our ICFR for a maximum period of 365 days from the end of the financial period in which the acquisition occurred.

Vecima Networks Inc. 2021 Annual Report Page 28
The following summary of financial information, in thousands of Canadian dollars, pertains to the cable access technology portfolios we acquired from Nokia Corporation that was included in our consolidated financial statements for the year ended June 30, 2021:
Sales $ 19,723
Net income $ 1,246
Current assets $ 18,357
Non-current assets $ 7,836
Current liabilities $ 8,478
Non-current liabilities $ 819
18. Business Combination
On August 7, 2020, we completed the purchase of the DOCSIS DAA and EPON/DPoE cable access technology portfolios from Nokia Corporation for $5.9 million (US$4.4 million), net of working capital adjustments of $0.5 million (US$0.4 million). The purchase price included inventory, property, plant and equipment, intangible assets and goodwill.
We determined and allocated the purchase price on acquisition to the tangible and intangible assets acquired and liabilities assumed as of the business combination date in accordance with IFRS 3 - Business Combinations. The purchase price allocation process requires that we use significant estimates and assumptions, including fair value estimates, as of the acquisition date.
Goodwill recorded in connection with the acquisition is primarily attributable to: the expected future earnings potential as a result of expected synergies arising from the consolidation of these assets and our existing business; expected growth in the underlying markets which the new business serves; and the strength of the assembled workforce.
19. Legal Proceedings
From time to time, we may be involved in certain claims and litigation arising out of the ordinary course and conduct of business. Management assesses such claims and, if considered likely to result in a loss, and when the amount of the loss is quantifiable, a provision for the loss is made based on management's assessment of the most likely outcome. We do not provide for claims for which the outcome is not determinable or claims where the amount of the loss cannot be reasonably estimated. Any settlements or awards under such claims are provided for when reasonably determinable.
If it becomes probable that we will be held liable for claims against the Company, we will recognize a provision during the period in which the change in probability occurs, which could be material to our consolidated statements of comprehensive income or consolidated statements of financial position.
20. Risks and Uncertainties and COVID-19
Our financial performance, share price, business prospects and financial condition are subject to numerous risks and uncertainties, and are affected by various factors outside the control of management. Prior to making any investment decision regarding Vecima, investors should carefully consider, among other things, the risks described herein (including the factors outlined under the heading “Forward-Looking Information” below) and the risk factors set forth in our Annual Information Form for our most recently completed fiscal year, which are incorporated by reference herein. These risks and uncertainties are not the only ones that we face. Additional risks and uncertainties not presently known to us or that we currently deem immaterial may also impair our business. If any of these risks occurs, our financial performance, share price, business prospects and financial condition could be materially adversely affected.
Vecima was founded by Dr. Surinder Kumar in 1988. Voting control of Vecima is held by Dr. Kumar through either direct or indirect ownership of the Company's common shares. As at June 30, 2021, Dr. Kumar collectively owned approximately 60% of our common shares outstanding. Each common share carries the right to one vote. We have no other classes of voting securities.

Vecima Networks Inc. 2021 Annual Report Page 29
Third-party Component Supply
We maintain a global sourcing strategy and depend on third-party suppliers for certain components, subcomponents and raw materials used in our products. As an example, several of our products require specific components including silicon chips, for which reliable, high-volume supply is often available only from limited sources and for which we do not have guarantees of supply. A combination of significant technology trends and COVID-19 related challenges has resulted in the supply of some of these components becoming constrained on a global basis. While we have not experienced significant supply disruptions to date, the potential for such components to be in short supply or delayed in reaching us, could potentially result in product shipping delays and increased costs, which in turn, could adversely impact our gross margin and results of operations.
COVID-19
We have been closely monitoring the impact of COVID-19. At this time, our industry is recognized as an essential service in the areas where we operate. We have taken steps to allow most of our workforce to work remotely. We have also implemented all of the social distancing and increased facility sanitization guidelines and suspended all travel. In addition, we have increased production where possible to get ahead of any staffing challenges we might encounter.
It is too soon to gauge the impacts of the current outbreak, given the many unknowns related to COVID-19. These include the duration and severity of the outbreak. COVID-19 is altering business and consumer activity in affected areas and beyond. The global response to the COVID-19 outbreak has resulted in, among other things, border closures, severe travel restrictions, the temporary shut-down of non-essential services and extreme fluctuations in financial and commodity markets. Additional measures may be implemented by one or more governments in jurisdictions where we operate. Labour shortages due to illness, Company or government imposed isolation programs, or restrictions on the movement of personnel or possible supply chain disruptions could result in a reduction or cessation of all or a portion of our operations. The extent to which COVID-19 and any other pandemic or public health crisis impacts our business, affairs, operations, financial condition, liquidity, availability of credit and results of operations will depend on future developments that are highly uncertain and cannot be predicted with any meaningful precision, including new information which may emerge concerning the severity of the COVID-19 virus and the actions required to contain the COVID-19 virus or remedy its impact, among others.
The actual and threatened spread of COVID-19 globally could also have a material adverse effect on the economies in which we operate and could continue to negatively impact stock markets, including the trading price of our shares. Potential impacts include, but are not limited to, an impairment of long-lived assets, an impairment of short-term investments and a change in the estimated credit loss on accounts receivable.
Any of these developments, and others, could have a material adverse effect on our business, financial condition, operations and results of operations. In addition, because of the severity and global nature of the COVID-19 pandemic, it is possible that estimates in our financial statements will change in the near term and the effect of any such changes could be material, which could result in, among other things, an impairment of long-lived assets, impairments of short-term investments and a change in the estimated credit losses on accounts receivable.
Our financial priorities remain unchanged. Importantly we continue to have a very strong balance sheet. We are continuing with the payment of our quarterly dividend.
21. Outstanding Share Data
As at September 21, 2021, we had 23,071,376 common shares outstanding as well as stock options outstanding that are exercisable for an additional 99,875 common shares, and performance share units outstanding that are exercisable for an additional 202,528 common shares.
On January 2, 2020, we filed a Notice of Intention with the Toronto Stock Exchange to acquire for cancellation, by way of normal course issuer bid, up to 600,000 common shares of the Company. We acquired nil common shares of Vecima for cancellation in fiscal 2021 and 13,380 common shares in fiscal 2020. The normal course issuer bid commenced on January 6, 2020 and expired on January 5, 2021.
On October 20, 2020, 195,178 Performance Share Units (PSUs) vested and were settled via the issuance of common shares. The estimated fair value of the vested PSUs was $1.0 million. The Company withheld 58,603 commons shares at a value of $0.75 million to settle withholding tax obligations on the issuance of the common share awards.
On January 15, 2021, 4,620 of the PSUs vested and were settled via the issuance of common shares. The estimated fair value of the vested PSUs was $0.031 million. The Company withheld 1,223 common shares at a value of $0.017 million to settle withholding tax obligations on the issuance of the common share awards.

Vecima Networks Inc. 2021 Annual Report Page 30
22. Additional Information
Financial Governance
Our management is responsible for the preparation and presentation of the consolidated financial statements and notes thereto and the MD&A. Additionally, it is management’s responsibility to ensure that we comply with the laws and regulations applicable to our activities.
Our management is accountable to the Board, each member of which is elected annually by the shareholders of the Company. The Board is responsible for reviewing and approving the consolidated financial statements and the MD&A, after receiving the recommendation of the Audit Committee, which is composed of three directors, all of whom are independent.
External auditors are appointed annually by the shareholders to conduct an audit of the annual consolidated financial statements in accordance with generally accepted auditing standards. The external auditors have complete access to the Audit Committee to discuss audit, financial reporting and related matters resulting from the annual audit, as well as to assist the members of the Audit Committee in discharging their responsibilities.
Forward-Looking Information
This MD&A contains "forward-looking information" within the meaning of applicable securities laws. Forward-looking information is generally identifiable by use of the words ''believes", "may", "plans", "will", "anticipates", "intends", "could", "estimates", "expects", "forecasts", "projects" and similar expressions, and the negative of such expressions.
Forward-looking information in this MD&A includes, but is not limited to, statements that: we had healthy continued demand for the ordering activity for TerraceQAM platform through the balance of fiscal 2021 as operators continue their commercial rollout for the current generation, while preparing for the next-generation TerraceIQ platform; the slowdown in Terrace Family sales was anticipated and reflects tapering demand for our legacy TC600 and TC600E products; and we believe that our current cash and short-term investments of $28.9 million together with anticipated cash flow from operations will be sufficient to meet our working capital requirements and capital expenditure requirements for the foreseeable future. Forward-looking information also includes our Strategy, our Industry Developments and our COVID-19 Business Update and Outlook in this MD&A.
In connection with the forward-looking information contained in this MD&A, we have made numerous assumptions, regarding, among other things: the strength of our balance sheet; the present or potential value of our core technologies, business operations and asset holdings; our ability to continue our relationships with a few key customers; our ability to deliver products associated with key contracts; our ability to manage our business and growth successfully; our ability to meet customers' requirements for manufacturing capacity; our ability to develop new products and enhance our existing products; our ability to expand current distribution channels and can develop new distribution channels; our ability to recruit and retain management and other qualified personnel crucial to our business; we are not required to change our pricing models to compete successfully; our third party suppliers and contract manufacturers upon which we rely continue to meet our needs; our intellectual property is not infringed upon; we are not subject to warranty or product liability claims that harm our business; our ability to successfully implement acquisitions; our ability to manage risks associated with our international operations; currency fluctuations do not adversely affect us; growth in our key markets continues; our ability to adapt to technological change, new products and standards; we are not subject to increased competition that has an adverse effect on our business; we are not subject to competition from new or existing technologies that adversely affect our business; we are not subject to any material new government regulation of our products; and, no third parties allege that we infringe on their intellectual property. While we consider these assumptions to be reasonable, these assumptions are inherently subject to significant uncertainties and contingencies.
There are known and unknown risk factors which could cause our actual results, performance or achievements to be materially different from any future results, performance or achievements expressed or implied by the forward-looking information contained in this MD&A. Known risk factors include, among others: our statement of financial position, as well as the value of our core technologies, business operations and asset holdings may be significantly weaker than we currently estimate; our operating results are expected to fluctuate; we derive a substantial part of our revenue from a few large customers; a small number of our shareholders control us; sale of common shares by our controlling shareholders could cause the share price to fall; volatility in our common share price; dilution from exercise of stock options or settlement of performance share units; liquidity of common shares; our share price shall fluctuate; we may be unable to deliver products associated with key contracts; failure to manage our business or growth successfully may adversely affect our operating results; if we cannot meet our customers' requirements for manufacturing capacity, sales may suffer; our success depends on our ability to develop new products and enhance our existing products; we continue to adapt content delivery products to add

Vecima Networks Inc. 2021 Annual Report Page 31
features allowing deployments to cable, IPTV, and Internet CDN providers to enable multi-screen video delivery; the failure to execute on this transition or execute quickly enough, shall adversely affect our business; if content providers, such as movie studios, limit the scope of content licensed for use in the digital content delivery market, our business, financial condition and results of operations could be negatively affected because the potential market for its products would be more limited than it currently believes; we are dependent on the expansion of our current distribution channels and the development of new distribution channels; the budgeting cycles of larger cable operators can also result in quarter-to-quarter variability in customer orders generally large in volume, while availability of parts and production capacity can influence the timing of product deliveries; our operations depend on information technology systems, which may be disrupted or may not operate as desired; our ability to recruit and retain management and other qualified personnel is crucial to our business; if we are required to change our pricing models to compete successfully, our margins and operating results may be adversely affected; our reliance on third party suppliers and contract manufacturers reduces our control over our performance; if our intellectual property is not adequately protected, we may lose our competitive advantage; we utilize open source software, which could enable our competitors to gain access to our source code and distribute it without paying us any license fees; we have software license agreements covering the use of our software as combined with software provided by specific key integrated circuit vendor(s) and the associated integrated circuits provided by those vendor(s), failure to maintain these agreements or maintain them with commercially reasonable terms could limit our ability to market certain products and affect our business; successful warranty or product liability claims could harm our business; acquisitions could divert management's attention and financial resources, may negatively affect our operating results and could cause significant dilution to shareholders; there are risks associated with our international operations; impacts to trade relationships between the United States and China may adversely affect Vecima’s profitability; currency fluctuations may adversely affect us; changes in interest rates on debt securities may adversely affect us; growth in our key markets may not continue; our inability to adapt to technological change, new products and standards could harm our business; increased competition could have an adverse effect on our business; competition from new or existing technologies may adversely affect our business; the cable and telecommunications industries are experiencing consolidation, which could result in delays or reductions in purchases of products and services, which could have a material adverse effect on Vecima’s business; government regulation of our products and new government regulation could harm our business; third parties may allege that we infringe on their intellectual property; we may be subject to liability if private information supplied to our customers is misused; and epidemics, pandemics or other public health crises, including the current outbreak of COVID-19. A more complete discussion of the risks and uncertainties facing us is disclosed under the heading "Risks and Uncertainties and COVID-19" above and under the heading "Risk Factors" in our Annual Information Form for our most recently completed fiscal year, as well as in our continuous disclosure filings with Canadian securities regulatory authorities available at www.sedar.com. All forward-looking information in this MD&A is qualified in its entirety by this cautionary statement and we disclaim any obligation to revise or update such forward-looking information to reflect future results, events or developments, except as required by law.

Vecima Networks Inc. 2021 Annual Report Page 32
MANAGEMENT’S RESPONSIBILITY FOR FINANCIAL REPORTING The accompanying consolidated financial statements of Vecima Networks Inc. (“Vecima”, or the “Company”) and its subsidiaries and all the information in Management’s Discussion and Analysis (MD&A) are the responsibility of management and have been approved by the Board of Directors.
The consolidated financial statements have been prepared by management in accordance with International Financial Reporting Standards as issued by the International Accounting Standards Board. The consolidated financial statements include certain amounts that are based on management’s best estimates and judgments and, in their opinion, present fairly, in all material respects, Vecima’s financial position, results of operations, and cash flows. Management has prepared the financial information presented elsewhere in the MD&A and has ensured that it is consistent with the consolidated financial statements.
Management has a system of internal controls designed to further enhance the integrity of the consolidated financial statements and to provide reasonable assurance that the financial statements are accurate and complete in all material respects. The internal control system is supported by management communication to employees about its policies on ethical business conduct. Management believes these internal controls provide reasonable assurance that the transactions are properly authorized and recorded; financial records are reliable and form a proper basis for the preparation of the consolidated financial statements; and the Company’s assets are properly accounted for and adequately safeguarded.
The Board of Directors is responsible for ensuring management fulfills its responsibilities for financial reporting and is ultimately responsible for reviewing and approving the consolidated financial statements. The Board of Directors carries out this responsibility through its Audit Committee, which is entirely comprised of independent directors.
The Audit Committee meets periodically with management, and annually with the external auditors, to discuss internal controls over the financial reporting process, auditing matters, and financial reporting issues; to satisfy itself that each party is properly discharging its responsibilities; and, to review the MD&A, the consolidated financial statements, and the external auditors’ report. The Audit Committee reports its findings to the Board of Directors for its consideration when approving the consolidated financial statements for issuance to the shareholders. The Audit Committee also considers, for review by the Board of Directors and approval by the shareholders, the engagement or re-appointment of the external auditors.
The consolidated financial statements, for the year ended June 30, 2021, have been audited by Grant Thornton LLP, the external auditors, in accordance with Canadian generally accepted auditing standards on behalf of the shareholders. Grant Thornton has full and free access to the Audit Committee.
/s/ “Sumit Kumar” /s/ “Dale Booth” Sumit Kumar Dale Booth Chief Executive Officer Chief Financial Officer DATE: September 21, 2021 DATE: September 21, 2021

Grant Thornton LLP
11th Floor 200 King Street West, Box 11 Toronto, ON M5H 3T4
T +1 416 366 0100 F +1 416 36 4949
Audit | Tax | Advisory © Grant Thornton LLP. A Canadian Member of Grant Thornton International Ltd 1
Independent Auditor’s Report
To the Shareholders of Vecima Networks Inc.
Opinion
We have audited the consolidated financial statements of Vecima Networks Inc. (the “Company”) which comprise the consolidated statements of financial position as at June 30, 2021 and 2020, and the consolidated statements of comprehensive (loss) income, changes in equity and cash flows for the years then ended, and notes to the consolidated financial statements, including a summary of significant accounting policies.
In our opinion, the accompanying consolidated financial statements, present fairly, in all material respects, the consolidated financial position of Vecima Networks Inc. as at June 30, 2021 and 2020 and its consolidated financial performance and its consolidated cash flows for the years then ended in accordance with International Financial Reporting Standards (IFRS). Basis for Opinion We conducted our audit in accordance with Canadian generally accepted auditing standards. Our responsibilities under those standards are further described in the Auditor's Responsibilities for the Audit of the Consolidated Financial Statements section of our report. We are independent of the Company in accordance with the ethical requirements that are relevant to our audit of the consolidated financial statements in Canada, and we have fulfilled our other ethical responsibilities in accordance with these requirements. We believe that the audit evidence we have obtained is sufficient and appropriate to provide a basis for our opinion. Key Audit Matters Key audit matters are those matters that, in our professional judgement, were of most significance in our audit of the consolidated financial statements of the current period. These matters were addressed in the context of our audit of the consolidated financial statements as a whole, and in forming our opinion thereon, and we do not provide a separate opinion on these matters.

Audit | Tax | Advisory © Grant Thornton LLP. A Canadian Member of Grant Thornton International Ltd 2
Recoverability of the carrying value of finite-life deferred development costs not yet available for use As discussed in Note 2(n), 2(p) and Note 13 to the consolidated financial statements, development costs incurred by the Company are capitalized and deferred as finite-life intangible assets. Intangible assets with a finite-life, which are not yet available for use are required to be tested for impairment at least annually. As at June 30, 2021, the balance of such costs is $17.5 million, which is included in the total balance of intangible assets. Auditing management’s impairment test is complex and judgemental due to the estimation required in determining the recoverable amount of the finite-life intangible assets not yet available for use. The recoverable amount was estimated using a discounted cash flow model. Judgements with the highest degree of subjectivity and impact include forecasts of future operating performance and discount rates. Changes in these assumptions could have a significant impact on the recoverable amount of finite-life intangible assets not yet available for use, resulting in an impairment charge. Our audit procedures related to the key assumptions included the following, among others:
• Evaluated the design effectiveness of internal controls over the estimation process used by management.
• Evaluated the reasonableness of management’s forecasts of future operating performance by comparing the forecasts to:
o Historical operating performance o Approved business plans o Internal communications to management and Board of Directors
• Performed a sensitivity analysis on management’s forecasts of future operating performance
• With the assistance of valuation specialists, we evaluated the reasonableness of
discount rates by:
o Tested the source information underlying the determination of discount rates o Reviewed relevant internal and external information, including publicly
available market data to assess the reasonability of the discount rate o Developed an independent estimate for the discount rate and compared it to
that selected by management Information Other than the Consolidated Financial Statements and Auditor’s Report Thereon Management is responsible for the other information. The other information comprises the Management Discussion and Analysis but does not include the consolidated financial statements and our auditor's report thereon.
Our opinion on the consolidated financial statements does not cover the other information and we do not express any form of assurance conclusion thereon.
In connection with our audit of the consolidated financial statements, our responsibility is to read the other information and, in doing so, consider whether the other information is materially inconsistent with the consolidated financial statements or our knowledge obtained in the audit or otherwise appears to be materially misstated. If, based on the work we have performed, we conclude that there is a material misstatement of this other information, we are required to report that fact. We have nothing to report in this regard.

Audit | Tax | Advisory © Grant Thornton LLP. A Canadian Member of Grant Thornton International Ltd 3
Responsibilities of Management and Those Charged with Governance for the Consolidated Financial Statements
Management is responsible for the preparation and fair presentation of the consolidated financial statements in accordance with IFRS, and for such internal control as management determines is necessary to enable the preparation of consolidated financial statements that are free from material misstatement, whether due to fraud or error.
In preparing these consolidated financial statements, management is responsible for assessing the Company’s ability to continue as a going concern, disclosing, as applicable, matters related to a going concern and using the going concern basis of accounting unless management either intends to liquidate the Company or to cease operations, or has no realistic alternative to do so.
Those charged with governance are responsible for overseeing the Company’s financial reporting process.
Auditor’s Responsibilities for the Audit of the Consolidated Financial Statements
Our objectives are to obtain reasonable assurance about whether the consolidated financial statements as a whole are free from material misstatement, whether due to fraud or error, and to issue an auditor’s report that includes our opinion. Reasonable assurance is a high level of assurance but is not a guarantee that an audit conducted in accordance with Canadian generally accepted auditing standards will always detect a material misstatement when it exists. Misstatements can arise from fraud or error and are considered material if, individually or in the aggregate, they could reasonably be expected to influence the economic decisions of users taken on the basis of these consolidated financial statements.
As part of an audit in accordance with Canadian generally accepted auditing standards, we exercise professional judgment and maintain professional skepticism throughout the audit. We also:
• Identify and assess the risks of material misstatement of the consolidated financial statements, whether due to fraud or error, design and perform audit procedures responsive to those risks, and obtain audit evidence that is sufficient and appropriate to provide a basis for our opinion. The risk of not detecting a material misstatement resulting from fraud is higher than for one resulting from error, as fraud may involve collusion, forgery, intentional omissions, misrepresentations, or the override of internal control.
• Obtain an understanding of internal control relevant to the audit in order to design audit procedures that are appropriate in the circumstances, but not for the purpose of expressing an opinion on the effectiveness of the Company's internal control.
• Evaluate the appropriateness of accounting policies used and the reasonableness of
accounting estimates and related disclosures made by management.
• Conclude on the appropriateness of management's use of the going concern basis of accounting and, based on the audit evidence obtained, whether a material uncertainty exists related to events or conditions that may cast significant doubt on the Company's ability to continue as a going concern. If we conclude that a material uncertainty exists, we are required to draw attention in our auditor's report to the related disclosures in the consolidated financial statements or, if such disclosures are inadequate, to modify our opinion. Our conclusions are based on the audit evidence obtained up to the date of our auditor's report. However, future events or conditions may cause the Company to cease to continue as a going concern.

Audit | Tax | Advisory © Grant Thornton LLP. A Canadian Member of Grant Thornton International Ltd 4
• Evaluate the overall presentation, structure and content of the consolidated financialstatements, including the disclosures, and whether the consolidated financial statementsrepresent the underlying transactions and events in a manner that achieves fairpresentation.
• Obtain sufficient appropriate audit evidence regarding the financial information of theentities or business activities within the Group to express an opinion on the consolidatedfinancial statements. We are responsible for the direction, supervision and performanceof the group audit. We remain solely responsible for our audit opinion.
We communicate with those charged with governance regarding, among other matters, the planned scope and timing of the audit and significant audit findings, including any significant deficiencies in internal control that we identify during our audit.
We also provide those charged with governance with a statement that we have complied with relevant ethical requirements regarding independence, and to communicate with them all relationships and other matters that may reasonably be thought to bear on our independence, and where applicable, related safeguards.
From the matters communicated with those charged with governance, we determine those matters that were of most significance in the audit of the consolidated financial statements of the current period and are therefore key audit matters. We describe these matters in our auditor’s report unless law or regulation precludes public disclosure about the matter or when, in extremely rare circumstances, we determine that a matter should not be communicated in our report because of the adverse consequences of doing so would reasonably be expected to outweigh the public interest benefits of such communication.
The engagement partner on the audit resulting in this independent auditor's report is Mark Irwin.
Toronto, Canada Chartered Professional Accountants September 21, 2021 Licensed Public Accountant

VECIMA NETWORKS INC. Consolidated Statements of Financial Position (in thousands of Canadian dollars)
Vecima Networks Inc. 2021 Annual Report Page 37
As at Note June 30, 2021 June 30, 2020
Assets Current assets Cash and cash equivalents 6 $ 28,909 $ 17,350 Short-term investments 7, 28 - 17,165 Accounts receivable 8 28,784 24,908 Income tax receivable 414 333 Inventories 9 15,578 17,212 Prepaid expenses 3,497 2,051 Contract assets 22(b) 516 646
Total current assets 77,698 79,665
Non-current assets Property, plant and equipment 10 13,854 11,801 Right-of-use assets 11 3,660 4,010 Goodwill 12 14,542 15,487 Intangible assets 13 72,224 69,200 Other long-term assets 1,267 1,301 Investment tax credits 15 24,344 24,374 Deferred tax assets 16 7,143 4,460
Total assets $ 214,732 $ 210,298
Liabilities and shareholders’ equity Current liabilities Accounts payable and accrued liabilities 18 $ 22,259 $ 17,105 Provisions 19 1,439 492 Income tax payable 454 130 Deferred revenue 22(c) 7,137 4,960 Current portion of long-term debt 20 1,617 1,698
Total current liabilities 32,906 24,385
Non-current liabilities Provisions 19 397 400 Deferred revenue 22(c) 2,398 602 Deferred tax liability 16 4 536 Long-term debt 20 4,107 4,613
Total liabilities 39,812 30,536
Shareholders’ equity Share capital 21(a) 7,299 3,161 Reserves 3,407 3,838 Retained earnings 165,312 170,665 Accumulated other comprehensive (loss) income (1,098) 2,098
Total shareholders’ equity 174,920 179,762
Total liabilities and shareholders’ equity $ 214,732 $ 210,298
Contingent liability – Note 32; Contractual obligation – Note 33; Subsequent events – Note 34
The accompanying notes are an integral part of these consolidated financial statements.
Approved on behalf of the Board of Directors:
/s/ “Kent Elliott” /s/ “Danial Faizullabhoy”
Kent Elliott Danial Faizullabhoy
Director Director

VECIMA NETWORKS INC. Consolidated Statements of Comprehensive (Loss) Income (in thousands of Canadian dollars, except per share amounts)
Vecima Networks Inc. 2021 Annual Report Page 38
Years ended June 30, Note 2021 2020
Sales 22(a), 26 $ 124,177 $ 94,882 Cost of Sales 67,535 43,605
Gross Profit 56,642 51,277
Operating expenses Research and development 26,247 21,595 Sales and marketing 13,720 13,304 General and administrative 17,937 15,869 Share-based compensation 21(d) 1,420 59 Other income 23 (1,512) (479)
Total operating expenses 57,812 50,348
Operating (loss) income (1,170) 929 Finance income 24 69 636 Foreign exchange (loss) gain (2,973) 1,328
(Loss) income before income taxes (4,074) 2,893 Income tax (recovery) expense 16 (1,889) 391
Net (loss) income from continuing operations (2,185) 2,502
Net income (loss) from discontinued operations 4 1,854 (696)
Net (loss) income $ (331) $ 1,806
Other comprehensive (loss) income
Item that may be subsequently reclassed to net income Exchange differences on translating foreign operations (3,196) 1,088
Comprehensive (loss) income $ (3,527) $ 2,894
Net (loss) income per share
Continuing operations – basic $ (0.10) $ 0.11 Discontinued operations – basic 0.08 (0.03)
Total basic net (loss) income per share 25 $ (0.02) $ 0.08
Continuing operations – diluted $ (0.10) $ 0.11 Discontinued operations – diluted 0.08 (0.03)
Total diluted net (loss) income per share 25 $ (0.02) $ 0.08
Weighted average number of common shares
Shares outstanding – basic 25 22,748,826 22,411,612 Shares outstanding – diluted 25 22,748,826 22,444,806
The accompanying notes are an integral part of these consolidated financial statements.

VECIMA NETWORKS INC. Consolidated Statements of Changes in Equity (in thousands of Canadian dollars)
Vecima Networks Inc. 2021 Annual Report Page 39
Note Share capital Reserves
Retained earnings
Accumulated other
comprehensive (loss) income Total
Balance as at June 30, 2019 $ 1,916 $ 4,104 $ 173,898 $ 1,010 $ 180,928 Net income - - 1,806 - 1,806 Other comprehensive income - - - 1,088 1,088 Dividends - - (4,932) - (4,932) Shares repurchased and cancelled (2) - (107) - (109) Shares issued by exercising options 1,247 (325) - - 922 Share-based payment expense 21(d) - 59 - - 59
Balance as at June 30, 2020 $ 3,161 $ 3,838 $ 170,665 $ 2,098 $ 179,762
Balance as at June 30, 2020 $ 3,161 $ 3,838 $ 170,665 $ 2,098 $ 179,762 Net loss - - (331) - (331) Other comprehensive loss - - - (3,196) (3,196) Dividends - - (5,022) - (5,022) Shares issued by exercising options 3,154 (813) - - 2,341 Subscription for common shares 27 713 - - - 713 PSUs settled in common shares 21(d) 1,038 (1,038) - - - Withholding taxes on PSUs 21(d) (767) - - - (767) Share-based payment expense 21(d) - 1,420 - - 1,420
Balance as at June 30, 2021 $ 7,299 $ 3,407 $ 165,312 $ (1,098) $ 174,920
The accompanying notes are an integral part of these consolidated financial statements.

VECIMA NETWORKS INC. Consolidated Statements of Cash Flows (in thousands of Canadian dollars)
Vecima Networks Inc. 2021 Annual Report Page 40
Years ended June 30, Note 2021 2020
OPERATING ACTIVITIES Net (loss) income from continuing operations $ (2,185) $ 2,502 Adjustments for non-cash items: Gain on sale of property, plant and equipment 23 (302) (455) Depreciation and amortization 31 14,755 16,000 Share-based compensation 1,420 59 Income tax expense (recovery) 16 1,451 (50) Deferred income tax (recovery) expense 16 (3,340) 441 Interest expense 225 295 Interest income (163) (731) Net change in working capital 31 8,032 (7,821) Increase in other long-term assets (135) (186) Decrease in provisions (54) (274) Increase in investment tax credits (149) (201) Income tax received 174 173 Income tax paid (456) (485) Interest received 163 728 Interest paid (40) (66) Cash provided by (used in) discontinued operations 4 651 (96)
Cash provided by operating activities 20,047 9,833
INVESTING ACTIVITIES Capital expenditures, net 31 (2,377) (1,075) Purchase of short-term investments (295) (6,083) Proceeds from sale of short-term investments 17,460 13,487 Deferred development costs 13 (16,235) (11,971) Business acquisition 5 (5,871) - Cash provided by (used in) discontinued operations 4 2,323 (321)
Cash used in investing activities (4,995) (5,963)
FINANCING ACTIVITIES
Proceeds from government grants 14 - 98 Principal repayments of lease liabilities 20 (1,557) (1,628) Repayment of long-term debt 20 (250) (271) Repurchase and cancellation of shares 21(a) - (109) Dividends paid (5,022) (4,932) Proceeds from issuing shares 21(a), 27 713 - Issuance of shares through exercised options 21(a) 2,341 922 Withholding taxes on PSUs 21(d) (767) - Cash used in discontinued operations 4 (64) (47)
Cash used in financing activities (4,606) (5,967)
Net increase (decrease) in cash and cash equivalents 10,446 (2,097) Effect of change in exchange rates on cash 1,113 (387) Cash and cash equivalents, beginning of year 17,350 19,834
Cash and cash equivalents, end of year $ 28,909 $ 17,350
The accompanying notes are an integral part of these consolidated financial statements.

VECIMA NETWORKS INC. Notes to the Consolidated Financial Statements Years ended June 30, 2021 and 2020 (in thousands of Canadian dollars except as otherwise noted)
Vecima Networks Inc. 2021 Annual Report Page 41
Table of Contents
1. NATURE OF THE BUSINESS ...........................................................................................42
2. SUMMARY OF SIGNIFICANT ACCOUNTING POLICIES .................................................42
3. USE OF JUDGMENTS AND ESTIMATES .........................................................................52
4. DISCONTINUED OPERATIONS .......................................................................................55
5. BUSINESS COMBINATION ..............................................................................................56
6. CASH AND CASH EQUIVALENTS ...................................................................................57
7. SHORT-TERM INVESTMENTS .........................................................................................58
8. ACCOUNTS RECEIVABLE ...............................................................................................58
9. INVENTORIES ...................................................................................................................58
10. PROPERTY, PLANT AND EQUIPMENT ...........................................................................59
11. RIGHT-OF-USE ASSETS ..................................................................................................60
12. GOODWILL .......................................................................................................................61
13. INTANGIBLE ASSETS ......................................................................................................62
14. GOVERNMENT GRANTS .................................................................................................63
15. INVESTMENT TAX CREDITS ...........................................................................................64
16. INCOME TAXES ................................................................................................................64
17. SHORT-TERM BORROWINGS .........................................................................................65
18. ACCOUNTS PAYABLE AND ACCRUED LIABILITIES ....................................................65
19. PROVISIONS .....................................................................................................................66
20. LONG-TERM DEBT ...........................................................................................................66
21. SHARE CAPITAL ..............................................................................................................67
22. REVENUE FROM CONTRACTS WITH CUSTOMERS ......................................................70
23. OTHER INCOME ...............................................................................................................71
24. FINANCE INCOME (EXPENSE) ........................................................................................71
25. NET (LOSS) INCOME PER SHARE ..................................................................................72
26. SEGMENTED FINANCIAL INFORMATION ......................................................................73
27. RELATED PARTY TRANSACTIONS ................................................................................74
28. FAIR VALUE HIERARCHY................................................................................................75
29. FINANCIAL INSTRUMENTS RISK MANAGEMENT .........................................................76
30. CAPITAL STRUCTURE MANAGEMENT ..........................................................................78
31. SUPPLEMENTAL INFORMATION ....................................................................................78
32. CONTINGENT LIABILITY .................................................................................................79
33. CONTRACTUAL OBLIGATION ........................................................................................79
34. SUBSEQUENT EVENTS ...................................................................................................79
35. COMPARATIVE FIGURES ................................................................................................79

VECIMA NETWORKS INC. Notes to the Consolidated Financial Statements Years ended June 30, 2021 and 2020 (in thousands of Canadian dollars except as otherwise noted)
Vecima Networks Inc. 2021 Annual Report Page 42
1. NATURE OF THE BUSINESS
Vecima Networks Inc. ("Vecima" or the "Company") is a company continued under the Canadian Business Corporations Act ("CBCA") and commenced operations in 1988. The Company's registered office is located at 771 Vanalman Avenue, Victoria, B.C., V8Z 3B8. The Company's common shares are traded on the Toronto Stock Exchange under the trading symbol "VCM".
The Company's Video and Broadband Solutions business designs, manufactures and sells products for the cable industry that allow service providers a cost-effective "last mile" solution for both video and broadband access, especially in the business services market segment. The Company’s Content Delivery and Storage business includes solutions and software for industries and customers that focus on storing, protecting, transforming, and delivering high-value media assets. The Company's Telematics business provides fleet managers key information and analytics they require to optimally manage their business.
2. SUMMARY OF SIGNIFICANT ACCOUNTING POLICIES
(a) Statement of compliance
These consolidated financial statements have been prepared in accordance with International Financial Reporting Standards (“IFRS”) as issued by the International Accounting Standards Board (“IASB”).
The consolidated financial statements of the Company for each of the years ended June 30, 2021 and 2020, were approved by the Board of Directors and authorized for issue on September 21, 2021.
(b) Basis of presentation
These consolidated financial statements have been prepared primarily under the historical cost convention and are expressed in thousands of Canadian dollars, unless otherwise indicated. Other measurement bases used are outlined below and in the applicable notes. The accounting polices set out below have been applied consistently in all material respects. Standards and guidelines not effective for the current accounting period are described in Note 2(z).
(c) Estimation uncertainty
Throughout the COVID-19 pandemic, the Company has been closely monitoring related developments and the impact on our business. We continue to serve customers through our available platforms. While the impact of COVID-19 is expected to be temporary, the current circumstances are dynamic and the impact on the Company’s future earnings and cash flows cannot be estimated at this time. Due to the uncertainty surrounding the duration and potential outcomes of the COVID-19 pandemic, and the unpredictable and continuously changing impacts and related government responses, there is more uncertainty associated with our assumptions, expectations, and estimates. The most significantly affected estimates relate to the Company’s determination of impairment of non-financial assets, the assessment of the carrying values of allowances for doubtful accounts and inventory obsolescence, and provisions.
(d) Basis of consolidation (subsidiaries)
The consolidated financial statements include the accounts of the Company and of its subsidiaries. Subsidiaries are entities over which the Company has control. Control exists when the Company has power over an investee, is exposed to or has rights to variable returns from its involvement with the entity and has the ability to affect those returns.
Subsidiaries are fully consolidated from the date on which control is obtained by the Company. All intercompany transactions and balances are eliminated upon consolidation. Income and expenses of subsidiaries acquired or disposed of during the year are included in the consolidated statements of comprehensive (loss) income from the effective date of acquisition and up to the effective date of disposal.
(e) Cash and cash equivalents
Cash and cash equivalents consist of cash and short-term deposits that have an original maturity of less than three months.

VECIMA NETWORKS INC. Notes to the Consolidated Financial Statements Years ended June 30, 2021 and 2020 (in thousands of Canadian dollars except as otherwise noted)
Vecima Networks Inc. 2021 Annual Report Page 43
(f) Revenue recognition
General policy
The Company earns revenue from the sale of products and the rendering of services. Revenue is measured based on the value of the expected consideration in a contract with a customer and excludes sales taxes and other amounts we collect on behalf of third parties. We recognize revenue when control over a product or service is transferred to a customer. When our right to consideration from a customer corresponds directly with the value to the customer of the products and services transferred to date, we recognize revenue in the amount to which we have a right to invoice.
For bundled arrangements, we account for individual products and services when they are separately identifiable, and the customer can benefit from the product or service on its own or with other readily available resources. The total arrangement consideration is allocated to each product or service included in the contract with the customer based on its stand-alone selling price. We generally determine stand-alone selling prices based on the observable prices at which we sell products separately without a service contract and prices for non-bundled service offers with the same range of services, adjusted for market conditions and other factors, as appropriate. When similar products and services are not sold separately, we use the expected cost plus margin approach to determine stand-alone selling prices. Products and services purchased by a customer in excess of those included in the bundled arrangement are accounted for separately.
A contract asset is recognized in the consolidated statements of financial position when our right to consideration from the transfer of products or services to a customer is conditional on our obligation to transfer other products or services. Contract assets are transferred to trade receivables when our right to consideration becomes conditional only as to the passage of time. A contract liability, such as deferred revenue, is recognized in the consolidated statements of financial position when we receive consideration in advance of the transfer of the products or services to the customer. Contract assets and liabilities relating to the same contract are presented on a net basis.
Incremental costs of obtaining a contract with a customer, principally comprised of sales commissions and prepaid contract fulfillment costs, are included in contract costs in the consolidated statements of financial position, except where the amortization period is one year or less, in which case costs of obtaining a contract are immediately expensed. Capitalized costs are amortized on a systematic basis that is consistent with the period and pattern of transfer to the customer of the related products or services.
Recognition of revenue from products and services
Revenue for each performance obligation is recognized either over time or at a point-in-time. For performance obligations performed over time, revenue is recognized as the service is provided. These services are typically provided, and thus recognized, on a monthly basis. Revenue for performance obligations satisfied at a point-in-time is recognized when control of the product or service transfers to the customer under the terms and conditions of the contract.

VECIMA NETWORKS INC. Notes to the Consolidated Financial Statements Years ended June 30, 2021 and 2020 (in thousands of Canadian dollars except as otherwise noted)
Vecima Networks Inc. 2021 Annual Report Page 44
Outlined below are the various performance obligations from contracts with customers and when completed performance obligations are recognized:
Revenue type
Timing of satisfaction of the performance obligation
Product sales:
Hardware products with right-to-use software license When transfer of control has occurred
Provision of services:
After-sales support and maintenance; extended warranty Over the course of the applicable service term
Monthly subscription services As the service is provided over time
Consulting, engineering and installation services When the service is performed
As a practical expedient, the Company does not adjust the contracted amount of consideration for the effects of the financing component when, at the inception of the contract, the expected effect of the financing component is not significant at the individual contract level or the period between the transfer of products or services and the customer’s payment is expected to be within 12 months.
Rental income
Rental income from operating leases of investment properties is accounted for on a straight-line basis over the term of the lease.
(g) Business combinations
Business combinations are accounted for using the acquisition method. Only those acquisitions that result in acquiring control of the entities are accounted for as business combinations. Refer to Note 2(d) for the Company’s determination of the existence of control. The consideration transferred in a business combination is measured at fair value at the date of acquisition. As part of the Company's process for determining the fair value of the acquisition, third-party valuation specialists are engaged. Acquisition related transaction costs are expensed as incurred, and, depending on the nature of the expense, is recorded in either general and administration expense or sales and marketing expense in the consolidated statements of comprehensive (loss) income.
Identifiable assets and liabilities, including intangible assets, of acquired businesses are recorded at their fair values at the date of acquisition. The excess of the purchase consideration over the fair value of identifiable assets acquired is recorded as goodwill in the consolidated statements of financial position. If the fair value of identifiable net assets acquired exceeds the purchase consideration, the difference is recognized in other expense in the consolidated statements of comprehensive (loss) income as a bargain purchase gain.
(h) Inventories
Inventories consist of raw materials, work-in-progress and finished goods. Inventories of raw materials, which consist of parts, components and subscriber equipment, are recorded at the lower of cost and net realizable value, with cost being determined on a first-in, first-out basis. Work-in-progress inventory is recorded at the lower of cost and replacement cost. Finished goods inventory, which consists of finished products, is recorded at the lower of cost and net realizable value.
Manufactured products include direct materials, direct labour and a reasonable allocation of overhead costs. Net realizable value is the estimated selling price in the ordinary course of business, less estimated costs of completion and the estimated cost necessary to make the sale.

VECIMA NETWORKS INC. Notes to the Consolidated Financial Statements Years ended June 30, 2021 and 2020 (in thousands of Canadian dollars except as otherwise noted)
Vecima Networks Inc. 2021 Annual Report Page 45
(i) Property, plant and equipment
Property, plant and equipment are recorded at cost less accumulated depreciation, accumulated impairment losses and related government assistance received. Costs include expenditures that are directly attributable to the acquisition of the asset, including any financing expense for capital investment projects under construction. When significant components of property, plant and equipment are required to be replaced at intervals, the Company recognizes such parts as individual assets with specific useful lives. Depreciation is determined on a declining-balance basis over the estimated useful life of the asset, assuming that no residual value exists. Residual value is the estimated amount that the Company would currently obtain from the disposal of the asset after deducting the estimated costs of disposal, if the asset were already of the age and in the condition expected at the end of its useful life. Both the residual values and the useful lives of property, plant and equipment are reviewed annually. Repairs and maintenance expenditures are charged to operating expenses as incurred.
Property, plant and equipment includes certain investment property held either to earn rental income or for capital or for both, but not for sale in the ordinary course of business, used in the production or supply of goods or services or for administrative purposes. Investment property is carried at cost less accumulated depreciation and accumulated impairment losses. Depreciation policies and the estimated useful lives for the current and comparative periods for investment property are consistent with those described for other property, plant and equipment.
(j) Leases
Lessee accounting
The Company has entered into leases for equipment, land and buildings in the normal course of business. Lease contracts are usually made for fixed periods of time but may include options to purchase, renew or terminate. Leases are usually negotiated on an individual basis and have a wide range of terms and conditions.
At the inception of a contract, it is assessed as to whether the contract is, or contains, a lease. A contract is, or contains, a lease if the contract conveys the right to control the use of an identified asset for a period of time in exchange for consideration. To assess whether a contract conveys the right to control the use of an identified asset, it is assessed as to whether, throughout the period of use, the Company has the right:
• to obtain substantially all of the economic benefits from the use of the identified asset throughout the period of use; and
• to direct the use of the identified asset.
At the commencement date, the Company recognizes a right-of-use asset and a corresponding lease liability. At the commencement date, the right-of-use asset is measured at cost. The cost of the right-of-use asset comprises the following:
• the amount of the initial measurement of the lease liability;
• any lease payments made at or before the commencement date, less any lease incentives received;
• any initial direct costs incurred; and
• an estimate of costs to be incurred in dismantling and removing the underlying asset, restoring the site on which it is located, or restoring the underlying asset to the condition required by the terms and conditions of the lease.
After the commencement date, the right-of-use asset is measured by applying a cost model. The cost model measures the right-of-use asset at cost:
• less any accumulated depreciation and any accumulated impairment losses; and
• adjusted for any re-measurement of the lease liability.

VECIMA NETWORKS INC. Notes to the Consolidated Financial Statements Years ended June 30, 2021 and 2020 (in thousands of Canadian dollars except as otherwise noted)
Vecima Networks Inc. 2021 Annual Report Page 46
Right-of-use assets are depreciated on a straight-line basis over the term of the lease, unless the Company expects to obtain ownership of the leased asset at the end of the lease, in which case, the right-of-use asset is depreciated over its estimated useful life. The lease term typically consists of the non-cancellable period of the lease, together with both:
• the periods covered by options to extend the lease, where the Company is reasonably certain to exercise the option; and
• the periods covered by options to terminate the lease, where the Company is reasonably certain that the option will not be exercised.
At the commencement date, the lease liability is initially measured at the present value of the lease payments that are not paid at that date. The lease payments are discounted using the interest rate implicit in the lease, if that rate can be readily determined. If that rate cannot be readily determined, the Company uses its incremental borrowing rate.
Lease liabilities are subsequently measured at amortized cost using the effective interest method.
The lease liability is re-measured when there is a change in the future lease payments arising from a change in the Company’s estimate of the amount expected to be payable under a residual value guarantee; or when the Company changes its assessment of whether purchase, extension or termination options will be exercised. When the lease liability is re-measured under these circumstances, there will be a corresponding adjustment made to the carrying amount of the right-of-use asset.
When the lease liability is re-measured as a result of an amendment to the lease contract due to a decrease in contract scope, the lease liability and right-of-use asset will decrease relative to this change, with the difference recorded in net income prior to the re-measurement of the lease liability.
As permitted under IFRS 16, lease payments for short-term and leases of low-value assets are expensed over the lease term to the consolidated statements of comprehensive (loss) income.
Lessor accounting
All of the leases in which the Company is the lessor are classified as operating leases. Lease payments received under operating leases are recognized in income on a straight-line basis.
(k) Goodwill
Goodwill is an indefinite-life asset that is acquired as part of business acquisitions and recorded as the excess of the consideration transferred over the fair value of the net identifiable assets acquired. Goodwill is carried at this value less any accumulated impairment losses.
(l) Intangible assets
Intangible assets acquired separately are measured upon initial recognition at cost. Intangible assets acquired through a business acquisition are measured at fair value. Subsequent to initial recognition, intangible assets are carried at cost less any accumulated amortization and accumulated impairment losses. Intangible assets are categorized as either indefinite-life or finite-life assets.
(i) Indefinite-life intangible assets
Indefinite-life intangible assets consist of trademarks and other licenses.
Trademarks and other licenses are recorded at cost, which represents the fair value at the date of acquisition.
Trademarks and other licenses are granted for a period of ten years. There is the option of renewal at a nominal cost to the Company. It is expected that the demand and use for these licenses will continue to grow in the foreseeable future. As a result, these assets are assessed as having indefinite lives and as such, are not subject to amortization.

VECIMA NETWORKS INC. Notes to the Consolidated Financial Statements Years ended June 30, 2021 and 2020 (in thousands of Canadian dollars except as otherwise noted)
Vecima Networks Inc. 2021 Annual Report Page 47
(ii) Finite-life intangible assets
Customer contracts and relationships acquired in business acquisitions are amortized on a straight-line basis over their estimated useful lives of ten years. Patents and intellectual property are amortized on a straight-line basis over their estimated useful lives ranging from three to seven years.
(m) Government assistance and grants
Government assistance and grants are recognized where there is reasonable assurance that all conditions attached to the assistance or grant will be met and the assistance or grant claimed will be received. The claims are subject to review by the respective agencies before the funding can be released. When the assistance or grant relates to an expense item, it is recognized as income over the period necessary to match the assistance or grant on a systematic basis to the costs that it is intended to compensate. Where the assistance or grant relates to an asset, the assistance or grant reduces the carrying amount of the asset. The grant is then recognized as income over the useful life of the depreciable asset through a reduced depreciation charge.
(n) Research and development
Research costs are expensed in the year in which they are incurred. Development costs are capitalized and deferred as finite-life intangible assets when the Company can demonstrate:
• technical feasibility of completing the development so that it will be available for use or sale;
• its intention to complete and its ability to use or sell the asset;
• how the asset will generate future economic benefits;
• the availability of resources to complete the asset;
• the ability to reliably measure the expenditure during development; and
• its ability to use or sell the intangible asset.
Deferred development costs are amortized on a straight-line basis over their useful lives, representing the Company's assessment of the estimated average life cycle of the associated products.
The Company develops new electronic communications products for the cable and telecommunication markets. Development costs include direct salaries, materials and an allocation of general and administrative overhead, which relate to products being developed, less applicable government assistance and investment tax credits claimed.
Costs relating to projects which are not commercialized, or which cease to be marketable are charged against income in the year in which this determination is made.
The Company earns investment tax credits on eligible Scientific Research and Experimental Development ("SR&ED") expenses incurred. These investment tax credits are recorded in the accounts as a reduction of the costs to which they relate and are amortized over the same period as the deferred development costs.
(o) Borrowing costs
Borrowing costs directly attributable to the acquisition, construction or production of qualifying assets that takes a substantial period of time to get ready for its intended use or sale are capitalized as part of the cost of the respective assets. Borrowing costs consist of interest and other costs that an entity incurs in connection with the borrowing of funds.
To the extent the funds are borrowed specifically for the purpose of obtaining qualifying assets, the Company capitalizes the actual borrowing costs incurred on those funds during the period. To the extent the funds are from general borrowings, the Company determines borrowing costs eligible for capitalization by applying a capitalization rate to the expenditure on that asset.
All other borrowing costs are recognized in net income in the period in which they are incurred.

VECIMA NETWORKS INC. Notes to the Consolidated Financial Statements Years ended June 30, 2021 and 2020 (in thousands of Canadian dollars except as otherwise noted)
Vecima Networks Inc. 2021 Annual Report Page 48
(p) Impairment
The Company reviews, at each reporting date, whether there are any indications that an asset may be impaired. If any indication exists, or when annual impairment testing for an asset is required, the Company estimates the asset's recoverable amount, which is the higher of the fair value less cost of disposal and its value-in-use. Value-in-use is the estimated future cash flows discounted to their present value using a discount rate that reflects current market assessments of the time value of money and the risks specific to the asset. Impairment is recognized when the carrying amount of an asset or cash-generating unit (CGU) is greater than the recoverable amount. Impairment losses are recognized in the period in which it occurs in the expense categories consistent with the function of the impaired asset.
Indefinite-life intangible assets are tested for impairment in the fourth quarter of every year and when events or changes in circumstances indicate that an asset might be impaired.
Finite-life intangible assets are assessed for impairment indicators at each reporting date. In addition, intangible assets with a finite-life, which are not yet available for use, such as deferred development costs for products still under development, are tested for impairment at least annually.
Goodwill, representing the excess of the purchase price over fair value of the net identifiable assets of acquired businesses, is tested for impairment annually or more frequently when an event or circumstance occurs that indicates that goodwill might be impaired. Impairment is determined for goodwill by assessing the recoverable amount of each CGU to which the goodwill relates. Where the recoverable amount of the CGU is less than its carrying amount an impairment loss is recognized. Impairment losses relating to goodwill cannot be reversed in future periods.
For assets other than goodwill, an assessment is made at each reporting date as to whether there is any indication that previously recognized impairment losses may no longer exist or may have decreased. If such indications exist, the Company estimates the asset's recoverable amount. A previously recognized impairment loss is reversed only if there has been a change in the assumptions used to determine the asset's recoverable amount since the last impairment loss was recognized. Reversals are recognized in the period in which it occurs in the expense categories consistent with the function of the asset.
When the Company determines that an asset meets the assets held for sale criteria, the assets are reported at the lower of the carrying amount or fair value less the cost of disposal.
(q) Income taxes
The Company follows the liability method of accounting for income taxes. Under this method, current income taxes are recognized for the estimated income taxes payable for the current year. Deferred income tax assets and liabilities are recognized for temporary differences between the tax and accounting bases of assets and liabilities, as well as for the benefit of losses and investment tax credits available to be carried forward to future years, for tax purposes, that are more likely than not to be realized. The amounts recognized in respect of deferred income tax assets and liabilities are based upon the expected timing of the reversal of temporary differences or usage of tax losses and the application of substantively enacted tax rates at the time of reversal or usage.
The Company accounts for changes in substantively enacted tax rates affecting deferred income tax assets and liabilities, in full, in the period in which the changes were substantively enacted. The Company accounts for the changes in the estimates of prior year(s) tax balances as estimate revisions in the period in which the change in estimate arose. The Company has selected these methods as the presentation on the statements of financial position since it is more consistent with the liability method of accounting for income taxes.
The Company incurs research and development expenditures that are eligible for investment tax credits. The recorded investment tax credits are based on management's estimates of amounts expected to be recovered and are subject to audit by taxation authorities. The investment tax credits for research and development are reflected as a reduction in the cost of the assets or expenses to which it relates.

VECIMA NETWORKS INC. Notes to the Consolidated Financial Statements Years ended June 30, 2021 and 2020 (in thousands of Canadian dollars except as otherwise noted)
Vecima Networks Inc. 2021 Annual Report Page 49
(r) Foreign Currency Translation
Functional and presentation currency
The Company’s consolidated financial statements are presented in Canadian dollars, which is also the parent entity’s functional currency. Each subsidiary of the Company determines its own functional currency and items included in the financial statements of each subsidiary are measured using the functional currency of the parent entity.
Transactions that are denominated in foreign currencies are initially recorded at the rate in effect at the date of the transaction. Monetary assets and liabilities denominated in foreign currencies are translated at the functional currency closing exchange rate at the reporting date. Non-monetary assets and liabilities measured at cost are translated using the historical exchange rate. Non-monetary items measured at fair value are translated using the exchange rates at the date when the fair value was determined. Revenues and expenses are translated using average rates for the period, except for amortization, which is translated on the same basis as the related asset. Exchange gains and losses are reflected in net income.
Foreign operations
The assets and liabilities of foreign operations, including goodwill and fair value adjustments arising on acquisition, are translated to Canadian dollars at exchange rates at the reporting date. The revenue and expenses of foreign operations are translated to Canadian dollars at exchange rates at the date of the transaction.
Foreign currency differences are recognized in other comprehensive income. When a foreign operation is disposed of, in whole, the relevant amount in the foreign currency translation account is transferred to earnings as part of the gain or loss on disposal.
(s) Financial instruments
Financial assets are classified and measured based on three categories: amortized cost, fair value through other comprehensive income (“FVOCI”), and fair value through profit and loss (“FVTPL”).
Cash and cash equivalents, and trade and other receivables are measured at amortized cost. The carrying amount reported in the consolidated statements of financial position is at historical cost, which approximates their fair value due to the short-term maturity of these instruments.
Short-term investments are classified as FVTPL; presented in the consolidated statements of financial position under current assets; recorded at fair value on the date of acquisition, including related transaction costs; and adjusted to fair value at each reporting date. The corresponding unrealized gains and losses are recorded in profit or loss in the consolidated statements of comprehensive (loss) income.
Financial liabilities are classified and measured based on two categories: amortized cost and FVTPL.
Trade payable and accrued liabilities, and long-term debt are the Company’s financial liabilities and are measured and recorded at amortized cost.
The Company uses derivative financial instruments to manage risks from fluctuations in exchange rates. The most frequently used derivative products are foreign currency forward purchase contracts. We do not use derivative financial instruments for speculative or trading purposes. Derivative financial instruments are recognized in the consolidated statements of financial position at their fair value, with changes in fair value recorded in the consolidated statements of comprehensive (loss) income in foreign exchange (loss) gain.
We measure the allowance for doubtful accounts and impairment of contract assets based on an expected credit loss (ECL) model, which takes into account current economic conditions, historical information, and forward-looking information. We use the simplified approach for measuring losses based on the lifetime ECL for trade and other receivables and contract assets. Amounts considered uncollectible are written off and recognized in operating expenses in the consolidated statements of comprehensive (loss) income.

VECIMA NETWORKS INC. Notes to the Consolidated Financial Statements Years ended June 30, 2021 and 2020 (in thousands of Canadian dollars except as otherwise noted)
Vecima Networks Inc. 2021 Annual Report Page 50
The cost of issuing debt is included as part of long-term debt and is accounted for at amortized cost using the effective interest method. The cost of issuing equity is reflected in the consolidated statements of changes in equity as a charge to the retained earnings.
(t) Fair value of financial instruments
The fair value of financial instruments is generally determined as follows:
The fair value of long-term debt with fixed rates of interest is estimated using discounted cash flows based on current rates of interest for similar lending arrangements.
The fair values of derivatives are based on values quoted by the counterparties to the agreements.
The fair value of short-term financial assets and liabilities approximate their respective carrying values due to the short-term nature of these financial instruments.
(u) Provisions
Provisions are recorded when the Company has a present legal or constructive obligation as a result of a past event, when it is probable that an outflow of resources will be required to settle the obligation and when a reliable estimate of the amount of the obligation can be made. Where the Company expects some or all of a provision to be reimbursed, the reimbursement is recognized as a separate asset when the reimbursement is virtually certain.
The warranty provision consists of estimated parts and labour costs expected to be incurred for future product repairs provided under the Company's warranty obligations. The provisions are recorded when the product is sold and are based on contract terms, current sales levels and current information about prior claims and returns for all products sold. As a consequence of continuously incorporating complex technologies to new products, changes in these estimates could result in additional allowances or changes to recorded allowances in future periods.
(v) Net (loss) income per share
Basic net (loss) income per share is calculated by dividing net (loss) income for the period attributable to common shareholders of the Company by the weighted average number of common shares outstanding during the period. Diluted net (loss) income per share is calculated by using the treasury stock method for equity-based compensation. The diluted weighted average number of common shares outstanding is calculated by taking into account the dilution that would occur if the securities or other agreements for the issuance of common shares were exercised or converted into common shares at the later of the beginning of the period or the issuance date unless it is anti-dilutive. The treasury stock method is used to determine the dilutive effect of stock options. The treasury stock method recognizes the use of proceeds that could be obtained upon the exercise of options in computing diluted net (loss) income per share. It assumes that any proceeds would be used to purchase common shares at the average market price during the period. Only the Company's stock options have a dilutive potential on common shares.
(w) Share-based compensation
Stock options
The Company has a stock option plan for directors, officers, and employees of the Company. The options to purchase shares must be issued at not less than the fair value at the date of grant. Any consideration paid on the exercise of stock options, together with any share capital reserves recorded at the date the options vested, is credited to share capital. The Company calculates the fair value of share-based compensation awarded to offerees using the Black-Scholes option-pricing model. The cost of the options granted is recognized and expensed over the vesting period in which service conditions are fulfilled. When an offeree leaves the Company, their vested options expire in 90 days. Forfeitures are estimated throughout the vesting period based on past experience and future expectations and adjusted upon actual option vesting. No expense is recognized for options that do not ultimately vest.

VECIMA NETWORKS INC. Notes to the Consolidated Financial Statements Years ended June 30, 2021 and 2020 (in thousands of Canadian dollars except as otherwise noted)
Vecima Networks Inc. 2021 Annual Report Page 51
Performance Share Units (PSUs)
The Company has a performance share unit (“PSU”) plan which provides that PSUs may be granted to officers, employees and directors of the Company. Each PSU contains three tranches, each of which vest upon the achievement of certain closing market trading prices of the Company’s common shares for a period of twenty consecutive business days. Each PSU entitles the holder to acquire one common share of the Company when vested.
The Company calculates the fair value of the PSUs by performing a Monte Carlo simulation approach over the term of the PSUs. On the grant date, the Company estimates the estimated achievement date of each market condition. The cost of the PSUs granted is then recognized and expensed straight-line over a time frame calculated as the period from the grant date until the expected market condition achievement date. Forfeitures are estimated on grant based on past experience and future expectations, and the amount recognized in expense is adjusted upon vesting.
The PSU plan contains a net settlement feature by which the Company may withhold a number of common shares that, based on the publicly traded market price on the date of vest, have an aggregate value equal to the withholding taxes that would have been required to be withheld had the full amount of vested PSUs been issued in common shares. On issuance, the transaction is accounted for as though the entire amount of vested PSUs had been granted in common shares, and the Company subsequently re-purchased the withheld common shares at a market price.
(x) Treasury shares
Equity instruments which are reacquired (treasury shares) are recognized at cost and deducted from equity. No gain or loss is recognized in income on the purchase, sale, issue or cancellation of the Company’s own equity instruments. Any difference between the carrying amount and the consideration paid is recognized within shareholders' equity. Treasury shares are immediately cancelled upon acquisition.
(y) Adoption of new accounting standards and amendments to accounting standards
IAS 1 – Presentation of financial statements (IAS1); and IAS 8 – Accounting policies, changes in accounting estimates and errors (IAS 8)
Effective July 1, 2020, the Company adopted IAS 1 and IAS 8, which was amended to clarify the definition of “material” and how it should be applied. The amendments also improve the explanation of the definition and ensure consistency across all IFRS standards. The new definition states that information is material if omitting, misstating or obscuring it could reasonably be expected to influence decisions that the primary users of general purpose financial statements make on the basis of those financial statements. The adoption of this amendment did not have a material effect on our financial statements.
IFRS 3 – Business combinations (IFRS 3)
In October 2018, the IASB issued an amendment to IFRS 3. The amendment clarifies the definition of a business and assists entities to determine whether an acquisition is a business combination or an acquisition of a group of assets. The amendment emphasizes that the output of a business is to provide goods and services to customers and also to provide supplementary guidance. The amendment to IFRS 3 may affect whether the future acquisitions are accounted for as a business combination or asset acquisition, along with the resulting allocation of the purchase price between the identifiable assets acquired and goodwill. These amendments did not have any impact on our financial statements. However, they may affect whether future acquisitions are accounted for as a business combination or asset acquisition, depending on the facts and circumstances of any future acquisition transactions.
VECIMA NETWORKS INC. Notes to the Consolidated Financial Statements Years ended June 30, 2021 and 2020 (in thousands of Canadian dollars except as otherwise noted)
Vecima Networks Inc. 2021 Annual Report Page 52
Amendment to IFRS 16 – Leases (IFRS 16)
On May 28, 2020, the IASB published Covid-19-Related Rent Concessions (Amendments to IFRS 16), amending the standard to provide lessees with an exemption from assessing whether a COVID-19-related rent concession is a lease modification. We did not adopt the option relief provided in this amendment.
IFRS 9 – Financial instruments (IAS 9); IAS 39 – Financial instruments: recognition and measurement (IAS 39); and IFRS 7 – Financial instruments: disclosures (IFRS 7)
Amendments to these accounting standards provides temporary, but mandatory, relief from specific hedge accounting requirements to address potential effects of the uncertainty in the lead up to interbank offer rates reform (IBOR reform). The adoption of this amendment did not have a material effect on our financial statements.
(z) Accounting standards issued but not yet applied
The following new or amended standards and interpretations issued by the IASB are effective after the Company’s June 30, 2021 year-end date and have not yet been adopted by the Company:
Amendments to IAS 1 – Presentation of financial statements (IAS 1)
On January 23, 2020, the IASB issued amendments to IAS 1 in respect of the classification of liabilities as current or non-current. The amendments aim to promote consistency in applying the requirements by helping entities determine whether, in the statement of financial position, debt and other liabilities with an uncertain settlement date should be classified as current (due or potentially due to be settled within one year) or non-current. The amendments become effective for annual reporting periods beginning on or after January 1, 2023.
Amendments to IAS 16 – Property, plant and equipment – proceeds before intended use
On May 14, 2020, the IASB issued amendments to IAS16, which prohibits deducting from the cost of an item of property, plant and equipment, any proceeds from selling items produced while bringing that asset to the location and condition necessary for it to be capable of operating in the manner intended by management. Instead, an entity recognizes the proceeds from selling such items, and the cost of producing those items, in profit or loss. The amendments become effective for annual reporting periods beginning on or after January 1, 2022.
IFRS 17 – Insurance contracts (IFRS 17)
IFRS 17 is a new standard that replaces IFRS 4 – Insurance contracts. IFRS 17 aims to provide consistency and transparency in the application of accounting for insurance contracts. This standard becomes effective for annual reporting periods beginning on or after January 1, 2023.
Amendments to IAS 37 – Provisions (IAS 37)
On May 14, 2020 the IASB issued Onerous Contracts – Cost of Fulfilling a Contract (Amendments to IAS 37), amending the standard regarding costs a company should include as the cost of fulfilling a contract when assessing whether a contract is onerous. These amendments are effective for annual reporting periods beginning on or after January 1, 2022, with early application permitted.
We do not expect IFRS 17 will have an effect on our consolidated financial statements. We are assessing the impacts, if any, the remaining standards or amendments will have on our consolidated financial statements.
3. USE OF JUDGMENTS AND ESTIMATES
The preparation of the Company's consolidated financial statements, in conformity with IFRS, requires management to make judgments, estimates and assumptions that affect the reported amounts of assets and liabilities at the date of the financial statements and the reported amounts of revenues and expenses during the reporting period. Uncertainty about these assumptions and estimates could result in outcomes that require material adjustments in future periods to the carrying amount of the affected asset or liability.

VECIMA NETWORKS INC. Notes to the Consolidated Financial Statements Years ended June 30, 2021 and 2020 (in thousands of Canadian dollars except as otherwise noted)
Vecima Networks Inc. 2021 Annual Report Page 53
(a) Use of judgments
Functional currency
The Company assesses the primary economic environment in which we operate by considering factors such as the currency for which sales of goods and services are denominated and settled, the country whose competitive forces and regulations mainly determine the sales prices of its goods and services and the currency that mainly influences labour, material and other costs of providing goods and services.
Sales by Vecima Networks Inc., and Vecima Networks (USA) Inc. are primarily transacted in U.S. dollars ("USD"). The cost of materials is denominated in both Canadian and U.S. dollars. The labour cost is denominated fully in Canadian dollars. Management pays close attention to gross margin, and the setting of prices in USD is influenced by costs which are primarily influenced by the Canadian dollar. Due to the mix of indicators for its primary economic environment, the Company assesses the secondary indicators of finance activities and receipts from operations. Equity and debt financing activities are both denominated in Canadian dollars and receipts from operations are retained primarily in Canadian dollars. Based on all these factors, the Company determined that the functional currency for the entities listed above is the Canadian dollar.
Sales by Vecima Technology Inc. (a subsidiary of the Company) are primarily transacted in USD. The cost of materials is denominated in USD. The labour cost is denominated fully in USD. Equity and debt financing activities are both denominated in USD and receipts from operations are retained primarily in USD. Based on all these factors, the Company determined that the functional currency for Vecima Technology Inc. is USD.
Sales by Concurrent Content Solutions Corporation (a subsidiary of the Company) are primarily transacted in Japanese Yen. The cost of materials is denominated in Japanese Yen; however, certain purchases of inventory are made in USD. The labour cost is denominated fully in Japanese Yen. Equity and intercompany financing activities are denominated in both Japanese Yen and USD and receipts from operations are retained in Japanese Yen. Based on all these factors, the Company determined that the functional currency for Concurrent Content Solutions Corporation is the Japanese Yen.
Sales by Vecima Technology (UK) Ltd. (a subsidiary of the Company) are primarily transacted in Great British Pounds (GBP). The cost of materials is denominated in GBP. The labour cost is denominated fully in GBP. Equity and intercompany financing activities are denominated in either GBP or USD and receipts from operations are retained primarily in GBP. Based on all these factors, the Company determined that the functional currency for Vecima Technology (UK) Ltd. is GBP.
Sales by Vecima Technology B.V. (a subsidiary of the Company) are primarily transacted in Euro. The cost of materials is denominated in Euro. The labour costs is denominated fully in Euro. While equity transactions are denominated in Canadian dollars, intercompany financing activities and receipts from operations are denominated in Euro. Based on all these factors, the Company determined that the functional currency for Vecima Technology B.V. is Euro.
Sales by Vecima Technology (Qingdao) Co., Ltd. and Vecima Technology (Shanghai) Co., Ltd., (subsidiaries of the Company) are transacted in Renminbi (“RMB”). The cost of materials and labour costs are denominated in RMB. Equity and debt financing activities are both denominated in RMB and receipts from operations are retained in RMB. Based on all of these factors, the Company determined that the functional currency for Vecima Technology (Qingdao) Co., Ltd. and Vecima Technology (Shanghai) Co., Ltd. is RMB.
VECIMA NETWORKS INC. Notes to the Consolidated Financial Statements Years ended June 30, 2021 and 2020 (in thousands of Canadian dollars except as otherwise noted)
Vecima Networks Inc. 2021 Annual Report Page 54
Revenue from contracts with customers and deferred revenue
Significant judgment may be required in determining the distinct performance obligations within a contract and the allocation of transaction price to multiple element performance obligations. When multiple performance obligations are identified in a contract, the transaction price is allocated based on the stand-alone selling price for each. If the stand-alone selling price is not observable, the Company estimates the stand-alone selling price for each distinct performance obligation based on a related cost plus margin, taking into account reasonably available information relating to the market conditions, entity-specific factors, and the class of customer.
Deferred revenue consists of service contracts and upfront customer activation and connection fees where billings are recorded and received prior to the rendering of the associated service. Deferred revenue may be impacted by the allocation of the transaction price where a component of the contract includes such services. Billings for services are recognized as revenue in the period in which the services are provided. Upfront customer activation and connection fees are recognized over the expected term of the customer relationship.
Deferred development costs
Development costs are capitalized in accordance with the accounting policy in Note 2(n). Capitalization of costs is initiated based on management's judgment that technological and economic feasibility is confirmed, usually when the research project is approved to begin development. In assessing whether these costs are impaired, management makes assumptions regarding the expected future cash flows from the project, discount rates to be applied and the expected periods of benefit.
Income taxes
We make certain judgments in interpreting tax rules and regulations when we compute income tax expense; and when we evaluate whether a deferred tax asset can be recovered based on an assessment of existing tax laws, estimates of future profitability and tax planning strategies.
Leases
Judgments used in determining the right-of-use assets and lease liabilities include:
• Identifying or determining if a contract is or contains an identified asset – the identified asset should be physically distinct or represent all or substantially all of the capacity of the asset, and should provide the right to all or substantially all of the economic benefits from the use of the identified asset;
• determining which interest rate to use in measuring the present value of the lease liability for each lease – the incremental borrowing rate should reflect the interest that would have to be paid to borrow at a similar term and with similar security; and
• determining, with reasonable certainty, whether the Company will exercise an option to extend or an option not to terminate a lease contract – this will be based on an assessment of the expected economic return from the lease.
(b) Use of estimates
Impairment of non-financial assets
Impairment exists when the carrying value of a tangible asset, intangible asset or cash-generating unit, including goodwill, exceeds its recoverable amount, which is the higher of its fair value less cost of disposal and its value-in-use. The value-in-use calculation is based on a discounted cash flow model, where the cash flow is derived from the budget extrapolated over the next three to five years, exclusive of restructuring activities or significant future investments to enhance the asset's performance. The recoverable amount is most sensitive to the discount rate used as well as the expected future cash inflows and growth rate used to extrapolate beyond the three to five years.
VECIMA NETWORKS INC. Notes to the Consolidated Financial Statements Years ended June 30, 2021 and 2020 (in thousands of Canadian dollars except as otherwise noted)
Vecima Networks Inc. 2021 Annual Report Page 55
Share-based compensation
The Company measures the cost of share-based compensation transactions with reference to the fair value of the options issued at the date they were granted. Estimated fair value for share-based compensation transactions requires the determination of the most appropriate valuation model, which is dependent on the terms and conditions of the grant. This estimate also requires the determination of the most appropriate inputs to the valuation model including the expected life of the share option and the volatility. The assumptions and models used for estimating fair value for share-based compensation are disclosed in Note 21(d).
Income taxes
The amounts of deferred tax assets and liabilities are estimated with consideration given to the timing, source and amounts of future taxable income together with tax planning strategies.
Allocation of purchase consideration to acquired assets and assumed liabilities
The Company allocates the purchase price of an acquisition to the tangible and intangible assets acquired and liabilities assumed as of the business combination date in accordance with IFRS 3. The purchase price allocation process requires the Company to use significant estimates and assumptions, including fair value estimates, as of the acquisition date.
Leases
The Company estimates the lease term by considering the facts and circumstances that creates an economic incentive to exercise an extension option, or not exercise a termination option. Certain qualitative and quantitative assumptions are made when determining the value of the economic incentives.
Other areas
Other key areas of estimation where management is required to make subjective estimates, often as a result of matters that are inherently uncertain, include:
• the assessment of the carrying values of allowances for doubtful accounts and inventory obsolescence;
• the capitalization of overhead;
• the useful lives of property, plant and equipment; and the useful lives of intangible assets;
• provisions, contingent liabilities and the fair value of financial assets; and
• the future effects of the COVID-19 pandemic.
4. DISCONTINUED OPERATIONS
On March 31, 2021, the Company completed the sale of its ContentAgent operations in an all-cash transaction for proceeds of $2,586 (US$2,100). The Company reclassified amounts related to the sale for the previous year to discontinued operations in our consolidated statements of comprehensive (loss) income and consolidated statements of cash flows to make them consistent with the presentation for the current year. Effective March 31, 2021, property, plant and equipment and intangible assets that were sold were no longer depreciated or amortized.
As at March 31, 2021, the Company recorded a gain on the sale, net of income taxes, of $1,836. The capital gain related to the sale is partially offset by the recognition of previously unrecognized loss carry forwards.

VECIMA NETWORKS INC. Notes to the Consolidated Financial Statements Years ended June 30, 2021 and 2020 (in thousands of Canadian dollars except as otherwise noted)
Vecima Networks Inc. 2021 Annual Report Page 56
The following table summarizes the carrying value of the assets and liabilities sold:
2021
Accounts receivable $ 272 Prepaid expenses and other current assets 49 Property, plant and equipment 29 Right-of-use assets 114 Goodwill 235 Intangible assets 947 Other non-current assets 82
Total assets sold $ 1,728
Accounts payable and accrued liabilities $ 267 Deferred revenue 830 Long-term debt 98
Total liabilities sold $ 1,195
Net assets sold $ 533
The following tables summarizes the statements of comprehensive income (loss) and statements of cash flows of our discontinued operations up to the point of sale:
For the years ended June 30, 2021 2020
Sales $ 1,831 $ 1,533 Cost of sales 575 507
Gross profit 1,256 1,026
Operating expenses Research and development 346 578 Sales and marketing 639 743 General and administrative 231 411
Total operating expenses 1,216 1,732
Operating income (loss) 40 (706) Finance expense (4) (3) Foreign exchange (loss) gain (12) 13
Income (loss) before income taxes 24 (696) Income tax expense 6 -
Net income (loss) before gain on sale 18 (696)
Gain on sale (net of taxes of $217) 1,836 -
Net income (loss) $ 1,854 $ (696)
Years ended June 30, 2021 2020
Cash flows from operating activities $ 651 $ (96) Cash flows from investing activities 2,323 (321) Cash flows from financing activities (64) (47)
Net increase (decrease) in cash $ 2,910 $ (464)
5. BUSINESS COMBINATION
On August 7, 2020, the Company completed the purchase of the Data Over Cable Service Interface Specification (“DOCSIS”) Distributed Access Architecture (“DAA”) and Ethernet Passive Optical Network/DOCSIS Provisioning of EPON (“EPON/DPoE”) cable access technology portfolios (the “Nokia portfolio acquisition” or “portfolio”) from Nokia Corporation. The purchase of the business included inventory, property, plant and equipment, and intangible assets.

VECIMA NETWORKS INC. Notes to the Consolidated Financial Statements Years ended June 30, 2021 and 2020 (in thousands of Canadian dollars except as otherwise noted)
Vecima Networks Inc. 2021 Annual Report Page 57
The portfolio includes a centrally controlled DAA solution for unified support for Flexible Medium Access Control (“MAC”) DAA nodes for Hybrid Fiber Coaxial (“FHC”) networks and DPoE nodes for fiber-to-the-home and business. The portfolio also includes a DAA video engine, and a chassis-based EPON/DPoE solution for non-HFC network implementations. The Nokia employees that supported these products have transitioned to the Company, but remain located in Raleigh, North Carolina; Sunnyvale, California; Qingdao, China; and Shanghai, China. The portfolio was the primary reason for the acquisition of the business.
The acquisition, valued at $5,871 (US$4,390), including a post-closing net working capital adjustment, was financed through the Company’s cash and short-term investment reserves.
The following table summarizes the fair value allocations of assets acquired and liabilities assumed as part of the Nokia portfolio acquisition:
Note
Amount
Consideration paid: Purchase price $ 6,401 Working capital adjustments (530)
$ 5,871
Net assets acquired:
Accounts receivable $ 232 Inventory 3,462 Property, plant and equipment 10 2,980 Intangible assets 13 505 Goodwill 12 130 Accounts payable and accrued liabilities (246) Deferred revenue 22(c) (78) Provisions 19 (1,114)
$ 5,871
Accounts receivable includes goods and services tax that are fully recoverable.
The goodwill recognized is attributable to intangible assets that do not qualify for separate recognition and includes, amongst other things: expected synergies arising from the combination of the Nokia portfolio acquisition and the Company’s existing business; expected growth in the underlying markets in which the portfolio serves; and the strength of the assembled workforce. The goodwill arising from the acquisition is not deductible for tax purposes.
Transaction costs related to the Nokia portfolio acquisition was $554 and are included in operating costs in the consolidated statements of comprehensive (loss) income.
Sales and net income attributable to the Nokia portfolio acquisition for the year ended June 30, 2021 are $19,723 and $1,246, respectively.
Had the business combination been effective July 1, 2020, the consolidated sales of the Company would have been $21,948 and the net income would have been $1,387. Management considers these "pro-forma" numbers as a reasonable approximate measure of the performance of the combined group and to provide a reference point for comparison in future periods. In determining these amounts, management has assumed that the fair value adjustments, which arose on the acquisition date would have been the same, in all material respects, if the acquisition had occurred on July 1, 2020.
6. CASH AND CASH EQUIVALENTS
Years ended June 30, 2021 2020
Cash $ 15,735 $ 2,128 Short-term deposits 13,174 15,222
$ 28,909 $ 17,350
VECIMA NETWORKS INC. Notes to the Consolidated Financial Statements Years ended June 30, 2021 and 2020 (in thousands of Canadian dollars except as otherwise noted)
Vecima Networks Inc. 2021 Annual Report Page 58
7. SHORT-TERM INVESTMENTS
Short-term investments are measured at fair value and changes are reported through the consolidated statements of comprehensive (loss) income. The fair value of the short-term investments were equal to their carrying value for the year ended June 30, 2020. Short-term investments consist of guaranteed investment certificates and marketable equity securities. For the year ended June 30, 2021, the Company did not have any short-term investments.
8. ACCOUNTS RECEIVABLE
Years ended June 30, Note 2021 2020
Trade receivables $ 26,677 $ 23,840 Less: allowance for doubtful accounts (16) (97)
26,661 23,743 Goods and services tax 145 351 Government grants receivable 14 1,949 691 Foreign exchange contracts - 101 Other receivables 29 22
$ 28,784 $ 24,908
All trade receivables are short-term. The net carrying value of trade receivables is considered a reasonable approximation of fair value due to the short-term nature of the receivables.
The government grant receivable for the year ended June 30, 2021 includes a research and development tax credit from the State of Georgia in the amount of $715 (June 30, 2020 - $689) and an employee retention credit from a U.S. federal government CARES Act program in the amount of $1,234 (June 30, 2020 - $nil). Refer to Note 14 - Government Grants for further details.
Included in trade receivables is the allowance for doubtful accounts used to record the impairment of the receivable prior to being written off. The details of the allowance for doubtful accounts is in the table below:
Balance, July 1, 2019 $ 58 Charge 54 Write-offs (15)
Balance, June 30, 2020 97 Reverse allowance (79) Effect of foreign exchange (2)
Balance, June 30, 2021 $ 16
9. INVENTORIES
Years ended June 30, 2021 2020
Raw materials $ 6,366 $ 7,047
Work-in-progress 730 3,802
Finished goods 8,482 6,363
$ 15,578 $ 17,212
During the year ended June 30, 2021, inventories of $49,280 (year ended June 30, 2020 - $30,413) were expensed through cost of sales. Writedowns of inventory that were included in the cost of sales for the year ended June 30, 2021 were $714 (year ended June 30, 2020 - $745). Writedowns of inventory that were included in sales and marketing for the year ended June 30, 2021 were $149 (year ended June 30, 2020 - $320). Reversals of writedowns were $526 during the year ended June 30, 2021 (year ended June 30, 2020 - $173). For the year ended June 30, 2021, the carrying amount of inventory recorded at net realizable value was $524 (year ended June 30, 2020 - $885) with the remaining inventory recorded at cost.

VECIMA NETWORKS INC. Notes to the Consolidated Financial Statements Years ended June 30, 2021 and 2020 (in thousands of Canadian dollars except as otherwise noted)
Vecima Networks Inc. 2021 Annual Report Page 59
10. PROPERTY, PLANT AND EQUIPMENT
Note Land
Land improvements
& building
Lab, operating & production equipment
Other equipment(1) Total
At cost
At July 1, 2019 $ 621 $ 9,427 $ 18,548 $ 11,375 $ 39,971 Additions - 38 1,249 846 2,133 Disposals (285) (391) (491) (146) (1,313) Effect of foreign exchange - 34 34 126 194
At June 30, 2020 336 9,108 19,340 12,201 40,985 Additions 1 140 1,447 568 2,156 Disposals (16) (52) (309) (52) (429) Business acquisition 5 - - 2,980 - 2,980 Effect of foreign exchange - (78) (591) (141) (810)
At June 30, 2021 $ 321 $ 9,118 $ 22,867 $ 12,576 $ 44,882
Accumulated depreciation and amortization
At July 1, 2019 $ - $ 3,159 $ 14,167 $ 10,119 $ 27,445 Depreciation - 312 1,370 515 2,197 Disposals - (145) (287) (107) (539) Effect of foreign exchange - 3 12 66 81
At June 30, 2020 - 3,329 15,262 10,593 29,184 Depreciation - 304 1,562 490 2,356 Disposals - (32) (190) (31) (253) Effect of foreign exchange - (26) (178) (55) (259)
At June 30, 2021 $ - $ 3,575 $ 16,456 $ 10,997 $ 31,028
Net book value At June 30, 2020 $ 336 $ 5,779 $ 4,078 $ 1,608 $ 11,801
At June 30, 2021 $ 321 $ 5,543 $ 6,411 $ 1,579 $ 13,854 (1) Other equipment includes furniture, computer hardware, and automotive equipment.
Included in the depreciation of property, plant and equipment is $10 from discontinued operations (June 30, 2020 - $15).
Additions for the year ended June 30, 2021 were $2,156 (June 30, 2020 - $2,133), of which $2,156 was acquired for cash consideration (June 30, 2020 - $2,133).
The following estimated useful lives have been applied to property, plant and equipment assets at June 30,
2021 and June 30, 2020:
Estimated useful life
Land improvements and building 5 to 40 years Lab, operating and production equipment 3 to 7 years Other equipment(1) 1 to 5 years (1) Other equipment includes furniture, computer hardware, and automotive equipment.
Depreciation of property, plant and equipment from continuing operations included in cost of sales, research
and development, sales and marketing, and general and administrative expenses is as follows:
Years ended June 30, 2021 2020
Cost of sales $ 540 $ 304 Research and development 754 548 Sales and marketing 907 306 General and administrative 145 1,024
Depreciation for the year $ 2,346 $ 2,182

VECIMA NETWORKS INC. Notes to the Consolidated Financial Statements Years ended June 30, 2021 and 2020 (in thousands of Canadian dollars except as otherwise noted)
Vecima Networks Inc. 2021 Annual Report Page 60
There were no impairment losses or recoveries during the years ended June 30, 2021 or 2020.
Property, plant and equipment classified as investment properties under IAS 40, include land and land improvements, and buildings. Collectively, the investment properties' fair value exceeds their gross carrying amount. Investment properties include land with a gross carrying amount of $nil (June 30, 2020 - $16). Investment properties' improvements and buildings had a gross carrying amount of $nil and accumulated depreciation of $nil as at June 30, 2021 ($47 and $24 respectively, as at June 30, 2020). For the year ended June 30, 2021, income earned from the investment properties was $19 with direct expenses of $7 (June 30, 2020 - $52 and $52, respectively). On April 30, 2021, the Company sold its last investment property to a third party for $243. It had a carrying value of $36 at the time of sale.
11. RIGHT-OF-USE ASSETS
For the years ended June 30, 2021 and 2020, the Company’s right-of-use assets solely comprised of real estate leases. The table below provides details of the Company’s right-of-use assets:
Total
At cost
At July 1, 2019 $ 5,109 Additions 200 Dispositions, retirements, other - Effect of foreign exchange 114
At June 30, 2020 5,423 Additions 1,557 Dispositions, retirements, other (192) Effect of foreign exchange (294)
At June 30, 2021 $ 6,494
Accumulated depreciation
At July 1, 2019 $ - Depreciation 1,403 Dispositions, retirements, other - Effect of foreign exchange 10
At June 30, 2020 1,413 Depreciation 1,583 Dispositions, retirements, other (88) Effect of foreign exchange (74)
At June 30, 2021 $ 2,834
Net book value At June 30, 2020 $ 4,010
At June 30, 2021 $ 3,660
Included in the depreciation of right-of-use assets is $60 from discontinued operations (June 30, 2020 - $28).

VECIMA NETWORKS INC. Notes to the Consolidated Financial Statements Years ended June 30, 2021 and 2020 (in thousands of Canadian dollars except as otherwise noted)
Vecima Networks Inc. 2021 Annual Report Page 61
12. GOODWILL
Note
At July 1, 2019 $ 15,131 Business acquisition - Effect of foreign exchange 356
At June 30, 2020 15,487 Business acquisition 5 130 Disposals (235) Effect of foreign exchange (840)
At June 30, 2021 $ 14,542
For the year ended June 30, 2021, goodwill includes $3,148 attributable to brand (June 30, 2020 - $3,470).
Impairment testing of goodwill
For the purposes of impairment testing at the end of the reporting period, the indefinite-life intangible assets and goodwill are allocated to cash generating units (CGUs), which represent the lowest level at which indefinite-life intangible assets are monitored for internal management purposes. The Company's recorded goodwill has a carrying value which consists of $6,111 relating to the Telematics segment, $8,316 relating to the Content Delivery and Storage segment, and $115 relating to the Video and Broadband Solutions segment (June 30, 2020 - $6,111, $9,376, and $nil respectively). The recoverable amount of the segment and the associated CGUs are based on a value-in-use calculation using cash flow projections from financial budgets approved by senior management covering the next fiscal year, extrapolated based on projected growth and achieving key operating objectives for a period of less than five years. There is a material degree of uncertainty with respect to the estimates of the recoverable amount of the cash generating units' assets given the necessity of making key economic assumptions about the future.
The value-in-use calculation uses discounted cash flow projections which employ the following key assumptions: future cash flows and growth projections, including economic risk assumptions and estimates of achieving key operating metrics and drivers; and the weighted average cost of capital. The projected cash flows have been prepared based on management's past experience and expected demand and cost for the products. The pre-tax discount rate applied to cash flow projections reflect the current market assessment of risk and was based on an estimate of weighted average cost of capital taking into account assessments by third party experts. The pre-tax discount rates used in our testing of the CGU's ranged between 14.3% and 18.3%. As a result of this analysis, management has not identified any impairment for the Company's CGU's.

VECIMA NETWORKS INC. Notes to the Consolidated Financial Statements Years ended June 30, 2021 and 2020 (in thousands of Canadian dollars except as otherwise noted)
Vecima Networks Inc. 2021 Annual Report Page 62
13. INTANGIBLE ASSETS
Indefinite-life
intangible assets Finite-life intangible assets
Note
Spectrum and other licenses
Customer Contracts Patents
Intellectual property
Deferred development
costs Total
At cost
At July 1, 2019 $ 105 $ 20,866 $ 644 $ 10,316 $ 60,521 $ 92,452 Additions - - 83 7 12,250 12,340 Government grant 14 - - - - (98) (98) Investment tax credits 15 - - - - 782 782 Writedown, fully amortized - - - - (12,544) (12,544) Effect of foreign exchange 2 663 9 277 214 1,165
At June 30, 2020 $ 107 $ 21,529 $ 736 $ 10,600 $ 61,125 $ 94,097 Additions - - 122 493 16,537 17,152 Disposals - (337) - (281) (583) (1,201) Business acquisition 5 - - - 505 - 505 Investment tax credits 15 - - - - (760) (760) Writedown, fully amortized - (20) - - (4,689) (4,709) Effect of foreign exchange (4) (1,509) (110) (681) (881) (3,185)
At June 30, 2021 $ 103 $ 19,663 $ 748 $ 10,636 $ 70,749 $ 101,899
Accumulated amortization
At July 1, 2019 $ - $ 4,374 $ 385 $ 3,012 $ 16,794 $ 24,565 Amortization - 2,418 63 1,392 8,702 12,575 Writedown, fully amortized - - - - (12,544) (12,544) Effect of foreign exchange - 147 - 75 79 301
At June 30, 2020 $ - $ 6,939 $ 448 $ 4,479 $ 13,031 $ 24,897 Amortization - 2,141 75 1,189 7,679 11,084 Disposals - (90) - (106) (130) (326) Writedown, fully amortized - (20) - - (4,689) (4,709) Effect of foreign exchange - (506) (89) (261) (415) (1,271)
At June 30, 2021 $ - $ 8,464 $ 434 $ 5,301 $ 15,476 $ 29,675
Net book value At June 30, 2020 $ 107 $ 14,590 $ 288 $ 6,121 $ 48,094 $ 69,200
At June 30, 2021 $ 103 $ 11,199 $ 314 $ 5,335 $ 55,273 $ 72,224
Included in deferred development costs additions is $332 from discontinued operations (June 30, 2020 - $278).
Included in the amortization of finite-life intangible assets and deferred development costs is $86 and $112, respectively, from discontinued operations (June 30, 2020 - $111 and $21, respectively).
Amortization of customer contracts and patents is recognized in general and administrative expenses. Amortization of deferred development costs and intellectual property is recognized in research and development expenses.
The aggregate amount of research and development expenditures from continuing operations during the year ended June 30, 2021 was $35,022 (June 30, 2020 - $24,992).
During the current and prior year, no impairments were noted for any indefinite-life intangible assets.
There were no impairment losses recorded on deferred development costs during the year ended June 30, 2021 (June 30, 2020 - $nil).

VECIMA NETWORKS INC. Notes to the Consolidated Financial Statements Years ended June 30, 2021 and 2020 (in thousands of Canadian dollars except as otherwise noted)
Vecima Networks Inc. 2021 Annual Report Page 63
14. GOVERNMENT GRANTS
Job
Grants
Industrial Research
Assistance Program (IRAP)
Research and development tax credit(1)
Employee retention credit(2) Total
At July 1, 2019 $ - $ 11 $ 247 $ - $ 258 New grants claimed 42 98 670 - 810 Grants received (40) (109) (250) - (399) Effect of foreign exchange - - 22 - 22
At June 30, 2020 2 - 689 - 691 New grants claimed - - 747 1,216 1,963 Grants received (2) - (674) - (676) Effect of foreign exchange - - (47) 18 (29)
At June 30, 2021 $ - $ - $ 715 1,234 $ 1,949 (1) Research and development tax credit program is by the State of Georgia. (2) Employee retention credit program is a U.S. federal program under the CARES Act.
In December 2018, the Company entered into non-repayable contribution agreements with the National Research Council Canada as represented by its Industrial Research Assistance Program ("IRAP") for total funding of $350 to finance research and development projects. The funding for the program ended during the year ended June 30, 2020, where the Company recognized the remaining $98 in non-repayable government assistance relating to IRAP; and $98 was recorded as a reduction in intangible assets.
In the third quarter of 2021, the Company applied for a research and development tax credit with the State of Georgia in the amount of $747, which related to the 2020 fiscal period. The application for the tax credit was submitted in February 2021 with the Company's 2020 state corporate tax return. In March 2021, the Company received confirmation that our application for the tax credit was approved. The tax credit allows the Company to incrementally offset its state payroll tax withholdings each pay period, until the tax credit is used. The tax credit is not dependent upon the Company having taxable income in the State of Georgia and is not considered part of income taxes. We reported the original tax credit in the third quarter of 2021 as a government grant receivable in the amount of $747, with a corresponding offset to accrued liabilities.
For the year ended June 30, 2020, the Company applied for a research and development tax credit with the State of Georgia. The amount granted in 2020 was $670. We reported the original tax credit in the third quarter of 2020 as a government grant receivable in the amount of $670, with a corresponding offset to accrued liabilities.
In the fourth quarter of 2021, the Company applied for the US Employee Retention Credit (“ERC”) under the Coronavirus Aid, Relief, and Economic Security Act (“CARES Act”), as amended by the Consolidated Appropriations Act of 2021 (“CAA”). The ERC is a refundable tax credit against certain employment taxes equal to a percentage of the qualified wages an eligible employer pays to employees (including allocable qualified health plan expenses) between March 13, 2020 and December 31, 2021. The ERC is intended to provide economic relief to eligible employers during periods of severe economic decline or government mandated orders as prompted by the COVID-19 pandemic. The ERC is not dependent upon the Company having federal taxable income and is not considered part of income taxes. The Company reported the ERC in the fourth quarter of 2021 as a government grant receivable in the amount of $1,216, with a corresponding offset to other income.
As of June 30, 2021, the government grant receivable was $1,949 (June 30, 2020 - $691). During the year ended June 30, 2021, the payroll tax withholding liability and the government grant receivable were reduced by $674 (June 30, 2020 - $250) during the year; and the accrued liabilities and operating expenses were reduced by a total of $674 for the year ended June 30, 2021 (June 30, 2020 - $250). The Company expects to fully utilize the tax credit within 12 months of the grant date, and all amounts reported on the consolidated statements of financial position are shown as either a current asset or current liability. Further, the Company is expected to collect the Employee Retention Credit by the end of the first quarter of the 2022 fiscal period.

VECIMA NETWORKS INC. Notes to the Consolidated Financial Statements Years ended June 30, 2021 and 2020 (in thousands of Canadian dollars except as otherwise noted)
Vecima Networks Inc. 2021 Annual Report Page 64
15. INVESTMENT TAX CREDITS
During the year ended June 30, 2021, the Company recorded investment tax credits of $900 (June 30, 2020 - $1,914), with a $760 (June 30, 2020 - $1,709) reduction to deferred development costs and $138 (June 30, 2020 - $205) reduction to research and development expenses. For the year ending June 30, 2021, investment tax credits reducing deferred development costs were offset by $nil (June 30, 2020 - $1,289) for a tax ruling and by $nil (June 30, 2020 - $1,203) for expired provincial credits. Investment tax credits expire between 2022 and 2041.
16. INCOME TAXES
Deferred income taxes reflect the net tax effects of temporary and non-current carry-forward differences between the carrying amounts of assets and liabilities for financial reporting purposes and the associated amounts used for income tax purposes. Significant components of the Company's tax assets and liabilities are as follows:
Years ended June 30, 2021 2020
Provision for warranties $ 62 $ 77 Lease liabilities 1,104 1,206 Non-capital losses 2,846 874 Property, plant and equipment 507 1,746 Right-of-use assets (912) (1,021) Research and development expenditures 13,696 12,254 Accrued expenses 94 150 Unrealized foreign exchange losses (gains) 672 (215) Accrued retirement 137 138 Intangible assets (11,540) (11,191) Statutory limitations on deductible interest and contributions 230 - Other 243 (94)
Net total deferred tax asset 7,139 3,924
Deferred tax asset 7,143 4,460 Deferred tax liability $ (4) $ (536)
The Company has recognized deferred tax assets in the amount of $7,139 (June 30, 2020 - $3,924), the utilization of which is dependent on the future taxable profits in excess of the profits arising from the reversal of existing taxable temporary differences. The recognition of these deferred tax assets is based on taxable income forecasts that incorporate existing circumstances that will result in positive taxable income against which non-capital losses and deductible temporary differences can be utilized.
Significant components of the provision for income taxes attributable to operations are as follows:
Years ended June 30, 2021 2020
Income tax expense (recovery) – continuing operations $ 1,451 $ (50) Deferred income tax (recovery) expense – continuing operations (3,340) 441
Total income tax (recovery) expense – continuing operations (1,889) 391
Income tax expense – discontinued operations 223 - Deferred income recovery – discontinued operations - -
Total income tax expense – discontinued operations $ 223 $ -
There were no income taxes booked to equity during the year (2020 - $nil).

VECIMA NETWORKS INC. Notes to the Consolidated Financial Statements Years ended June 30, 2021 and 2020 (in thousands of Canadian dollars except as otherwise noted)
Vecima Networks Inc. 2021 Annual Report Page 65
The provision for income taxes differs from the amount that would be computed by applying the Canadian federal and provincial substantively enacted income tax rates. The reasons for the differences are as follows:
Years ended June 30, 2021 2020
(Loss) income before income taxes $ (4,074) $ 2,893 Substantively enacted tax rates 25.7% 25.7%
Tax computed at Canadian statutory income tax rates (1,047) 744 Differences in substantively enacted future tax rates (49) 29 Foreign tax rate differential 245 (372) Expenses not deductible for tax purposes (1) 192 164 Federal and state tax credits (966) (784) Other (2) (264) 610
Total income tax expense $ (1,889) $ 391
Effective income tax rate 46.4% 13.5%
(1) Expenses not deductible for tax purposes consists primarily of interest and penalties, stock-based compensation expense, foreign expenses, expired ITC carryforwards, and meals and entertainment.
(2) Other items primarily include prior year deferred income tax true-up amounts, valuation allowances, and effects of foreign exchange.
17. SHORT-TERM BORROWINGS
The Company maintains an authorized line of credit of $14,000 (June 30, 2020 - $14,000) of which $nil was drawn on as of June 30, 2021 (June 30, 2020 - $nil). The line of credit is secured by a general security agreement and is limited to a maximum amount available of 70% of accounts receivable and 40% of inventory (to a maximum of $7,000). Interest on the outstanding line of credit is calculated at prime plus 0.5%. The prime rate at June 30, 2021 was 2.45% (June 30, 2020 – 2.45%).
18. ACCOUNTS PAYABLE AND ACCRUED LIABILITIES
Years ended June 30, 2021 2020
Accounts payable $ 6,249 $ 6,632 Accrued liabilities 16,010 10,473
$ 22,259 $ 17,105
The carrying value of accounts payable and accrued liabilities are considered to be a reasonable approximation of fair value due to their short-term nature.

VECIMA NETWORKS INC. Notes to the Consolidated Financial Statements Years ended June 30, 2021 and 2020 (in thousands of Canadian dollars except as otherwise noted)
Vecima Networks Inc. 2021 Annual Report Page 66
19. PROVISIONS
Note Warranty Restructuring
Costs Onerous Contract Other Total
At July 1, 2019 $ 349 $ 157 $ - $ 630 $ 1,136 Additions during the year 370 37 - 264 671 Amounts utilized (411) (157) - (361) (929) Effect of foreign exchange 4 - - 10 14
At June 30, 2020 312 37 - 543 892 Additions during the year 303 - - 175 478 Amounts utilized (340) (37) - (143) (520) Business acquisition 5 103 - 1,011 - 1,114 Effect of foreign exchange (19) - (59) (50) (128)
At June 30, 2021 $ 359 $ - $ 952 $ 525 $ 1,836
Less: current portion $ 359 $ - $ 952 $ 128 $ 1,439 Long-term portion $ - $ - $ - $ 397 $ 397
The warranty provision is based on the Company's prior years' experience.
In conjunction with the Nokia portfolio acquisition described in Note 5, the Company acquired an onerous contract for the acquisition of excess and obsolete inventory from third party supplier. The provision for the onerous contract is based on the Company’s best estimate.
20. LONG-TERM DEBT
Years ended June 30, 2021 2020
Term credit facility $ 1,458 $ 1,708 Lease liabilities 4,266 4,603
$ 5,724 $ 6,311
Comprised of: Current portion of term credit facility and lease liabilities $ 1,617 $ 1,698 Long-term portion of term credit facility and lease liabilities 4,107 4,613
$ 5,724 $ 6,311
Term credit facility
The term credit facility is with a Canadian chartered bank. As at June 30, 2021, the facility is repayable in monthly instalments of $21 principal and interest at prime of 2.45% (June 30, 2020 - $21, and 2.45%, respectively), expires in October 2022 and is collateralized by a general security agreement. The Company has an authorized loan amount of $3,792 and annually renews this facility with the bank.
The term credit facility is recorded at amortized cost. The Company’s term credit facility is at an interest rate that floats based on prime and the carrying value of the principal is considered to be fair value.
Assuming that the existing payment terms are the same at the renewal date, the following are the future principal repayments for the term credit facility as at June 30, 2021:
2022 $ 250 2023 250 2024 250 2025 250 2026 250 Thereafter 208
$ 1,458

VECIMA NETWORKS INC. Notes to the Consolidated Financial Statements Years ended June 30, 2021 and 2020 (in thousands of Canadian dollars except as otherwise noted)
Vecima Networks Inc. 2021 Annual Report Page 67
Lease liabilities
The following is a reconciliation of the Company’s lease liabilities as at June 30, 2021:
Years ended June 30, 2021 2020
Lease liabilities, beginning of year $ 4,603 $ 5,715 Net additions during the year 1,551 206 Interest on lease liabilities 184 226 Principal repayments of lease liabilities (1,621) (1,675) Disposals (98) - Effect of foreign exchange (353) 131
Lease liabilities, end of year $ 4,266 $ 4,603
Less: current portion 1,367 1,448
Long-term portion $ 2,899 $ 3,155
Included in principal repayments of lease liabilities is $64 from discontinued operations (June 30, 2020 - $47).
21. SHARE CAPITAL
(a) Share capital
The Company has authorized share capital of an unlimited number of common shares with no par value
and an unlimited number of preferred shares with no par value. The table below provides details of common
shares outstanding and their carrying value.
Number of shares Carrying value
Balance, July 1, 2019 22,370,087 $ 1,916 Shares issued by exercising options 105,375 1,247 Shares repurchased and cancelled (13,380) (2)
Balance, June 30, 2020 22,462,082 3,161 Shares issued by exercising options 269,313 3,154 Subscription for common shares 50,000 713 Performance Share Units settled in common shares 199,798 1,038 Shares withheld for taxes to settle performance share units (59,826) (767)
Balance, June 30, 2021 22,921,367 $ 7,299
The Company issued 269,313 common shares through the exercise of options during the year ended June 30, 2021 (June 30, 2020 – 105,375) for cash consideration of $2,343 (June 30, 2020 - $920).
Each holder of a common share is entitled to one vote per share at shareholder meetings and to receive dividends, as and when declared by the Board of Directors. There are no pre-emptive, retraction, surrender, redemption, repurchase for cancellation or conversion rights attached to the common shares.
Preferred shares may be issued from time to time with designation, rights, privileges, restrictions and conditions, determined by the Board of Directors at the time of issue (none issued).
(b) Reserves
Reserves within shareholders’ equity represent equity settled employee benefits reserve.

VECIMA NETWORKS INC. Notes to the Consolidated Financial Statements Years ended June 30, 2021 and 2020 (in thousands of Canadian dollars except as otherwise noted)
Vecima Networks Inc. 2021 Annual Report Page 68
(c) Stock option plan
The Company has established a stock option plan pursuant to which options to acquire common shares may be issued to officers, directors and employees of the Company. The term, vesting period, exercise price, and number of common shares, relating to each option will be determined by the Company's Board of Directors at the time options are granted, but will not be more favourable than those permitted under applicable securities legislation and/or regulation. Typically, options are granted for six years with vesting based on either time-based service or performance and are equity settled. The Company's stock option plan is subject to the rules and policies of any stock exchange on which the common shares are listed. The total number of common shares of the Company that will be issued pursuant to the Company's stock option plan will not exceed 10% of the issued and outstanding shares of the Company at any given time. Options granted under the Company's stock option plan are not assignable.
The changes in options and the number of options outstanding for the years ended June 30, 2021 and 2020 are as follows:
Number of options
Weighted average exercise price per option
Outstanding, July 1, 2019 502,500 $ 8.95 Granted 9,000 8.25 Cancelled (13,000) 8.62 Exercised (105,375) 8.73
Outstanding, June 30, 2020 393,125 9.01 Granted 9,000 13.18 Cancelled (6,937) 9.80 Exercised (269,313) 8.70
Outstanding, June 30, 2021 125,875 $ 9.93
Vested and exercisable 96,628 $ 9.83
For the year ended June 30, 2021, the weighted average trading price for the options exercised was $12.59 per option (June 30, 2020 - $10.32 per option).
At June 30, 2021, the exercise prices ranged from $8.25 to $13.89 per option, with the weighted average exercise price being $9.93 per option. The options outstanding at June 30, 2021 have a weighted average contractual life of 2.26 years.
Options outstanding Options exercisable
Number
Weighted average
remaining life
Weighted average exercise price per option Number
Weighted average exercise price per option
$8.25 to $9.40 35,000 3.32 $ 8.82 22,252 $ 8.87 $9.41 to $10.60 51,875 2.05 9.68 43,376 9.70 $10.61 to $13.89 39,000 1.60 11.24 31,000 10.71
125,875 2.26 $ 9.93 96,628 $ 9.83
(d) Share-based compensation
Stock options
For all stock options granted, the Company determined compensation expense based on the estimated fair values at the grant date of the stock options using the Black-Scholes option-pricing model. The estimated fair value of the stock options is amortized to share-based compensation over the vesting period of the options.
VECIMA NETWORKS INC. Notes to the Consolidated Financial Statements Years ended June 30, 2021 and 2020 (in thousands of Canadian dollars except as otherwise noted)
Vecima Networks Inc. 2021 Annual Report Page 69
The following table summarizes the share-based compensation expense included in the consolidated statements of comprehensive (loss) income:
Years ended June 30, 2021 2020
Stock options $ 21 $ 59 Performance share units 1,399 -
$ 1,420 $ 59
The weighted average estimated fair value for the common share options granted in the year was $6 (June 30, 2020 - $12). Management used the following assumptions within the Black-Scholes option-pricing model:
Years ended June 30, 2021 2020
Weighted average share price $ 12.30 $ 8.25 Expected option life 6.00 years 6.00 years Risk-free rate of return 0.35% 1.33% Volatility factor 23.75% 23.78% Expected dividends 1.79% 2.65% Forfeiture rate 2.38% 2.07%
Performance share units (“PSUs”)
The Company’s PSU plan sets the maximum number of PSUs that can be issued at 4% of the outstanding common shares of the Company. At the time of the PSU plan’s approval by the shareholders of the Company on July 28, 2020, the maximum number of shares issuable under the PSU plan was set at 897,275. No further approval by the shareholders of the Company is required for any unallocated PSUs.
During the year ended June 30, 2021, the Company issued 616,737 PSUs to eligible persons under the PSU plan. These PSUs have five year terms, and vest in three tranches upon the achievement of certain closing market trading prices of the Company’s common shares for a period of twenty consecutive business days. During the year, 199,798 PSUs vested in two tranches, and were settled via the issuance of common shares. The Company withheld 59,826 common shares at an aggregate value of $767 to settle withholding tax obligations on the issuance of the common share awards. This was accounted for as a reduction to
equity.
A summary of PSU activity during the year ended June 30, 2021 is as follows:
Number of PSUs
PSUs outstanding as at July 1, 2019 and 2020 - Granted 616,737 Forfeited (26,924) Settled (199,798)
PSUs outstanding as at June 30, 2021 390,015
The fair value of the PSUs were determined using a Monte Carlo simulation. On grant, the Company estimated the achievement dates of each performance condition, and the cost of the PSUs is expensed on a straight-line basis over the period from the grant date to the expected market condition achievement date. The Company estimated forfeitures of PSUs at 10% on grant, and adjusts the amount recognized in expense upon vesting.

VECIMA NETWORKS INC. Notes to the Consolidated Financial Statements Years ended June 30, 2021 and 2020 (in thousands of Canadian dollars except as otherwise noted)
Vecima Networks Inc. 2021 Annual Report Page 70
22. REVENUE FROM CONTRACTS WITH CUSTOMERS
(a) Disaggregated revenue
In the following table, gross revenue from contracts with customers is disaggregated by reporting segment and type. Refer to Note 26 for additional segmented financial information.
For the year ended June 30, 2021
Video and Broadband Solutions
Content Delivery and
Storage Telematics Total
Product sales $ 67,745 $ 25,640 $ 499 $ 93,884 Provision of services 7,528 17,770 4,995 30,293
$ 75,273 $ 43,410 $ 5,494 $ 124,177
For the year ended June 30, 2020
Video and Broadband Solutions
Content Delivery and
Storage Telematics Total
Product sales $ 28,966 $ 36,598 $ 605 $ 66,169 Provision of services 6,893 17,068 4,752 28,713
$ 35,859 $ 53,666 $ 5,357 $ 94,882
(b) Contract assets
Contract assets arise primarily as a result of the difference between revenue recognized on the fulfillment of a non-recurring performance obligation at the onset of a term contract and the cash collected or receivable at the point of sale. Recognition of revenue requires the estimation of total consideration over the contract term and the allocation of that consideration to all performance obligations in the contract based on the stand-alone selling prices. The Company reclassifies contract assets to trade receivables once the customer is invoiced and the right to consideration is unconditional.
Contract assets also arise due to the treatment of costs incurred in acquiring customer contracts. IFRS 15 requires contract acquisition costs, such as sales commissions, to be recognized as an asset and amortized into cost of sales expense over the term of the contract. Commission costs paid to internal and external representatives as a result of obtaining contracts with customers are deferred and amortized to cost of sales expense consistent with the transfer of goods and services to the customer. Telematics deferred commission costs attributable to subscription service is amortized over 24 or 36 consecutive months. The Company has elected to utilize the practical expedient that allows the Company to recognize the incremental costs of obtaining contracts as an expense when incurred if the amortization period of the assets that would have been recognized is 12 months or less.
Years ended June 30, 2021 2020
Balance, beginning of year $ 968 $ 398 Net additions arising from operations 869 993 Amounts billed during the year and reclassified as accounts receivable (491) (193) Deferred costs recognized as expense in the year (207) (229) Effect of change in foreign currency exchange rates (34) (1)
Balance, end of year $ 1,105 $ 968
To be billed and reclassified to accounts receivable during next 12 months 143 493 Deferred costs to be recognized as expense during next 12 months 373 153
Current portion, contract assets 516 646 Thereafter 589 322
$ 1,105 $ 968

VECIMA NETWORKS INC. Notes to the Consolidated Financial Statements Years ended June 30, 2021 and 2020 (in thousands of Canadian dollars except as otherwise noted)
Vecima Networks Inc. 2021 Annual Report Page 71
(c) Deferred revenue
Contract liabilities, which includes deferred revenues, represent the future performance obligations to customers in respect of services or customer activation fees for which consideration has been received upfront and is recognized over the expected term of the customer relationship. The Company has elected to apply the practical expedient that allows the Company not to disclose the unsatisfied portions of performance obligations under contracts where the revenue we recognize is equal to the amount invoiced to the customer.
Contract liability balances, the changes in those balances, the future periods the performance obligations are expected to be satisfied, and revenue recognized are set out in the following table:
Years ended June 30, Note 2021 2020
Balance, beginning of year $ 5,562 $ 4,809 Revenue deferred in previous period and recognized in current period (4,870) (4,218) Business acquisition 5 78 - Net additions arising from operations 9,378 4,821 Disposals (62) - Effect of change in foreign currency exchange rates (551) 150
Balance, end of year $ 9,535 $ 5,562
Revenue to be recognized in the future Within one year $ 7,137 $ 4,960 Between two to five years 2,398 602
Total $ 9,535 $ 5,562
23. OTHER INCOME
Years ended June 30, 2021 2020
Gain on sale of property, plant and equipment $ (302) $ (455) Lease revenue (19) (52) Employee retention credit (1,216) - Other 25 28
$ (1,512) $ (479)
24. FINANCE INCOME (EXPENSE)
Years ended June 30, Note 2021 2020
Interest income $ 163 $ 731 Operating line interest (1) (3) Term credit facility interest (39) (65) Other 130 199
Finance income before interest on lease liabilities 253 862 Interest expense on lease liabilities 20 (184) (226)
$ 69 $ 636

VECIMA NETWORKS INC. Notes to the Consolidated Financial Statements Years ended June 30, 2021 and 2020 (in thousands of Canadian dollars except as otherwise noted)
Vecima Networks Inc. 2021 Annual Report Page 72
25. NET (LOSS) INCOME PER SHARE
The following table sets forth the calculation of basic and diluted net (loss) income per share:
Years ended June 30, 2021 2020
Net (loss) income: basic and diluted (in thousands of dollars) $ (331) $ 1,806
Weighed average number of shares outstanding: Basic 22,748,826 22,411,612 Dilution adjustment for stock options - 33,194
Diluted 22,748,826 22,444,806
Net (loss) income per share: basic $ (0.02) $ 0.08 Net (loss) income per share: diluted $ (0.02) $ 0.08
Stock options could potentially dilute basic net (loss) income per share in the future. Dilutive stock options are calculated using the treasury stock method. For the year ended June 30, 2021, any conversion effect of the 125,875 stock options were entirely anti-dilutive and have been excluded from the calculation of net (loss) income per share. For the year ended June 30, 2020, there were 272,125 dilutive stock options, which resulted in a dilution adjustment of 33,194; with the remaining 121,000 outstanding stock options being anti-dilutive.

VECIMA NETWORKS INC. Notes to the Consolidated Financial Statements Years ended June 30, 2021 and 2020 (in thousands of Canadian dollars except as otherwise noted)
Vecima Networks Inc. 2021 Annual Report Page 73
26. SEGMENTED FINANCIAL INFORMATION
The Company’s operations are organized into business units based on how the business is managed and has three reportable segments. The Video and Broadband Solutions segment designs, develops and distributes electronic communications products to cable and telecommunications markets. The Content Delivery and Storage segment develops advanced applications focused on storing, protecting, and transforming and delivering visual media. The Telematics segment designs, develops and distributes fleet management products. Inter-segment transactions take place at terms that approximate fair value. The majority of the Company’s operations, employees and assets reside in Canada and the United States. The following tables highlight key financial information by segment and geographical region:
Segments
Year ended June 30, 2021
Video and Broadband Solutions
Content Delivery and
Storage Telematics Total
Sales $ 75,273 $ 43,410 $ 5,494 $ 124,177 Cost of sales 43,640 22,087 1,808 67,535
Gross profit 31,633 21,323 3,686 56,642 Operating expenses 24,997 16,421 1,856 43,274 Depreciation and amortization 7,598 6,147 793 14,538
Operating (loss) income (962) (1,245) 1,037 (1,170) Finance income 69 Foreign exchange loss (2,973) Income tax recovery 1,889
Net loss from continuing operations (2,185) Net income from discontinued operations 1,854
Net loss $ (331)
Total assets $ 147,604 $ 53,715 $ 13,413 $ 214,732
Total liabilities $ 23,770 $ 14,704 $ 1,338 $ 39,812
Year ended June 30, 2020
Video and Broadband Solutions
Content Delivery and
Storage Telematics Total
Sales $ 35,859 $ 53,666 $ 5,357 $ 94,882 Cost of sales 18,914 23,017 1,674 43,605
Gross profit 16,945 30,649 3,683 51,277 Operating expenses 14,934 17,400 2,218 34,552 Depreciation and amortization 8,308 6,660 828 15,796
Operating (loss) income (6,297) 6,589 637 929 Finance income 636 Foreign exchange gain 1,328 Income tax expense (391)
Net income from continuing operations 2,502 Net loss from discontinued operations (696)
Net income $ 1,806
Total assets $ 135,660 $ 61,775 $ 12,863 $ 210,298
Total liabilities $ 12,800 $ 16,758 $ 978 $ 30,536
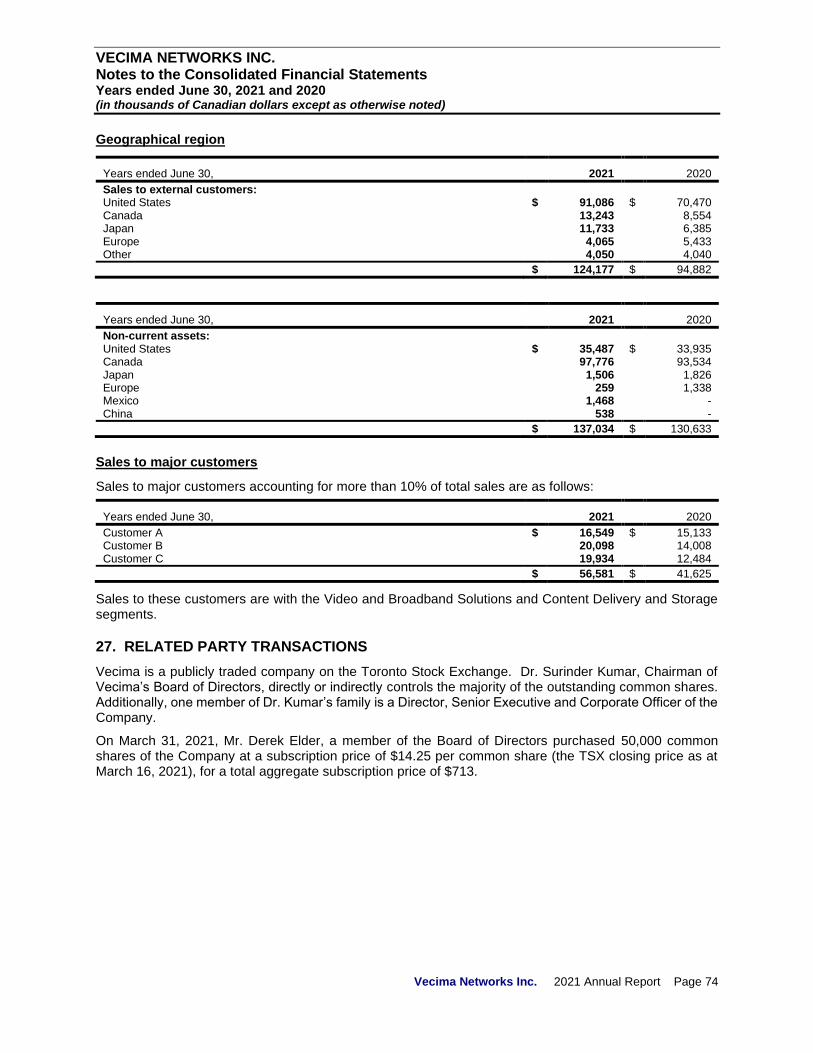
VECIMA NETWORKS INC. Notes to the Consolidated Financial Statements Years ended June 30, 2021 and 2020 (in thousands of Canadian dollars except as otherwise noted)
Vecima Networks Inc. 2021 Annual Report Page 74
Geographical region
Years ended June 30, 2021 2020
Sales to external customers: United States $ 91,086 $ 70,470 Canada 13,243 8,554 Japan 11,733 6,385 Europe 4,065 5,433 Other 4,050 4,040
$ 124,177 $ 94,882
Years ended June 30, 2021 2020
Non-current assets: United States $ 35,487 $ 33,935 Canada 97,776 93,534 Japan 1,506 1,826 Europe 259 1,338 Mexico 1,468 - China 538 -
$ 137,034 $ 130,633
Sales to major customers
Sales to major customers accounting for more than 10% of total sales are as follows:
Years ended June 30, 2021 2020
Customer A $ 16,549 $ 15,133 Customer B 20,098 14,008 Customer C 19,934 12,484
$ 56,581 $ 41,625
Sales to these customers are with the Video and Broadband Solutions and Content Delivery and Storage segments.
27. RELATED PARTY TRANSACTIONS
Vecima is a publicly traded company on the Toronto Stock Exchange. Dr. Surinder Kumar, Chairman of Vecima’s Board of Directors, directly or indirectly controls the majority of the outstanding common shares. Additionally, one member of Dr. Kumar’s family is a Director, Senior Executive and Corporate Officer of the Company.
On March 31, 2021, Mr. Derek Elder, a member of the Board of Directors purchased 50,000 common shares of the Company at a subscription price of $14.25 per common share (the TSX closing price as at March 16, 2021), for a total aggregate subscription price of $713.

VECIMA NETWORKS INC. Notes to the Consolidated Financial Statements Years ended June 30, 2021 and 2020 (in thousands of Canadian dollars except as otherwise noted)
Vecima Networks Inc. 2021 Annual Report Page 75
The consolidated financial statements include the accounts of the Company and its subsidiaries listed in the following table:
% equity interest
Company Name Jurisdiction Participating voting interest
Vecima Networks (USA) Inc. United States 100 Vecima Telecom India Private Ltd. India 95 6105971 Canada Inc. Canada 100 Vecima Technology Inc. United States 100 Vecima Technology (Canada) Inc. Canada 100 Concurrent Content Solutions Corporation Japan 100 Vecima Technology (UK) Ltd. United Kingdom 100 Vecima Technology GmbH Germany 100 Vecima Technology B.V. Netherlands 100 Vecima Technology (Qingdao) Co., Ltd. China 100 Vecima Technology (Shanghai) Co., Ltd. China 100
Compensation of key management personnel of the Company is provided in the table below:
Years ended June 30, 2021 2020
Salaries and short-term employee benefits $ 2,091 $ 1,898 Post-employment pension 42 43 Share-based compensation - stock options and PSUs 460 11
$ 2,593 $ 1,952
The amounts disclosed in the table are recognized as an expense during the reporting period. Key management personnel consist of the Board of Directors and certain executives who have authority and responsibility for planning, directing and controlling the activities of the Company, either directly or indirectly.
There were 9,000 stock options awarded to key management personnel for the year ended June 30, 2021 (2020 - nil); of which 1,000 stock options were forfeited. As stock options awarded are granted for six years, with vesting based on performance and are equity settled, the expense is recognized rateably over a period of years and thus only a portion of the awards are included in the table above.
There were 242,302 PSUs awarded to key management personnel during the June 30, 2021 fiscal year (June 30, 2020 – nil). During the June 30, 2021 fiscal year, 80,766 PSUs vested (June 30, 2020 – nil); which had a fair value of $417 (June 30, 2020 - $nil). Each vested PSU is settled for one common share of the Company.
28. FAIR VALUE HIERARCHY
Assets and liabilities measured at fair value in the consolidated statements of financial position, or where fair value disclosures are required, are classified based on a three-level hierarchy as follows:
Level 1: determined by reference to quoted prices in active markets for identical assets and liabilities;
Level 2: determined by using inputs other than quoted prices within Level 1 that are observable for the asset or liability, either directly (i.e., as prices) or indirectly (i.e. derived from prices); and
Level 3: determined using inputs that are not based on observable market data.
The following table classifies assets and liabilities measured at fair value according to the three-level hierarchy:
June 30, 2021 June 30, 2020
Level 1 Level 2 Level 3 Level 1 Level 2 Level 3
Short-term investments $ - $ - $ - $ 17,165 $ - $ -
During the years ended June 30, 2021 and 2020, there were no transfers between Level 1 and Level 2 fair value measurements, and no transfers into and out of Level 3 fair value measurements.

VECIMA NETWORKS INC. Notes to the Consolidated Financial Statements Years ended June 30, 2021 and 2020 (in thousands of Canadian dollars except as otherwise noted)
Vecima Networks Inc. 2021 Annual Report Page 76
29. FINANCIAL INSTRUMENTS RISK MANAGEMENT
Financial risks
In the normal course of business, the Company is exposed to a number of financial risks that can materially affect its operating performance. These financial risks include: credit risk, liquidity risk, currency risk and interest rate risk. The source of risk exposure and how each is managed is outlined below.
(a) Credit risk
Cash and cash equivalents are placed with major Canadian financial institutions rated in the two highest grades by nationally recognized ratings agencies. Concentration of credit risk exists with respect to the Company's cash and cash equivalents, since all amounts are held at major Canadian financial institutions. Credit risk is also managed by maintaining short-term investments (short-term deposits in cashable Guaranteed Investment Certificates) with Canadian financial institutions rated in the two highest grades by nationally recognized ratings agencies and Alberta, British Columbia and Saskatchewan credit unions. Deposits with credit unions are insured through the Credit Union Deposit Insurance Corporation. This insurance exceeds the amounts otherwise covered by the Canadian Deposit Insurance Corporation for cash deposits.
Credit risk also arises from the financial loss we could experience if a counterparty to a financial instrument, from whom we have an amount owing, failed to meet its obligations under the terms and conditions of its contracts with us. Our credit risk exposure is primarily attributable to our accounts receivable. Our accounts receivable on the consolidated statements of financial position are net of allowances for doubtful accounts, which management estimates based on lifetime expected credit losses. Our accounts receivable do not contain significant financing components and therefore, we measure our allowance for doubtful accounts using lifetime expected credit losses related to our accounts receivable.
As at June 30, 2021, the weighted average age of customer accounts receivable was 35 days (June 30, 2020 - 35 days); and the weighted average age of past-due accounts receivable approximated 66 days (June 30, 2020 - 64 days). Accounts are considered to be past due when customers have failed to make the required payments by their contractually agreed upon due date. The aging of trade receivables that are not considered to be impaired are as follows:
Years ended June 30, 2021 2020
Current $ 23,051 $ 19,826 31 to 60 days 1,922 1,920 61 to 90 days 736 163 Over 90 days 952 1,834
$ 26,661 $ 23,743
We maintain allowances for lifetime expected credit losses related to the allowance for doubtful accounts. Current economic conditions, forward-looking information, historical information, and reasons for the accounts being past due are all considered when determining whether to make allowances for past due accounts. The same factors are considered when determining whether to write-off amounts charged to the allowance for doubtful accounts against the customer accounts receivable.
The Company has an allowance for doubtful accounts at June 30, 2021 of $16 (June 30, 2020 - $97). At June 30, 2021, the Company had three major customers (June 30, 2020 - three) who accounted for approximately 34% (June 30, 2020 - 44%) of the year-end accounts receivable balance. Customer contract assets that are not considered to be impaired within the next 12 months are $516 and long-term are $589.

VECIMA NETWORKS INC. Notes to the Consolidated Financial Statements Years ended June 30, 2021 and 2020 (in thousands of Canadian dollars except as otherwise noted)
Vecima Networks Inc. 2021 Annual Report Page 77
(b) Liquidity risk
Liquidity risk arises from the Company's general funding needs and in the management of its assets, liabilities and capital. The Company manages its liquidity risk to maintain sufficient liquid financial resources to fund its operations and meet its commitments and obligations in a cost-effective manner. The Company currently holds a significant balance of cash which helps to mitigate this risk. The Company has access to a credit facility in the amount of $14,000 with a Canadian chartered bank. As of June 30, 2021, the remaining amount available to be drawn under this credit facility is $14,000.
The tables below presents a maturity analysis of the Company's financial liabilities as at June 30, 2021 and 2020:
June 30, 2021 Carrying Amount
Contractual cash flows
Less than 1 year
1 to 3 years Thereafter
Accounts payable and accrued liabilities $ 22,259 $ 22,259 $ 22,259 $ - $ - Long-term debt 1,458 1,458 250 500 708 Lease liabilities 4,266 4,590 1,510 2,443 637
$ 27,983 $ 28,307 $ 24,019 $ 2,943 $ 1,345
June 30, 2020
Accounts payable and accrued liabilities $ 17,105 $ 17,105 $ 17,105 $ - $ - Long-term debt 1,708 1,708 250 500 958 Lease liabilities 4,603 5,017 1,713 3,304 -
$ 23,416 $ 23,830 $ 19,068 $ 3,804 $ 958
(c) Currency risk Approximately 95% (June 30, 2020 - 97%) of the Company's sales are denominated in U.S. dollars. The Company periodically enters into forward foreign exchange contracts to manage foreign currency exchange risk related to exposures to the exchange rates for the Canadian dollar. These contracts are recognized in the consolidated statements of financial position at their fair value, with changes in fair value recorded in the consolidated statements of comprehensive (loss) income in foreign exchange (loss) gains. The Company had not entered into any forward exchange contracts for the year ended June 30, 2021. For the year ended June 30, 2020 the Company entered into three $1,000 USD forward foreign exchange contracts. The forward foreign exchange contracts matured on July 31, 2020, August 31, 2020, and September 30, 2020, respectively, upon which the Company settled the contracts in USD. As at June 30, 2021, the Company realized a net exchange gain of $239 (June 30, 2020 - $101 unrealized net exchange gain) in respect of these forward purchase contracts.
For the year ended June 30, 2021, if the Canadian dollar had weakened or strengthened by 1% against the U.S. dollar with all other variables held constant, net income before income taxes would have been $476 (June 30, 2020 - $345) higher or lower; and net income after income taxes would have been $367 (June 30, 2020 - $260) higher or lower.
(d) Interest rate risk
The Company is exposed to floating interest rate risk, as the required cash flows to service its debt will fluctuate as a result of changes in market rates. This risk is limited to the line of credit and long-term debt. The Company is also exposed to changes in interest rates related to its short-term investments, as the income received from these investments will fluctuate as a result of changes in market rates. A 1% movement in the interest rate would have resulted in a $30 change to net income before income taxes and a $22 change to net income after income taxes for the year ended June 30, 2021 (June 30, 2020 - $133 and $99, respectively).
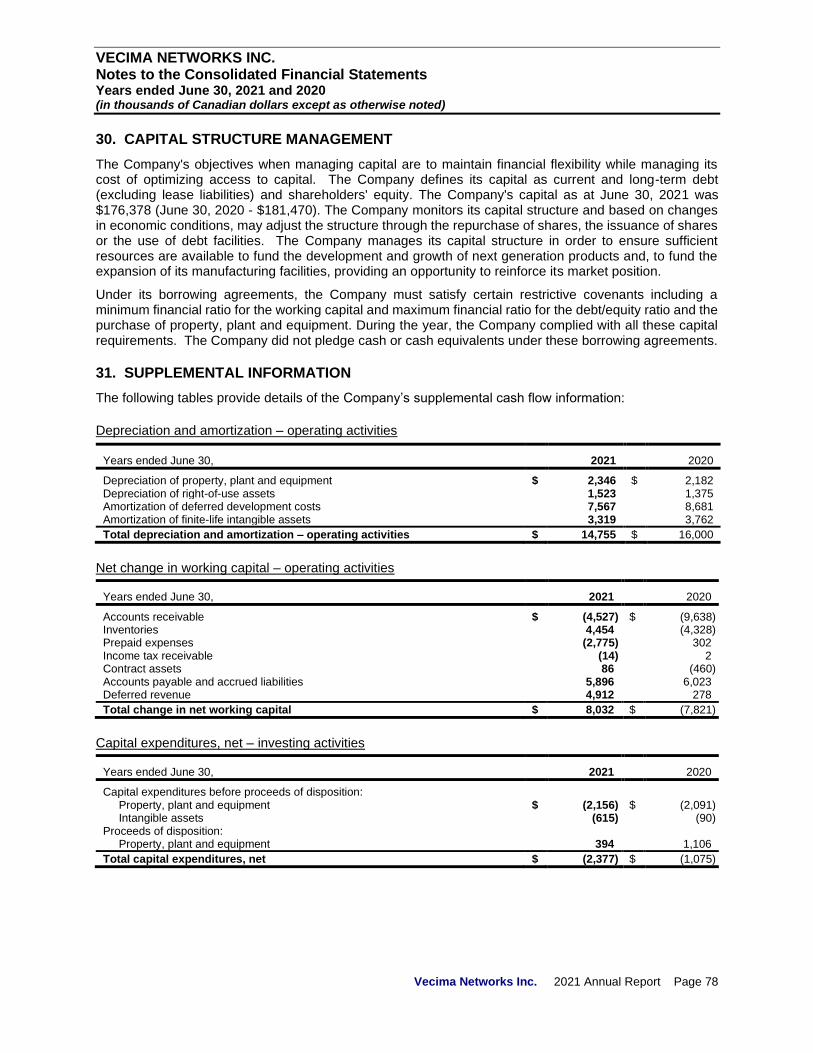
VECIMA NETWORKS INC. Notes to the Consolidated Financial Statements Years ended June 30, 2021 and 2020 (in thousands of Canadian dollars except as otherwise noted)
Vecima Networks Inc. 2021 Annual Report Page 78
30. CAPITAL STRUCTURE MANAGEMENT
The Company's objectives when managing capital are to maintain financial flexibility while managing its cost of optimizing access to capital. The Company defines its capital as current and long-term debt (excluding lease liabilities) and shareholders' equity. The Company's capital as at June 30, 2021 was $176,378 (June 30, 2020 - $181,470). The Company monitors its capital structure and based on changes in economic conditions, may adjust the structure through the repurchase of shares, the issuance of shares or the use of debt facilities. The Company manages its capital structure in order to ensure sufficient resources are available to fund the development and growth of next generation products and, to fund the expansion of its manufacturing facilities, providing an opportunity to reinforce its market position.
Under its borrowing agreements, the Company must satisfy certain restrictive covenants including a minimum financial ratio for the working capital and maximum financial ratio for the debt/equity ratio and the purchase of property, plant and equipment. During the year, the Company complied with all these capital requirements. The Company did not pledge cash or cash equivalents under these borrowing agreements.
31. SUPPLEMENTAL INFORMATION
The following tables provide details of the Company’s supplemental cash flow information:
Depreciation and amortization – operating activities
Years ended June 30, 2021 2020
Depreciation of property, plant and equipment $ 2,346 $ 2,182 Depreciation of right-of-use assets 1,523 1,375 Amortization of deferred development costs 7,567 8,681 Amortization of finite-life intangible assets 3,319 3,762
Total depreciation and amortization – operating activities $ 14,755 $ 16,000
Net change in working capital – operating activities
Years ended June 30, 2021 2020
Accounts receivable $ (4,527) $ (9,638) Inventories 4,454 (4,328) Prepaid expenses (2,775) 302 Income tax receivable (14) 2 Contract assets 86 (460) Accounts payable and accrued liabilities 5,896 6,023 Deferred revenue 4,912 278
Total change in net working capital $ 8,032 $ (7,821)
Capital expenditures, net – investing activities
Years ended June 30, 2021 2020
Capital expenditures before proceeds of disposition: Property, plant and equipment $ (2,156) $ (2,091) Intangible assets (615) (90) Proceeds of disposition: Property, plant and equipment 394 1,106
Total capital expenditures, net $ (2,377) $ (1,075)

VECIMA NETWORKS INC. Notes to the Consolidated Financial Statements Years ended June 30, 2021 and 2020 (in thousands of Canadian dollars except as otherwise noted)
Vecima Networks Inc. 2021 Annual Report Page 79
The table below provides details of the employee benefit expenses included in the continuing operations for cost of sales and operating expenses:
Years ended June 30, 2021 2020
Wages and salaries $ 53,297 $ 41,104 Employee deferred profit sharing plan 1,419 1,203 Health care benefits 3,193 2,032
$ 57,909 $ 44,339
32. CONTINGENT LIABILITY
In March 2017, the Company received a re-assessment from the Canada Revenue Agency ("CRA") regarding the eligibility of certain Scientific Research and Experimental Development ("SR&ED") claims on its 2015 tax return. The CRA re-assessment would result in a reduction of SR&ED expenditures claimed of $1,289. The Company and its advisors have reviewed the applicable tax law and believe its original treatment of these SR&ED claims was appropriate. The Company filed a Notice of Objection in the fourth quarter of the 2017 fiscal period in regard to this matter. The Company received a Notice of Confirmation in February 2020 stating that the Notice of Objection was denied. The Company recorded the adjustment in the third quarter of 2020. The impact of this adjustment was a $1.3 million increase in deferred development amortization expense. The Company has filed a Notice of Appeal in April 2020 to defend its original tax treatment of these SR&ED claims.
33. CONTRACTUAL OBLIGATION
The Nokia portfolio acquisition includes the assumption of a contract with a third-party supplier. As at June 30, 2021, the contractual obligation, based on forecasted commitments, is estimated to be $5,518; of which, $952 is deemed to be onerous and has been provided for in Note 19.
34. SUBSEQUENT EVENTS
On September 21, 2021, the Board of Directors declared a dividend of $0.055 per common share, payable on November 1, 2021 to shareholders of record as at October 8, 2021 consistent with its previously announced dividend policy.
35. COMPARATIVE FIGURES Certain of the prior year’s comparative figures have been reclassified to conform to the current year’s presentation.