vce maths methods unit 3 &4 area of study: exam …
TRANSCRIPT

Presenter’s name Rosemary Ward Date September 2012
VCE MATHS METHODS
UNIT 3 &4
AREA OF STUDY: EXAM
PREPARATION
Functions and graphs, Algebra, Calculus, Probability, covering past exam questions and revising some techniques.

General Guidelines regarding study:
• For effective study sessions, plan your revision program
• Study subjects in blocks and vary the subjects you study each day
• Work out when and how you study most effectively
• Ensure you take time to relax, exercise, read
• Make sure your bound book is securely bound- black masking tape down spine
• Make sure you do not have perforated edges
• Do not rewrite your bound book, but rather organise the one you have
• Bound books can have tags but they must be permanent
• Colour code your sections
• Complete trial papers under exam conditions, then mark them
• Write in any solutions you got wrong and if they are repeat mistakes, write them into
the back section of your bound book
• Remember the more connections you can make between the material you have
studied, the more likely you will be able to retain and apply the information
• Key: Checkpoints and trial exams
• www.itute.com ( brilliant summary notes and many trial papers)

1. Functions:
Features of graphs such as axis intercepts, stationary points including inflection, domain/
restricted domain, range, asymptotes, symmetry and endpoints.
• graphs and identification of key features of graphs of the following functions:
– power functions ( if on exam one- know general shape and plot points)
– exponential functions
– logarithmic functions, y = loge(x) and y = log10(x), ( log laws!)
– circular functions, y = sin(x), y = cos(x) and y = tan(x); ( can appear on Exam 1)
– modulus function, y = |x|
• transformation from y = ƒ(x) to y = Aƒ(nx+ B)+C DRT
• graphs of polynomial functions;
• graphs of sum, difference, product (MC) and composite functions of ƒ and g and their domains
-- know how to restrict a domain so the composite function can exist
• graphical and numerical solution of equations (exact values unless stated)
• graphs of inverse functions derived from graphs of original functions- state DOMAIN
• recognition of the general form of a graph, from a table of values

2. Algebra:
The algebra of functions: composition of functions, inverse functions and the
solution of equations.
• polynomials (the remainder and factor theorems) and its use in sketching curves.
Equation solving of different types of polynomials and the determination of the
nature of stationary points will be expected. In addition, the use of the quadratic
formula ( often with m’s) and the discriminant for quadratic functions
• exponential and logarithm laws (the change of base formula)
• solution of simple exponential and logarithmic and trigonometric equations ( 3
steps 1. domain, 2. quadrant and 3.core angle)
• one-to-one and many-to-one functions and the condition for the existence of
inverse functions ( 1-1 function)
• finding inverses of functions

3. Calculus:
Limits, continuity and differentiability, differentiation, anti-differentiation and integration
• finding the graph of the gradient function, including its domain, from the graph of a
function and visa versa
• rules for derivatives of loge(x), sin(x), cos(x), tan(x), and combinations of them
In addition, rules for antidifferentiation
• product, chain and quotient rules for differentiation and deduction of indefinite
integrals in hence questions
• applications of differentiation to curve sketching (stationary points 𝑑𝑦
𝑑𝑥= 0)
Equations of tangents and normals, maximum/minimum problems, rates of
change, related rates of change and numerical evaluation of derivatives
• approximation formula –
• informal approximation to areas under curves by left rectangles and right rectangles
• definite and indefinite integrals
• application of integration to calculating the area of a region under a curve and
areas between curves.

4. Probability: • the concept of discrete and continuous random variables
• expected value, variance and standard deviation of a random variable
• calculation and interpretation of central measures (mode, median, mean)
The 68 – 95 – 99.7 Rule
– Bernoulli trials and two-state Markov chains, tree diagrams and Matrices (label)
• discrete random variables: graphs, tables and probability functions
– distributions for discrete random variables- mean ( μ) median, mode, variance and
standard deviation- formula sheet
– the binomial distribution, X Bi(n, p) and the binomial theorem expansion
– the effect of varying n and p on the graphs of PDFs
• continuous random variables:
– drawing and interpretation of probability density functions
– calculations and interpretation using CAS of mean ( μ) median, mode, variance and
standard deviation
– standard normal distribution Z N(0, 1), and transformed normal distributions
X N(μ, 𝜎2) transposition formula z= 𝑥−𝜇
𝜎
- the use of inverse normal when the probability is given e.g.Invnorm(.9,100,6) (Draw a
graph “CONDITIONAL PROBABILITY”

Specific tips for Maths Methods:
• Know Year 10 and 11 maths theory and skills e.g. SOHCAHTOA, similar triangles,
Pythagoras, trig identities, quadratic equation, exact values, log laws, area of triangles
which are not right- angled, Understand “simplify” and “state”
• Do not leave out a Multiple Choice Q- have an educated guess!
• Use brackets where appropriate, as this will ensure the calculator evaluates exactly what you
want, otherwise it will do BODMAS
• Sketch graphs require scales, x & y intercepts, turning points, end points (beware of
restricted domains- watch for open and closed dots)
• Inverses are not defined unless an domain is stated. When sketching inverses always draw in
the line y=x ( original function must be 1-1 function)
• Understand the significance of “hence” and “ show” q’s
• Composite functions: the domain of these, is the domain of the inside function and to
find the range sketch the composite function
• Write mathematical working down NOT CALCULATOR SYNTAX
• 𝒙𝟐 + 𝟒𝒙)𝒅𝒙 watch this notation –remember + c
• Get derivatives and antiderivatives once they are simplified and on the one line
• Rationalise all surds and state answers with only positive powers
• Know the different ways you are asked for a derivative/ gradient function/ gradient of the
curve/ gradient of the tangent at a point etc., acceptable notation:
𝑑𝑦
𝑑𝑥 or 𝑑(
2𝑥2+3𝑥
𝑥) 𝑑 𝑥 or 𝑓′(𝑥) 𝑓′(1) label everything!

Modulus Questions: 1. Solve |x+2|=3
𝑥: 𝑎𝑏𝑠(𝑥 − 1) ≤ 4−(𝑥 − 1) ≤ 4−𝑥 + 1 ≤ 4−𝑥 ≤ 3𝑥 ≥ −3
3. Sketch 𝑦 = |x+2|−3
+(𝑥 + 2) = 3𝑥 = 1
−(𝑥 + 2) = 3−𝑥 − 2 = 3−𝑥 = 5𝑥 = −5
X=1,-5
2. 𝑥: 𝑎𝑏𝑠(𝑥 − 1) ≤ 4
+(𝑥 − 1) ≤ 4𝑥 − 1 ≤ 4𝑥 ≤ 5
0 = 𝑎𝑏𝑠(𝑥 + 2) − 3
3 = +(𝑥 + 2)
3 = 𝑥 + 2𝑥 = 1
X intercepts:
3 = −(𝑥 + 2)
3 = −𝑥 − 2𝑥 = −5

Composite functions: 1. If 𝑓(𝑥) = 𝑥 − 2 for all x ≥ 2 and 𝑔(𝑥) = 4 − 𝑥 for all x ≤ 4
Sketch the graph of ℎ(𝑥) = 𝑥 − 2 + 4 − 𝑥 and state its domain
2. If f (x) = √x − 2 for all x ≥ 2 and g(x) = √4 − x for all x ≤ 4, find:
a f + g = √x − 2 + √4 − x
b ( f + g)(3) =√3 − 2 + √4 − 3= 1+1=2
c fg =(√x − 2 )*(√4 − x )
d ( fg)(3) =(√x − 2 )*(√4 − x )=1*1=1
(f + g)(x) = f(x) + g(x) and (fg)(x) = f(x).g(x)
The domain for the composite is the intersection of the domains of f(x) and g(x)
𝐷ℎ(𝑥) = 𝐷𝑓(𝑥) ∩ 𝐷𝑔(𝑥)

Composite Functions: that need a restricted domain For the functions f (x) = x2 − 1, x ∈ R, and g(x) = √x, x ≥ 0:
a State why g ◦ f is not defined. 𝐷𝑓 = 𝑅 and 𝐷𝑔= 𝑅+𝑈 0
𝑅𝑓 = −1,∞ 𝑅𝑔 = 𝑅+𝑈 0
For gof to exist: Is Range of f Domain of g ? 𝑔 𝑓(𝑥)
No so we must restrict the domain
b Define a restriction f ∗ of f such that g ◦ f ∗ is defined. Find g ◦f ∗.
y
x
1
1
2
2
3
3
4
4
5
5
– 1
– 1
– 2
– 2
– 3
– 3
– 4
– 4
– 5
– 5
1
1
2
2
3
3
4
4
5
5
– 1
– 1
– 2
– 2
– 3
– 3
– 4
– 4
– 5
– 5
f (x) = x2 − 1 To be defined, Range of f needs to be restricted to
R+ U {0}
Restrict Domain of f*: R\ (-1,1)
2
2
*( ) ( *( ))
( 1)
1
gof x g f x
g x
x

Inverses:
A function has an inverse function if and only if it is one-to-one. ie. Passes
both the vertical and horizontal line test
. Example: f is the function defined by f (x) = x ∈ R\{0}.
Define a suitable restriction for f, f ∗, such that f ∗−1 exists.
2
1
x
NB. f is not a 1-1 function
If f* has domain (- , 0) f is one to one. Range: (0, )
2
2
2
2
1
1
1
1
1
yx
Inverse
xy
xy
yx
yx
Hence
and its domain is
(- , 0) An inverse is only
defined if it has a domain,
which ensures the function is
1-1!
1 1f
x

Matrices:
1. Dimensions: r x c, eg 3 x 2
2. Addition:
3. Multiplying: An n x m can multiply a m x p, giving an n x p
4. Inverse: A x A-1 = I
1 0
0 1I

Transformations:
Sketch the graph of the image of the graph shown under the following
sequence of transformations:
a reflection in the x-axis
a dilation of factor 3 from the x-axis
a translation of 2 units in the positive direction of the x-axis and 1 unit in the
positive direction of the y-axis.

Transformations:

Simultaneous Equations:
The graph of a cubic function passes through the point with coordinates (0, 1), (1, 4),
(2, 17) and (−1, 2). Find the rule for this cubic function
Menu / 3: Algebra / 6: Solve system /
1: Solve system of Equations / 4 eqns a,b,c,d
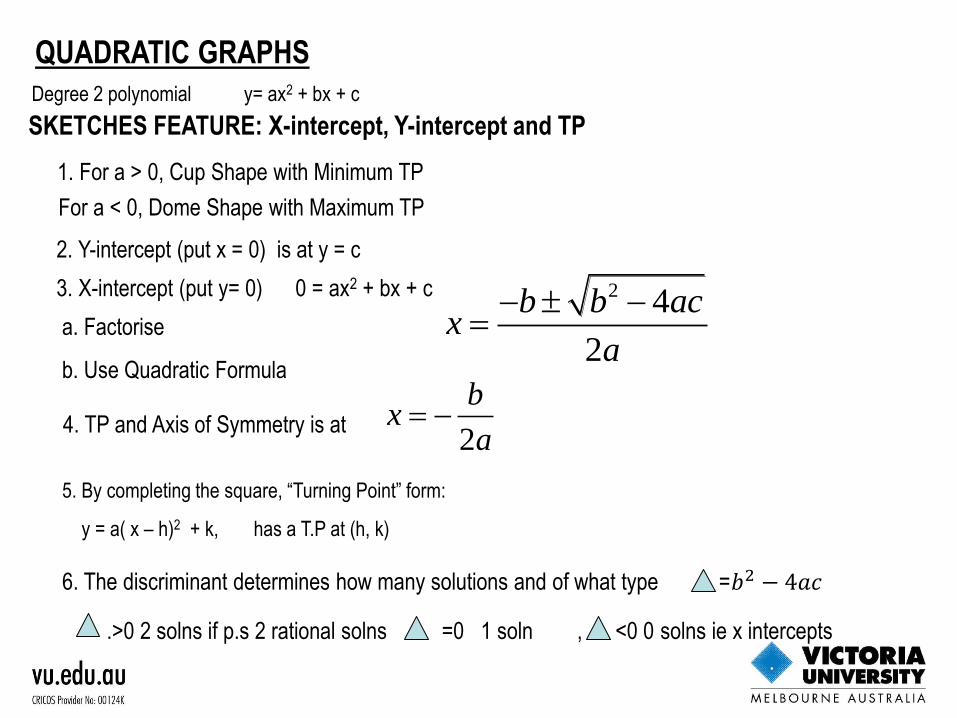
QUADRATIC GRAPHS
Degree 2 polynomial y= ax2 + bx + c
2. Y-intercept (put x = 0) is at y = c
SKETCHES FEATURE: X-intercept, Y-intercept and TP
1. For a > 0, Cup Shape with Minimum TP
For a < 0, Dome Shape with Maximum TP
3. X-intercept (put y= 0) 0 = ax2 + bx + c
a. Factorise
b. Use Quadratic Formula
2 4
2
b b acx
a
4. TP and Axis of Symmetry is at
2
bx
a
5. By completing the square, “Turning Point” form:
y = a( x – h)2 + k, has a T.P at (h, k)
6. The discriminant determines how many solutions and of what type =𝑏2 − 4𝑎𝑐
.>0 2 solns if p.s 2 rational solns =0 1 soln , <0 0 solns ie x intercepts

CUBIC GRAPHS:
Degree 3 polynomial y= ax3 + bx2 + cx + d
SKETCHES FEATURE: X-intercepts, Y-intercept, shape (TP & POI’s)
1. For a > 0, Increasing Function “positive cubic”
For a < 0, Decreasing Function “negative cubic”
2. Y-intercept (put x = 0) is at y = d
3. X-intercept (put y = 0) then factorise.
4. FACTOR FORM: y = a(x – b)( x – c)( x – d)
REPEATED FACTOR:
y = (x – a)2(x – b)
y
xb c d
y
x
a b

EXAMPLES:
For each of the following graphs, find the rule and express it in factorised
form. Assume that a = 1 or a = −1.
Increasing Fn. a = 1
y = (x - -4)(x – 0)(x – 3)
y= x(x + 4)(x – 3)
Decreasing Fn. a = -1
y = -1(x - -2)2(x – 3)
y= (x + 2)2(3 – x)
y
x-3 2 5
In factorised form: f(x) = (x- 2)(x- 5)(x+ 3)
X- intercepts 0= (x- 2)(x- 5)(x+ 3)
x = 2, 5, -3

QUARTICS:
Degree 4 polynomial y= ax4 + bx3 + cx2 + dx + e
SKETCHES FEATURE: X-intercepts, Y-intercept, Shape
1. For a > 0, Increasing Function “positive quartic”
For a < 0, Decreasing Function “negative quartic”
2. Y-intercept (put x = 0) is at y = e
3. X-intercept (put y = 0) then factorise.
SOME BASIC QUARTICS
y = ax4
y
x
y = ax4 + cx2
y = x2(ax2 + c)
y
x

Exam Examples:

Logarithms:
Change of base:
b Find log of both si
l
loglog
log
log
og log
log
log
des
y
b
ba
b
b
y
b
a
b
NN
a N
y
a N
Ny
N
a
a
Some Examples:
1.
3
3
3
log 27
log 27
lo
log
g 3
3
3
e
e
2. 1
2
10
10
log 6
log .5
2.585
log 6
3. If log2 6 = k log2 3 + 1, find the value of k.
2 2 2
2 2
log 6 log 3 log 2
log 6 log (2 3 )
6 2 3
3 3
1
k
k
k
k
k

Logarithmic Graphs:
y = log2(x – 5)+1 y = -log
3(x + 4)
Sketch the graph, and state the domain of each of the following:
•Trans 5 in positive x
•Trans 1 in positive y
•Asymptote: x = 5
•(x-5)=1, x = 6, y = 1
•(x-5)=2, x = 7, y = 2
•Reflected in x-axis
•Trans 4 in negative x
•Asymptote: x = -4
•(x+4)=1, x = -3, y = 0
•(x+4)=3, x = -1, y = -1
Domain: (5, ) Domain: (-4, )

Circular Functions and Transformations:
Sketch 3sin 2( ) for 24
y t t
Amplitude: 3
2Period:
2
Translated in positive direction of x-axis4
DRT- Dilation 3 units from the x axis( in y direction
or parallel to y axis)
Dilation of 1/2 units from the y axis ( in x direction or
parallel to x axis)
No reflections or translations
y
x
4
4
2
2
3
4
3
4
5
4
5
4
3
2
3
2
7
4
7
4
2
2
–
4
–
4
–
2
–
2
–3
4
–3
4
–
–
3
3
– 3
– 3

More Circular Functions:
Sketching, finding axes intercepts for x[ 0, 2π ]
2sin 2( ) 33
y x
x-axis intercepts, y = 0
Amplitude:2
Translated 3 unit in neg y axis
Range: [-2 - 3, 2 - 3]

Features of f(x) = atan(n x):
y
x
4
4
2
2
3
4
3
4
5
4
5
4
3
2
3
2
7
4
7
4
2
2
9
4
9
4
5
2
5
2
11
4
11
4
3
3
–
4
–
4
–
2
–
2
–3
4
–3
4
–
–
1
1
2
2
3
3
4
4
5
5
– 1
– 1
– 2
– 2
– 3
– 3
– 4
– 4
– 5
– 5
Period: π
x = (2k +1)π/2 for k Z
Asymptotes : π/2, 3π/2, 5 π
/2…
x = kπ/n for k Z
x-intercepts
x = kπ for k Z
a is a dilation
factor from the
x-axis ( not
important)
Dilation factor of 1/n from the y-axis
π/n is the period hence

INSIGHT TRIAL EXAM 1 2010
The answer is A
Write out equations in full
0𝑥 + 0𝑦 + 1𝑧 = 1−1𝑥 + 1𝑦 + 0𝑧 = 21𝑥 + 1𝑦 + 0𝑧 = 5

Difficult sketch graphs 13
3tan(2 ) 3 for 3 6 6
y x x
Must factorise bracket.. 3tan 2( ) 36
y x
Period = π/2 Dilation of 3 from x-axis Translated π/6 in positive x,
3 in positive y
(2 1)
4 6
3 5, , ...
4 6 4 6 4 6
5 11 17, , ...
12 12 12
kAsymptotes x
x-intercepts
3 tan 2( - ) 3 06
3tan 2( - )
6 3
5 11 17 232( - ) , , ,
6 6 6 6 6
5 11 17 23- , , ,
6 12 12 12 12
7 13 19 25, , ,
12 12 12 12
x
x
x
x
x
Sketch

Solving Circular Function Equations: Using CAS:
Find the general solutions and then find the first three positive solutions:
a cos (x) = 0.5 b √3 tan (3x) = 1
Find the specific solutions of:
c cos (x)= ½ 𝑥 ∈ 0,2𝜋 d √3 tan (3x) = 1 𝑥 ∈ 0,2𝜋

Solving Circular Function Equations: by hand
Find without the use of a calculator, the following between 𝑥 ∈ 0, 𝜋
2𝑥 ∈ 0,2𝜋
𝑥 = sin−12
2
𝑥 =𝜋
4
3. Quadrants 1 and 2
(sin positive)
1. Domain
2. Core Angle

Differentiation:
For the graph of f : R →R find:
a {x: f ‘(x) > 0}
b {x: f ‘(x) < 0}
c {x: f ‘(x) = 0}
{ : '( ) 0} { 1 5} or ( 1,5)
{ : '( ) 0} { 1} { 5} or ( , 1) (5, )
{ : '( ) 0} { 1,5}
x f x x
x f x x x
x f x
d. Sketch the gradient function
Tangent neg grad
Tangent neg grad
Tangent pos grad

Differentiation:
Differentiate: y = (4x3 – 5x)-2
1.Chain Rule: a function inside another function
Let u = 4x3 – 5x y = u ( )-2
dy dy du
dx du dx
= -2 ( u )-3 x ( 12x2 - 5 )
= -2 (4x3 – 5x)-3 x ( 12x2 - 5 ) 2
3 3
2(12 5)
(4 5 )
x
x x
2
16
3 1y
x
e.g3
. 2 116(3 1)y x
Find the derivative of x4 − 2x−3 + x−1 + 2, x 0 4 3 1
3 4 2
3 4 2
( ) 2 2, 0
'( ) 4 2( 3 ) ( 1) (0)2
4 6
f x x x x x
f x x x x
x x x
Differentiate with respect to x: x3 ( 3x -5 )4
2.Product Rule: one function is multiplied by another
3 4(3 5)xy x
3
3 3 2 4
2 3
2 3
3 42
12 (3 5) 3 (3 5)
3 (3 5) 4 (3 5)
3 (
4 (
3 5) (7 5)
3)(3 5) 3 (3 5)
dy d d
dx dx dx
x x
vv
x
u
x x
x x x x
x
xx
x
x
x
u
𝑢 = 𝑥3
𝑢′ = 3𝑥2 𝑣 =𝑣′ =
( 3x -5 )4
4(3)( 3x -5 )3

Differentiation: cont
Quotient Rule: one function divided by the other
e.g. 2
2
4 1y
x
x
x
2
d d
dy dx dx
dx
uu
vv
v
2
22
(1) ( 2( 4 1) (2 4)
( 4
)
1)
x x xx
x x
2 2
2 2
4 1 (2 8)
( 4 1)
x x x
x x
2
2 2
4 9
( 4 1)
x x
x x
𝒖 = 𝒙 − 𝟐𝒖′ = 𝟏
𝐯 = (𝒙𝟐 + 𝟒𝒙 + 𝟏
𝐯′ = 𝟐𝒙 + 𝟒

Differentiation applications:
Find the equations of the tangent and normal to y = x3 + 1/2x2 at the point where x = 1
1.Find dy/dx dy/dx = 3x2 + x
2.Put the x value into dy/dx At x = 1
dy/dx = 3 + 1 = 4
3. At x = 1
y – y1 = mT(x – x1) with the point,
find the equation of the tangent
(x1 , y1) becomes ( 1,3/2 )
y – 3/2 = 4 (x – 1)
2y – 3 = 8x – 8
2y = 8x - 5
4.At x = 1
y – y1 = mn(x – x1) with the
point, find the equation of the
normal
(x1 , y1) becomes ( 1,3/2 )
y – 3/2 = -1/4 (x – 1)
4y – 6 = -x + 1
0 = x + 4y- 5

Linear Approximation:
1
2
Let ( )
1So '( )
2
1
2
f x x
f x x
x
( ) ( ) '( )f x h f x hf x
0
( ) ( )'( ) lim
h
f x h f xf x
h
( ) ( )'( )
f x h f xf x
h
Assuming h is small
= 𝑥 + 2 ∗1
2 𝑥
Find the approximate value of 27 without using a calculator
=5+1/5
=5 1/5
25 + 2 = 𝑥 + ℎ

Stationary Points:
Plot the graph of y = x3 − 19x + 20 and determine:
a the value of y when x=−4
b the values of x when y = 0
c the value of when x=−1
d the coordinates of the local maximum
dy
dx

Absolute Max and Min Points and Max and Min Problem:
Let f : [−2, 4] → R, f (x) = x2 + 2. Find the absolute maximum and the absolute minimum
value of the function. From graph, maximum occurs at x = 4, and is 18
From graph, minimum occurs at x = 0, and is 2
e.g.From a square piece of metal of side length 2 m, four squares are removed as shown
in the figure opposite. The metal is then folded about the lines to give an open box with
sides of height x m. Find the domain and then sketch the graph of V against x.
2 2 0
2
Dom
1
0
ai
2
1
n
0
x
x
x
x
x
2
2
12 16 4
Local max occurs when 0
0 4(3 4 1)
0 4(3 1)( 1)
1,1
3
dVx x
dx
dV
dx
x x
x x
x
1Local Max occurs at
3
1 1 14 8 4
27 9 3
16
27
x
V
𝑉 = 𝑥(2 − 2𝑥)(2 − 2𝑥)
𝑉 = 𝑥(2𝑥 − 2)(2𝑥 − 2)
𝑉 = 𝑥(4𝑥2 − 8𝑥 + 4)
𝑉 = 4𝑥3 − 8𝑥2 + 4𝑥

Derivatives:
f(x) = logex, then f’(x) =
1
x
f(x) = logekx, then f’(x) = 1
x
3( ) log 5 3 ,
5ef x x x
h(x) = logef(x), then h’(x) = '( )
( )
f x
f x
2
2
Product
log ,
rule
0
12 log
2 log
e
e
e
dyx x x
dx x
x x x
y x x x
2
2
4
3
2
2
Quotient rule
12 log
( )
2 log
1 2
log. 0
log
e
e
e
e xy x
x x xdy x
dx x
x x x
x
x
x
x
𝒖 = 𝒙𝟐
𝒖′ = 𝟐𝒙 𝒗 = 𝒍𝒐𝒈𝒆𝒙
𝐯′ = 𝟏/𝒙
𝒖 = 𝒙𝟐
𝒖′ = 𝟐𝒙
𝒗 = 𝒍𝒐𝒈𝒆𝒙
𝐯′ = 𝟏/𝒙
𝑦 = 𝑥2log𝑒𝑥 e.g e.g 𝑦 =log𝑒𝑥
𝑥2
5'( )
5 3f x
x

Derivatives of Circular functions:
f(x) f’(x)
Sin kx kCos kx
Cos kx - kSin kx
Tan kx 2
2sec
cos
kk x
xk
k
Find the derivative of each of the following with respect to :
e.g. sin2(2 + 1) 2( )
2sin
Chain rule
4sin(2 1)co
sin(2 1)
2co
s(2
s(2 1)( 1
)
)
1
2dy
d
2
2
2
2
2
(tan )
s
(3 1
ec
Chai
(3
n rule
6 sec (3 1)
1)
)
6dy
d
e. g. tan(3𝜃2 + 1)
e.g. e2xSin( 2x + 1)
2 2
2
Product rule
2cos(2 1) 2 sin(2 1)
2 [cos(2 1) sin(2 1)]
x x
x
dye x e x
dx
e x x

Antiderivative: 1( )
( )( 1)
nn ax b
ax b dn
xa
c
Find the general antiderivative of:
a (3x + 1)5
6
5
6
(3 1)
(3 1)
3
1(3 1)
18
6
x dx
xc
x c
1logedx x c
x
1 1logedx ax b c
ax b a
b (2x − 1)−2

Further Antiderivatives:
1kx kxe dx e ck
Find the general antiderivative of each of the following:
3
3
2
12
3
x
x
e dx
e x c
If the gradient at a point (x, y) on a curve is given by
5e2x and the curve passes through (0, 7.5), find the
equation of the curve.
2
2
2
0
2
5
5
5
2
At (0,7.5)
57.5
2
5
55
2
x
x
x
x
dye
dx
y e dx
e c
e c
c
y e

Area under Curves: COMBINED AREAS
( ) ( ) ( )
cb b
a ac
f x dx f x dx f x dx
( ) ( )
b
c
a
c
or f x dx f x dx
IT IS IMPORTANT TO SKETCH THE FUNCTION TO UNDERSTAND THE
NATURE OF THE AREA
e.g.Find the exact area of the shaded region 4 2
2 2
2 1
4 13 3
2 2
4 dx 4 dx
4 43 3
64 8 1 8( 16) ( 8) ( 4) ( 8)
3 3 3 3
64 8 1 816 8 4 8
3
494
3
37 sq units
3
A x x
x xx x

Antidifferentiation by Recognition
a. Find f’(x) 𝑓(𝑥) = 𝑥log𝑒(𝑘𝑥)
𝑓′(𝑥) = log𝑒(𝑘𝑥) + 𝑥 ∗1
𝑥= log𝑒(𝑘𝑥) + 1
𝐾𝑛𝑜𝑤 log𝑒(𝑘𝑥) + 1𝑑𝑥 = 𝑥log𝑒 (𝑘𝑥) + 𝑐
𝑠𝑜 log𝑒(𝑘𝑥)𝑑𝑥 + 1𝑑𝑥 =𝑥log𝑒(𝑘𝑥) + 𝑐
log𝑒(𝑘𝑥)𝑑𝑥 = − 1𝑑𝑥 +𝑥log𝑒(𝑘𝑥) + 𝑐
log𝑒(𝑘𝑥)𝑑𝑥 = − 𝑥 + 𝑥log𝑒(𝑘𝑥) + 𝑐
b. Hence find
𝑓(𝑥) = 𝑥2log𝑒(𝑘𝑥)
𝑓′(𝑥) = 2𝑥log𝑒(𝑘𝑥) + 𝑥2 ∗1
𝑥= 2𝑥log𝑒(𝑘𝑥) + 𝑥
𝐾𝑛𝑜𝑤 2𝑥log𝑒(𝑘𝑥) + 𝑥𝑑𝑥 =𝑥2log𝑒(𝑘𝑥) + 𝑐
𝑠𝑜 2𝑥log𝑒(𝑘𝑥)𝑑𝑥 + 𝑥𝑑𝑥 =𝑥2log𝑒(𝑘𝑥) + 𝑐
2𝑥log𝑒(𝑘𝑥)𝑑𝑥 = − 𝑥𝑑𝑥 +𝑥2log𝑒(𝑘𝑥) + 𝑐
2𝑥log𝑒(𝑘𝑥)𝑑𝑥 = − 1 2 𝑥2+ 𝑥2log𝑒(𝑘𝑥) + 𝑐
𝑥log𝑒(𝑘𝑥)𝑑𝑥 =1 4 𝑥2log𝑒(𝑘𝑥) −
𝑥2
4+ 𝑐
𝒍𝒐𝒈𝒆(𝒌𝒙)𝒅𝒙 =
a. Find f’(x) b. Hence find
𝒙𝒍𝒐𝒈𝒆(𝒌𝒙)𝒅𝒙 =

Linear Equations:

EXPECTED VALUE OF DRVs:
Expected Value = Mean = Average =
1 1 2 2 3 3
( ) Pr( )
( ) ( ) ( ) ... ( )
x
n n
E x x X x
x p x x p x x p x x p x
E(x) = 1 x 2/5 + 2 x 1/10 + 3 x 3/10 + 4 x 1/10 + 5 x 1/10
E(x) = 2 2/5
( ) . ( )
0 .064 1 .288 2 .432 3 .216
0 .288 .864 .648
1.8
E x x p x
e.g.1
e.g.2

Discrete Random Variables:
Within a Probability Distribution, the expectation of another function can be
considered… Eg. Biased coin “Three up”: Costs $2 to play, returns as shown.
What is the expected profit /loss?
Return r(y) $6 $1 $0 $5
Gain g(y) $4 -$1 -$2 $3
( ) ( ) ( )
6 0.064 1 0.288 0 0.432 5 0.216
1.752
E R r y p x
Expected profit = 1.752 – 2 = -0.248
g(y) = r(y) -2
( ) ( ( ) 2) ( )
(6 2)0.064 (1 2)0.288 (0 2)0.432 (5 2)0.216
0.248
E G r y p x

Binomial Distributions:
Mean:E(x) = = np Variance: Var(x) = 2 = npq Standard Deviation:SD(x) = =(npq)
Eg 1. A fair die is rolled 15 times. Find:
a. the expected number of 3s rolled
b. the standard deviation
a. E(x) = np
= 15 x 1/6
= 2.5
b. Var(x) = npq
= 15 x 1/6 x 5/6
= 2.08
SD(x) = (npq)
=(2.08)
=1.44
c. 95% lies between
2.5+2x1.44=6.48
2.5-2x1.44=.72
NB. These formulae are not on the formula sheet

Markov Chains:
Suppose that the probability that a bus is late, given that it is late the previous day, is
0.15, while the probability that it is on time if it is on time the previous day is 0.90.
a Find the transition matrix that can be used to represent this information.
b What is the probability that the bus will be late on day 3:
i if it is on time on day 0? ii if it is late on day 0?
0
3
3
0
1
0.15 0.1 0 0.1053
0.85 0.9 1 0.8948
S
S
𝑇 =
condition
0
3
3
1
0
0.15 0.1 1 0.1054
0.85 0.9 0 0.8946
S
S

Steady State:
Ciara is a good netballer. She plays goal shooter in her team and knows that from past experience her
probability of scoring a goal depends on the success of her previous attempt. She knows that if she scored
a goal previously then her probability of scoring a goal on the next attempt is 0.7. If she is unsuccessful on
the previous attempt, her probability of being unsuccessful on the next attempt is 0.8.
a. If she has scored a goal, what is the chance of her not scoring on her next attempt?
b. She has five shots at goal. Her attempt is a goal. What is the probability that it takes her until her final
shot to score another goal?
c. Find the probability of Ciara scoring a goal in the long term.
1
1
n
T
b b
a b a bT
a a
a b
b
b
a
a b
a
Example: 2010 INSIGHT Exam 1:

Normal Distribution:
Using Ti-nspire: NormCdf(lower, upper,0,1) for Z values
Pr(Z ≤ 1.327)
Pr(-1 Z ≤ 2.5)
Using CAS: X values
If X is the IQ test, normally distributed with = 100 and = 15
What proportion of the population have an IQ greater than 125?
Pr (x > 125)

Inverse Normal: Probability given
If X is the IQ test, normally distributed with = 100 and = 15
Between what IQ values does 90% of the population lie?
5% =0.05 5% =0.05
90% =0.9
Between 75.3 and 124.7

General Comments 2011 Exam 2
• Marks ranged from 2 to 79 out of a possible score of 80.
• Mean- 44 compared with 40 in 2007. Median- 45 marks. Of the whole cohort, 12% of students scored 85% or more of the available marks, and 26% scored 75% or more of the available marks.
• The mean score for the multiple-choice section was 13 (out of 22)
• As stated in the instructions, students must show appropriate working for questions worth more than one mark
• Ensure you: read questions carefully, give answers to the required accuracy, transcribe the correct equation, provide answers to all parts of the question, answer the question that is being asked and after completing a question students, should reread the question.
• Exact answers were required for the intercepts

New content to the course:
• General solutions to trigonometric equations
• Average value of a function
• Functional Equations
• Matrices – transformations, transition matrices and steady state
• Solving simultaneous equations

General Comments
• Correct mathematical notation is expected and should always be used
• Students must use the units that are given in the question
• Use the units that are given in the question- do not convert units unless the question asks for the answer to be in a specific unit.
• From 2010, it will be assumed that students will provide exact answers to questions unless specified otherwise
• Many students gave the exact answer and then wrote down an approximate answer. The final answer will be considered the final answer!
• Students should retain sufficient decimal place accuracy in computation to ensure that they can provide numerical answers to a specified accuracy
• Students should take care when sketching graphs. If they are subsequently required to sketch over part of a graph, they need to make the relevant parts visible
• More care needs to be taken with closed and open circles for end points ( gradient graphs)

2009 VCAA EXAM 2-Multiple Choice
49% B
If det=0 there is no inverse and hence no solution. Therefore

95% C
Sketch on CAS
Notice the cubic is in the inflexion point form-
POI=(1,1) 𝑑𝑦
𝑑𝑥= 3 x− 1 2
𝑑𝑦
𝑑𝑥= 0
𝑥 = 1

86% B
The maximum domain of 𝑓(𝑥) = log𝑒(2𝑥 + 1) occurs when
𝑓(𝑥) = log𝑒(2𝑥 + 1)
2𝑥 + 1 > 0
𝑥 > −1
2

55% A

53% D
For a functional equation, a CAS
output of ‘true’ indicates that it is
always true. An output of ‘false’
indicates that is never true. Any
other output indicates that it is
sometimes true but not always

64% D

84% B
Using CAS, evaluate when x = 0.

79% C

49% E
A very clever Q!

72% B
The median is the 50th percentile which is x = 1.

61% D
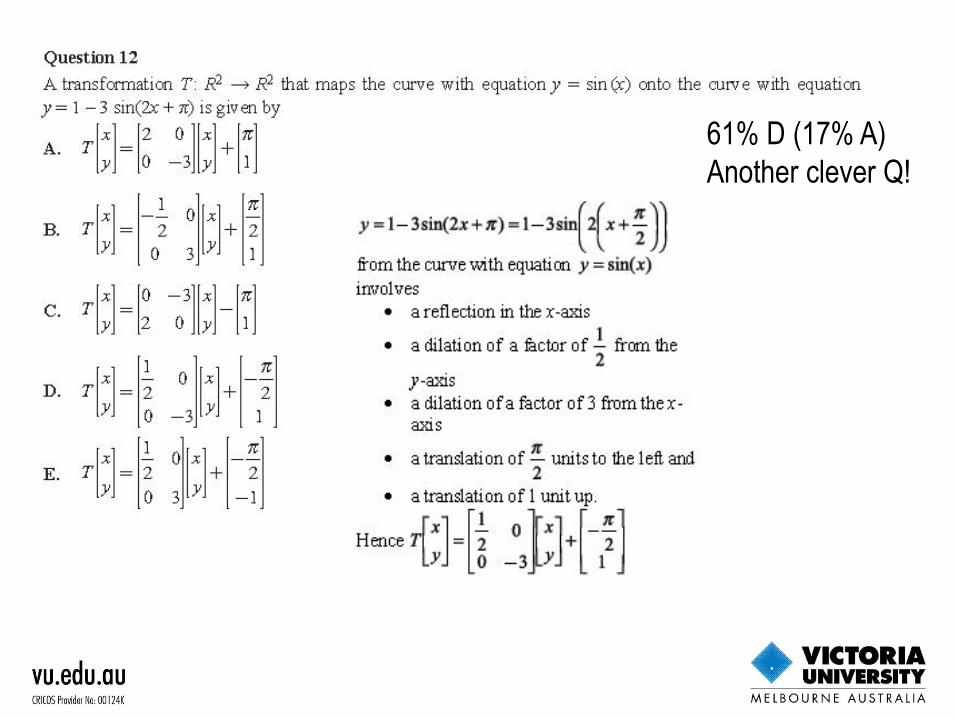
61% D (17% A)
Another clever Q!

71% C
𝑋 − 𝐵𝑖(12,0.5)
Pr(𝑋 ≤ 4) =

59% D

74% E An Excellent Q
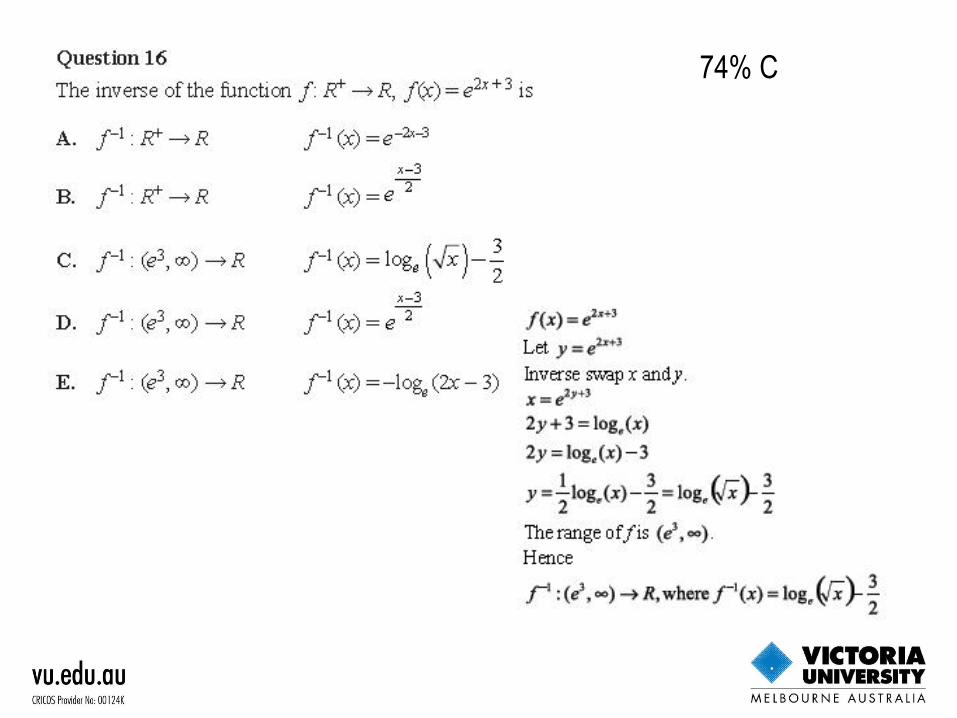
74% C

31% A 43% B

52% B

66% E
The graph of 𝑓 has been reflected in
the x-axis, dilated by a factor of 1
2 from
the y-axis and then translated 1 unit up.

34% E 28% B

43% B 24%A

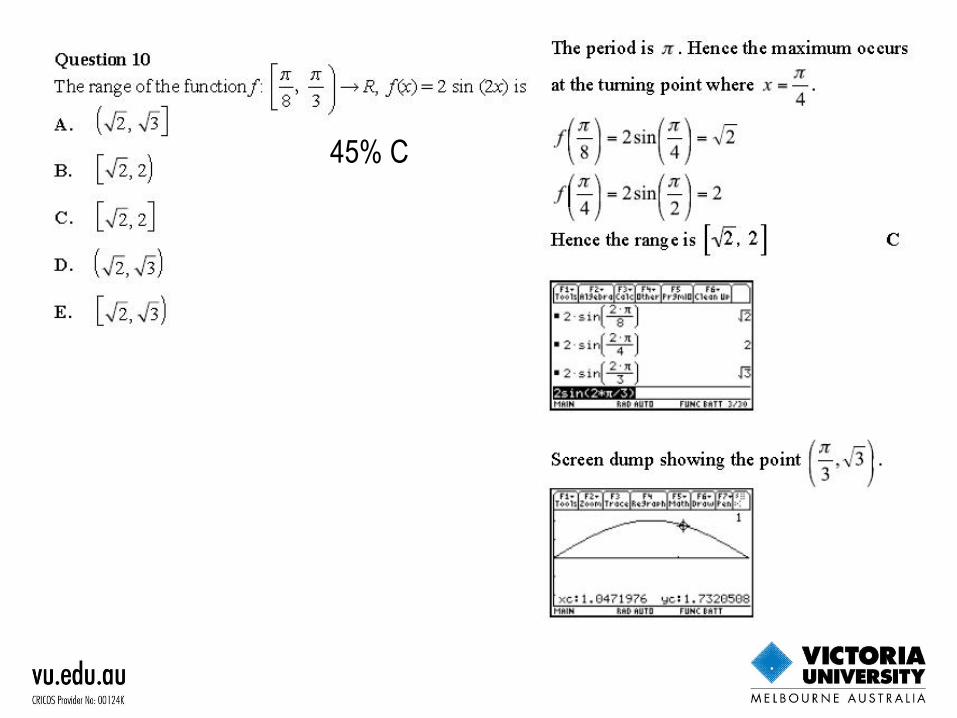
45% D 21% C

General Comments 2011
• 15,494
• Students who were pedantic about the use of maths conventions and notation were less likely to lose marks for careless errors
• Time management was an issue- use the reading time
• If a*b=0 then a=0 or b=0 or both can be 0
• G(x)*F(x)=F(x)*k(x)
• Show questions- can’t use the information given
• Integrate Q’s must have dx
• Inequalities- draw a graph y> (x+2)(x-4)
• Coordinates
• Ensure you: read questions carefully, give answers to the required accuracy, transcribe the correct equation, provide answers to all parts of the question, answer the question that is being asked and after completing a question students, should reread the question.
• Exact answers were required for the intercepts

2008 VCAA EXAM 2:
73% C

93% C

59% D
22% of the students found the average
rate of change and not average
value

68% E Simult
eqns involving
Bi
Distribution-
Clever Q

86% D
45% C

76% D

44% C

60% D
0
0
( ,0.5)
Pr( 0) .0005
(1/ 2) (1/ 2) .0005n
X Bi n
X
nC

52% C

89% B

36% E

50% B
The graph shown in the next
column is the
derivative of the graph that is
required. The derivative is
always positive and a
maximum at x = 0.

50% B

75% D

53% C
𝑓(𝑥) = 0 for x = 5 but is
discontinuous at 𝑥 = −2. Hence C is false.

VCAA 2010
60% D

69% E

83% D

80% B

51% B

81% A

83% C

60% B

77% D

25% D
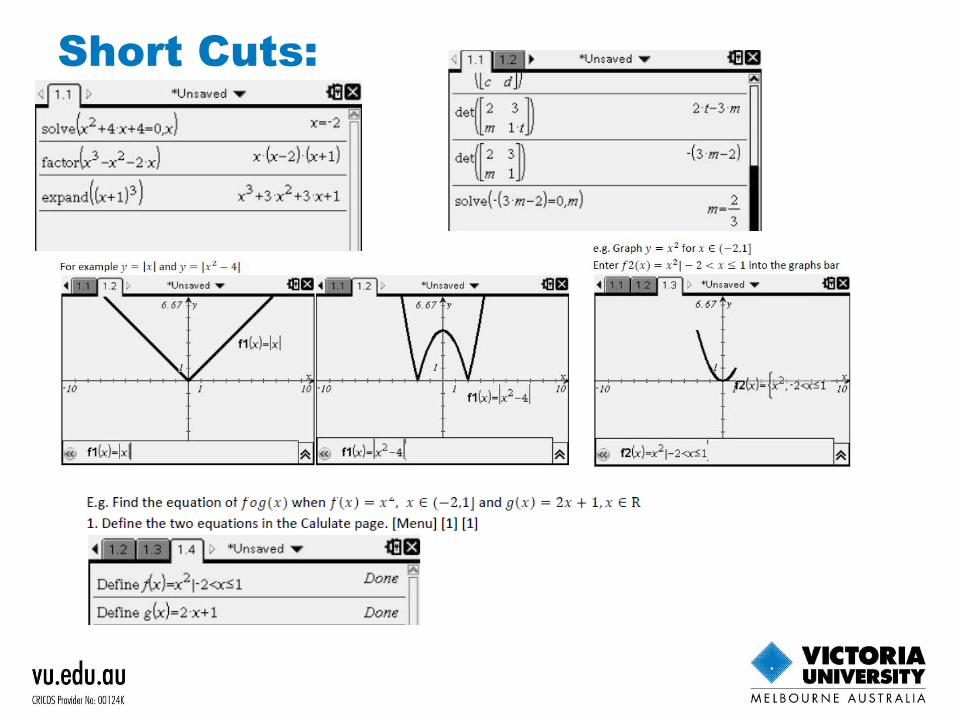
Short Cuts:

Short Cuts: cont.

More short cuts:

NAME Ms ROSEMARY WARD
DEPARTMENT MATHEMATICS
XAVIER COLLEGE
PHONE +61 3 9854 5479
EMAIL [email protected]
Sources:
• VCCA website ( assessment reports and past papers) • INSIGHT solutions • Xavier College Maths Methods Power Points- P.Burke • Essential Mathematics Text
CONTACT DETAILS