vce graded assessment 2018 · 2019-09-18 · accounting graded assessment 1 coursework unit 3 2018...
TRANSCRIPT
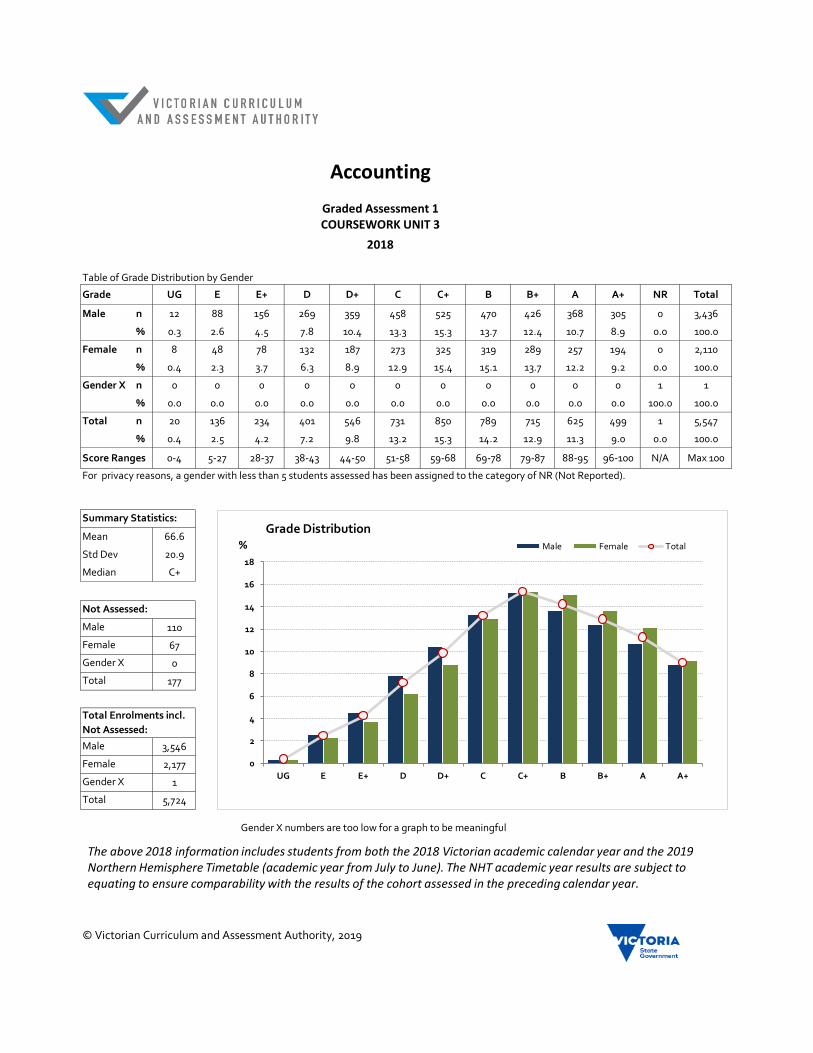
Table of Grade Distribution by Gender
Grade UG E E+ D D+ C C+ B B+ A A+ NR Total
Male n 12 88 156 269 359 458 525 470 426 368 305 0 3,436
% 0.3 2.6 4.5 7.8 10.4 13.3 15.3 13.7 12.4 10.7 8.9 0.0 100.0
Female n 8 48 78 132 187 273 325 319 289 257 194 0 2,110
% 0.4 2.3 3.7 6.3 8.9 12.9 15.4 15.1 13.7 12.2 9.2 0.0 100.0
Gender X n 0 0 0 0 0 0 0 0 0 0 0 1 1
% 0.0 0.0 0.0 0.0 0.0 0.0 0.0 0.0 0.0 0.0 0.0 100.0 100.0
Total n 20 136 234 401 546 731 850 789 715 625 499 1 5,547
% 0.4 2.5 4.2 7.2 9.8 13.2 15.3 14.2 12.9 11.3 9.0 0.0 100.0
Score Ranges 0-4 5-27 28-37 38-43 44-50 51-58 59-68 69-78 79-87 88-95 96-100 N/A Max 100
Mean 66.6
Std Dev 20.9
Median C+
110
67
0
177
3,546
2,177
1
5,724
Gender X
Total
Gender X numbers are too low for a graph to be meaningful
© Victorian Curriculum and Assessment Authority, 2019
Male
Female
Gender X
Total
Total Enrolments incl.
Not Assessed:
Male
Female
Accounting
Graded Assessment 1COURSEWORK UNIT 3
2018
Not Assessed:
Summary Statistics:
For privacy reasons, a gender with less than 5 students assessed has been assigned to the category of NR (Not Reported).
No graph is supplied for this GA as student numbers are too small for a graph to be meaningfull.
The above 2018 information includes students from both the 2018 Victorian academic calendar year and the 2019 Northern Hemisphere Timetable (academic year from July to June). The NHT academic year results are subject to equating to ensure comparability with the results of the cohort assessed in the preceding calendar year.
0
2
4
6
8
10
12
14
16
18
UG E E+ D D+ C C+ B B+ A A+
%
Grade DistributionMale Female Total

Table of Grade Distribution by Gender
Grade UG E E+ D D+ C C+ B B+ A A+ NR Total
Male n 20 14 33 135 254 369 407 455 498 578 511 0 3,274
% 0.6 0.4 1.0 4.1 7.8 11.3 12.4 13.9 15.2 17.7 15.6 0.0 100.0
Female n 4 8 17 63 124 206 248 285 326 400 326 0 2,007
% 0.2 0.4 0.8 3.1 6.2 10.3 12.4 14.2 16.2 19.9 16.2 0.0 100.0
Gender X n 0 0 0 0 0 0 0 0 0 0 0 1 1
% 0.0 0.0 0.0 0.0 0.0 0.0 0.0 0.0 0.0 0.0 0.0 100.0 100.0
Total n 24 22 50 198 378 575 655 740 824 978 837 1 5,282
% 0.5 0.4 0.9 3.7 7.2 10.9 12.4 14.0 15.6 18.5 15.8 0.0 100.0
Score Ranges 0-9 10-13 14-22 23-30 31-37 38-45 46-53 54-63 64-74 75-88 89-100 N/A Max 100
Mean 63.4
Std Dev 21.5
Median B
272
170
0
442
3,546
2,177
1
5,724
Gender X
Total
Gender X numbers are too low for a graph to be meaningful
© Victorian Curriculum and Assessment Authority, 2019
Male
Female
Gender X
Total
Total Enrolments incl.
Not Assessed:
Male
Female
Accounting
Graded Assessment 2COURSEWORK UNIT 4
2018
Not Assessed:
Summary Statistics:
For privacy reasons, a gender with less than 5 students assessed has been assigned to the category of NR (Not Reported).
No graph is supplied for this GA as student numbers are too small for a graph to be meaningfull.
The above 2018 information includes students from both the 2018 Victorian academic calendar year and the 2019 Northern Hemisphere Timetable (academic year from July to June). The NHT academic year results are subject to equating to ensure comparability with the results of the cohort assessed in the preceding calendar year.
0
5
10
15
20
25
UG E E+ D D+ C C+ B B+ A A+
%
Grade DistributionMale Female Total
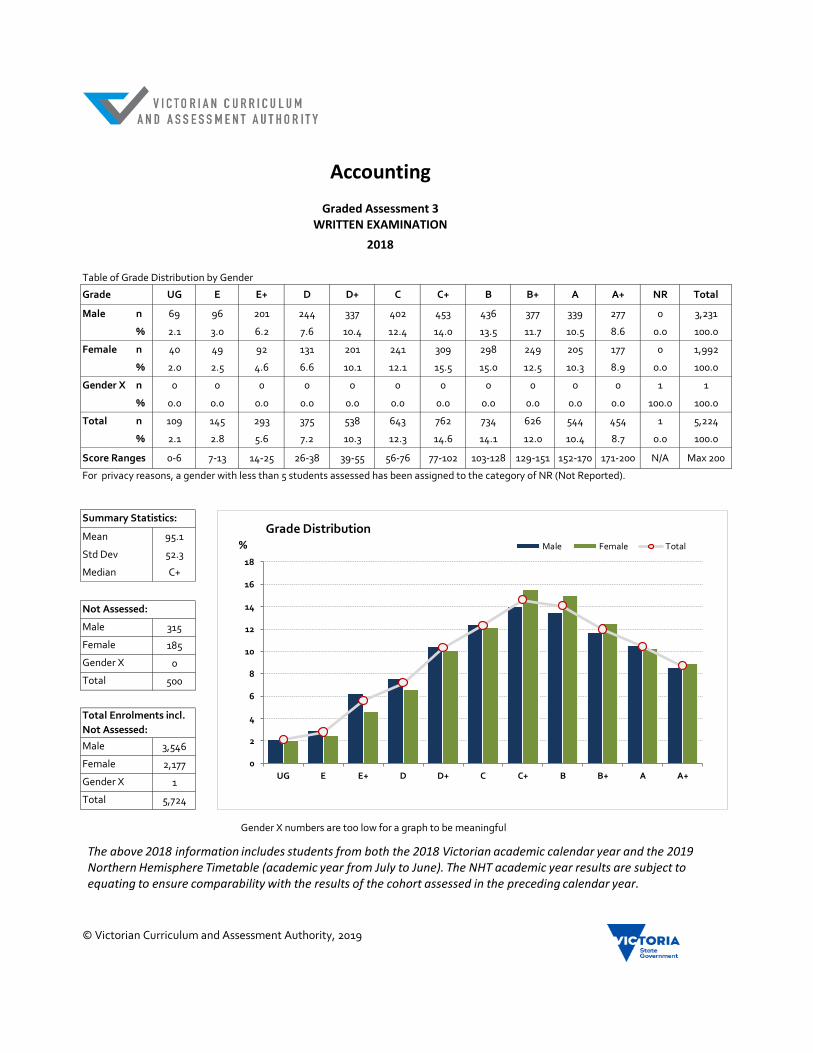
Table of Grade Distribution by Gender
Grade UG E E+ D D+ C C+ B B+ A A+ NR Total
Male n 69 96 201 244 337 402 453 436 377 339 277 0 3,231
% 2.1 3.0 6.2 7.6 10.4 12.4 14.0 13.5 11.7 10.5 8.6 0.0 100.0
Female n 40 49 92 131 201 241 309 298 249 205 177 0 1,992
% 2.0 2.5 4.6 6.6 10.1 12.1 15.5 15.0 12.5 10.3 8.9 0.0 100.0
Gender X n 0 0 0 0 0 0 0 0 0 0 0 1 1
% 0.0 0.0 0.0 0.0 0.0 0.0 0.0 0.0 0.0 0.0 0.0 100.0 100.0
Total n 109 145 293 375 538 643 762 734 626 544 454 1 5,224
% 2.1 2.8 5.6 7.2 10.3 12.3 14.6 14.1 12.0 10.4 8.7 0.0 100.0
Score Ranges 0-6 7-13 14-25 26-38 39-55 56-76 77-102 103-128 129-151 152-170 171-200 N/A Max 200
Mean 95.1
Std Dev 52.3
Median C+
315
185
0
500
3,546
2,177
1
5,724
Gender X
Total
Gender X numbers are too low for a graph to be meaningful
© Victorian Curriculum and Assessment Authority, 2019
Male
Female
Gender X
Total
Total Enrolments incl.
Not Assessed:
Male
Female
Accounting
Graded Assessment 3WRITTEN EXAMINATION
2018
Not Assessed:
Summary Statistics:
For privacy reasons, a gender with less than 5 students assessed has been assigned to the category of NR (Not Reported).
No graph is supplied for this GA as student numbers are too small for a graph to be meaningfull.
The above 2018 information includes students from both the 2018 Victorian academic calendar year and the 2019 Northern Hemisphere Timetable (academic year from July to June). The NHT academic year results are subject to equating to ensure comparability with the results of the cohort assessed in the preceding calendar year.
0
2
4
6
8
10
12
14
16
18
UG E E+ D D+ C C+ B B+ A A+
%
Grade DistributionMale Female Total