vc survey data 2016
TRANSCRIPT

Venture Capital 2016Data & Views from VCs and LPs
1VC Survey Data
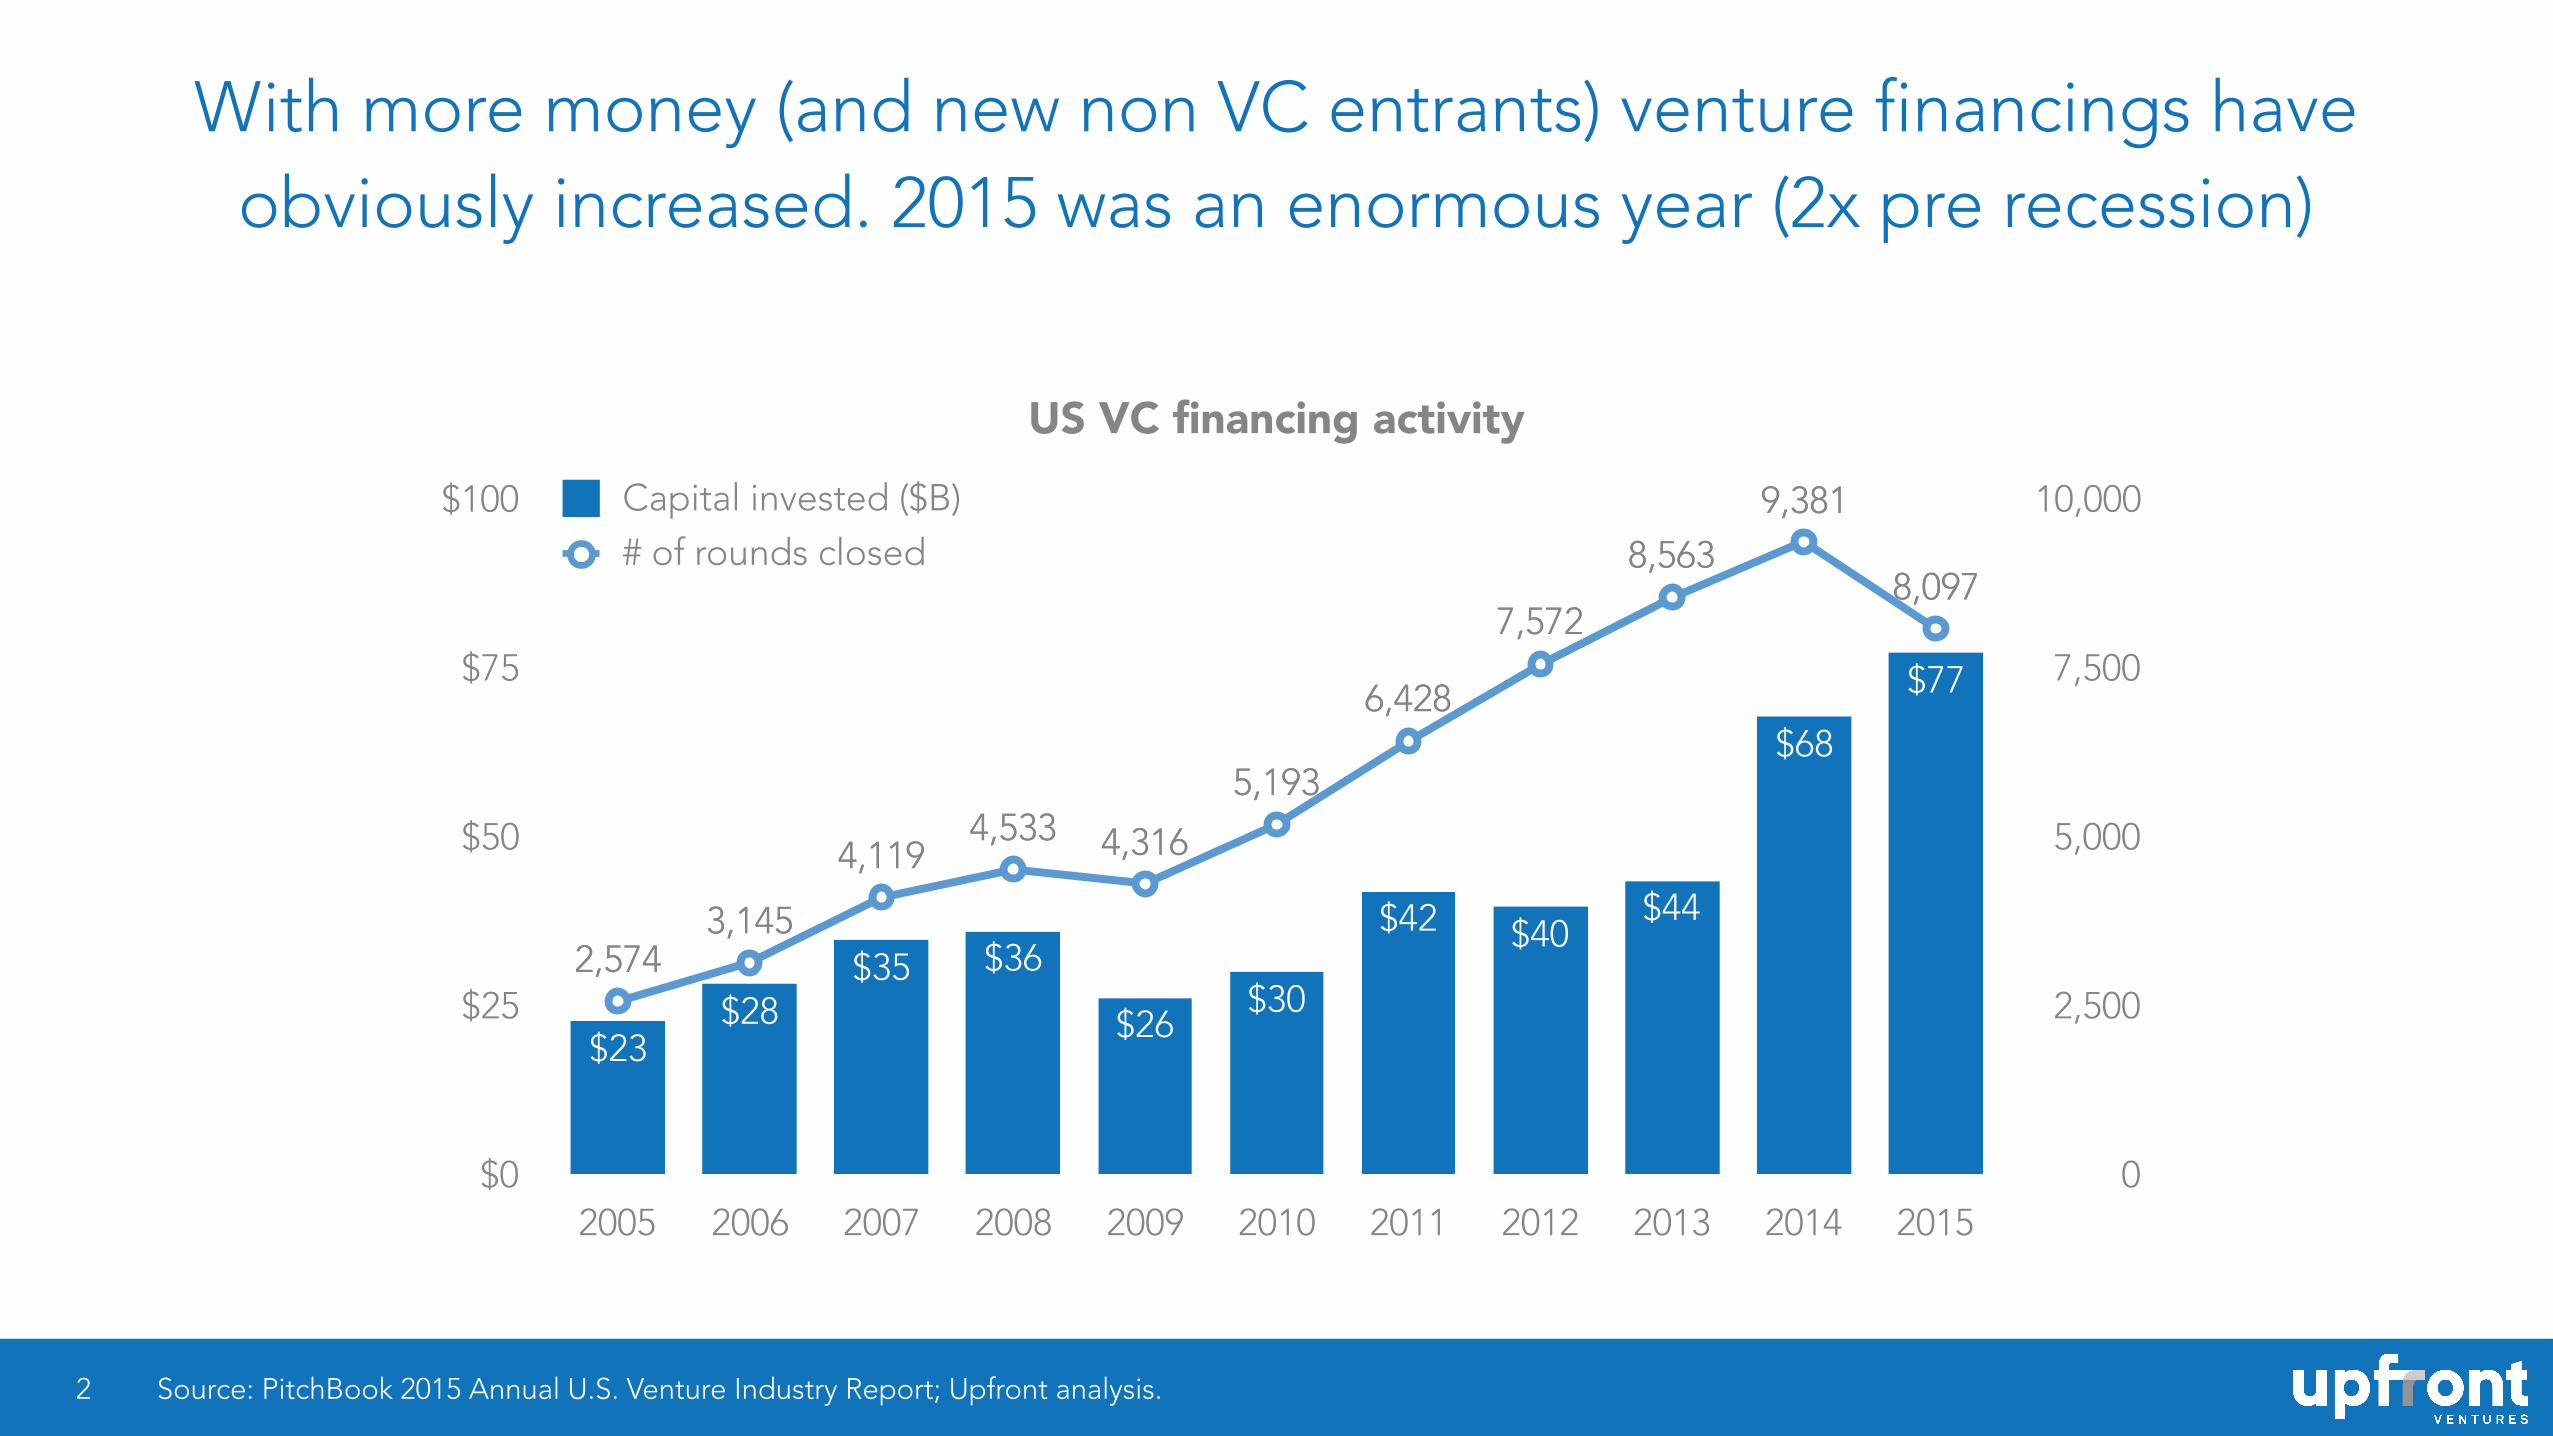
With more money (and new non VC entrants) venture financings have obviously increased. 2015 was an enormous year (2x pre recession)
2
US VC financing activity
0
2,500
5,000
7,500
10,000
$0
$25
$50
$75
$100
2005 2006 2007 2008 2009 2010 2011 2012 2013 2014 2015
Capital invested ($B)# of rounds closed
8,097
9,3818,563
7,572
6,428
5,193
4,3164,5334,119
3,1452,574
$77
$68
$44$40$42
$30$26
$36$35$28
$23
2,5743,145
4,1194,533 4,316
5,193
6,428
7,572
8,5639,381
8,097
Source: PitchBook 2015 Annual U.S. Venture Industry Report; Upfront analysis.

Angel & Seed deals have grown fastest but dollars have scaled massively into a smaller number of later-stage deals (doubling in just 2 years)
3 Source: PitchBook 2015 Annual U.S. Venture Industry Report; Upfront analysis.
US VC # of rounds closed by stage US VC capital invested ($B) by stage
0
10
20
30
40
50
2010 2011 2012 2013 2014 20150
1,000
2,000
3,000
4,000
5,000
2010 2011 2012 2013 2014 2015
Early Stage
CAGR
21%
36%
16%
CAGR
1%
22%
3%
Angel/ Seed
Late Stage
Early Stage
Late Stage
Angel/Seed

And the dollars into late-stage deals has largely been driven by non-traditional VCs entering the market (up 50% in the last 3 years)
4 Source: CBInsights, VC-backed $20M+ rounds; non-VC defined as Asset Mgmt, Corporate/Corporate VC, Family Office, Hedge & Mutual Funds; Upfront analysis.
Non-VC participation in US $20 million-plus rounds
0%
15%
30%
45%
60%
2012 2013 2014 2015
55%47%47%
37%
CAGR ’12-’15
15%

M&A pace hasn’t matched the increases in funding pace so VC mark-ups have been good but cash distributions less so
5
US VC-backed M&A activity
300
375
450
525
600
$0
$38
$75
$113
$150
2011 2012 2013 2014 2015
Amount Paid ($B)Number of M&As
473
510
470462
542
$54
$81
$42$43$47
542
462 470
510
473
Source: Dow Jones VentureSource Venture Capital Report 4Q’15; Upfront analysis.

IPO exits are down 32% in volume and 38% in value
6
US VC-backed IPO activity
0
30
60
90
120
$0
$4
$8
$11
$15
2011 2012 2013 2014 2015
Raised ($B) through IPONumber of IPOs
66
107
73
5046
$6
$9
$8
$11
$5
4650
73
107
66
Source: Dow Jones VentureSource Venture Capital Report 4Q’15; Upfront analysis.
50

With fewer VC exits many partners are more overloaded with boards and financings. 77% of surveyed VCs sit on or observe 4+ boards
7
2%3%
23%
39%
24%
9%
Source: Upfront Survey Jan 2016, 158 VCs.
How many boards do you sit on or observe?
11 - 14 0
7 - 10
4 - 6
1 - 3
15+
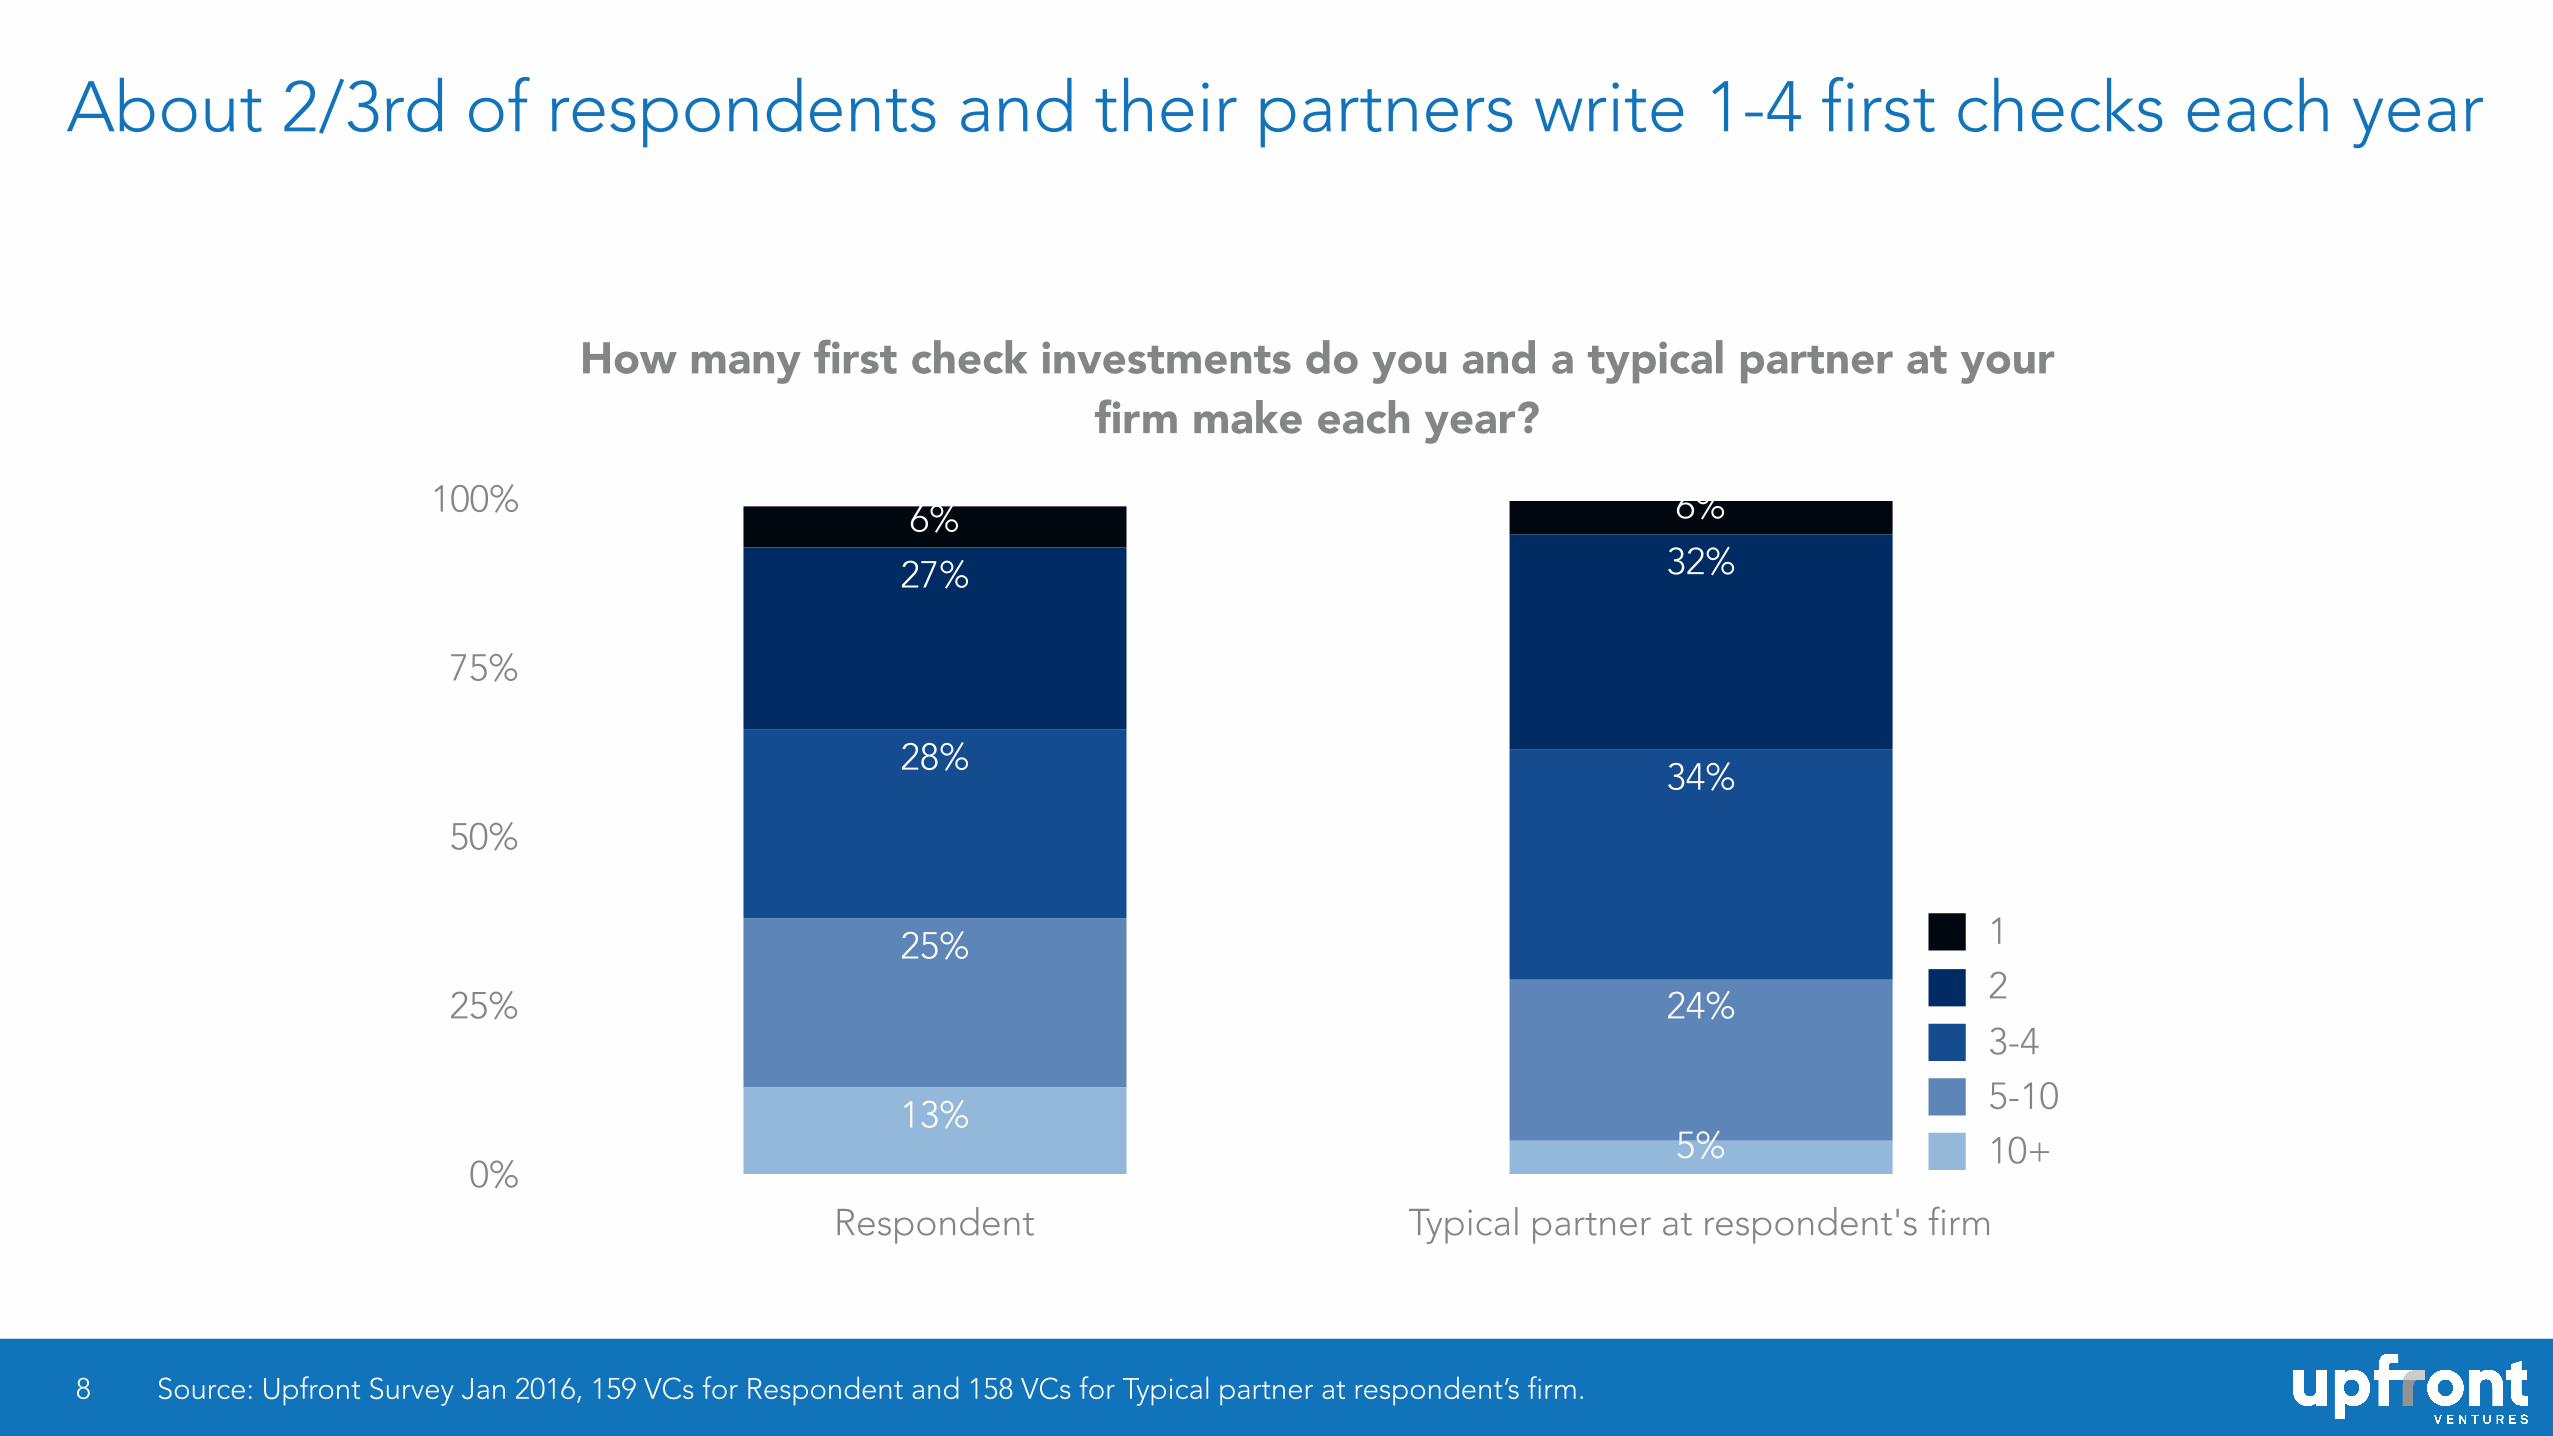
About 2/3rd of respondents and their partners write 1-4 first checks each year
8
How many first check investments do you and a typical partner at your firm make each year?
0%
25%
50%
75%
100%
Respondent Typical partner at respondent's firm
6%6%32%27%
34%28%
24%
25%
5%13%
10+5-103-4
21
Source: Upfront Survey Jan 2016, 159 VCs for Respondent and 158 VCs for Typical partner at respondent’s firm.
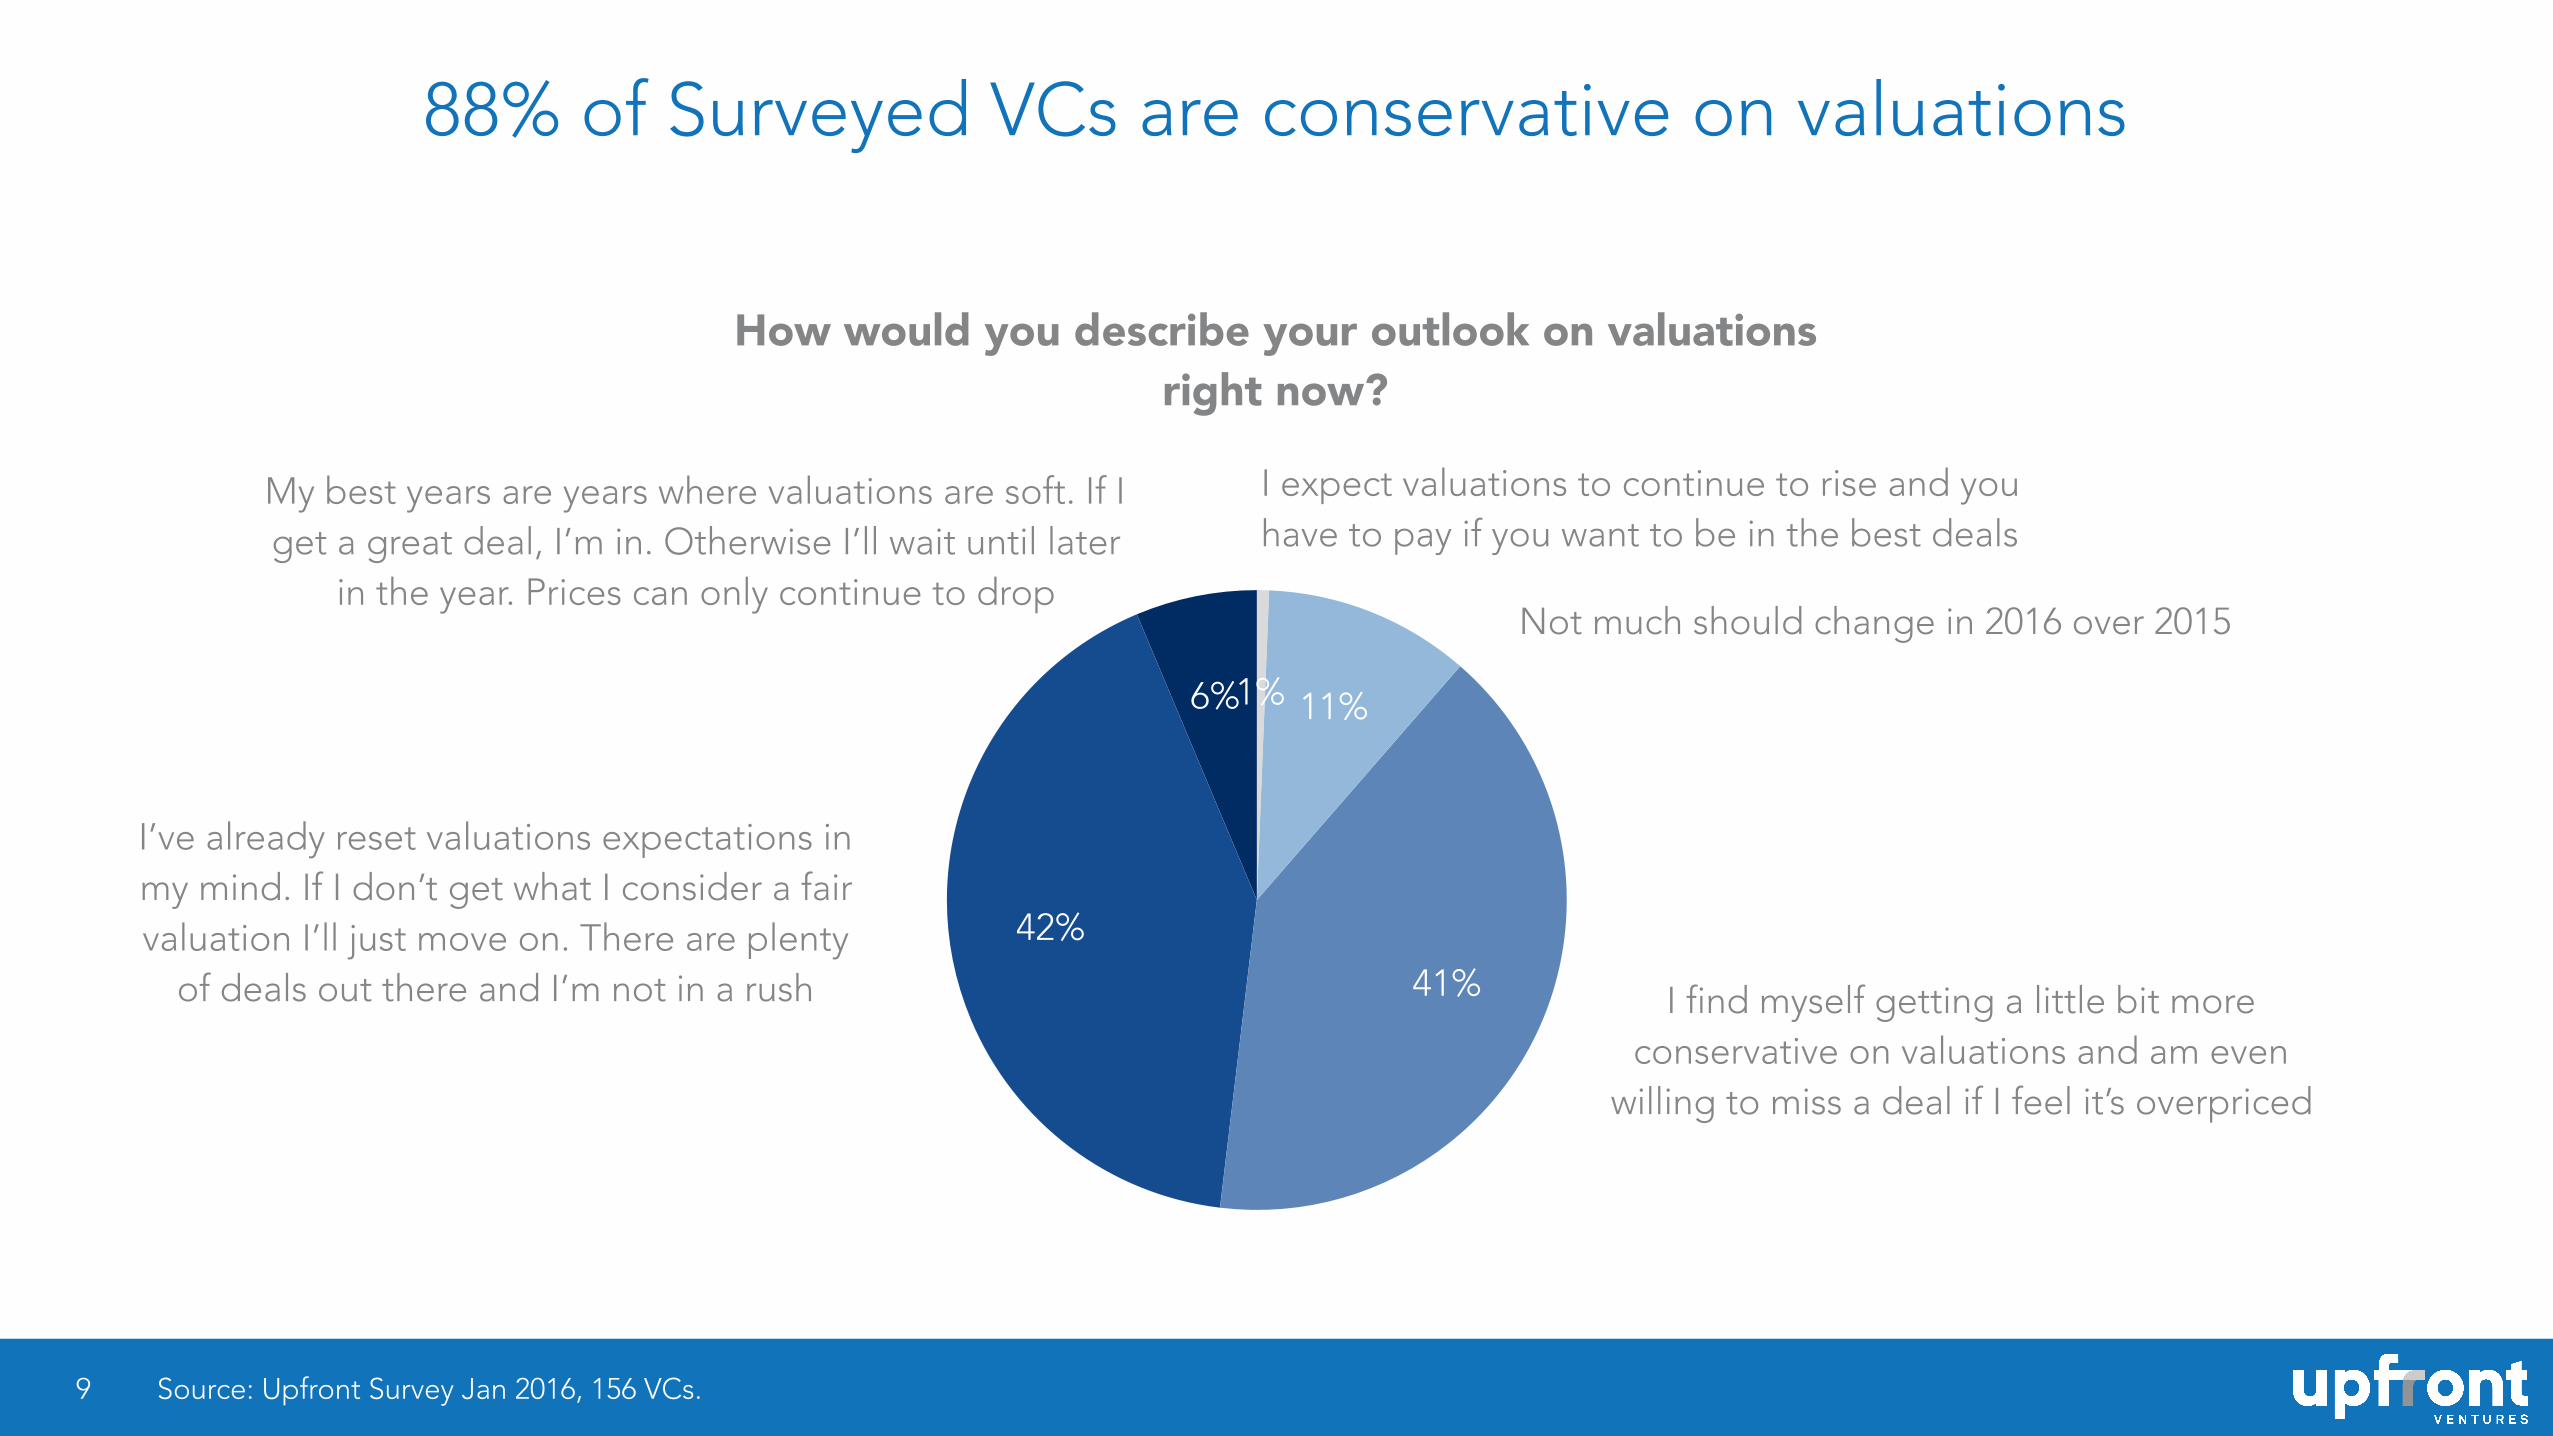
88% of Surveyed VCs are conservative on valuations
9
6%
42%
41%
11%1%
Source: Upfront Survey Jan 2016, 156 VCs.
How would you describe your outlook on valuations right now?
Not much should change in 2016 over 2015
I expect valuations to continue to rise and you have to pay if you want to be in the best deals
My best years are years where valuations are soft. If I get a great deal, I’m in. Otherwise I’ll wait until later
in the year. Prices can only continue to drop
I’ve already reset valuations expectations in my mind. If I don’t get what I consider a fair valuation I’ll just move on. There are plenty
of deals out there and I’m not in a rush I find myself getting a little bit more conservative on valuations and am even
willing to miss a deal if I feel it’s overpriced

Specifically more than 90% of respondents expected valuations to go down in 2016 with a full 1/3rd of investors expecting significant price corrections
10
Do you expect valuations to go up, down or remain about the same as previous quarters?
0%
25%
50%
75%
100%
Q4'15 1H'16 Proj
30%5%
61%
61%
8%
28%
6% IncreaseAbout the same
Marginally downSignificantly down
Source: Upfront Survey Jan 2016, 156 VCs for Q4’15, 158 VCs for 1H’16.
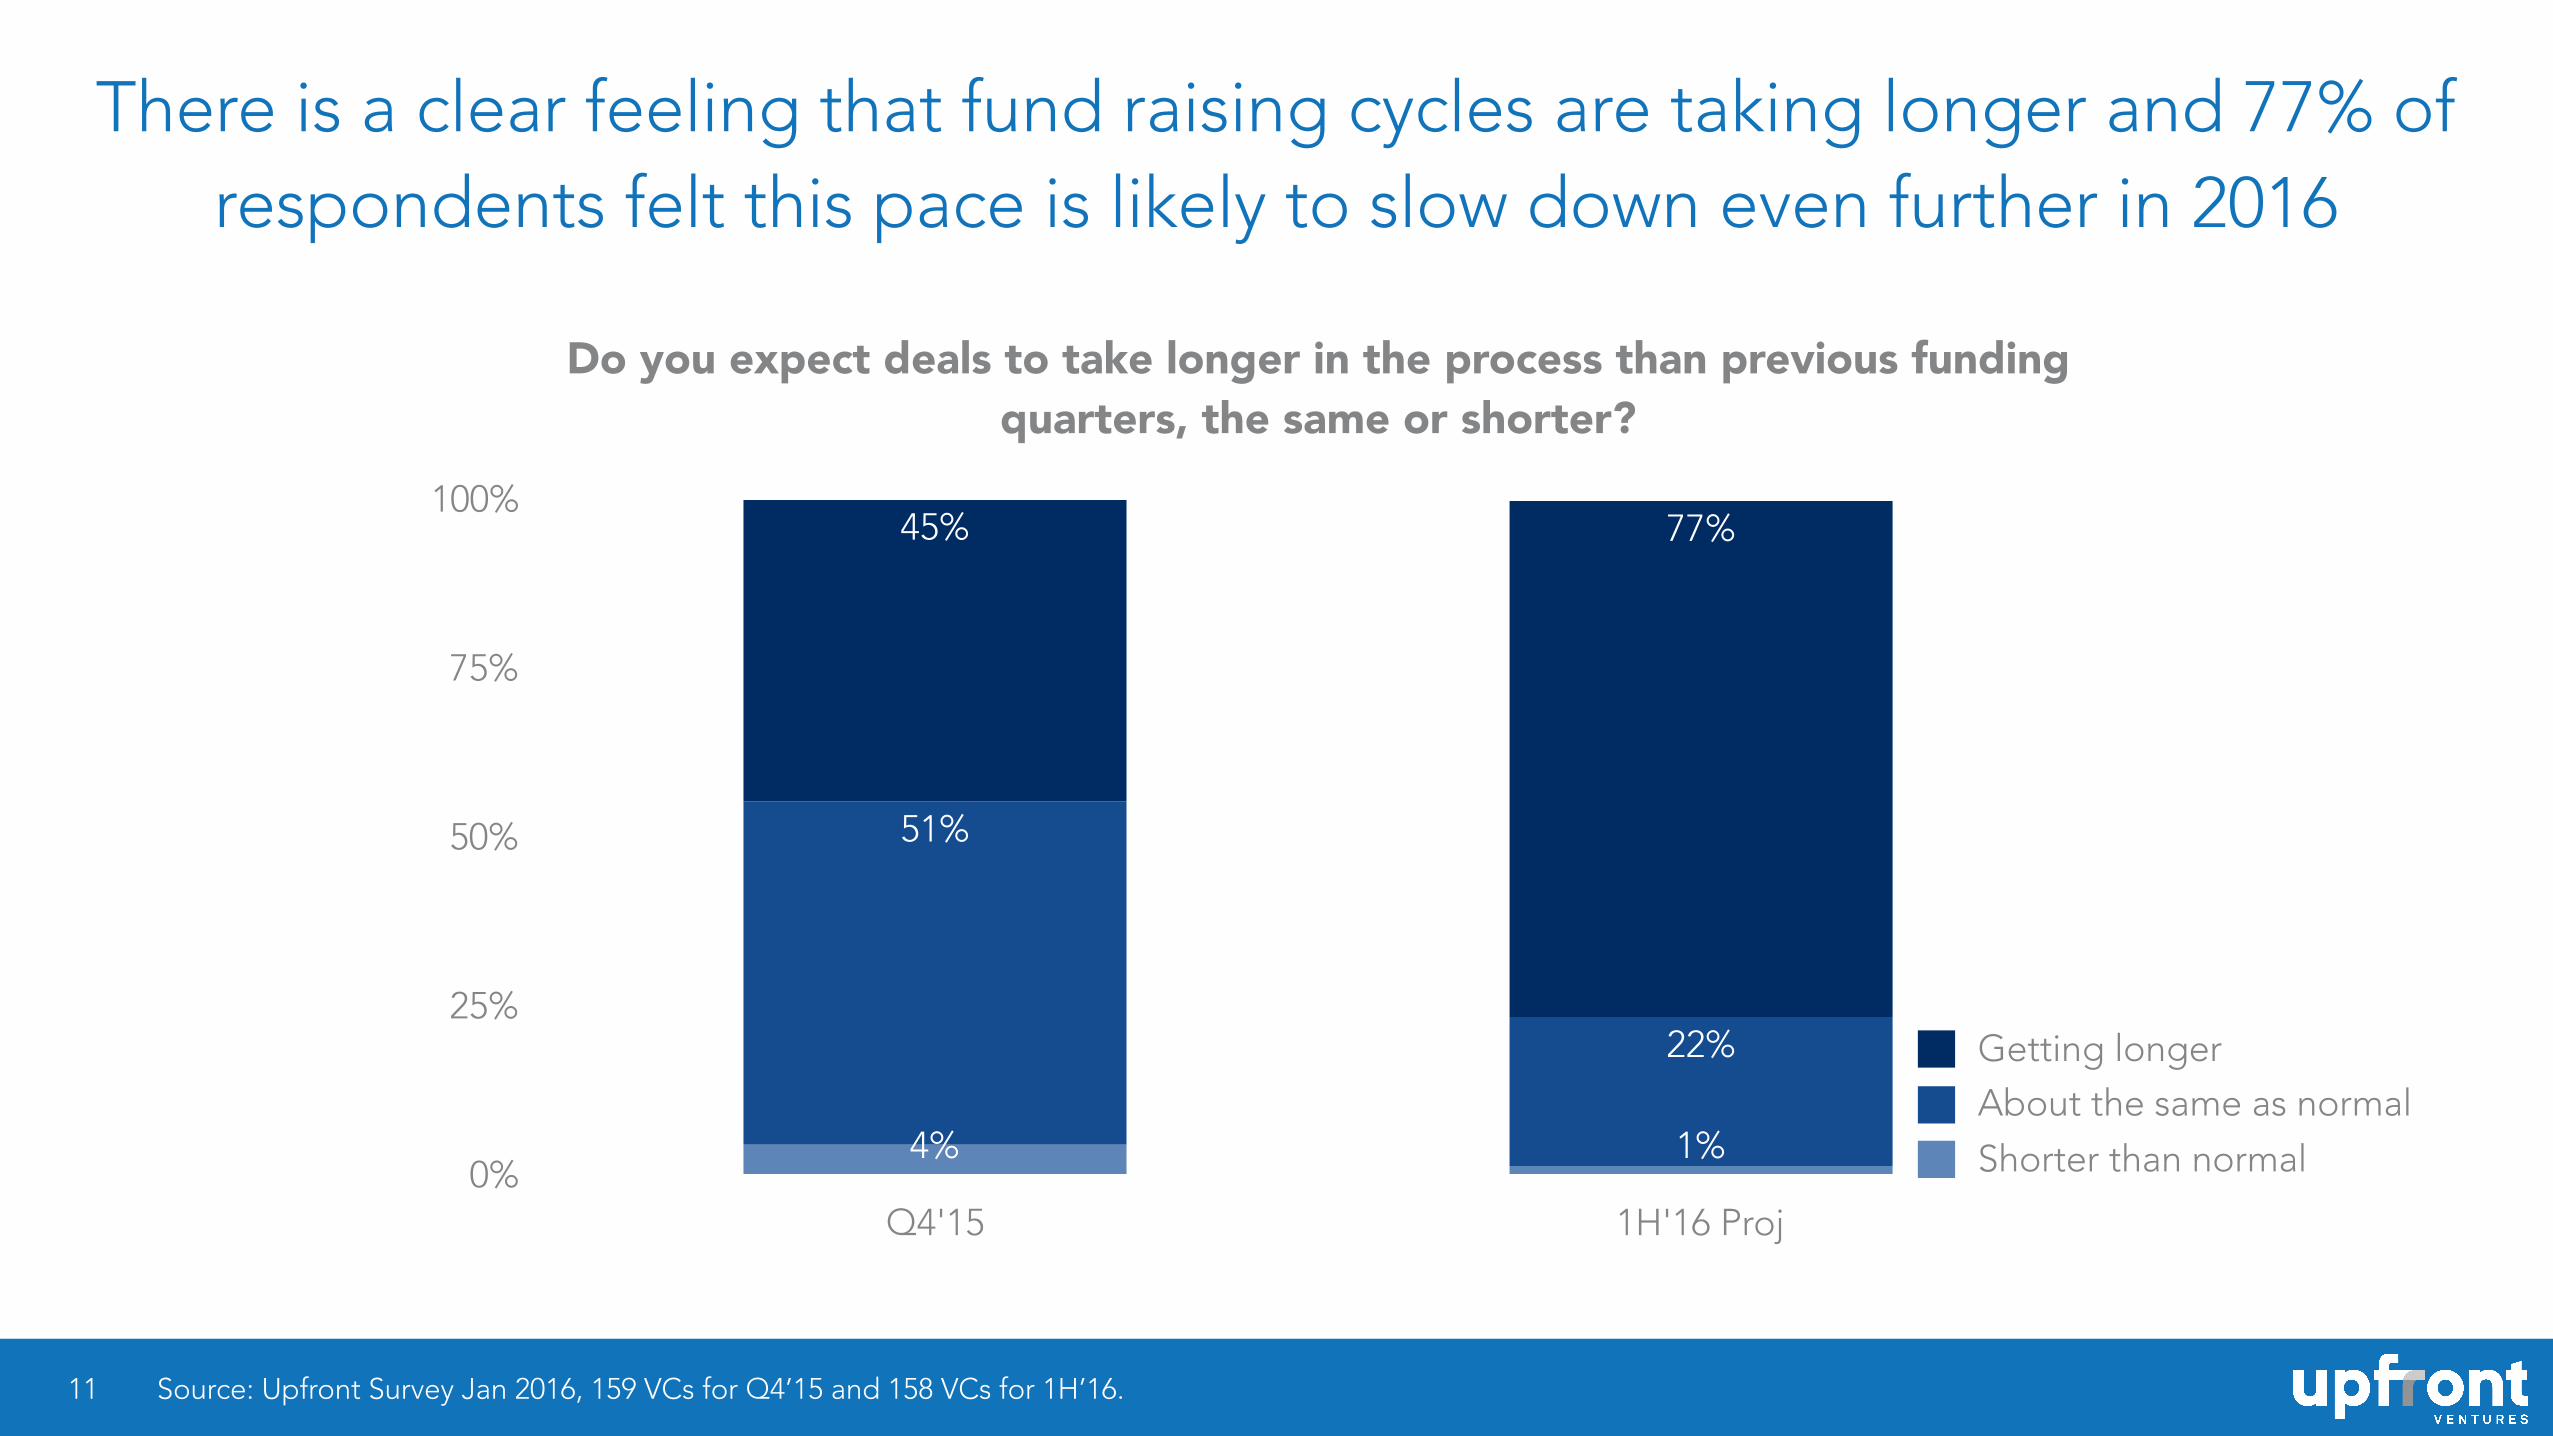
There is a clear feeling that fund raising cycles are taking longer and 77% of respondents felt this pace is likely to slow down even further in 2016
11
Do you expect deals to take longer in the process than previous funding quarters, the same or shorter?
0%
25%
50%
75%
100%
Q4'15 1H'16 Proj
77%45%
22%
51%
1%4% Shorter than normal
About the same as normalGetting longer
Source: Upfront Survey Jan 2016, 159 VCs for Q4’15 and 158 VCs for 1H’16.

This has swung sentiment for many experienced VCs, with 62% of respondents advising companies to cut costs / burn as markets tighten
12
4%
35%
62%
Source: Upfront Survey Jan 2016, 156 VCs.
Which statement best describes the spending behavior at most of the companies in which you are on the board or observe?
Generally cutting costs expecting markets to tighten
Don’t see much change from a year ago
Generally not too worried about burn rates

65% of respondents think their firms will make about the same first check investments in 2016 as they had in 2015
13
23%
65%
11%
Source: Upfront Survey Jan 2016, 159 VCs.
Do you think your firm will make more new first check investments or fewer in 2016 vs. 2015?
More New InvestmentsFewer New Investments
About the Same Pace

50% of respondents indicate they may slow down their pace, 35% thought it would be the same pace as 2015 and only 16% expect 2016 to be robust
14
1%4%
43%
35%
16%
Source: Upfront Survey Jan 2016, 158 VCs.
How would you generally describe your investment mindset heading into 2016?
“Seeing tons of great deal flow and expect this to be a solid year”
“Unless a deal is amazing I’m likely to slow my pace a bit”
“I don’t feel compelled to do deals”
“2016 about the same pace as my last several years”
“I’d rather fund when the dust settles
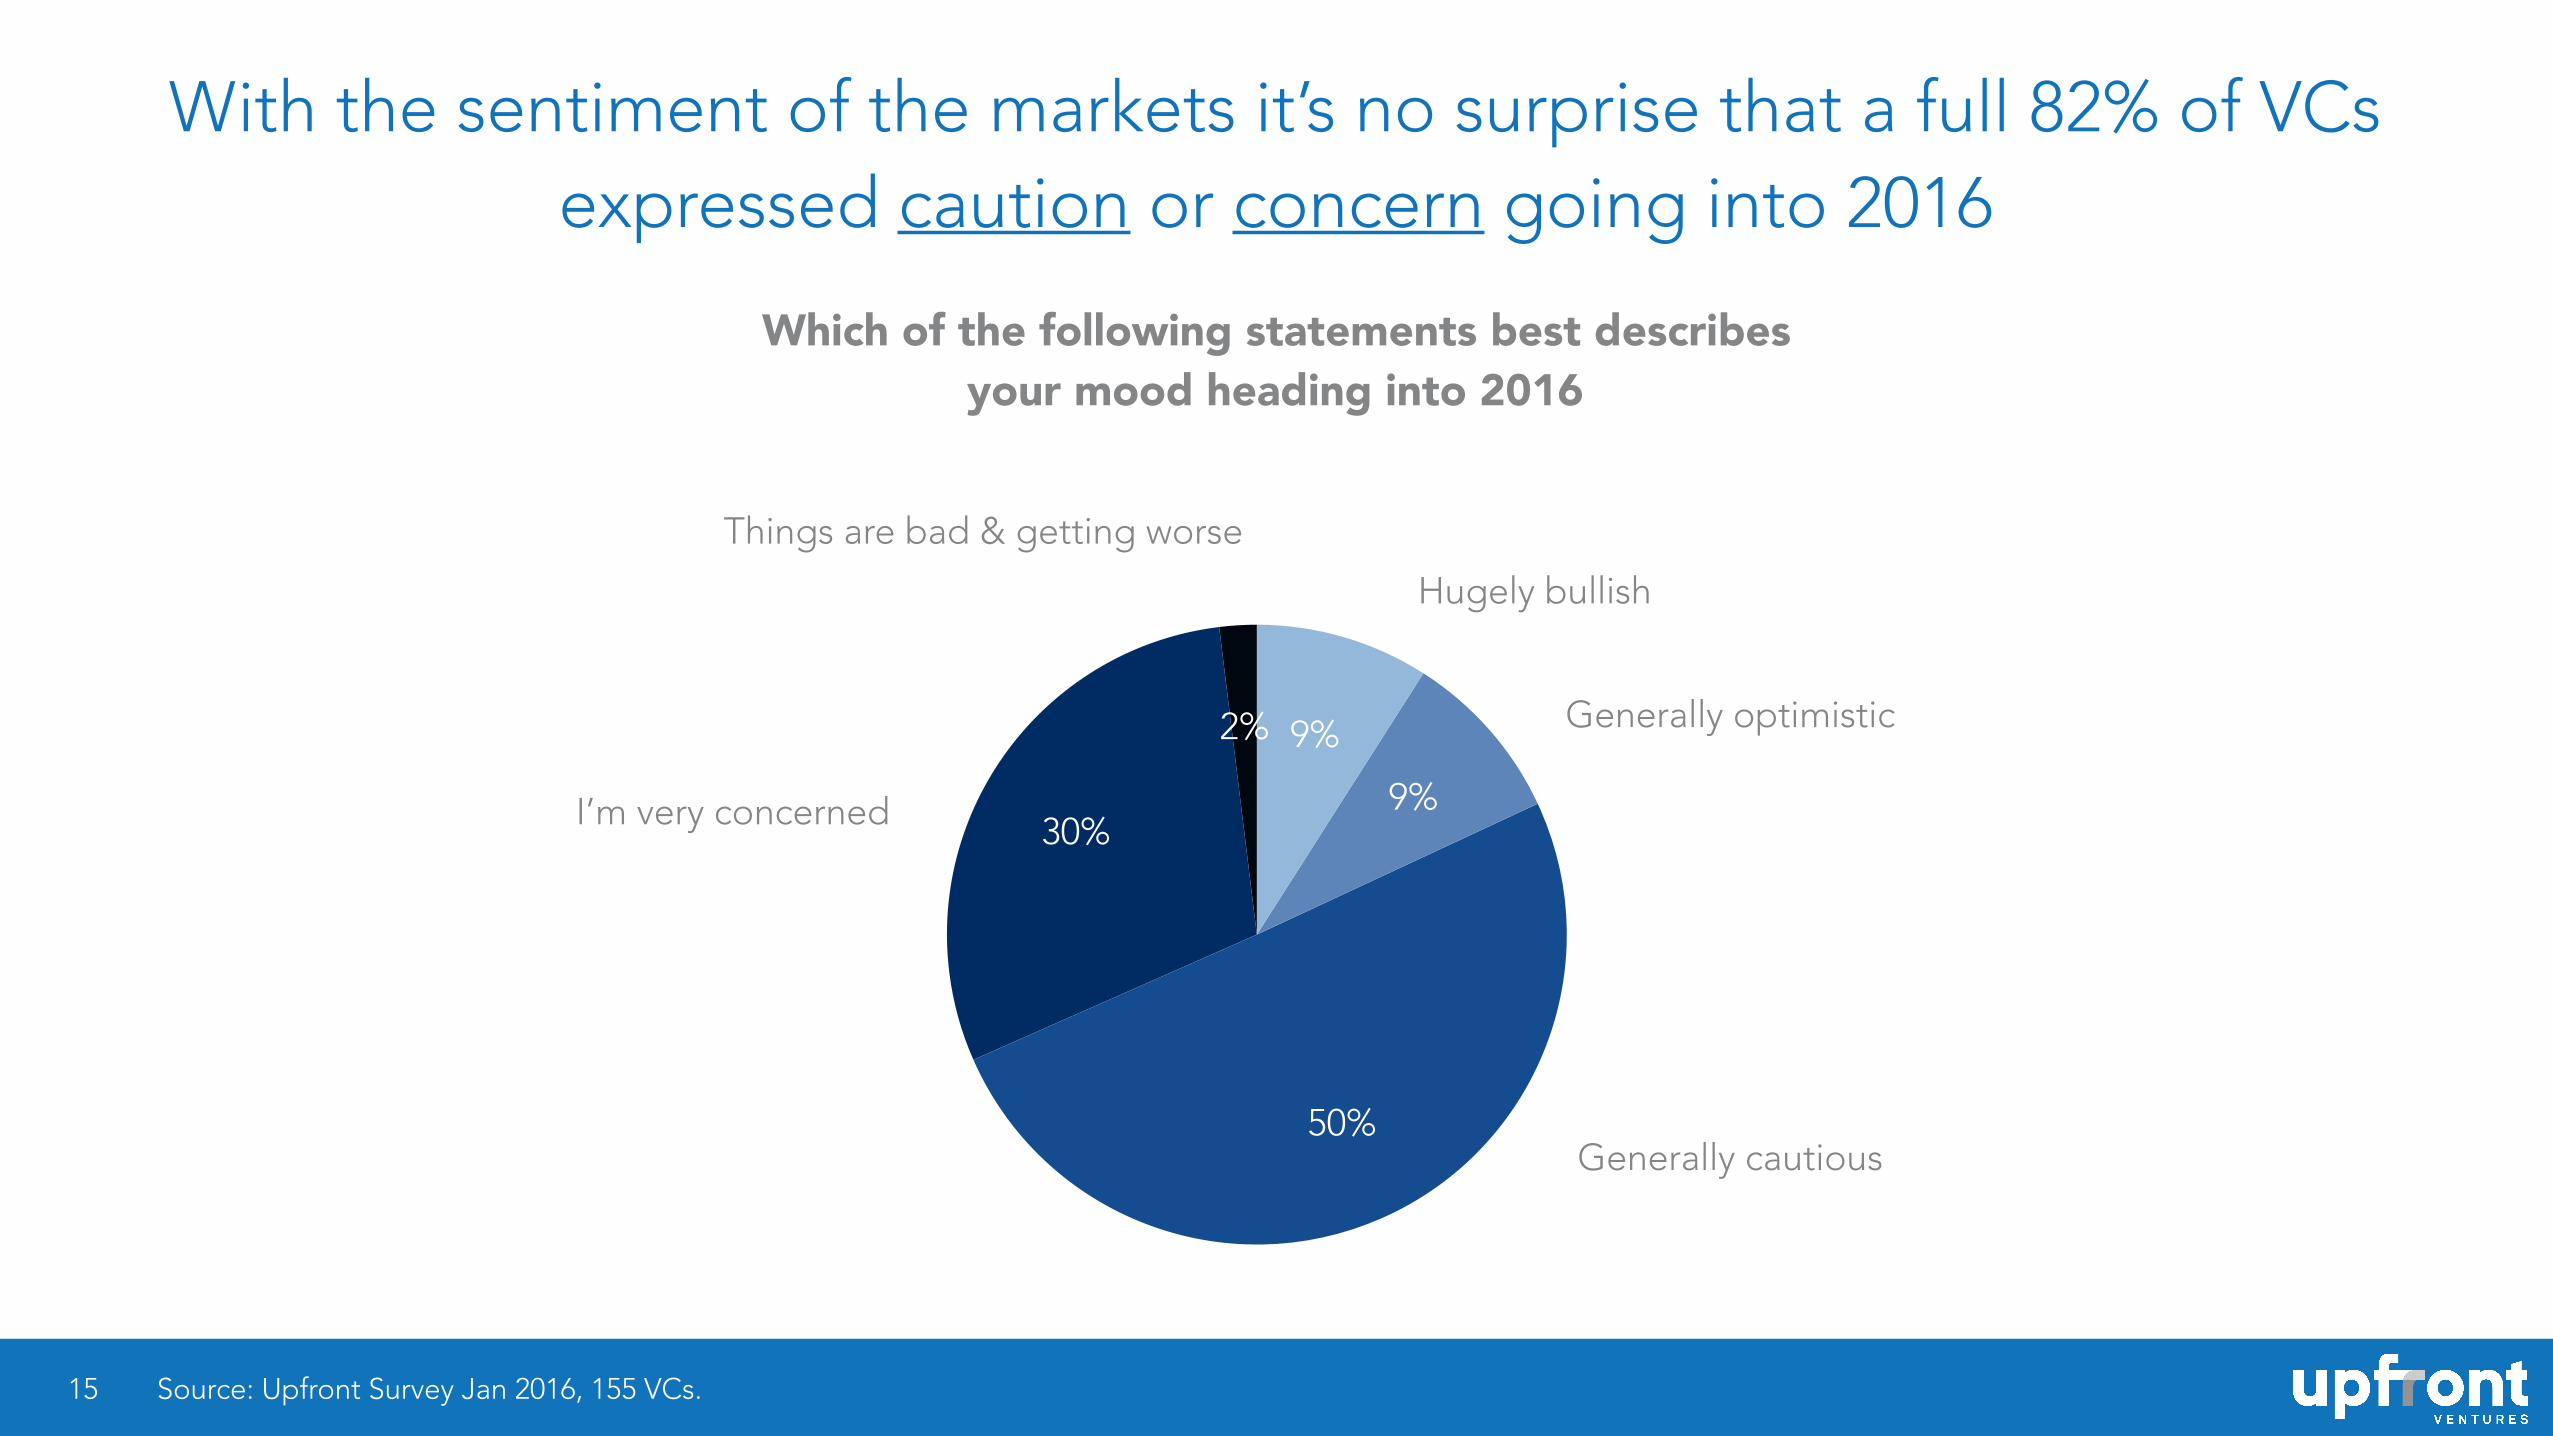
With the sentiment of the markets it’s no surprise that a full 82% of VCs expressed caution or concern going into 2016
15
2%
30%
50%
9%
9%
Source: Upfront Survey Jan 2016, 155 VCs.
Hugely bullish
I’m very concerned
Things are bad & getting worse
Generally cautious
Generally optimistic
Which of the following statements best describes your mood heading into 2016

159 VCs surveyed
16
Fund type
0
20
40
60
Angel Seed VC (Early) VC (Mid) VC (Late) PE Corp (blank)
1196
19
4760
7
Source: Upfront Survey Jan 2016.
Fund size ($ million)
0
20
40
60
$1-20 $20-100 $300-999 $100-300 $1000+ Evergreen Personal
779
283347
19
Survey respondent geography
0
40
80
Norcal SoCal NE US Other US ROW (blank)
1782431
79
Position
0
47
93
140
Partner / MD Analyst to Principal Sole proprietor/personal investor
79
134
How long has your firm existed (years)
0
35
70
0-3 3-10 10-20 20+
2236
61
31
Personal investment experience (years)
0
40
80
0-3 3-6 6-10 10-15 15+
4123
4330
13