vault/mcca law firm diversity survey 2017 report · law firm sponsors and underwriters the...
TRANSCRIPT

Vault/MCCA Law Firm Diversity Survey 2017 Report

Law Firm Sponsors and Underwriters
The Vault/MCCA Law Firm Diversity Survey and the publication of this report are made possible through the generous support of the following law firms:
Premium Sponsors
Alston & Bird LLP
Arnold & Porter Kaye Scholer LLP Cleary Gottlieb Steen & Hamilton LLP
Eversheds Sutherland (US) LLP
Kirkland & Ellis LLP
Mayer Brown LLP
Morgan, Lewis & Bockius LLP
Orrick, Herrington & Sutcliffe LLP
Paul Hastings LLP
Underwriters
Akin Gump Strauss Hauer & Feld LLP
Allen & Overy LLP
Clifford Chance US LLP
Covington & Burling LLP
Cravath, Swaine & Moore LLP
Davis Polk & Wardwell LLP
DLA Piper LLP (US)
Fenwick & West LLP
Fried, Frank, Harris, Shriver & Jacobson LLP
Gibbons P.C.
Goulston & Storrs PC
Haynes and Boone LLP
Hogan Lovells US LLP
Hunton & Williams LLP
Kramer Levin Naftalis & Frankel LLP
Latham & Watkins LLP
McGuireWoods LLP
Morrison & Foerster LLP
Neal, Gerber & Eisenberg LLP
Ogletree, Deakins, Nash, Smoak & Stewart, P.C.
O'Melveny & Myers LLP
Proskauer Rose LLP
Ropes & Gray LLP
Schulte Roth & Zabel LLP
Shearman & Sterling LLP
Simpson Thacher & Bartlett LLP
Stroock & Stroock & Lavan LLP
Sullivan & Cromwell LLP
Weil, Gotshal & Manges LLP
Willkie Farr & Gallagher LLP
WilmerHale
Womble Carlyle Sandridge & Rice, LLP

MCCA Board of Directors
A. B. Cruz, III Board Chair Senior Vice President, Enterprise Shared Services Chief Legal Office USAA Stuart Alderoty Board Chair‐Elect Executive Vice President, General Counsel and Corporate Secretary CIT Group Ricardo Anzaldua Special Legal Advisor to CEO MetLife, Inc. Damien Atkins General Counsel & Corporate Secretary Panasonic Corporation of North America Janice P. Brown Owner & Founder Brown Law Group Duane D. Holloway Executive Vice President and General Counsel Ascena Retail Group, Inc. Sandra Leung Executive Vice President and General Counsel Bristol‐Myers Squibb Company Linda Lu Senior Vice President, Property & Casualty Legal Personal Lines Nationwide Insurance Company
Gwen Marcus Executive Vice President and General Counsel Showtime Networks, Inc. Suzan A. Miller Corporate Vice President, Deputy General Counsel, and Corporate Secretary Intel Corporation Samuel M. Reeves Senior Vice President, General Counsel, Walmart International Legal Walmart Robin H. Sangston Vice President & Chief Compliance Officer Cox Communications, Inc. Dawn Smith Executive Vice President and Chief Legal Officer McAfee Richard J. Wallis Vice President & Deputy General Counsel Microsoft Corporation Neil Wilcox Senior Vice President and Associate General Counsel First Data Corporation Michael T. Williams Special Counsel to the CEO Staples, Inc. Simone Wu Senior Vice President, General Counsel, Corporate Secretary & External Affairs Choice Hotels International, Inc.
MCCA Corporate Officers
Joseph Centeno General Counsel and Assistant Corporate Secretary Shareholder and Co‐chair of Labor, Employment, Benefits & Immigration Department Buchanan Ingersoll & Rooney, P.C.
Paula J. Schauwecker Corporate Secretary Principal Beveridge & Diamond, P.C.
MCCA N‐Gen (Next Generation) Advisory Board
Rima J. Alaily Assistant General Counsel Microsoft Corporation
Anne Lee Benedict N‐Gen Advisory Board Chair Executive Vice President, Chief Legal Officer & Secretary Summit Materials, Inc.
Terrance J. Evans Partner Duane Morris LLP
Samantha C. Grant Partner Sheppard Mullin Richter & Hampton LLP
Alice Hsu Partner Akin Gump Strauss Hauer & Feld LLP
LaTanya Langley Vice President & General Counsel BIC International
Corporate Secretary
Emily B. Speak Associate Attorney Gibson, Dunn & Crutcher
Kevin R. Lyn Partner, Diversity Committee Chair and Patent Team Leader Womble Bond Dickinson (US) LLP
Rodney C. Pratt Vice President, General Counsel & Corporate Secretary Converse Inc.
Reginald M. Rasch General Counsel – Head of Legal Rakuten USA, Inc.
Krishna Veeraraghavan Partner Sullivan & Cromwell LLP
Charles H. Wilson N‐Gen Advisory Board Vice Chair Vice Chair, Office Managing Partner Cozen O'Connor
Teonta A. Williams Senior Associate General Counsel UnitedHealthcare Corporation

2017 Vault/MCCA Law Firm Diversity Report Page 1 of 51
Table of Contents
Index of Tables and Charts ............................................................................................................................... 2
The Vault/MCCA Law Firm Diversity Survey ................................................................................................. 3
Executive Summary ........................................................................................................................................... 4
2017 Vault/MCCA Survey Results ................................................................................................................... 6
Minority Men and Women ......................................................................................................................... 7
Individual Racial/Ethnic Groups ............................................................................................................... 10
African‐American/Black ............................................................................................................. 11
Asian American ...................................................................................................................................... 13
Hispanic/Latino ........................................................................................................................... 15
Multiracial, Alaska Native/American Indian and Native Hawaiian/Pacific Islander ................. 17
LGBTQ Attorneys ........................................................................................................................................ 20
Individuals with Disabilities ...................................................................................................................... 22
Women ......................................................................................................................................................... 23
Women of Color .......................................................................................................................................... 26
Part‐time Attorneys ................................................................................................................................... 28
Appendices ........................................................................................................................................... 29
Methodology ............................................................................................................................................... 30
Tables ............................................................................................................................................................ 31
Participating Law Firms ............................................................................................................................. 49
Copyright ©2017 Minority Corporate Counsel Association and Vault. All rights reserved. The Minority Corporate Counsel Association and Vault hereby grants permission for copies of materials herein to be made, in whole or part, for classroom use in an institution of higher learning or for use by not‐for‐profit legal service organization, provided that the use is for informational, non‐commercial purposes only and any copy of the materials or portion thereof acknowledges original publication by the MCCA and Vault, including the title of the publication, the name of the author, and the legend: “Reprinted by permission of the Minority Corporate Counsel Association and Vault. All rights reserved.” No part of this publication may be reproduced, stored in a retrieval system, or transmitted in any form or by any means, electronic, mechanical, photocopying, recording or otherwise, without the prior written permission of the publisher. To request permission, contact MCCA’s Education Team at [email protected]. Nothing contained herein is to be considered as the rendering or legal advice for specific cases, and readers are responsible for obtaining such advice from their own legal counsel. These materials and any attachments or related materials herein are intended for educational and informational purposes only.

2017 Vault/MCCA Law Firm Diversity Report Page 2 of 51
Index of Tables and Charts
Tables
Table 1. Overall Law Firm Demographics ........................................................................................................ 6
Table 2. Attorney Departures among Largest Racial/Ethnic Groups in 2016 As Percentage of their Overall Law Firm Population ............................................................................................................ 12
Table 3. Ratio of Partners to Associates ....................................................................................................... 14
Table A1. Changes in Law Firm Demographics: 2016 vs 2007 ....................................................................... 31
Table A2. Minority Lawyers among Surveyed Firms: 2016 vs 2007 .............................................................. 34
Table A3. Black, Asian and Hispanic Lawyers among Surveyed Firms: 2016 vs 2007 ................................... 37
Table A4. Multiracial, Alaska Native/Native American and Native Hawaiian/Pacific Islander Lawyers Among Surveyed Firms: 2016 vs 2007 .......................................................................................... 40
Table A5. LGBTQ Lawyers and Attorneys with Disabilities among Surveyed Firms: 2016 vs 2007 ............... 43
Table A6. Female Lawyers among Surveyed Firms: 2016 vs 2007 ................................................................ 46
Charts
Chart 1. Minority Lawyers: Hires vs Departures over Time ............................................................................. 9
Chart 2. Law Firm Attorney Population, by Race/Ethnicity ........................................................................... 10
Chart 3. Three Largest Minority Groups Represent 21% of Associates but Only 8% of Partners ................. 16
Chart 4. Attorney Position by Race/Ethnicity ................................................................................................ 19
Chart 5. Women in Leadership Roles: 2016 vs 2007 ..................................................................................... 24
Chart 6. Women: Hires vs Departures over Time .......................................................................................... 25
Chart 7. Law Firms Are Hiring and Promoting—but also Losing—More Women of Color............................ 27
Chart 8. Attorneys Working Part‐time Schedules .......................................................................................... 28
Chart A1. Shifting Demographics from Summer Associate to Partner or Departure .................................... 32
Charts A2 and 3. Disparate Rates of Progress among Three Largest Minority Groups: 2007–2016 ............ 33

2017 Vault/MCCA Law Firm Diversity Report Page 3 of 51
The Vault/MCCA Law Firm Diversity Survey
To MCCA Members, Vault Sponsors and all our Partners:
For the last 10 years, the Minority Corporate Counsel Association (MCCA) and Vault have gathered detailed breakdowns of law firm populations by race/ethnicity, gender, sexual orientation and disability status across attorney levels—from summer associates hired to partners promoted, from the lawyers who serve on management committees to the attorneys who leave their firms—thus offering comprehensive demographic snapshots of the nation’s leading law firms as well as of the industry as a whole.
Vault and MCCA first began the collection of law firm diversity data in 2004 in partnership and response to the Chief Legal Officer Call to Action in 2003, initially soliciting quantitative and qualitative information with respect to minority men, minority women and white women. Over the next few years, the survey questionnaire was expanded to incorporate more detailed demographic breakdowns by race and gender, as well as information about openly LGBTQ individuals and attorneys with disabilities. In 2009, Vault and MCCA launched the Law Firm Diversity Database (http://mcca.vault.com), an online tool to make the information provided by law firms more widely available to the legal community to help clients and firms partner on challenges specific to them while encouraging accountability.
The latest findings are based on information reported by 229 law firms who participated in the 2017 Vault/MCCA Law Firm Diversity Survey. The survey was distributed in the spring of 2017 and includes demographic statistics reported as of December 31, 2016. The survey also offered firms an opportunity to submit qualitative information outlining their initiatives and goals with respect to diversity and inclusion, and how management is held accountable for achieving those goals.
All responses to the 2017 survey are available in the Vault/MCCA Law Firm Diversity Database (http://mcca.vault.com). The database also maintains an archive of demographic data collected since 2008 from 300‐plus law firms, presenting a uniquely detailed portrait of diversity progress in the legal industry and the most comprehensive one of its kind to date. More than 220 law firms nationwide participate in the survey each year, representing more than 90 percent of the AmLaw 100 and a majority of the NLJ 250, and more than 150 of those firms have taken part every year for the last 10 years.
Access to the Law Firm Diversity Database is provided at no charge to the legal community to encourage accountability and meaningful partnerships between clients and firms. Data reported by participating firms may be searched, compared and downloaded by corporate law departments assessing outside counsel, by law firms benchmarking their progress against peer firms, as well as by law students and lateral candidates researching potential employers. Readers can make side‐by‐side comparisons of diversity metrics, track firms’ progress over time and evaluate their performance against industry‐wide benchmarks.
This report, compiled by Vault, highlights some of the key findings from the latest survey results as well as trends observed over the last decade.
We hope that this information will provide some perspective for the past ten years. We welcome feedback and look forward to ongoing partnerships to continue improving numbers, programs that will create a more diverse and inclusive profession at all levels. We thank all of the law firms who have participated and corporate legal departments who support our report.
Sincerely,
Jean Lee Vera Djordjevich
President & Chief Executive Officer Managing Director, Research & Consulting
Minority Corporate Counsel Association Vault Inc.

2017 Vault/MCCA Law Firm Diversity Report Page 4 of 51
Executive Summary
The Vault/MCCA survey data reveals that, while law firms have become more diverse, the demographic shifts are both incremental and uneven.
Minority Representation at Record High
According to this year’s survey, minority lawyers represent 16 percent of law firm associates, partners and counsel—the highest figure to date.1 Numbers have increased among both genders, and women of color now slightly outnumber men. The progress is most evident among incoming associate classes: 31 percent of the 2Ls who were summer associates at law firms in 2016 and accepted offers to return as full‐time associates in 2017 were members of a racial/ethnic minority group. Ten years ago, that figure was closer to 25 percent.
At the same time, attrition among minority attorneys is higher now than it was during the recession. In 2016, almost 22 percent of all attorneys and 27 percent of associates who left their firms were minorities. Both figures exceed those reported in any of the previous 10 years.
Composition of the partnership ranks highlights the slow rate of change. Minority representation at the partner level has increased by more than two percentage points since 2007, thanks to both higher promotion rates and an increase in lateral hiring. Still, even though one in four law firm associates is a person of color, more than 90 percent of equity partners are white. Among women, the figures are especially stark: women of color represent 13 percent of associates but less than 3 percent of equity partners.
Disparate Experiences among Attorneys of Color
Hispanic and Latino attorneys have seen some of the most consistent progress. Relative to their share of the overall U.S. population, Latinos are the most underrepresented minority among law firm attorneys. But their numbers have steadily increased at all levels, from recruitment to management representation. Hispanic and Latino lawyers now make up almost 4 percent of attorneys in law firms. Hispanic lawyers are also more likely to be partners at their firms than either Asian American or African‐American lawyers, and they are less likely to leave.
Although the percentage of black equity partners is marginally higher than it was 10 years ago, the number of African‐American lawyers has declined at almost every other level. Despite a small uptick in the last year, African‐Americans still represent just over 3 percent of law firm attorneys; in 2007, the number was closer to 4 percent. Firms are hiring fewer black attorneys than they did prior to the recession. Black lawyers also leave their firms at a higher rate than members of other minority groups.
Asian Americans are the largest minority group in law firms but the most underrepresented in firm leadership. The number of Asian attorneys in law firms has risen over the last decade, and there are now more Asian American lawyers than Hispanic and African‐American attorneys combined. Nevertheless, just 20 percent of Asian American attorneys are partners, whereas 27 percent of African‐Americans are partners, 31 percent of Latino lawyers are partners and 47 percent of white lawyers are partners.
Among other minority groups, the number of attorneys identifying with two or more races has nearly tripled in the last decade; multiracial lawyers now represent 1.7 percent of the law firm population, compared to 0.6 percent in 2007. Native Hawaiian, Pacific Islander, Alaska Native and American Indian attorneys collectively make up less than 0.3 percent of lawyers—just 234 attorneys survey‐wide in 2017—a figure that has changed little over the last 10 years.
1 For the purposes of this report, the terms “minority” and “person of color” refer to individuals identifying with one or more of the
following racial/ethnic groups: African‐American/Black, Hispanic/Latino, Asian American, Alaska Native/American Indian, Native Hawaiian/Pacific Islander and Multiracial.

2017 Vault/MCCA Law Firm Diversity Report Page 5 of 51
More Women in Positions of Leadership
According to this year’s survey, 35 percent of all law firm attorneys are female, the highest figure reported in the last decade. The data shows an increase in the recruitment of female law students and laterals. Women represented close to half (49 percent) of 2L summer associates in 2016 and 44 percent of all new lawyers hired.
More women are advancing to partnership and serving in positions of leadership than 10 years ago. In 2016, 36 percent of partners promoted were women, compared to 30 percent in 2007. One in five equity partners is female, and 22 percent of lawyers currently serving on law firm executive or management committees are women.
Nevertheless, retention of female attorneys continues to be an issue. Approximately 40 percent of lawyers who left their firms in 2016 were women, a number that has remained relatively consistent since 2007.
Limited Gains for Women of Color
Despite some progress over the last decade, minority women remain underrepresented among the attorneys who lead law firms and overrepresented among those who leave. Women of color now represent just over 8 percent of all lawyers—a gain of one percentage point since 2007. More than 17 percent of 2L summer associates in 2016 were minority women; in 2007, that figure was under 15 percent.
Minority women are also more likely to make partner than in the past: 7.3 percent of partners promoted in 2016 were women of color, compared to 5.7 percent in 2007. Minority women now represent 3 percent of all partners and 2.5 percent of equity partners. Women of color, however, are still less likely to be partners than either white women or minority men. And, even though there are more women of color practicing in law firms than minority men, the number of minority men serving on management committees is double that of minority women.
Meanwhile, attrition rates have not diminished. In 2016, 11 percent of all lawyers who left their firms were women of color. That figure is the same as 2009, at the height of the recession. And while the percentage of white women among associate departures has been slowly dropping, the same is not true for women of color.
Growing Number of Openly LGBTQ Attorneys
As is true for other diverse groups, representation of LGBTQ attorneys is highest among summer associates, but their numbers are increasing at all levels. According to the latest results, 2.5 percent of law firm attorneys are openly gay, lesbian, bisexual or transgender, and 4.6 percent of the 2016 summer associate class were LGBTQ. Some of these gains may be attributable to more widespread reporting, as the number of law firms that provide statistics for LGBTQ attorneys has grown since Vault and MCCA began collecting this data, from approximately 75 percent to more than 90 percent of surveyed firms.
Data Constraints for Attorneys with Disabilities
Underreporting remains an obstacle to capturing reliable data for attorneys with disabilities. Thirty percent of law firms surveyed do not track or report disability information. The numbers that were reported, while still quite small—well below 1 percent—are trending upward.

2017 Vault/MCCA Law Firm Diversity Report Page 6 of 51
2017 Vault/MCCA Survey Results
Unless otherwise indicated, all data in charts and tables reflect the most recent 2017 survey results.
Table 1. Overall Law Firm Demographics
Demographic 2L Summer Associates
Associates Of
Counsel
Non‐equity Partners
Equity Partners
All Partners
All Lawyers
White/Caucasian 68.38% 75.60% 86.94% 89.37% 91.29% 90.79% 83.58%
Asian American 14.79% 11.51% 5.21% 3.65% 3.20% 3.32% 7.18%
Hispanic/Latino 5.92% 4.85% 3.25% 3.24% 2.42% 2.64% 3.69%
African‐American/Black 6.57% 4.41% 2.72% 2.44% 1.80% 1.97% 3.14%
Multiracial 3.48% 2.90% 1.27% 0.85% 0.50% 0.59% 1.70%
Alaska Native/American Indian
0.21% 0.20% 0.19% 0.20% 0.13% 0.14% 0.18%
Native Hawaiian/Pacific Islander
0.08% 0.08% 0.05% 0.08% 0.03% 0.04% 0.06%
Openly LGBTQ 4.64% 3.28% 2.28% 1.67% 1.81% 1.77% 2.50%
Individuals with Disabilities 0.20% 0.39% 0.60% 0.42% 0.40% 0.40% 0.42%
All Racial Minorities 31.06% 23.95% 12.67% 10.46% 8.07% 8.70% 15.95%
All Women 48.99% 45.80% 39.83% 30.15% 19.81% 22.52% 35.03%
Women of Color 17.30% 13.36% 6.78% 4.59% 2.48% 3.03% 8.08%

2017 Vault/MCCA Law Firm Diversity Report Page 7 of 51
MINORITY MEN AND WOMEN
Minority Representation at Record High
Having hovered close to 14 percent for most of the last decade, representation of lawyers of color among law firm attorneys has reached nearly 16 percent. Progress is most evident among incoming associate classes: 31 percent of the 2Ls who were summer associates at firms in 2016 and accepted offers to return as full‐time associates were members of a racial/ethnic minority group. Similarly, lawyers of color are also advancing to partnership and serving in leadership roles in increasing numbers. Nevertheless, law firm partners and management remain overwhelmingly white. And attrition among minority attorneys is higher now than it was during the recession.
Overall Demographics: Associates, Partners and Counsel
This year’s survey results included the highest percentage of minority attorneys to date—across all categories, from associates to equity partners, from summer associates to management committee members.
Minority attorneys currently represent 16 percent (15.95%) of the law firm population. Their numbers, which increased from 15.65% in 2015, have maintained a gradual incline since the recessionary low of 13.44% reported in 2009. In 2007, the first year for which detailed statistics were collected, 13.81% of attorneys were minorities. This growth reflects an increasing number of lawyers of color among all levels tracked in the survey and among both genders.
Nearly one in four associates (23.95%) now identifies with a racial/ethnic minority group; that figure is more than three percentage points higher than the 20.78% reported back in 2007.
Attorneys of color are also more likely to be partners than they were in the past. In 2016, minority lawyers represented 8.70% of all partners, compared to 8.46% in 2015 and 6.30% in 2007. But a higher proportion of minority partners are salaried rather than stakeholders. Attorneys of color represent 10.46% of non‐equity partners, compared to 8.07% of equity partners.
That said, this year’s results include the highest percentage of minority equity partners since Vault and MCCA began collecting this data. Of 31,865 equity partners survey‐wide, 2,573 are attorneys of color—a notable increase over 2007, when just 5.62% of equity partners (1,767 of 31,449) were people of color.
The percentage of minority lawyers among of counsel has also increased, from 9.66% in 2007 to 12.29% in 2015 to 12.67% in 2016. The numbers for both men and women (5.90% and 6.78%, respectively) are the highest reported to date.
Leadership Roles
Representation of minority attorneys in law firm management is also at its highest level since 2007 and parallels the advances in the partnership ranks. The percentage of attorneys of color serving on law firm executive or management committees has grown more than 3 percentage points in the last decade: from 5.42% in 2007 to 7.50% in 2015 to 8.75% in the most recent survey results.
The survey data shows advances on other firmwide committees as well. For example, the percentage of minority attorneys serving on partner review committees increased in the last year from 7.19% to 7.61%, and the number serving on associate review committees also grew, from 10.32% to 11.15%. Ten years ago, these numbers were 5.60% and 7.37%, respectively.
These positions are more likely to be held by men than women. Minority women represent just 2.42% of lawyers serving on partner review committees and 4.47% of those on associate review committees.
More attorneys of color now head law firm offices and run practice groups than ever before. As of the end of 2016, 9.37% of U.S. office heads and 6.82% of practice group leaders were minorities, compared to 6.05% and 5.09%, respectively, in 2008.

2017 Vault/MCCA Law Firm Diversity Report Page 8 of 51
Two areas where minority representation has not grown at the same pace include hiring committees and diversity committees. At 17.09%, the percentage of lawyers of color serving on hiring committees is lower than that recorded for 2015 (17.66%), although still higher than the 15.84% reported back in 2007.
Meanwhile, fewer minorities serve on diversity committees than a decade ago. In 2007, 41.61% of lawyers on diversity committees were attorneys of color. That figure dropped, and has remained, below 40 percent since 2011. In 2016, 37.42% of diversity committee members at surveyed firms were minorities.
Recruitment
The survey results show that law firms have stepped up the recruitment of diverse attorneys—both at the law student level and among experienced lateral hires—and that more women than men are being hired.
Minority law students represented more than 30 percent (31.06%) of the 2016 class of 2L summer associates—the highest figure reported in the last 10 years and substantially higher than the 25.95% reported back in 2007. As has been the case since 2007, firms are hiring more minority women than men into their summer programs. The 2016 summer class included 1,058 (17.30%) female and 842 (13.76%) male minority law students.
The percentage of minority lawyers among new attorneys hired in 2016—including laterals and starting associates—dropped slightly since the prior year, from 24.72% to 24.44%. That said, it is still nearly 3 percentage points higher than it was in 2007 (21.57%).
Promotion to Partnership
Of the 1,951 lawyers who were made partner in 2016, 289 (14.81%) were attorneys of color, including 143 women and 146 men. Although that figure reflects only a modest increase over the previous year (14.26%), it is almost 2 percentage points higher than the 12.86% reported for 2007.
While more men than women were promoted in 2016, it is among women of color that we have seen the most gains over time. In 2007, 5.66% of partners promoted were minority women; in 2015, that number grew to 6.63%, and in 2016 it reached 7.33%. Meanwhile, minority men represented 7.48% of promotions in 2016, not substantially higher than the 7.20% reported 10 years earlier.
Retention and Attrition
As the number of lawyers of color hired and promoted continues to grow, so do their attrition numbers. Attorneys of color represent 16 percent of lawyers employed by law firms, but they account for a much higher percentage of lawyers who leave their firms. Of the 10,709 lawyers who left their firms in 2016, almost 22 percent (21.80%) were members of a racial or ethnic minority group. That figure, which reflects a percentage point increase over the prior year, is the largest to date—even higher than the recessionary peak of 2009, when 20.79% of departing attorneys were minorities.
The numbers are higher among associates: 26.72% of associates who left their firms in 2016 were people of color. That number is not only greater than the 26.15% reported last year, but also more than 3 percentage points higher than 2007 (23.36%).

2017 Vault/MCCA Law Firm Diversity Report Page 9 of 51
† Represents percentage of minority lawyers among attorneys hired each year (including starting associates and lateral hires) compared to percentage of minority lawyers among attorneys who left their firms that year (including associates, counsel and partners)
21.6% 21.8%
19.1%
21.0%21.5% 21.6%
22.3%
23.4%
24.7% 24.4%
18.7%19.8%
20.8%
19.0% 19.4%19.9% 19.9%
20.8% 20.8%21.8%
10%
12%
14%
16%
18%
20%
22%
24%
26%
2007 2008 2009 2010 2011 2012 2013 2014 2015 2016
Chart 1. Minority Lawyers: Hires vs Departures over Time†
Attorneys Hired Attorneys Who Left

2017 Vault/MCCA Law Firm Diversity Report Page 10 of 51
Results by Race/Ethnicity
The Vault/MCCA Survey collects information for seven different racial/ethnic groups: White/Caucasian, African‐American/Black, Hispanic/Latino, Asian American, Alaska Native/American Indian, Native Hawaiian/Pacific Islander and Multiracial. Although results for all attorneys of color are often combined, the survey data reveals disparate levels of progress among these groups.
83.6%
7.2%3.7% 3.1%
1.7%0.2%
0.1%
Chart 2. Law Firm Attorney Population, by Race/Ethnicity
White/Caucasian
Asian American
Hispanic/Latino
African‐American/Black
Multiracial
Alaska Native/American Indian
Native Hawaiian/Pacific Islander
2017 Vault/MCCA Law Firm Diversity Report Page 11 of 51
AFRICAN‐AMERICAN/BLACK
Little Progress for African‐American Attorneys
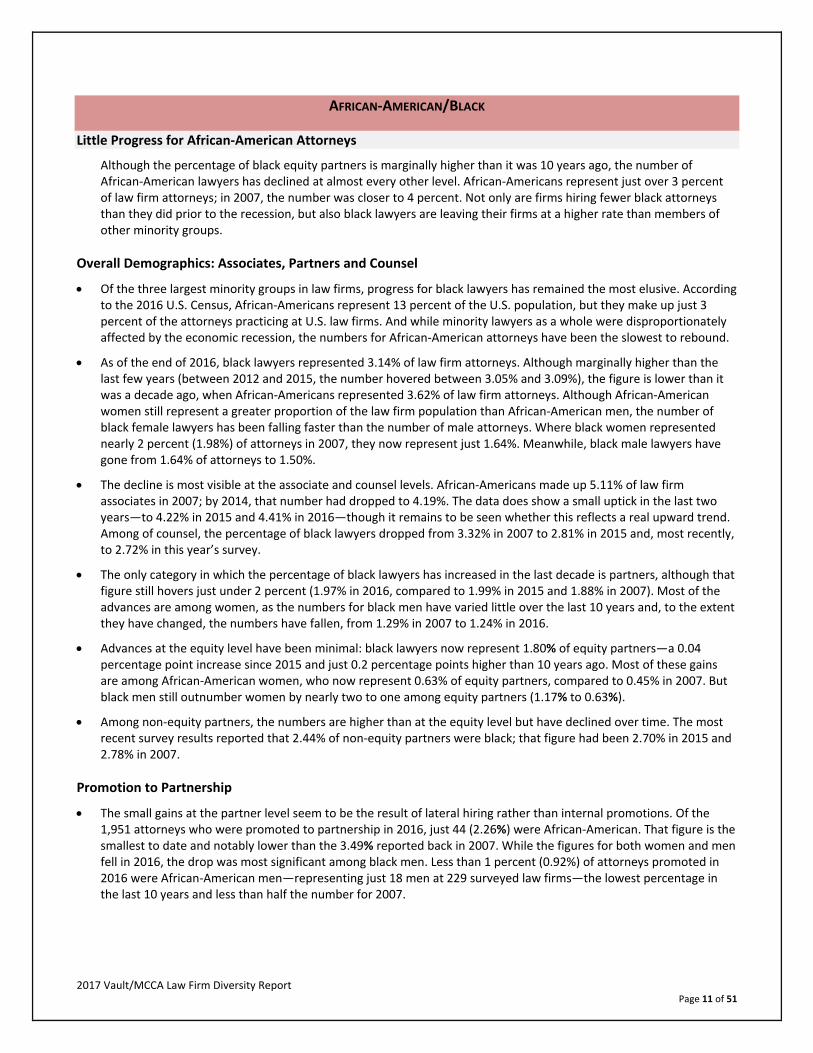
Although the percentage of black equity partners is marginally higher than it was 10 years ago, the number of African‐American lawyers has declined at almost every other level. African‐Americans represent just over 3 percent of law firm attorneys; in 2007, the number was closer to 4 percent. Not only are firms hiring fewer black attorneys than they did prior to the recession, but also black lawyers are leaving their firms at a higher rate than members of other minority groups.
Overall Demographics: Associates, Partners and Counsel
Of the three largest minority groups in law firms, progress for black lawyers has remained the most elusive. According to the 2016 U.S. Census, African‐Americans represent 13 percent of the U.S. population, but they make up just 3 percent of the attorneys practicing at U.S. law firms. And while minority lawyers as a whole were disproportionately affected by the economic recession, the numbers for African‐American attorneys have been the slowest to rebound.
As of the end of 2016, black lawyers represented 3.14% of law firm attorneys. Although marginally higher than the last few years (between 2012 and 2015, the number hovered between 3.05% and 3.09%), the figure is lower than it was a decade ago, when African‐Americans represented 3.62% of law firm attorneys. Although African‐American women still represent a greater proportion of the law firm population than African‐American men, the number of black female lawyers has been falling faster than the number of male attorneys. Where black women represented nearly 2 percent (1.98%) of attorneys in 2007, they now represent just 1.64%. Meanwhile, black male lawyers have gone from 1.64% of attorneys to 1.50%.
The decline is most visible at the associate and counsel levels. African‐Americans made up 5.11% of law firm associates in 2007; by 2014, that number had dropped to 4.19%. The data does show a small uptick in the last two years—to 4.22% in 2015 and 4.41% in 2016—though it remains to be seen whether this reflects a real upward trend. Among of counsel, the percentage of black lawyers dropped from 3.32% in 2007 to 2.81% in 2015 and, most recently, to 2.72% in this year’s survey.
The only category in which the percentage of black lawyers has increased in the last decade is partners, although that figure still hovers just under 2 percent (1.97% in 2016, compared to 1.99% in 2015 and 1.88% in 2007). Most of the advances are among women, as the numbers for black men have varied little over the last 10 years and, to the extent they have changed, the numbers have fallen, from 1.29% in 2007 to 1.24% in 2016.
Advances at the equity level have been minimal: black lawyers now represent 1.80% of equity partners—a 0.04 percentage point increase since 2015 and just 0.2 percentage points higher than 10 years ago. Most of these gains are among African‐American women, who now represent 0.63% of equity partners, compared to 0.45% in 2007. But black men still outnumber women by nearly two to one among equity partners (1.17% to 0.63%).
Among non‐equity partners, the numbers are higher than at the equity level but have declined over time. The most recent survey results reported that 2.44% of non‐equity partners were black; that figure had been 2.70% in 2015 and 2.78% in 2007.
Promotion to Partnership
The small gains at the partner level seem to be the result of lateral hiring rather than internal promotions. Of the 1,951 attorneys who were promoted to partnership in 2016, just 44 (2.26%) were African‐American. That figure is the smallest to date and notably lower than the 3.49% reported back in 2007. While the figures for both women and men fell in 2016, the drop was most significant among black men. Less than 1 percent (0.92%) of attorneys promoted in 2016 were African‐American men—representing just 18 men at 229 surveyed law firms—the lowest percentage in the last 10 years and less than half the number for 2007.

2017 Vault/MCCA Law Firm Diversity Report Page 12 of 51
Leadership Roles
Representation of African‐American attorneys at the management level has shown some growth but remains low. As of 2016, 2.38% of executive/management committee members were African‐American, the highest number reported to date. But black lawyers represent just 1.85% of attorneys on partner review committees—one of the lowest figures reported and the same as that recorded a decade ago. Similarly, at 2.84%, the percentage of African‐Americans serving on associate review committees is among the lowest numbers reported.
Moreover, African‐Americans were more likely to serve on the firms’ diversity committees prior to 2012 than they are now. Between 2007 and 2012, representation of black lawyers fell from 17.83% to 12.68%. In the most recent survey, 12.43% of diversity committee members were black. While their membership on hiring committees has grown since 2012, from 4.74% to 5.19%, it remains below that for previous years (for example, 5.91% in 2007). Hiring committees are the only management‐level committees in which black women outnumber black men.
Recruitment
Hiring of black lawyers, which had generally declined since 2007, has shown an uptick in the last few years, although it still remains below pre‐recession levels. In 2015, 4.86% of new lawyers hired were African‐American. In 2016, that number increased to 4.97%. (In 2007, it had been 5.61% and in 2008 5.28%.) The decline is primarily among women. In both 2007 and 2008, more than 3 percent of lawyers hired were African‐American women; since 2009 that number has not climbed above 2.77%, the most recent figure. Among men, the number has fluctuated from a high of 2.24% in 2007 to a low of 1.93% in 2010 and 2012. In 2016, it reached 2.20%.
The 2016 class of 2L summer associates included a smaller proportion of black students than the previous year: 6.57%, compared to 6.97%. That number is one of the lowest reported to date and well below the 7.27% recorded for 2007. Although the number of female students dropped most, law firms’ summer programs still included more women than men.
Retention and Attrition
Retention of African‐American lawyers remains an issue. Even though overall attrition rates for African‐Americans have declined over the last several years, from 5.76% in 2007 to 4.86% in 2016, black attorneys—especially women—continue to leave their firms at a higher rate than members of other minority groups.
The 520 African‐American lawyers who left their firms in 2016 represent 16.46% of the total number of black attorneys in law firms. Among black women, the figure exceeds 18 percent. By comparison, the number of Asian Americans who left represents 14.63% of their population, the number of Hispanic and Latino lawyers represents 12.80%, and the number of white attorneys represents 9.88%.
Table 2. Attorney Departures among Largest Racial/Ethnic Groups in 2016 As Percentage of their Overall Law Firm Population
Black/
African‐American Asian American Hispanic/Latino White/Caucasian
All Attorneys 16.5% 14.6% 12.8% 9.9%
Men 14.3% 14.9% 13.1% 9.1%
Women 18.4% 14.4% 12.4% 11.6%

2017 Vault/MCCA Law Firm Diversity Report Page 13 of 51
ASIAN AMERICAN
Population Growing but Limited Representation in Firm Leadership
Asian American lawyers are the largest minority group in law firms but the most underrepresented in firm leadership. Law firms employ more Asian American lawyers than Hispanic and African‐American attorneys combined, yet Asian American attorneys are less likely than members of other minority groups to be partners at their firms.
Overall Demographics: Associates, Partners and Counsel
The percentage of Asian American lawyers at surveyed firms has steadily increased over the last several years among both men and women at all levels and this year’s survey reflect the highest numbers reported to date. In contrast to Hispanics and especially African‐Americans, Asian American lawyers now represent a larger percentage of the law firm population than of the American population as a whole. While Asian Americans make up less 6 percent (5.7%) of the U.S. population, they represent more than 7 percent of lawyers at the firms surveyed. According to this year’s survey, 7.18% of law firm attorneys are Asian American, compared to 7.05% in 2015 and 6.15% in 2007.
More than 11% of associates (11.51%) are of Asian background, the highest figure reported in the last 10 years. Among these associates, women outnumber men, 6.62% to 4.90%.
The number of Asian American partners has also increased in that time. As of 2016, 3.32% of law firm partners are of Asian descent, higher than the 3.17% reported in 2015 and more than a percentage point above the 2.16% reported for 2007. Asian American attorneys represent 3.20% of equity partners, an increase over the prior year (3.08%) and well above the 1.90% reported for 2007.
In other attorney categories, Asian Americans represent 3.65% of non‐equity partners and 5.21% of counsel, numbers that have also grown with time and represent the highest figures to date. In 2007, 3.00% of non‐equity partners and 3.43% of counsel were Asian American.
Even though Asian Americans represent the largest minority group among law firm partners—in 2016, law firms reported 1,431 Asian American partners, compared to 1,137 Hispanic or Latino partners, and 850 African‐American partners —they are the most underrepresented group based on their share of the attorney population. Just one in five Asian American attorneys is a partner, whereas 27 percent of African‐Americans are partners and 31 percent of Latino lawyers are partners.
Leadership Roles
Asian Americans are also less well represented at management levels than other attorneys of color. Of the attorneys serving on law firm executive committees, just 2.70% are Asian American, compared to 2.38% who are black and 2.94% who are Latino. That said, the most recent figure is double that of a decade ago. In 2007, just 1.02% of lawyers serving on executive committees were Asian American.
The numbers are similarly low for other firmwide committees, with Asian Americans representing 2.57% of partner review committee members and 4.66% of those serving on associate review committees. At 6.24%, the number of Asian American layers on hiring committees is the lowest reported since 2009.
Promotion to Partnership
In 2016, 6.61% of attorneys promoted to partnership were Asian American—nearly half (3.23%) of them women. That figure is the highest to date and higher than that for any other minority group.
Still, the ratio of partners to associates is particularly low. There is just one Asian American partner to every three or four associates, compared to one African‐American or Hispanic partner for every two black or Hispanic associates. Among white lawyers, partners actually outnumber associates.

2017 Vault/MCCA Law Firm Diversity Report Page 14 of 51
Table 3. Ratio of Partners to Associates
Asian American African‐American/
Black Hispanic/Latino White/Caucasian
0.28 0.43 0.53 1.17
Recruitment
Nearly 11 percent of all new attorneys hired in 2016 (10.93%) were Asian American, slightly lower than the 11.00% reported for 2014, though still more than a percentage point above the 9.87% reported for 2007 and much higher than the figures for other minority groups. Women have been consistently hired in greater numbers than men, and their figures show more progress over time, increasing from 5.18% of new attorneys hired in 2007 to 6.23% in 2016. By contrast, the numbers for male Asian Americans since the recession have fluctuated between 4.58% in 2010 and 5.12% in 2014, with the most recent figures showing a decline from 4.79% in 2015 to 4.71% in 2016.
Hiring of summer associates has also grown by almost 2 percentage points over the last decade. In 2007, Asian law students represented less than 13 percent (12.88%) of 2Ls, whereas law firms reported that nearly 15 percent (14.79%) of the 2Ls employed in 2016 were Asian American, the highest figure recorded to date. Women make up a larger share of those summer classes; of the 905 Asian American 2Ls in 2016, 503 were women.
Retention and Attrition
Although attrition numbers among Asian American attorneys have fluctuated in the last several years, the latest increase puts the figure at a record high. In 2016, 9.86% of attorneys who left their firms were Asian American, compared to 9.52% in 2015 and 8.24% in 2007. The numbers dropped a little among women in 2016, from 5.34% to 5.15%, but they rose for men, from 4.18% to 4.72%.
Among associates, in particular, the number of Asian American men leaving their firms has gone up. In 2007, 4.69% of associate departures were Asian American men; by 2011, that number exceeded 5 percent and has continued to climb. In 2016, it reached 5.83%, the highest to date. While the percentage of female associates was lower than the previous year—6.84% compared to 7.14% in 2015—it is still one of the highest reported.

2017 Vault/MCCA Law Firm Diversity Report Page 15 of 51
HISPANIC/LATINO
Steady Gains among Hispanic and Latino Attorneys
Hispanic and Latino attorneys have seen some of the most consistent progress in law firms as their numbers have steadily increased at all levels, from recruitment to management representation. Hispanic lawyers are also more likely to be partners at their firms than either Asian American or African‐American lawyers, and they are less likely to leave.
Overall Demographics: Associates, Partners and Counsel
Hispanics are the largest minority group in the United States (17.8%, compared to 13.3% for African‐Americans and 5.7% for Asian Americans), but the least represented in law firms, relative to their share of the overall population. Less than 4 percent of law firm attorneys are Hispanic or Latino. But this year’s survey results show the highest percentage of Latino lawyers to date. Hispanic or Latino lawyers currently represent 3.69% of all law firm attorneys, up from the 3.60% reported for 2015 and higher than the 3.13% reported 10 years ago. That increase is reflected among all categories of attorney and for both genders.
Hispanics represent 4.85% of associates, a number that is nearly evenly split among men (1,074) and women (1,078). The numbers have steadily grown following a small drop during the recession and are now a half‐percentage point higher than they were back in 2007.
The numbers have also grown at the partner level: 2.64% of all partners are Hispanic or Latino, compared to 1.86% in 2007. Among equity partners, 2.42% are Hispanic or Latino, compared to the 1.75% reported 10 years ago, and 3.24% of non‐equity partners are Hispanic. A similar number (3.25%) of counsel are Hispanic or Latino.
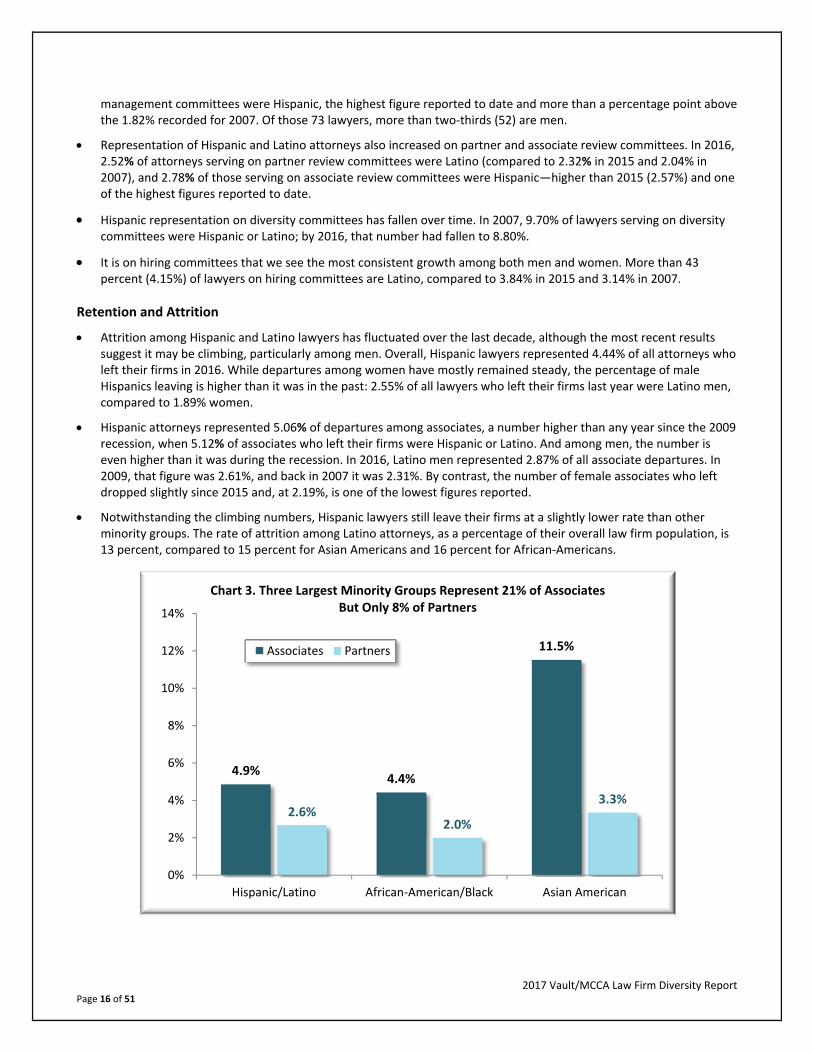
While the percentages remain relatively small, Latino attorneys are still more likely to be partners than either Asian American or African‐American lawyers. More than 30 percent (30.65%) of Hispanic lawyers in law firms are partners, compared to 27 percent (26.90%) of black lawyers and 20 percent (19.83%) of Asian American attorneys. Close to half (46.63%) of white attorneys are partners.
Promotion to Partnership
The number of Hispanic attorneys promoted to partner from associate or of counsel has fluctuated over the years, but the latest figure represents one of the highest to date. In 2016, nearly 4 percent (3.95%) of all lawyers promoted to partner were Hispanic or Latino. That figure represents a small improvement over the 3.81% reported last year and is exceeded only by the 4.04% reported for 2012.
Although the numbers for both genders are higher than they were 10 years ago, male Hispanics outnumber Hispanic women among equity partners by three to one (581 to 190).
Recruitment
Recruiting of Latino lawyers and law students has also increased. Of the 14,150 attorneys hired by law firms last year, 750, or 5.30%, were Hispanic or Latino. While that reflects a slight drop from the 5.35% reported for 2015, it is the second‐highest number recorded. In contrast to African‐American and Asian American lawyers, the number of new hires includes more men than women.
With respect to 2L summer associates, the latest results show an upward trend, with Hispanic and Latino law students making up 5.92% of the 2016 class, the second‐highest figure on record. The number of female law students hired outpaced that of men; 3.19% of 2Ls in 2016 were Hispanic and Latina women, compared to 2.73% for Hispanic men.
Leadership Roles
The number of Hispanic lawyers serving in leadership roles has shown steady improvement among both genders, although men continue to outnumber women in most positions. In 2016, 2.94% of attorneys on executive or
2017 Vault/MCCA Law Firm Diversity Report Page 16 of 51
management committees were Hispanic, the highest figure reported to date and more than a percentage point above the 1.82% recorded for 2007. Of those 73 lawyers, more than two‐thirds (52) are men.
Representation of Hispanic and Latino attorneys also increased on partner and associate review committees. In 2016, 2.52% of attorneys serving on partner review committees were Latino (compared to 2.32% in 2015 and 2.04% in 2007), and 2.78% of those serving on associate review committees were Hispanic—higher than 2015 (2.57%) and one of the highest figures reported to date.
Hispanic representation on diversity committees has fallen over time. In 2007, 9.70% of lawyers serving on diversity committees were Hispanic or Latino; by 2016, that number had fallen to 8.80%.
It is on hiring committees that we see the most consistent growth among both men and women. More than 43 percent (4.15%) of lawyers on hiring committees are Latino, compared to 3.84% in 2015 and 3.14% in 2007.
Retention and Attrition
Attrition among Hispanic and Latino lawyers has fluctuated over the last decade, although the most recent results suggest it may be climbing, particularly among men. Overall, Hispanic lawyers represented 4.44% of all attorneys who left their firms in 2016. While departures among women have mostly remained steady, the percentage of male Hispanics leaving is higher than it was in the past: 2.55% of all lawyers who left their firms last year were Latino men, compared to 1.89% women.
Hispanic attorneys represented 5.06% of departures among associates, a number higher than any year since the 2009 recession, when 5.12% of associates who left their firms were Hispanic or Latino. And among men, the number is even higher than it was during the recession. In 2016, Latino men represented 2.87% of all associate departures. In 2009, that figure was 2.61%, and back in 2007 it was 2.31%. By contrast, the number of female associates who left dropped slightly since 2015 and, at 2.19%, is one of the lowest figures reported.
Notwithstanding the climbing numbers, Hispanic lawyers still leave their firms at a slightly lower rate than other minority groups. The rate of attrition among Latino attorneys, as a percentage of their overall law firm population, is 13 percent, compared to 15 percent for Asian Americans and 16 percent for African‐Americans.
4.9%4.4%
11.5%
2.6%2.0%
3.3%
0%
2%
4%
6%
8%
10%
12%
14%
Hispanic/Latino African‐American/Black Asian American
Chart 3. Three Largest Minority Groups Represent 21% of Associates But Only 8% of Partners
Associates Partners

2017 Vault/MCCA Law Firm Diversity Report Page 17 of 51
MULTIRACIAL, ALASKA NATIVE/AMERICAN INDIAN AND NATIVE HAWAIIAN/PACIFIC ISLANDER
Populations of Alaska Natives, American Indians, Native Hawaiians and Pacific Islanders Remain Small, as Number of Multiracial Lawyers Grows
The Vault/MCCA Survey uses racial/ethnic classifications based on those of the U.S. Equal Employment opportunity Commission. In 2007, the EEOC, which requires employers with at least 100 employees (as well as certain government contractors) to file an annual workforce report, revised its list of racial/ethnic classifications. The EEOC divided the former category “Asian or Pacific Islander” into two separate categories: “Asian” and “Native Hawaiian or other Pacific Islander.” The agency also added a new category, “Two or more races,” for non‐Hispanics who identify with more than one race (previously, individuals had to identify as a single race).
Although most of the law firms Vault and MCCA survey report demographic data for all seven racial/ethnic groups, some firms do not yet track numbers for multiracial attorneys and some continue to group Native Hawaiian/Pacific Islanders together with Asian Americans. Because of these reporting anomalies and because the numbers among these groups are relatively small, it can be hard to assess changes over time; but for the most part, the numbers seem to be increasing.
Overall Demographics: Associates, Partners and Counsel
In addition to African‐American/Black, Hispanic/Latino and Asian American, other racial minority groups for which the Vault/MCCA survey collects data include multiracial lawyers (individuals who identify as two or more races), Alaska Native/American Indian attorneys and Native Hawaiian/Pacific Islanders.
Collectively, these three groups represent less than 2 percent of lawyers survey‐wide. With 1,709 lawyers across all firms, multiracial lawyers make up the largest of these groups. The number of attorneys identifying with two or more races has nearly tripled in the last decade; multiracial lawyers now represent 1.70% of the law firm population, compared to 0.64% in 2007. It is worth noting, though, that this growth may be attributable partly to increased tracking of multiracial data rather than solely to increased hiring or retention.
Individuals who identify with two or more races represent 2.90% of associates and 0.59% of all partners. Like other minority groups, they are better represented at the non‐equity tier (0.85%) than at the equity level (0.50%). Among of counsel, 1.27% are multiracial.
Native Hawaiian, Pacific Islander, Alaska Native and American Indian attorneys collectively make up less than 0.3 percent of lawyers—just 234 of more than 100,000 attorneys survey‐wide in 2016—a figure that has changed little over the last 10 years. In 2016, law firms reported 177 Alaska Native/American Indian attorneys (0.18% of all lawyers) and 57 Native Hawaiians/Pacific Islanders (0.06% of lawyers).
Alaska Natives and American Indians represent 0.20% of associates, 0.13% of equity partners, 0.20% of non‐equity partners and 0.19% of counsel.
Native Hawaiians and Pacific Islanders represent 0.08% of associates, 0.03% of equity partners, 0.08% of non‐equity partners and 0.05% of counsel.
Promotion to Partnership
Multiracial lawyers represented 1.64% of partner promotions, the highest figure reported in the last 10 years. The new partner class included an equal number of men and women.
Just 2 of the 1,951 partners promoted in 2016 (0.10%) were Native Hawaiian or Pacific Islanders and Alaska Natives/American Indians represented 0.26% of new partners (5 lawyers).
Leadership Roles
These three groups combined represent less than 1 percent of each of the firmwide management‐level committees for which the survey collects data. Of the three groups, multiracial attorneys are best represented within firm

2017 Vault/MCCA Law Firm Diversity Report Page 18 of 51
leadership. Twelve of the attorneys serving on firm executive/management committees (0.48%) identify with two or more races. That figure is down from the 0.59% reported for 2015 but otherwise higher than prior years. Multiracial lawyers represent 0.41% of lawyers on partner review committees, 0.76% attorneys on associate review committees and 1.23% of hiring committee members.
Among the other groups serving on executive/management committees, five attorneys (0.20%) are Alaska Natives or American Indians, down from 0.29% reported last year; and one (0.04%) is a Native Hawaiian or Pacific Islander, a figure that has not changed in the last year.
Native Hawaiians and Pacific islanders have very limited at the management level. Only a single Native Hawaiian or Pacific Islander was reported on any of the law firm partner review committees (0.05%), none were recorded as members of associate review committees, and just two lawyers (0.05%) were reportedly serving on hiring committees as of December 2016.
Numbers for Alaska Native/American Indian attorneys are slightly higher. They represent 0.21% of lawyers on partner review committees, 0.11% of lawyers serving on associate review committees and 0.23% of attorneys on hiring committees.
Most of these groups fare better on diversity committees, whose members include 0.51% Alaska Native/American Indian, 0.04% Native Hawaiian/Pacific Islander and 2.44% multiracial attorneys.
Recruitment
Multiracial individuals represented approximately 3 percent of summer associates and attorneys hired by firms in 2016. Of the 6,117 summer associates employed by surveyed law firms in 2016, 3.48% were multiracial, and 3.04% of new lawyers hired (including starting associates and laterals) identified with two or more races. Although the number of new hires is a little lower than 2015 (3.48%), it is still more than double the figure reported for 2007 (1.28%).
Less than 1 percent of law students and lawyers hired were Alaska Native/American Indian attorneys and Native Hawaiian/Pacific Islanders. The 2L summer associate class included 13 American Indians or Alaska Natives (0.21%), and 5 Native Hawaiians or Pacific Islanders (0.08%).
Among the 14,150 new attorneys hired in 2016, just 0.16% (22 lawyers) were Alaska Natives or American Indians and 0.04% (6 attorneys) were Native Hawaiians or Pacific Islanders.
Retention and Attrition
Like other minority groups, multiracial attorneys are overrepresented among lawyer departures. According to the latest attrition data, 2.38% of lawyers who left their firms in 2016 were individuals who identify as more than one race. Eighteen Alaska Natives or American Indians (0.17%) were among the attorneys who left their firms, and 11 lawyers (0.10%) were Native Hawaiians or Pacific Islanders.

2017 Vault/MCCA Law Firm Diversity Report Page 19 of 51
Chart 4. Attorney Position by Race/Ethnicity
Nearly half of white attorneys are partners, whereas lawyers of color are much more likely to be associates
60%
51%
75%
71%
62%
58%
40%
11%
14%
10%
9%
11%
11%
13%
30%
35%
15%
20%
27%
31%
47%
0% 10% 20% 30% 40% 50% 60% 70% 80% 90% 100%
Native Hawaiian/Pacific Islander
Alaska Native/American Indian
Multiracial
Asian American
African‐American/Black
Hispanic/Latino
White/Caucasian
Associates Of Counsel Partners

2017 Vault/MCCA Law Firm Diversity Report Page 20 of 51
LGBTQ ATTORNEYS
Rising Number of Openly LGBTQ Attorneys
According to the latest results, more than 2 percent of law firm attorneys are openly gay, lesbian, bisexual or transgender, a number that has been slowly rising over the last decade. The numbers are nearly double among summer associates. Some of these gains may be attributable to more widespread reporting, as the number of law firms that provide statistics for LGBTQ attorneys has grown since Vault and MCCA began collecting this data, from approximately 75 percent to more than 90 percent of surveyed firms.
Overall Demographics: Associates, Partners and Counsel
The numbers reported for openly gay, lesbian, bisexual and transgender attorneys at law firms continue to grow. Increased reporting of LGBTQ figures may have had an impact on the percentages reported, so not every numerical increase necessarily translates to an actual increase in the LGBTQ population.
According to the latest survey results, openly LGBTQ lawyers represent 2.50% of law firm attorneys (2,517), the largest number reported since 2007. The majority (70%) of these lawyers are men. LGBTQ attorneys now represent 3.28% of associates, up from 3.00% in 2015 and well above the 1.98% reported for 2007. Among of counsel, 2.28% are openly LGBTQ, also the highest figure reported to date.
Openly LGBTQ lawyers represent 1.81% of equity partners and 1.67% of non‐equity partners. Within the partnership ranks as a whole (including both equity and non‐equity tiers), 1.77% of partners are LGBTQ —the highest number reported to date. In 2007, that figure was 1.16%.
Promotion to Partnership
Promotion numbers have varied across the last decade. The most recent figures are below last year but above those reported for other years. Less than 2 percent (1.54%) of the partners promoted in 2016 were openly LGBTQ, down from the 2.04% reported in the previous year but higher than the figure reported for 2007 (1.18%). Just 5 of the 30 lawyers were women.
Leadership Roles
At the leadership level, LGBTQ numbers remain fairly low. This year, 1.61% of attorneys serving on management/executive committees were reported as LGBTQ, which is down slightly from the 1.63% reported in 2015.
At 1.51%, the percentage of practice leaders who are openly LGBTQ is also below the prior year (1.59%) but otherwise higher than any figure reported since 2008, the first year this data was collected. LGBTQ lawyers represent 1.94% of attorneys heading U.S. offices, the highest reported to date.
The data for partner and associate review committees show little improvement. Openly LGBTQ attorneys represent just 1 percent (0.98%) of lawyers serving on partner review committees—a figure lower than any reported since 2011. They represent 1.80% of attorneys on associate review committees, which is lower than it has been since 2009.
But on hiring committees and diversity committees, firms reported the highest percentage of LGBTQ lawyers to date. More than 3 percent (3.13%) of lawyers on hiring committees are openly LGBTQ (compared to 1.83% in 2007), and 8 percent (8.03%) of diversity committee members are LGBTQ, compared to 6.36% in 2007.
Recruitment
This year’s survey also shows an increase in law firm recruitment. Among summer associates in 2016, the number of LGBTQ students climbed to its highest rate. Firms reported that 4.64% of 2Ls were LGBTQ, more than double the number reported for 2007 (2.01%).

2017 Vault/MCCA Law Firm Diversity Report Page 21 of 51
Of new attorneys hired last year, 3.05% were reported as LGBTQ. This figure is more than twice the 1.43% reported a decade ago.
Retention and Attrition
The percentage of LGBTQ attorneys among attorney departures in 2016 dropped from 2.36% in 2015 to 1.92%, the lowest figure since 2012.

2017 Vault/MCCA Law Firm Diversity Report Page 22 of 51
INDIVIDUALS WITH DISABILITIES
Numbers Inch Upward for Attorneys with Disabilities
Underreporting remains an obstacle to capturing reliable data for attorneys with disabilities. Thirty percent of law firms surveyed do not track or report disability information; in prior years, that figure was closer to 35 percent. The numbers that were reported, while still quite small—well below 1 percent—are trending upward.
Overall Demographics: Associates, Partners and Counsel
Reliable data for attorneys with disabilities remains difficult to capture because of underreporting, although the numbers are trending upward. According to the American Community Survey (ACS), individuals with disabilities represent approximately 13 percent of the U.S. population. The Vault/MCCA survey data indicates that attorneys with disabilities represent less than 1 percent of lawyers at law firms, but a sizeable minority (approximately 30 percent of surveyed firms) still do not disclose disability information.
Of 100,503 attorneys survey‐wide, 425 (0.42%) were reported to be individuals with disabilities in 2016. This figure is nearly triple the 0.15% reported for 2007.
Individuals with disabilities represent 0.39% of associates, 0.40% of all partners, 0.40% of equity partners, 0.42% of non‐equity partners and 0.60% of counsel. Each of these figures reflects the highest number recorded to date.
Recruitment
Among summer associates in 2016, 12 students were reported to be individuals with disabilities (0.20% of the 2L class) and 59 attorneys with disabilities were reported among law firms’ new attorney hires (representing 0.42% of all new hires). While still low, those numbers are more than double what they were a decade ago; in 2007, firms reported hiring just 5 summer associates and 12 lawyers with disabilities.
Promotion to Partnership
According to the latest survey, law firm partners promoted in 2016 included seven attorneys with disabilities (0.36%), a number higher than any previous year.
Leadership Roles
Individuals with disabilities represent a very small percentage of the attorneys serving at the management level. Among the 229 law firms that took this year’s survey, the results included 8 lawyers with disabilities on executive/management committees (0.32%), 3 on partner review committees (0.15%) and 10 on associate review committees (0.28%).
Among attorneys managing U.S. offices, 0.65% (12 lawyers) are individuals with disabilities. Lawyers with disabilities represent 0.61% (34 attorneys) of practice group leaders. Albeit low, those numbers are much higher than they were in 2008, when fewer than 10 lawyers with disabilities managed practice groups or law firm offices.
The numbers have also grown with respect to hiring committee and diversity committee membership. Individuals with disabilities now represent 0.68% of diversity committee members and 0.37% of lawyers on hiring committees.
Retention and Attrition
While attrition numbers among individuals with disabilities have increased, that may reflect greater disclosure on the part of individual lawyers or firms as much as an actual rise in the number of departures. Lawyers with disabilities represented 0.34% (36 lawyers) of the 10,709 attorneys who left their firms last year.

2017 Vault/MCCA Law Firm Diversity Report Page 23 of 51
WOMEN
More Women in Positions of Leadership
According to this year’s survey, 35 percent of all law firm attorneys are female, the highest figure reported in the last decade. Law firms are hiring and promoting more women than in the past. One in five equity partners is female, and 22 percent of lawyers currently serving on law firm executive or management committees are women. Nevertheless, retention of female attorneys continues to be an issue. Approximately 40 percent of lawyers who left their firms in 2016 were women, a number that has remained relatively constant since 2007.
Overall Demographics: Associates, Partners and Counsel
Between 2007 and 2014, women accounted for about one‐third of law firm attorneys. Last year, the number climbed above 34 percent (34.44%), and in the most recent survey law firms reported that female attorneys represent 35 percent (35.03%) of their population, the highest number to date.
Approximately 46 percent (45.80%) of associates are women—a figure that has grown over 1 percentage point since 2007. The changes primarily reflect gains among minority women. Since 2007, the percentage of white women among law firm associates has dropped from 33.01% to 32.43%, while representation of women of color has climbed from 11.65% to 13.36%. Among of counsel, 39.83% are women, a slight increase from the 39.39% reported the previous year.
Progress is more obvious at the partnership level. Women now represent over 22 percent (22.52%) of all law firm partners, higher than the 21.86% reported in 2015 and 4 percentage points higher than the 18.46% reported back in 2007. Almost 20 percent (19.81%) of equity partners are women, a small improvement over 2015 (19.45%) and well above the 16.05% reported 10 years ago. Like minority lawyers, however, female partners are better represented at the salaried level than the equity tier. Women currently represent 30.15% of non‐equity partners.
Promotion to Partnership
A higher percentage of women were promoted to partner in 2016 than in any of the previous nine years. In 2016, 36.24% of the partners promoted at participating law firms were women, compared to 34.57% in 2015 and 30.03% in 2007. These numbers have increased among both white women and women of color.
In addition, at 26.95%, the percentage of women among all new equity partners in 2016—which includes lateral hires as well as internal promotions—was the highest to date, 6 percentage points higher than 2007.
Leadership Roles
The survey results show that more women have advanced into positions of leadership. Since 2007, women’s representation on law firm executive or management committees has grown from less than 15 percent (14.81%) to more than 20 percent (21.77%). This reflects gains made by both white women and women of color, as minority women represent a small but growing number of the women (13 percent) serving on these committees.
One in five (20.19%) attorneys who heads a U.S. office is a woman, and 21.12% of the lawyers who lead practices are female. In 2008, when this data was first collected, 14.39% of attorneys heading offices were female and 18.38% of practice group leaders were women.
Women now represent 23.48% of the attorneys serving on partner review committees (compared to 16.93% in 2007) and 29.89% of associate review committee members (compared to 24.42% in 2007).
Women represent 37.45% of the attorneys on law firm hiring committees—the second‐highest number to date. Meanwhile, their representation on diversity committees, which has fluctuated over the years, is now at 44.21%, the second‐lowest reported in the last 10 years.

2017 Vault/MCCA Law Firm Diversity Report Page 24 of 51
Recruitment
According to this year’s survey, law firms hired more female law students in 2016 than they had in any of the previous nine years. The 2L summer class included 49 percent women (48.99%). While white women still make up the majority of these hires, the latest gains were mostly among women of color, whose representation increased from 16.51% in 2015 to 17.30% in 2016. Back in 2007, minority women represented just 14.63% of 2Ls in law firms.
The number of female attorneys who joined law firms in 2016—whether as laterals or as starting associates—also grew. The percentage of women among all new attorney hires increased by more than 1.5 percentage points over the previous year, from 42.25% to 43.77%, the highest number reported to date.
Retention and Attrition
Attrition is one area in which the survey results show less progress. The number of women among lawyers who left their firms has hovered around 40 to 41 percent for the last decade. But in 2016, the figure dropped slightly, from 2015, from 40.82% to 40.32%.
The numbers look somewhat better among associates. Women represented 45.07% of all associates who left their firms in 2016, compared to 46.84% in 2015 and to 47.66% a decade ago. The improvements, however, seem to be primarily among white women. In 2007, 34.64% of associates who left their firms were white women; in 2016, that figure dropped to 31.16%, the lowest figure to date. Among women of color, however, the number has grown over the same timeframe, from 13.02% to 13.91%.
18%
14%
24%
17%
35%
15%
21%
20%
30%
23%
37%
22%
0% 5% 10% 15% 20% 25% 30% 35% 40%
Practice group/department leaders
U.S. office heads
Associate review committee
Partner review committee
Hiring committee
Executive/management committee
Chart 5. Women in Leadership Roles: 2016 vs 2007
2016 2007* *2008 for US office heads and practice leaders

2017 Vault/MCCA Law Firm Diversity Report Page 25 of 51
† Represents percentage of women among attorneys hired each year (including starting associates and lateral hires) compared to percentage of women among attorneys who left their firms that year (including associates, counsel and partners)
42.2%
40.7%
38.0%
42.3%41.5%
40.6%41.6% 41.3%
42.3%
43.8%
40.7%40.1%
41.0%
41.6%41.4%
40.5% 40.5%40.0%
40.8%40.3%
30%
32%
34%
36%
38%
40%
42%
44%
46%
2007 2008 2009 2010 2011 2012 2013 2014 2015 2016
Chart 6. Women: A orney Hires vs Departures over Time†
Attorneys Hired Attorneys Who Left

2017 Vault/MCCA Law Firm Diversity Report Page 26 of 51
WOMEN OF COLOR
Limited Gains for Women of Color
Despite some progress over the last decade—including increased recruitment and promotion—minority women remain underrepresented among the attorneys who lead law firms and overrepresented among those who leave.
Overall Demographics: Associates, Partners and Counsel
According to the latest survey results, women represent 35 percent of all law firm attorneys. Of those women, 23 percent are members of racial/ethnic minority groups. Women of color now represent just over 8 percent (8.08%) of all law firm lawyers—a gain of one percentage point since 2007 (7.01%).
In each of the last 10 years, the number of minority associates have included more women than men. As of the end of 2016, minority women represent 13.36% of associates, compared to 10.59% for minority men. In fact, women of color represent a larger share of the overall law firm population than minority men. Of the 100,503 attorneys at 229 law firms survey‐wide, 8,119 are minority women and 7,912 are minority men.
While minority women now make up a larger share of the partnership ranks than in the past, the figure remains quite small. Women of color represent just 3 percent (3.03%) of all partners—compared to 1.90% in 2007—and 2.48% of equity partners.
Women of color are still less likely to be partners than either white women or minority men. Where 31 percent of both white female attorneys and minority men are partners, just 16 percent of minority female lawyers are.
Although male lawyers of color continue to outnumber women at the partnership level, the gender gap is narrowing. In 2007, the ratio of men to women among minority partners was more than 2 to 1 (2.31). That figure has been slowly dropping over the last 10 years and fell to 1.87 in the most recent survey. In 2017, law firms reported that their partner ranks included 2,445 minority men and 1,308 minority women.
Recruitment
Law firms are hiring more women of color than in the past, at both the starting associate and lateral levels. More than 13 percent (13.18%) of all attorneys hired in 2016 were women of color, compared to 11.26% for minority men.
Law firm summer classes include more minority women than men, and female students of color accepted associate job offers at a higher rate than men. Women of color represented 17.30% of 2L summer associates in 2016, compared to 13.76% for minority men. Of the 2L summer associates who were offered and accepted full‐time positions in 2016, 17.51% were minority women, compared to 13.30% for minority men.
Promotion to Partnership
Women of color are also more likely to be promoted to partner than they were 10 years ago: 7.33% of partners promoted in 2016 were women of color, compared to 6.63% in last year’s survey and 5.66% in 2007.
Leadership Roles
Women of color are also more likely to hold leadership positions than they did in the past. The number of women of color serving on executive/management committees has more than doubled in the last 10 years. In 2007, 1.21% of executive committee members were minority women; in 2016, that number reached 2.78%.
Minority women represent 2.42% of partner review committees (compared to 1.17% in 2007), 4.47% of lawyers serving on associate review committees (compared to 2.95% in 2007), and 8.40% of lawyers on law firm hiring committees.
Nevertheless, minority men still outnumber minority women by two to one on most of these management‐level committees. For example, firms reported that 69 of the 2,481 attorneys serving on executive/management committees as of the end of 2016 were women of color, compared to 148 minority men and 471 white women.

2017 Vault/MCCA Law Firm Diversity Report Page 27 of 51
Among law firm diversity committees, women of color are less well represented than they were several years ago. According to this year’s survey, minority women represent 17.53% of lawyers on diversity committees; but from 2007 to 2010, that figure exceeded 19 percent.
Retention and Attrition
Law firms reported slightly lower attrition numbers for women of color in this year’s survey, although the figures continue to exceed those recorded for every other year, including 2009, the height of recessionary layoffs. In 2016, 11.08% of all attorneys who left their firms were women of color, compared to 11.29% in 2015, 11.00% in 2009 and 9.90% back in 2007.
And while the percentage of white women among associate departures has been slowly dropping, the same is not true for women of color. Minority women have represented between 13 and 14 percent of all associate departures for the last 10 years. Of the 6,758 associates who left their firms in 2016, nearly 14% (13.91%) were women of color—less than the 14.65% reported for the previous year but higher than the 13.02% reported a decade ago.
7.0%
11.7%
5.7%
1.5%
9.9%
8.1%
13.4%
7.3%
2.5%
11.1%
0%
2%
4%
6%
8%
10%
12%
14%
All Lawyers Associates Partners Promoted Equity Partners Attorney Attrition
Chart 7. Law Firms Are Hiring and Promoting—but also Losing—More Women of Color
2007 2016

2017 Vault/MCCA Law Firm Diversity Report Page 28 of 51
PART‐TIME ATTORNEYS
According to this year’s survey, 6.50% of law firm attorneys (6,536 lawyers) work a part‐time schedule. Two‐thirds (66.85%) of those lawyers are women, and relatively few are partners. The majority—more than three‐quarters—are either associates or of counsel.
The percentage of associates with part‐time schedules has steadily declined since the peak of 2009, when 5.78% of associates worked part‐time. In 2015, 4.69% of all associates worked a part‐time or reduced‐hours schedule, and that figure dropped to 4.60% in 2016. At the associate level, part‐time women outnumber men by a ratio of nearly 6 to 1, but the latest survey results show a slight uptick in the number of male lawyers working part‐time schedules.
Male of counsel are much more likely to have part‐time schedules. Firms reported that 1,313 men and 1,711 women of counsel worked a part‐time schedule as of the end of 2016. Although the number of women has been higher in several other years, among men the figure is one of the largest to date.
Within the partner ranks, 6.27% of non‐equity partners and just 2.70% of equity partners have part‐time schedules.
31%
46%
11%
13%
Chart 8. Attorneys Working Part‐time Schedules
Associates
Of Counsel
Non‐equity Partners
Equity Partners

2017 Vault/MCCA Law Firm Diversity Report Page 29 of 51
Appendices

2017 Vault/MCCA Law Firm Diversity Report Page 30 of 51
Methodology
Findings are based on law firm responses to the annual Vault/Law Firm Diversity Survey. Survey results for the years 2007 through 2016 are available online in the Law Firm Diversity Database (http://mcca.vault.com). Data for years prior to 2007 is available in an earlier version of the database, at http://mcca.vault.com/LawDiversity/.
All data reported is based on calendar year. The most recent survey, soliciting data as of December 31, 2016, was distributed in the spring of 2017 and published in August 2017.
More than 220 law firms participate in the survey each year, representing more than 90 percent of the AmLaw 100 and Vault Law 100, and a majority of the NLJ 250. The most recent survey includes data for 229 law firms.
The Vault/MCCA Survey is administered by Vault.com. The results are compiled and the annual report is produced under the direction of Vault’s managing director of research and consulting, Vera Djordjevich.
The survey collects demographic data for permanent attorney staff in the United States and uses the following definitions:
Associate: A non‐partner lawyer who has no ownership rights or responsibilities but who has an opportunity to become an owner; associates are employees of the firm and are considered on partnership track, even if they ultimately leave the firm or are not chosen for partnership.
Summer associate: A law student, usually between second and third year (called a 2L, in that case), who serves as a law associate for the summer and is supervised by a lawyer or lawyers.
Equity partner: An attorney, generally referred to as a partner, member or shareholder, who has the right to share in the profits of the firm.*
Non‐equity partner: A law firm employee who has been promoted from associate to a tier of partnership in which the lawyer does not share in the profits or capital of the firm; this position is often an intermediate step toward full equity partner. (Law firms with more than one tier of partnership were asked to provide equity and non‐equity partner data separately, although a small number of firms refused to publicly disclose equity/non‐equity breakdowns.)*
Of counsel: A lawyer, who may be known as of counsel, counsel, special counsel, staff attorney or senior attorney, who is neither an associate nor a partner; the lawyer does not currently share in the firm's profits but might be on a track that enables consideration for partnership. He or she is a permanent employee of the firm and not a temporary or contract attorney. This category may also include an attorney who has retired from a partnership position but remains an employee, sometimes on a part‐time basis.
New hire: An attorney who has joined the firm sometime during the year indicated on the table (e.g., in 2012); this includes all first‐year associates, laterals and partners (both equity and non‐equity). It does not include summer associates.
Minorities: Those whose race is other than White/Caucasian, including the following categories designated by the Equal Employment Opportunity Commission: African‐American/Black (not Hispanic or Latino); Hispanic/Latino; Alaska Native/American Indian; Asian; Native Hawaiian/Other Pacific Islander; and Multiracial (those who identify with two or more of the above races).
Where the findings refer to all law firm attorneys, the figures include only those permanent attorney staff defined above: i.e., associates, equity partners, non‐equity partners and of counsel.
* The majority of law firms surveyed have more than one tier of partnership, although not all disclosed the number of equity vs non‐equity partners, instead combining the figures into a single category.

2017 Vault/MCCA Law Firm Diversity Report Page 31 of 51
Tables
Table A1. Changes in Law Firm Demographics: 2016 vs 2007
percentage drop / percentage increase
Demographic Year 2L Summer Associates
AssociatesOf
Counsel
Non‐equity Partners
Equity Partners
All Partners
All Lawyers
White / Caucasian 2016 68.38% 75.60% 86.94% 89.37% 91.29% 90.79% 83.58%
2007 73.43% 78.96% 89.43% 91.17% 93.65% 93.06% 85.72%
Asian American 2016 14.79% 11.51% 5.21% 3.65% 3.20% 3.32% 7.18%
2007 12.88% 9.96% 3.43% 3.00% 1.90% 2.16% 6.15%
Hispanic / Latino 2016 5.92% 4.85% 3.25% 3.24% 2.42% 2.64% 3.69%
2007 4.08% 4.33% 2.35% 2.21% 1.75% 1.86% 3.13%
African‐American / Black 2016 6.57% 4.41% 2.72% 2.44% 1.80% 1.97% 3.14%
2007 7.27% 5.11% 3.32% 2.78% 1.60% 1.88% 3.62%
Multiracial 2016 3.48% 2.90% 1.27% 0.85% 0.50% 0.59% 1.70%
2007 1.23% 1.05% 0.36% 0.21% 0.20% 0.20% 0.64%
Alaska Native / American Indian
2016 0.21% 0.20% 0.19% 0.20% 0.13% 0.14% 0.18%
2007 0.37% 0.22% 0.11% 0.16% 0.15% 0.15% 0.18%
Native Hawaiian / Pacific Islander
2016 0.08% 0.08% 0.05% 0.08% 0.03% 0.04% 0.06%
2007 0.12% 0.12% 0.08% 0.09% 0.03% 0.04% 0.08%
Openly LGBTQ 2016 4.64% 3.28% 2.28% 1.67% 1.81% 1.77% 2.50%
2007 2.01% 1.98% 1.25% 1.17% 1.16% 1.16% 1.58%
Individuals with Disabilities
2016 0.20% 0.39% 0.60% 0.42% 0.40% 0.40% 0.42%
2007 0.05% 0.13% 0.24% 0.16% 0.17% 0.16% 0.15%
All Racial Minorities 2016 31.06% 23.95% 12.67% 10.46% 8.07% 8.70% 15.95%
2007 25.95% 20.78% 9.66% 8.45% 5.62% 6.30% 13.81%
All Women 2016 48.99% 45.80% 39.83% 30.15% 19.81% 22.52% 35.03%
2007 46.53% 44.66% 35.63% 26.17% 16.05% 18.46% 33.10%
Women of Color 2016 17.30% 13.36% 6.78% 4.59% 2.48% 3.03% 8.08%
2007 14.63% 11.65% 4.78% 3.11% 1.52% 1.90% 7.01%

2017 Vault/MCCA Law Firm Diversity Report Page 32 of 51
49%46%
36%
20%
40%
31%
24%
15%
8%
22%
37%
43%
55%
74%
48%
0%
10%
20%
30%
40%
50%
60%
70%
80%
2L Summer Associates
Associates Partners Promoted Equity Partners Attrition
Chart A1. Shifting Demographics from Summer Associate to Partner or Departure
Women Minorities White Men

2017 Vault/MCCA Law Firm Diversity Report Page 33 of 51
Disparate Rates of Progress among Three Largest Minority Groups: 2007–2016
Chart A2. As the populations of Asian American and Hispanic lawyers have gradually increased over the last decade, the number of African‐American attorneys in law firms has fallen
Chart A3. More Asians and Latinos are partners than in the past, but there is less progress for black partners
6.2%6.5%
6.1% 6.1%6.4% 6.4% 6.5% 6.7%
7.1% 7.2%
3.1% 3.1% 3.0% 3.1% 3.1%
3.2% 3.2% 3.4% 3.6% 3.7%3.6% 3.5%3.2% 3.2% 3.2%
3.1% 3.1% 3.1% 3.1% 3.1%
0.0%
1.0%
2.0%
3.0%
4.0%
5.0%
6.0%
7.0%
8.0%
2007 2008 2009 2010 2011 2012 2013 2014 2015 2016
All Lawyers (Associates, Partners and Counsel)
Asian Hispanic/Latino African‐American/Black
2.2%2.4% 2.4% 2.4%
2.6% 2.7%2.9%
3.0%3.2%
3.3%
1.9%1.9% 2.0% 2.0%
2.1% 2.3%2.3%
2.5% 2.6% 2.6%
1.9% 1.9% 1.9% 1.9% 1.9% 2.0% 2.0% 2.0% 2.0% 2.0%
0.0%
0.5%
1.0%
1.5%
2.0%
2.5%
3.0%
3.5%
4.0%
2007 2008 2009 2010 2011 2012 2013 2014 2015 2016
Law Firm Partners
Asian Hispanic/Latino African‐American/Black
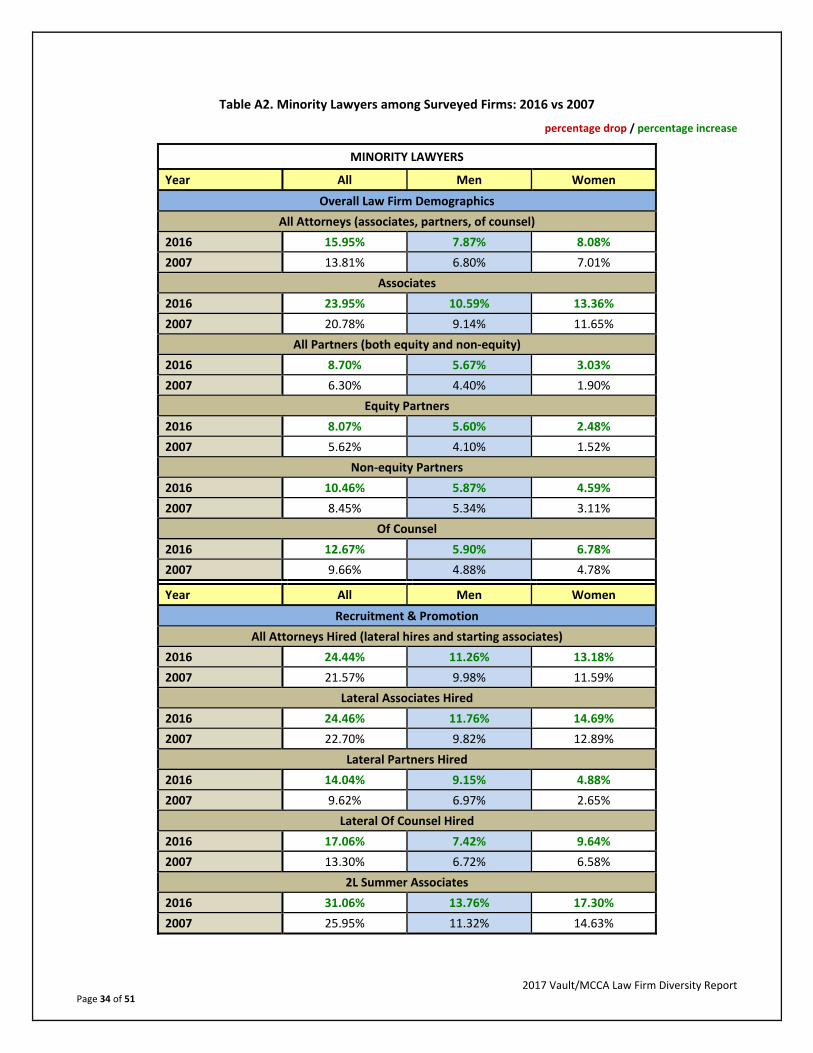
2017 Vault/MCCA Law Firm Diversity Report Page 34 of 51
Table A2. Minority Lawyers among Surveyed Firms: 2016 vs 2007
percentage drop / percentage increase
MINORITY LAWYERS
Year All Men Women
Overall Law Firm Demographics
All Attorneys (associates, partners, of counsel)
2016 15.95% 7.87% 8.08%
2007 13.81% 6.80% 7.01%
Associates
2016 23.95% 10.59% 13.36%
2007 20.78% 9.14% 11.65%
All Partners (both equity and non‐equity)
2016 8.70% 5.67% 3.03%
2007 6.30% 4.40% 1.90%
Equity Partners
2016 8.07% 5.60% 2.48%
2007 5.62% 4.10% 1.52%
Non‐equity Partners
2016 10.46% 5.87% 4.59%
2007 8.45% 5.34% 3.11%
Of Counsel
2016 12.67% 5.90% 6.78%
2007 9.66% 4.88% 4.78%
Year All Men Women
Recruitment & Promotion
All Attorneys Hired (lateral hires and starting associates)
2016 24.44% 11.26% 13.18%
2007 21.57% 9.98% 11.59%
Lateral Associates Hired
2016 24.46% 11.76% 14.69%
2007 22.70% 9.82% 12.89%
Lateral Partners Hired
2016 14.04% 9.15% 4.88%
2007 9.62% 6.97% 2.65%
Lateral Of Counsel Hired
2016 17.06% 7.42% 9.64%
2007 13.30% 6.72% 6.58%
2L Summer Associates
2016 31.06% 13.76% 17.30%
2007 25.95% 11.32% 14.63%

2017 Vault/MCCA Law Firm Diversity Report Page 35 of 51
Table A2. Minority Lawyers among Surveyed Firms: 2016 vs 2007 (cont.)
MINORITY LAWYERS
Year All Men Women
Partners Promoted
2016 14.81% 7.48% 7.33%
2007 12.86% 7.20% 5.66%
All New Equity Partners (both promoted and hired laterally)
2016 11.88% 7.39% 4.49%
2007 10.68% 7.37% 3.31%
Year All Men Women
Attrition (attorneys who left their firms)
All Attorneys (associates, partners, of counsel)
2016 21.80% 10.72% 11.08%
2007 18.72% 8.82% 9.90%
Associates (all levels)
2016 26.72% 12.81% 13.91%
2007 23.36% 10.34% 13.02%
Junior Associates (1st‐ and 2nd‐years)
2016 29.70% 15.27% 14.43%
2007 25.82% 11.46% 14.36%
Midlevel Associates (3rd‐, 4th‐ and 5th‐years)
2016 28.47% 12.86% 15.61%
2007 23.50% 9.85% 13.65%
Senior Associates (6rd‐, 7th‐, 8th‐years and above)
2016 23.86% 11.84% 12.02%
2007 21.37% 10.31% 11.07%
Equity Partners
2016 12.34% 7.63% 4.71%
2007 8.01% 5.55% 2.46%
Non‐equity Partners
2016 12.75% 6.77% 5.98%
2007 10.05% 6.92% 3.13%
Of Counsel
2016 14.57% 7.04% 7.53%
2007 11.46% 5.43% 6.03%

2017 Vault/MCCA Law Firm Diversity Report Page 36 of 51
Table A2. Minority Lawyers among Surveyed Firms: 2016 vs 2007 (cont.)
MINORITY LAWYERS
Year All Men Women
Membership on Management‐Level Committees
Executive/Management Committee
2016 8.75% 5.97% 2.78%
2007 5.42% 4.20% 1.21%
Partner Review Committee
2016 7.61% 5.19% 2.42%
2007 5.60% 4.43% 1.17%
Associate Review Committee
2016 11.15% 6.69% 4.47%
2007 7.37% 4.42% 2.95%
Hiring Committee
2016 17.09% 8.70% 8.40%
2007 15.84% 8.76% 7.09%
Diversity Committee
2016 37.42% 19.89% 17.53%
2007 41.61% 22.26% 19.35%
MINORITY LAWYERS
Year All
Other Leadership Roles*
U.S. Office Heads
2016 9.37%
2008 6.05%
Practice Leaders
2016 6.82%
2008 5.09%
*Note that baseline year for U.S. Office Heads and Practice Leaders is 2008; gender‐specific data is unavailable.

2017 Vault/MCCA Law Firm Diversity Report Page 37 of 51
Table A3. African‐American/Black, Asian American and Hispanic/Latino Lawyers Among Surveyed Firms: 2016 vs 2007
percentage drop / percentage increase
African‐American/Black Asian American Hispanic/Latino
Year All Men Women All Men Women All Men Women
Law Firm Demographics
All Attorneys (associates, partners, of counsel)
2016 3.14% 1.50% 1.64% 7.18% 3.37% 3.81% 3.69% 2.07% 1.62%
2007 3.62% 1.64% 1.98% 6.15% 2.93% 3.22% 3.13% 1.77% 1.36%
Associates
2016 4.41% 1.86% 2.55% 11.51% 4.90% 6.62% 4.85% 2.42% 2.43%
2007 5.11% 1.93% 3.18% 9.96% 4.42% 5.55% 4.33% 2.16% 2.17%
Partners (both equity and non‐equity partners)
2016 1.97% 1.24% 0.73% 3.32% 2.10% 1.21% 2.64% 1.83% 0.80%
2007 1.88% 1.29% 0.59% 2.16% 1.44% 0.73% 1.86% 1.39% 0.46%
Equity Partners
2016 1.80% 1.17% 0.63% 3.20% 2.12% 1.08% 2.42% 1.82% 0.60%
2007 1.60% 1.15% 0.45% 1.90% 1.33% 0.57% 1.75% 1.35% 0.40%
Non‐equity Partners
2016 2.44% 1.44% 1.00% 3.65% 2.06% 1.60% 3.24% 1.85% 1.39%
2007 2.78% 1.74% 1.03% 3.00% 1.76% 1.24% 2.21% 1.53% 0.68%
Of Counsel
2016 2.72% 1.13% 1.58% 5.21% 2.35% 2.86% 3.25% 1.66% 1.59%
2007 3.32% 1.61% 1.71% 3.43% 1.62% 1.81% 2.35% 1.39% 0.96%
Year All Men Women All Men Women All Men Women
Recruitment & Promotion
All Attorneys Hired (lateral hires and starting associates)
2016 4.97% 2.20% 2.77% 10.93% 4.71% 6.23% 5.30% 2.84% 2.46%
2007 5.61% 2.24% 3.37% 9.87% 4.68% 5.18% 4.44% 2.28% 2.16%
Lateral Associates Hired
2016 5.28% 2.12% 3.16% 12.67% 5.47% 7.20% 5.25% 2.66% 2.59%
2007 5.49% 2.17% 3.32% 11.05% 4.65% 6.40% 4.62% 2.28% 2.34%
Lateral Partners Hired
2016 3.37% 2.47% 0.90% 4.72% 2.92% 1.80% 4.27% 2.92% 1.35%
2007 3.02% 2.32% 0.70% 2.70% 1.95% 0.74% 3.21% 2.23% 0.98%
Lateral Of Counsel Hired
2016 4.08% 1.36% 2.72% 5.81% 2.66% 3.15% 4.20% 2.10% 2.10%
2007 5.22% 2.86% 2.36% 4.00% 1.79% 2.20% 2.86% 1.57% 1.29%
2L Summer Associates
2016 6.57% 2.86% 3.71% 14.79% 6.57% 8.22% 5.92% 2.73% 3.19%
2007 7.27% 2.71% 4.55% 12.88% 5.85% 7.03% 4.08% 2.05% 2.04%

2017 Vault/MCCA Law Firm Diversity Report Page 38 of 51
Table A3. African‐American/Black, Asian American and Hispanic/Latino Lawyers Among Surveyed Firms: 2016 vs 2007 (cont.)
African‐American/Black Asian American Hispanic/Latino
Year All Men Women All Men Women All Men Women
Partners Promoted
2016 2.26% 0.92% 1.33% 6.61% 3.38% 3.23% 3.95% 2.20% 1.74%
2007 3.49% 1.99% 1.49% 5.34% 2.67% 2.67% 3.03% 1.77% 1.27%
All New Equity Partners (both promoted and hired laterally)
2016 2.59% 1.60% 1.00% 4.49% 2.40% 2.10% 3.39% 2.45% 0.95%
2007 3.21% 2.41% 0.80% 3.61% 2.31% 1.30% 3.11% 2.16% 0.95%
Year All Men Women All Men Women All Men Women
Attrition (attorneys who left their firms)
All Attorneys (associates, partners, of counsel)
2016 4.86% 2.02% 2.84% 9.86% 4.72% 5.15% 4.44% 2.55% 1.89%
2007 5.76% 2.58% 3.18% 8.24% 3.69% 4.54% 4.03% 2.18% 1.85%
Associates (all levels)
2016 5.64% 2.34% 3.30% 12.67% 5.83% 6.84% 5.06% 2.87% 2.19%
2007 7.03% 2.89% 4.13% 10.91% 4.69% 6.22% 4.59% 2.31% 2.28%
Junior Associates (1st‐ and 2nd‐years)
2016 6.61% 3.45% 3.17% 13.69% 6.70% 6.98% 5.77% 3.26% 2.51%
2007 7.64% 3.08% 4.56% 11.65% 5.24% 6.41% 5.30% 2.46% 2.83%
Midlevel Associates (3rd‐, 4th‐ and 5th‐years)
2016 5.99% 2.61% 3.38% 13.85% 5.88% 7.96% 4.79% 2.47% 2.33%
2007 7.50% 2.92% 4.58% 10.65% 4.35% 6.30% 4.58% 2.15% 2.43%
Senior Associates (6rd‐, 7th‐, 8th‐years and above)
2016 4.92% 1.65% 3.27% 11.10% 5.45% 5.66% 5.06% 3.13% 1.93%
2007 5.85% 2.72% 3.12% 10.80% 4.82% 5.98% 4.11% 2.45% 1.65%
Equity Partners
2016 3.43% 1.54% 1.89% 4.28% 2.57% 1.71% 3.26% 2.49% 0.77%
2007 1.69% 1.19% 0.49% 2.88% 1.97% 0.91% 3.02% 2.11% 0.91%
Non‐equity Partners
2016 3.61% 1.93% 1.67% 4.49% 2.46% 2.02% 3.69% 1.76% 1.93%
2007 3.79% 2.94% 0.85% 3.03% 1.61% 1.42% 2.84% 2.18% 0.66%
Of Counsel
2016 3.52% 1.09% 2.43% 6.01% 3.22% 2.79% 3.22% 1.82% 1.40%
2007 4.69% 2.08% 2.60% 3.35% 1.71% 1.64% 2.98% 1.56% 1.41%

2017 Vault/MCCA Law Firm Diversity Report Page 39 of 51
Table A3. African‐American/Black, Asian American and Hispanic/Latino Lawyers Among Surveyed Firms: 2016 vs 2007 (cont.)
African‐American/Black Asian American Hispanic/Latino
Year All Men Women All Men Women All Men Women
Membership on Management‐Level Committees
Executive/Management Committee
2016 2.38% 1.65% 0.73% 2.70% 1.73% 0.97% 2.94% 2.10% 0.85%
2007 2.05% 1.67% 0.38% 1.02% 0.64% 0.38% 1.82% 1.48% 0.34%
Partner Review Committee
2016 1.85% 1.34% 0.51% 2.57% 1.70% 0.87% 2.52% 1.75% 0.77%
2007 1.85% 1.51% 0.34% 1.36% 0.97% 0.39% 2.04% 1.65% 0.39%
Associate Review Committee
2016 2.84% 1.60% 1.24% 4.66% 2.75% 1.91% 2.78% 1.66% 1.12%
2007 2.59% 1.52% 1.07% 2.17% 1.35% 0.82% 2.25% 1.27% 0.98%
Hiring Committee
2016 5.19% 2.53% 2.67% 6.24% 3.22% 3.01% 4.15% 2.37% 1.79%
2007 5.91% 3.50% 2.41% 5.95% 2.97% 2.97% 3.14% 1.92% 1.21%
Diversity Committee
2016 12.43% 6.84% 5.59% 13.20% 6.60% 6.60% 8.80% 5.10% 3.70%
2007 17.83% 9.68% 8.15% 12.53% 6.14% 6.39% 9.70% 5.65% 4.05%
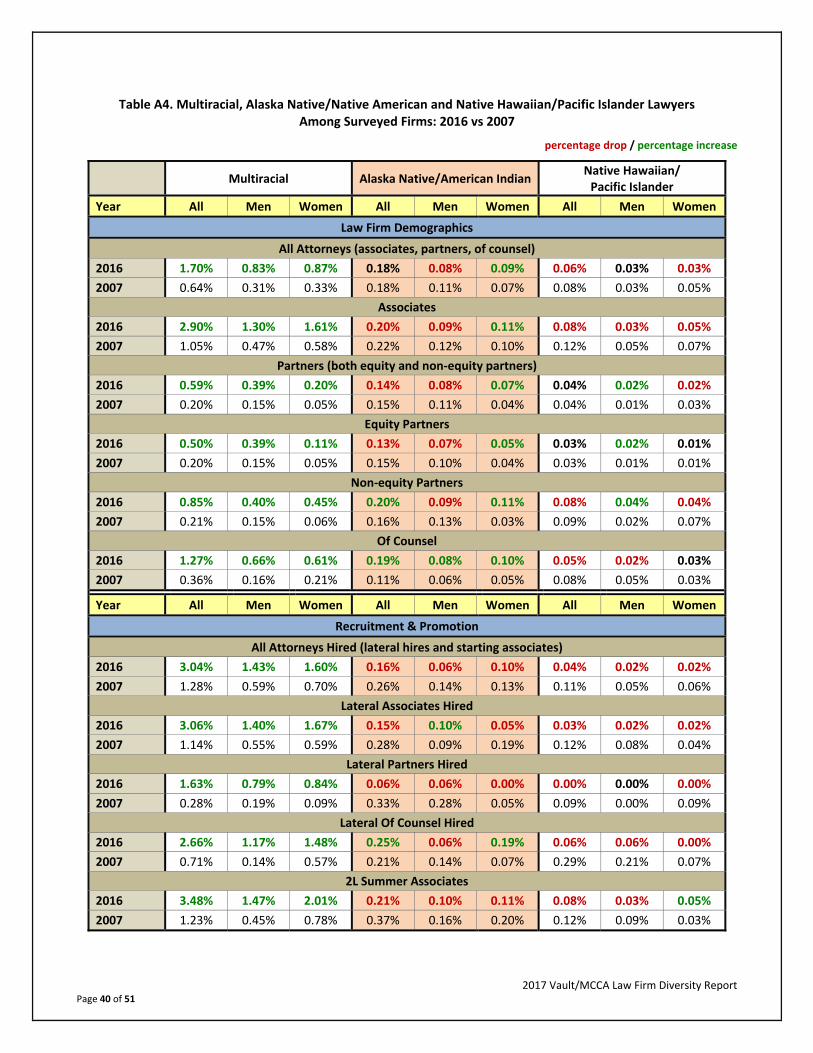
2017 Vault/MCCA Law Firm Diversity Report Page 40 of 51
Table A4. Multiracial, Alaska Native/Native American and Native Hawaiian/Pacific Islander Lawyers Among Surveyed Firms: 2016 vs 2007
percentage drop / percentage increase
Multiracial Alaska Native/American Indian
Native Hawaiian/Pacific Islander
Year All Men Women All Men Women All Men Women
Law Firm Demographics
All Attorneys (associates, partners, of counsel)
2016 1.70% 0.83% 0.87% 0.18% 0.08% 0.09% 0.06% 0.03% 0.03%
2007 0.64% 0.31% 0.33% 0.18% 0.11% 0.07% 0.08% 0.03% 0.05%
Associates
2016 2.90% 1.30% 1.61% 0.20% 0.09% 0.11% 0.08% 0.03% 0.05%
2007 1.05% 0.47% 0.58% 0.22% 0.12% 0.10% 0.12% 0.05% 0.07%
Partners (both equity and non‐equity partners)
2016 0.59% 0.39% 0.20% 0.14% 0.08% 0.07% 0.04% 0.02% 0.02%
2007 0.20% 0.15% 0.05% 0.15% 0.11% 0.04% 0.04% 0.01% 0.03%
Equity Partners
2016 0.50% 0.39% 0.11% 0.13% 0.07% 0.05% 0.03% 0.02% 0.01%
2007 0.20% 0.15% 0.05% 0.15% 0.10% 0.04% 0.03% 0.01% 0.01%
Non‐equity Partners
2016 0.85% 0.40% 0.45% 0.20% 0.09% 0.11% 0.08% 0.04% 0.04%
2007 0.21% 0.15% 0.06% 0.16% 0.13% 0.03% 0.09% 0.02% 0.07%
Of Counsel
2016 1.27% 0.66% 0.61% 0.19% 0.08% 0.10% 0.05% 0.02% 0.03%
2007 0.36% 0.16% 0.21% 0.11% 0.06% 0.05% 0.08% 0.05% 0.03%
Year All Men Women All Men Women All Men Women
Recruitment & Promotion
All Attorneys Hired (lateral hires and starting associates)
2016 3.04% 1.43% 1.60% 0.16% 0.06% 0.10% 0.04% 0.02% 0.02%
2007 1.28% 0.59% 0.70% 0.26% 0.14% 0.13% 0.11% 0.05% 0.06%
Lateral Associates Hired
2016 3.06% 1.40% 1.67% 0.15% 0.10% 0.05% 0.03% 0.02% 0.02%
2007 1.14% 0.55% 0.59% 0.28% 0.09% 0.19% 0.12% 0.08% 0.04%
Lateral Partners Hired
2016 1.63% 0.79% 0.84% 0.06% 0.06% 0.00% 0.00% 0.00% 0.00%
2007 0.28% 0.19% 0.09% 0.33% 0.28% 0.05% 0.09% 0.00% 0.09%
Lateral Of Counsel Hired
2016 2.66% 1.17% 1.48% 0.25% 0.06% 0.19% 0.06% 0.06% 0.00%
2007 0.71% 0.14% 0.57% 0.21% 0.14% 0.07% 0.29% 0.21% 0.07%
2L Summer Associates
2016 3.48% 1.47% 2.01% 0.21% 0.10% 0.11% 0.08% 0.03% 0.05%
2007 1.23% 0.45% 0.78% 0.37% 0.16% 0.20% 0.12% 0.09% 0.03%

2017 Vault/MCCA Law Firm Diversity Report Page 41 of 51
Table A4. Multiracial, Alaska Native/Native American and Native Hawaiian/Pacific Islander Lawyers Among Surveyed Firms: 2016 vs 2007 (cont.)
Multiracial Alaska Native/American Indian
Native Hawaiian/Pacific Islander
Year All Men Women All Men Women All Men Women
Partners Promoted
2016 1.64% 0.82% 0.82% 0.26% 0.10% 0.15% 0.10% 0.05% 0.05%
2007 0.54% 0.36% 0.18% 0.27% 0.23% 0.05% 0.18% 0.18% 0.00%
All New Equity Partners (both promoted and hired laterally)
2016 1.15% 0.75% 0.40% 0.25% 0.20% 0.05% 0.00% 0.00% 0.00%
2007 0.40% 0.30% 0.10% 0.30% 0.15% 0.15% 0.05% 0.05% 0.00%
Year All Men Women All Men Women All Men Women
Attrition (attorneys who left their firms)
All Attorneys (associates, partners, of counsel)
2016 2.38% 1.26% 1.12% 0.17% 0.14% 0.03% 0.10% 0.04% 0.07%
2007 0.27% 0.13% 0.13% 0.31% 0.19% 0.13% 0.11% 0.04% 0.07%
Associates (all levels)
2016 3.03% 1.58% 1.45% 0.18% 0.15% 0.03% 0.15% 0.04% 0.10%
2007 0.35% 0.18% 0.18% 0.37% 0.22% 0.15% 0.11% 0.05% 0.05%
Junior Associates (1st‐ and 2nd‐years)
2016 3.54% 1.86% 1.68% 0.00% 0.00% 0.00% 0.09% 0.00% 0.09%
2007 0.37% 0.25% 0.12% 0.68% 0.37% 0.31% 0.18% 0.06% 0.12%
Midlevel Associates (3rd‐, 4th‐ and 5th‐years)
2016 3.38% 1.62% 1.76% 0.28% 0.25% 0.04% 0.18% 0.04% 0.14%
2007 0.40% 0.17% 0.23% 0.26% 0.17% 0.09% 0.11% 0.09% 0.03%
Senior Associates (6rd‐, 7th‐, 8th‐years and above)
2016 2.49% 1.44% 1.05% 0.14% 0.11% 0.04% 0.14% 0.07% 0.07%
2007 0.27% 0.13% 0.13% 0.31% 0.18% 0.13% 0.04% 0.00% 0.04%
Equity Partners
2016 1.20% 0.86% 0.34% 0.09% 0.09% 0.00% 0.09% 0.09% 0.00%
2007 0.14% 0.07% 0.07% 0.28% 0.21% 0.07% 0.00% 0.00% 0.00%
Non‐equity Partners
2016 0.79% 0.53% 0.26% 0.18% 0.09% 0.09% 0.00% 0.00% 0.00%
2007 0.09% 0.09% 0.00% 0.09% 0.09% 0.00% 0.19% 0.00% 0.19%
Of Counsel
2016 1.64% 0.73% 0.91% 0.18% 0.18% 0.00% 0.00% 0.00% 0.00%
2007 0.07% 0.00% 0.07% 0.22% 0.07% 0.15% 0.15% 0.00% 0.15%

2017 Vault/MCCA Law Firm Diversity Report Page 42 of 51
Table A4. Multiracial, Alaska Native/Native American and Native Hawaiian/Pacific Islander Lawyers Among Surveyed Firms: 2016 vs 2007 (cont.)
Multiracial Alaska Native/American Indian
Native Hawaiian/Pacific Islander
Year All Men Women All Men Women All Men Women
Membership on Management‐Level Committees
Executive/Management Committee
2016 0.48% 0.40% 0.08% 0.20% 0.08% 0.12% 0.04% 0.00% 0.04%
2007 0.30% 0.23% 0.08% 0.19% 0.15% 0.04% 0.04% 0.04% 0.00%
Partner Review Committee
2016 0.41% 0.31% 0.10% 0.21% 0.10% 0.10% 0.05% 0.00% 0.05%
2007 0.15% 0.15% 0.00% 0.19% 0.15% 0.05% 0.00% 0.00% 0.00%
Associate Review Committee
2016 0.76% 0.59% 0.17% 0.11% 0.08% 0.03% 0.00% 0.00% 0.00%
2007 0.11% 0.11% 0.00% 0.17% 0.14% 0.03% 0.08% 0.03% 0.06%
Hiring Committee
2016 1.23% 0.44% 0.79% 0.23% 0.12% 0.12% 0.05% 0.02% 0.02%
2007 0.58% 0.22% 0.36% 0.16% 0.09% 0.07% 0.11% 0.05% 0.05%
Diversity Committee
2016 2.44% 1.14% 1.30% 0.51% 0.18% 0.33% 0.04% 0.02% 0.02%
2007 0.95% 0.54% 0.41% 0.43% 0.19% 0.24% 0.16% 0.05% 0.11%

2017 Vault/MCCA Law Firm Diversity Report Page 43 of 51
Table A5. LGBTQ Lawyers and Attorneys with Disabilities among Surveyed Firms: 2016 vs 2007
percentage drop / percentage increase
Openly LGBTQ Individuals with Disabilities
Year All Men Women All Men Women
Overall Law Firm Demographics
All Attorneys (associates, partners, of counsel)
2016 2.50% 1.75% 0.75% 0.42% 0.29% 0.13%
2007 1.58% 1.13% 0.45% 0.15% 0.11% 0.05%
Associates
2016 3.28% 2.26% 1.02% 0.39% 0.23% 0.16%
2007 1.98% 1.43% 0.56% 0.13% 0.08% 0.05%
All Partners (both equity and non‐equity)
2016 1.77% 1.29% 0.49% 0.40% 0.31% 0.09%
2007 1.16% 0.82% 0.35% 0.16% 0.13% 0.04%
Equity Partners
2016 1.81% 1.34% 0.47% 0.40% 0.32% 0.08%
2007 1.16% 0.86% 0.31% 0.17% 0.14% 0.03%
Non‐equity Partners
2016 1.67% 1.13% 0.53% 0.42% 0.27% 0.14%
2007 1.17% 0.69% 0.48% 0.16% 0.09% 0.07%
Of Counsel
2016 2.28% 1.56% 0.72% 0.60% 0.42% 0.19%
2007 1.25% 0.92% 0.33% 0.24% 0.18% 0.06%
Year All Men Women All Men Women
Recruitment & Promotion
All Attorneys Hired (lateral hires and starting associates)
2016 3.05% 2.16% 0.89% 0.42% 0.27% 0.15%
2007 1.43% 1.02% 0.41% 0.07% 0.03% 0.04%
Lateral Associates Hired
2016 2.86% 2.05% 0.81% 0.30% 0.22% 0.08%
2007 1.07% 0.76% 0.31% 0.08% 0.03% 0.05%
Lateral Partners Hired
2016 1.46% 1.12% 0.34% 0.22% 0.11% 0.11%
2007 0.98% 0.65% 0.33% 0.00% 0.00% 0.00%
Lateral Of Counsel Hired
2016 2.10% 1.61% 0.49% 0.74% 0.56% 0.19%
2007 0.93% 0.64% 0.29% 0.00% 0.00% 0.00%
2L Summer Associates
2016 4.64% 3.25% 1.39% 0.20% 0.10% 0.10%
2007 2.01% 1.52% 0.48% 0.05% 0.02% 0.03%
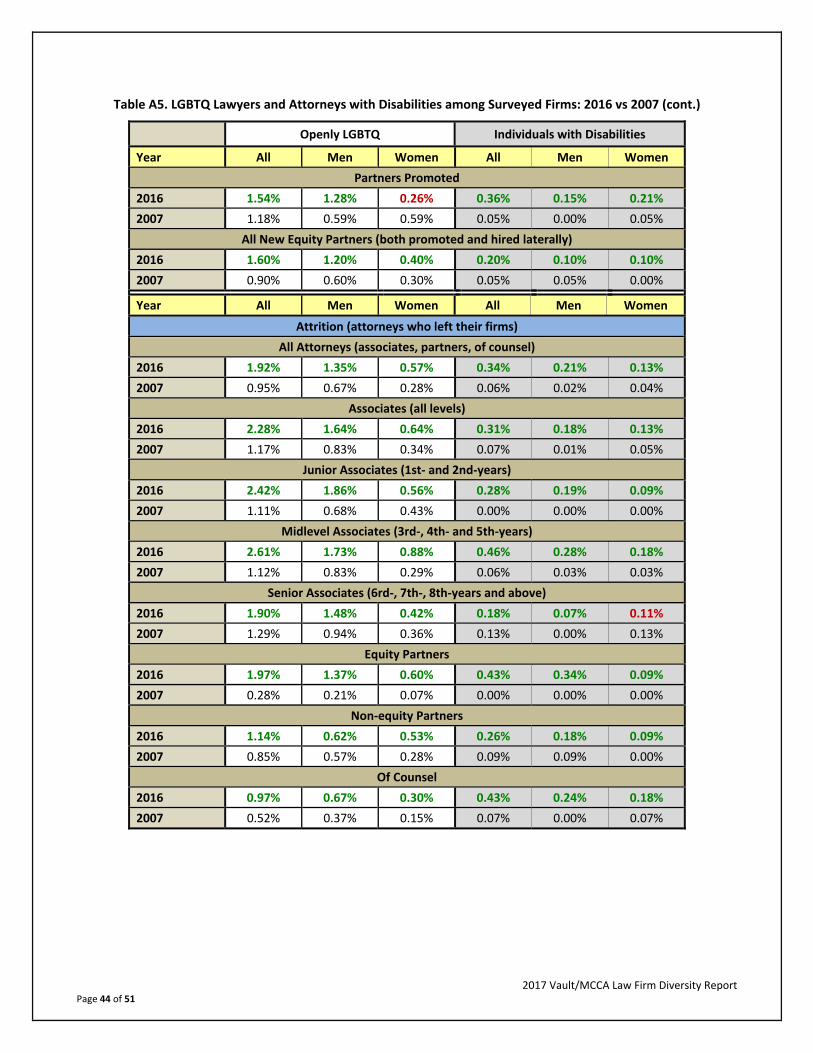
2017 Vault/MCCA Law Firm Diversity Report Page 44 of 51
Table A5. LGBTQ Lawyers and Attorneys with Disabilities among Surveyed Firms: 2016 vs 2007 (cont.)
Openly LGBTQ Individuals with Disabilities
Year All Men Women All Men Women
Partners Promoted
2016 1.54% 1.28% 0.26% 0.36% 0.15% 0.21%
2007 1.18% 0.59% 0.59% 0.05% 0.00% 0.05%
All New Equity Partners (both promoted and hired laterally)
2016 1.60% 1.20% 0.40% 0.20% 0.10% 0.10%
2007 0.90% 0.60% 0.30% 0.05% 0.05% 0.00%
Year All Men Women All Men Women
Attrition (attorneys who left their firms)
All Attorneys (associates, partners, of counsel)
2016 1.92% 1.35% 0.57% 0.34% 0.21% 0.13%
2007 0.95% 0.67% 0.28% 0.06% 0.02% 0.04%
Associates (all levels)
2016 2.28% 1.64% 0.64% 0.31% 0.18% 0.13%
2007 1.17% 0.83% 0.34% 0.07% 0.01% 0.05%
Junior Associates (1st‐ and 2nd‐years)
2016 2.42% 1.86% 0.56% 0.28% 0.19% 0.09%
2007 1.11% 0.68% 0.43% 0.00% 0.00% 0.00%
Midlevel Associates (3rd‐, 4th‐ and 5th‐years)
2016 2.61% 1.73% 0.88% 0.46% 0.28% 0.18%
2007 1.12% 0.83% 0.29% 0.06% 0.03% 0.03%
Senior Associates (6rd‐, 7th‐, 8th‐years and above)
2016 1.90% 1.48% 0.42% 0.18% 0.07% 0.11%
2007 1.29% 0.94% 0.36% 0.13% 0.00% 0.13%
Equity Partners
2016 1.97% 1.37% 0.60% 0.43% 0.34% 0.09%
2007 0.28% 0.21% 0.07% 0.00% 0.00% 0.00%
Non‐equity Partners
2016 1.14% 0.62% 0.53% 0.26% 0.18% 0.09%
2007 0.85% 0.57% 0.28% 0.09% 0.09% 0.00%
Of Counsel
2016 0.97% 0.67% 0.30% 0.43% 0.24% 0.18%
2007 0.52% 0.37% 0.15% 0.07% 0.00% 0.07%

2017 Vault/MCCA Law Firm Diversity Report Page 45 of 51
Table A5. LGBTQ Lawyers and Attorneys with Disabilities among Surveyed Firms: 2016 vs 2007 (cont.)
Openly LGBTQ Individuals with Disabilities
Year All Men Women All Men Women
Membership on Management‐Level Committees
Executive/Management Committee
2016 1.61% 0.73% 0.89% 0.32% 0.16% 0.16%
2007 0.72% 0.42% 0.30% 0.23% 0.11% 0.11%
Partner Review Committee
2016 0.98% 0.36% 0.62% 0.15% 0.10% 0.05%
2007 0.97% 0.58% 0.39% 0.24% 0.10% 0.15%
Associate Review Committee
2016 1.80% 1.10% 0.70% 0.28% 0.22% 0.06%
2007 1.18% 0.76% 0.42% 0.11% 0.06% 0.06%
Hiring Committee
2016 3.13% 1.97% 1.16% 0.37% 0.19% 0.19%
2007 1.83% 1.23% 0.60% 0.13% 0.07% 0.05%
Diversity Committee
2016 8.03% 5.15% 2.88% 0.68% 0.35% 0.33%
2007 6.36% 4.13% 2.23% 0.33% 0.22% 0.11%
Openly LGBTQ
Individuals with Disabilities
Year All All
Other Leadership Roles*
U.S. Office Heads
2016 1.94% 0.65%
2008 1.01% 0.20%
Practice Leaders
2016 1.51% 0.61%
2008 1.30% 0.12%
*Note that baseline year for U.S. Office Heads and Practice Leaders is 2008; gender‐specific data is unavailable.

2017 Vault/MCCA Law Firm Diversity Report Page 46 of 51
Table A6. Women among Surveyed Firms: 2016 vs 2007
percentage drop / percentage increase
ALL FEMALE LAWYERS
Year All Women White Women Women of Color
Overall Law Firm Demographics
All Attorneys (associates, partners, of counsel)
2016 35.03% 26.95% 8.08%
2007 33.10% 26.09% 7.01%
Associates
2016 45.80% 32.43% 13.36%
2007 44.66% 33.01% 11.65%
All Partners (both equity and non‐equity)
2016 22.52% 19.48% 3.03%
2007 18.46% 16.56% 1.90%
Equity Partners
2016 19.81% 17.33% 2.48%
2007 16.05% 14.53% 1.52%
Non‐equity Partners
2016 30.15% 25.56% 4.59%
2007 26.17% 23.05% 3.11%
Of Counsel
2016 39.83% 33.05% 6.78%
2007 35.63% 30.85% 4.78%
Year All Women White Women Women of Color
Recruitment & Promotion
All Attorneys Hired (lateral hires and starting associates)
2016 43.77% 30.59% 13.18%
2007 42.22% 30.63% 11.59%
Lateral Associates Hired
2016 45.88% 31.18% 14.69%
2007 45.54% 32.65% 12.89%
Lateral Partners Hired
2016 23.64% 18.75% 4.88%
2007 18.78% 16.13% 2.65%
Lateral Of Counsel Hired
2016 45.67% 36.03% 9.64%
2007 38.31% 31.74% 6.58%
2L Summer Associates
2016 48.99% 31.70% 17.30%
2007 46.53% 31.90% 14.63%
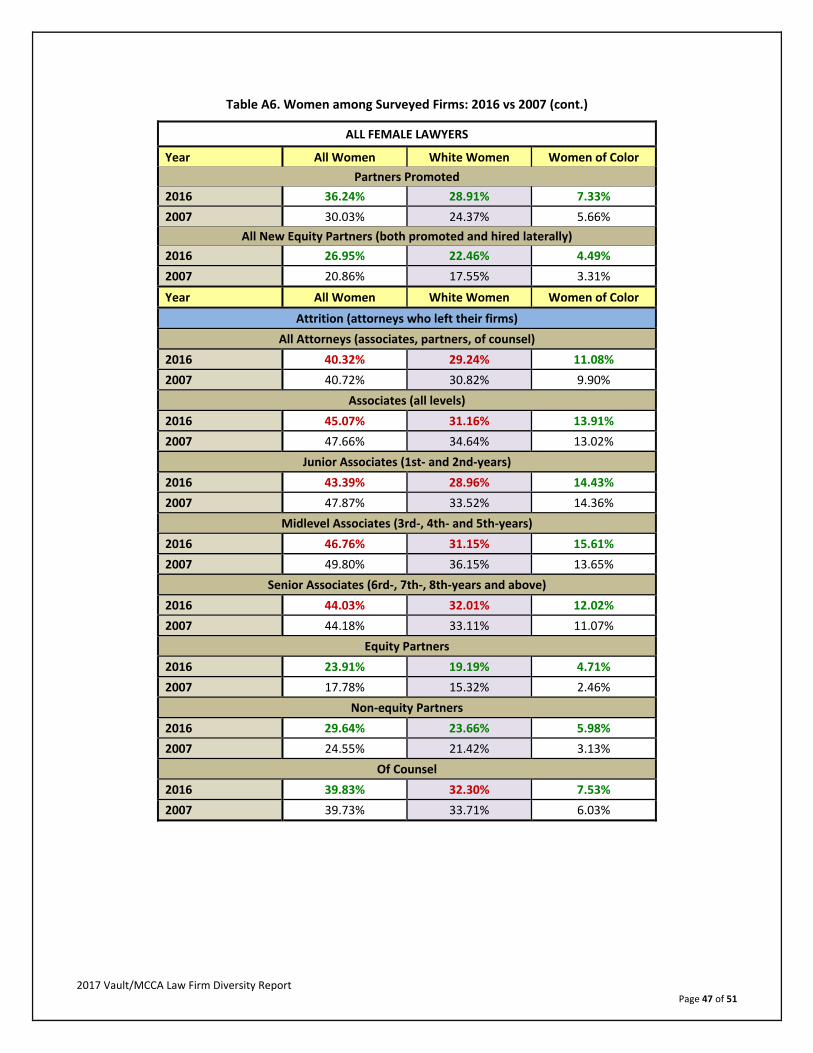
2017 Vault/MCCA Law Firm Diversity Report Page 47 of 51
Table A6. Women among Surveyed Firms: 2016 vs 2007 (cont.)
ALL FEMALE LAWYERS
Year All Women White Women Women of Color
Partners Promoted
2016 36.24% 28.91% 7.33%
2007 30.03% 24.37% 5.66%
All New Equity Partners (both promoted and hired laterally)
2016 26.95% 22.46% 4.49%
2007 20.86% 17.55% 3.31%
Year All Women White Women Women of Color
Attrition (attorneys who left their firms)
All Attorneys (associates, partners, of counsel)
2016 40.32% 29.24% 11.08%
2007 40.72% 30.82% 9.90%
Associates (all levels)
2016 45.07% 31.16% 13.91%
2007 47.66% 34.64% 13.02%
Junior Associates (1st‐ and 2nd‐years)
2016 43.39% 28.96% 14.43%
2007 47.87% 33.52% 14.36%
Midlevel Associates (3rd‐, 4th‐ and 5th‐years)
2016 46.76% 31.15% 15.61%
2007 49.80% 36.15% 13.65%
Senior Associates (6rd‐, 7th‐, 8th‐years and above)
2016 44.03% 32.01% 12.02%
2007 44.18% 33.11% 11.07%
Equity Partners
2016 23.91% 19.19% 4.71%
2007 17.78% 15.32% 2.46%
Non‐equity Partners
2016 29.64% 23.66% 5.98%
2007 24.55% 21.42% 3.13%
Of Counsel
2016 39.83% 32.30% 7.53%
2007 39.73% 33.71% 6.03%

2017 Vault/MCCA Law Firm Diversity Report Page 48 of 51
Table A6. Women among Surveyed Firms: 2016 vs 2007 (cont.)
ALL FEMALE LAWYERS
Year All Women White Women Women of Color
Membership on Management‐Level Committees
Executive/Management Committee
2016 21.77% 18.98% 2.78%
2007 14.81% 13.60% 1.21%
Partner Review Committee
2016 23.48% 21.07% 2.42%
2007 16.93% 15.77% 1.17%
Associate Review Committee
2016 29.89% 25.42% 4.47%
2007 24.42% 21.46% 2.95%
Hiring Committee
2016 37.45% 29.06% 8.40%
2007 35.12% 28.03% 7.09%
Diversity Committee
2016 44.21% 26.68% 17.53%
2007 44.88% 25.52% 19.35%
ALL FEMALE LAWYERS
Year All Women
Other Leadership Roles*
U.S. Office Heads
2016 20.19%
2008 14.39%
Practice Leaders
2016 21.12%
2008 18.38%
*Note that baseline year for U.S. Office Heads and Practice Leaders is 2008; race‐specific data is unavailable.

2017 Vault/MCCA Law Firm Diversity Report Page 49 of 51
Participating Law Firms 2017 Vault/MCCA Law Firm Diversity Survey
* firm has participated in each of last 10 years
Adams and Reese LLP*
Akerman LLP*
Akin Gump Strauss Hauer & Feld LLP*
Allen & Overy LLP*
Allen Matkins Leck Gamble Mallory & Natsis LLP
Alston & Bird LLP*
Andrews Kurth Kenyon LLP*
Archer Norris A Professional Law Corporation
Arent Fox LLP*
Armstrong Teasdale LLP
Arnold & Porter Kaye Scholer LLP*
Arnstein & Lehr LLP
Baird Holm LLP*
BakerHostetler*
Baker & McKenzie LLP*
Baker Botts LLP*
Baker, Donelson, Bearman, Caldwell & Berkowitz, PC*
Barack Ferrazzano Kirschbaum & Nagelberg LLP
Barnes & Thornburg LLP
Beveridge & Diamond P.C.
Blank Rome LLP*
Bodman LLP
Boies, Schiller & Flexner LLP*
Bookoff McAndrews, PLLC
Bowman and Brooke LLP
Bracewell LLP*
Bressler, Amery & Ross, P.C.
Bricker & Eckler*
Brinks Gilson & Lione
Bryan Cave LLP*
Buchalter
Buchanan Ingersoll & Rooney PC*
Butler Snow LLP
Cadwalader, Wickersham & Taft LLP*
Cahill Gordon & Reindel LLP*
Carlton Fields*
Chapman and Cutler LLP
Choate Hall & Stewart LLP*
Cleary Gottlieb Steen & Hamilton LLP*
Clifford Chance US LLP*
Constangy, Brooks, Smith & Prophete, LLP
Cooley LLP*
Covington & Burling LLP*
Cozen O'Connor
Cravath, Swaine & Moore LLP*
Crowell & Moring LLP*
Davis & Harman LLP
Davis Polk & Wardwell LLP*
Davis Wright Tremaine LLP*
Day Pitney LLP*
Debevoise & Plimpton LLP*
Dechert LLP*
Dentons*
Dinsmore & Shohl LLP
DLA Piper LLP (US)*
Dorsey & Whitney LLP*
Drew Eckl & Farnham LLP*
Drinker Biddle & Reath LLP*
Duane Morris LLP*
Dunlap Codding
Dykema Gossett PLLC*
Epstein Becker & Green, P.C.*
Eversheds Sutherland (US) LLP*
Faegre Baker Daniels LLP*
Farella Braun + Martel LLP*
Fenwick & West LLP*
Finnegan Henderson Farabow Garrett & Dunner, LLP*
Fish & Richardson P.C.*
Fisher & Phillips LLP*
Fitzpatrick, Cella, Harper & Scinto*
Foley & Lardner LLP*
Foley Hoag LLP*
Fox Rothschild LLP*
Fried, Frank, Harris, Shriver & Jacobson LLP*
Frost Brown Todd LLC*
Galloway, Johnson, Tompkins, Burr & Smith, APLC
2017 Vault/MCCA Law Firm Diversity Report Page 50 of 51
Gardere Wynne Sewell LLP
Gentry Locke Rakes & Moore LLP*
Gibbons P.C.
Gibson Dunn & Crutcher LLP*
Goldberg Segalla
Goodwin Procter LLP*
Gordon Rees Scully Mansukhani, LLP*
Goulston & Storrs
Gray Plant Mooty
Greenberg Glusker LLP
Greenberg Traurig, LLP*
Greensfelder, Hemker & Gale, P.C.
Groom Law Group, Chartered
Gust Rosenfeld P.L.C.*
Harris Karstaedt Jamison & Powers PC
Haynes and Boone LLP*
Hinshaw & Culbertson LLP
Hogan Lovells US LLP*
Holland & Hart LLP*
Holland & Knight LLP*
Howell & Fisher, PLLC*
Hughes Hubbard & Reed LLP*
Hunton & Williams LLP*
Husch Blackwell LLP*
Ice Miller LLP
Jackson Lewis, P.C.*
Jackson Walker L.L.P.*
Jenner & Block LLP*
Jones Day*
Jones Walker LLP
K&L Gates LLP
Kasowitz Benson Torres LLP
Katten Muchin Rosenman LLP*
Kaye Scholer LLP (now part of Arnold & Porter Kaye Scholer LLP)*
Keating Muething & Klekamp PLL*
Kelley Drye & Warren LLP*
Kilpatrick Townsend & Stockton LLP
King & Spalding LLP*
Kirkland & Ellis LLP*
Knobbe, Martens, Olson & Bear LLP
Kobre & Kim LLP
Kramer Levin Naftalis & Frankel LLP*
Kutak Rock LLP*
Lane Powell P.C.*
Latham & Watkins LLP*
Latham Wagner Steele & Lehman PC
Lewis Roca Rothgerber Christie LLP
LimNexus LLP
Lindquist & Vennum PLLP
Linklaters LLP*
Littler Mendelson P.C.*
Locke Lord LLP*
Loeb & Loeb LLP*
Manatt, Phelps & Phillips, LLP*
Mayer Brown LLP*
McCarter & English LLP*
McGinnis, Lochridge, & Kilgore L.L.P.
McGlinchey Stafford
McGuireWoods LLP*
Meserve, Mumper & Hughes LLP
Michael Best & Friedrich LLP
Milbank, Tweed, Hadley & McCloy LLP*
Miles & Stockbridge P.C.
Miller & Martin PLLC*
Miller Law Group*
Mintz, Levin, Cohn, Ferris, Glovsky & Popeo, PC*
Moore & Van Allen PLLC*
Morgan, Lewis & Bockius LLP*
Moritt Hock & Hamroff LLP
Morrison & Foerster LLP*
Munger, Tolles & Olson LLP*
Neal, Gerber & Eisenberg LLP*
Nelson Mullins Riley & Scarborough LLP*
Nixon Peabody LLP*
Norton Rose Fulbright*
O’Connor, O’Connor, Bresee & First
Ogletree, Deakins, Nash, Smoak & Stewart, P.C.
O'Melveny & Myers LLP*
Orgain Bell & Tucker, LLP
Orrick, Herrington & Sutcliffe LLP*
Parsons, Lee & Juliano, P.C.*
Patterson Thuente IP
Paul Hastings LLP*
Paul, Weiss, Rifkind, Wharton & Garrison, LLP*

2017 Vault/MCCA Law Firm Diversity Report Page 51 of 51
Pepper Hamilton LLP*
Perkins Coie LLP*
Peterson Johnson & Murray SC*
Pettit Kohn Ingrassia & Lutz PC
Phelps Dunbar LLP
Phillips Spallas & Angstadt LLP*
Pillsbury Winthrop Shaw Pittman LLP*
Potter Anderson & Corroon LLP*
Proskauer Rose LLP*
Quarles & Brady LLP*
Reed Smith LLP*
Reminger Co., LP* A
Richards Layton & Finger, PA
Robins Kaplan LLP*
Robinson Bradshaw & Hinson, P.A.
Roig Lawyers
Ropes & Gray LLP*
Rumberger Kirk & Caldwell
Russell & Oliver, PLC*
Ryley Carlock & Applewhite
Saiber LLC
Sanchez‐Medina, Gonzalez, Quesada, Lage, Crespo, Gomez & Machado LLP [SMGQ Law]
Saul Ewing LLP*
Scharf Banks Marmor LLC
Schiff Hardin LLP*
Schulte Roth & Zabel LLP*
Sedgwick LLP*
Seyfarth Shaw LLP*
Shearman & Sterling LLP*
Sheppard, Mullin, Richter & Hampton LLP*
Shook, Hardy & Bacon L.L.P.*
Sidley Austin LLP*
Simpson Thacher & Bartlett LLP*
Skadden, Arps, Slate, Meagher & Flom LLP*
Smith Haughey Rice & Roegge*
Smith Moore Leatherwood LLP
Snyder, Clark, Lesch & Chung, LLP
Squire Patton Boggs LLP
Steptoe & Johnson LLP*
Sterne, Kessler, Goldstein & Fox, P.L.L.C.
Stinson Leonard Street LLP*
Stoel Rives LLP*
Stroock & Stroock & Lavan LLP
Sullivan & Cromwell LLP*
Taft Stettinius & Hollister LLP
Thompson & Knight LLP*
Thompson Coburn LLP*
Thompson Hine LLP*
Thompson, Coe, Cousins & Irons, LLP
Troutman Sanders LLP*
Ulmer & Berne LLP
Vedder Price P.C.
Venable LLP*
Vorys, Sater, Seymour and Pease LLP*
Wachtell, Lipton, Rosen & Katz*
Waller Lansden Dortch & Davis, LLP
Walters Balido & Crain LLP
Weil, Gotshal & Manges LLP*
White & Case LLP*
Wiggin and Dana LLP
Wiley Rein LLP*
Williams Mullen P.C.*
Willkie Farr & Gallagher LLP*
WilmerHale*
Wilson Elser Moskowitz Edelman & Dicker LLP*
Wilson Sonsini Goodrich & Rosati*
Wilson Turner Kosmo LLP
Winston & Strawn LLP*
Womble Carlyle Sandridge & Rice, LLP*