variations us clivar variations us clivar · us clivar variations us clivar variations • spring...
TRANSCRIPT

1
U S C L I V A R V A R I A T I O N S
US CLIVAR VARIATIONS • Spring 2017 • Vol. 15, No. 2 1
IN THIS ISSUE
Roles of the deep ocean in climate
Gregory C. Johnson*,1 and Michael Winton2
1NOAA Pacific Marine Environmental Laboratory2NOAA Geophysical Fluid Dynamics Laboratory
VARIATIONS Spring 2017 • Vol. 15, No. 2
US CLIVARClimate Variability & Predictabilit
y
Roles of the deep ocean in climate......................................................................................................... 1
Global Ocean Ship-based Hydrographic Investigations Program (GO-SHIP) provides key climate-relevant
deep ocean observations ........................................................................................................................ 8
Deep moored observations and OceanSITES ...................................................................................... 15
Remote sensing of bottom pressure from GRACE satellites................................................................. 22
The Argo program samples the deep ocean ......................................................................................... 29
Deepgliders for observing ocean circulation and climate ...................................................................... 34
A case for observing the deep ocean
Guest Editor: Renellys Perez
U. Miami/NOAA AOML
The past few decades have seen an unprecedented increase in the number of physical and biogeochemical measurements in the global oceans. These observations are crucial for documenting how the ocean interacts with the overlying atmosphere. We know that ocean variations have profound effects on weather and climate and can strongly influence surrounding coastlines and coastal communities. Further, the ocean circulates and redistributes heat, salt, carbon, and nutrients around the globe, having major impacts on the systems that sustain marine life and ecosystem diversity. In essence, ocean observations supply information important to society.
To date, the primary focus of the global ocean observing system has been on the surface and intermediate layers of the ocean. Far fewer observations are being collected in the deep layers – here defined as below 2000 m. For example, less than 15% of the holdings in the World Ocean Database are from below 2000 m. This drops to less than 1% below 4000 m. The majority of these deep measurements were obtained from hydrographic surveys, which produce highly accurate data but require substantial personnel and ship time resources.
1
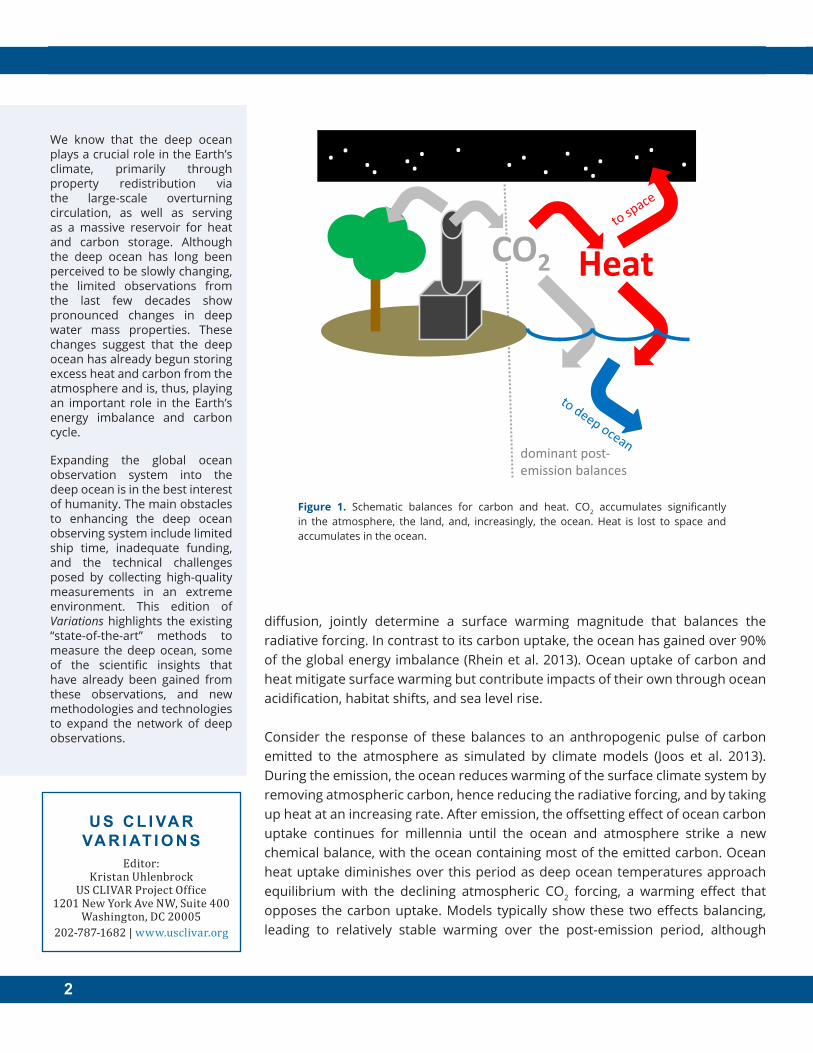
By storing global increases in carbon and heat, the ocean plays critical roles in climate change, counteracting effects of anthropogenic emissions. The
storage roles are different for the two quantities because of the natures of the other sinks (Figure 1). Storage of carbon increases is distributed among the atmosphere, terrestrial biosphere, and ocean. The ocean presently holds about a quarter of the total increase (Ciais et al. 2013) and that portion is expected to grow relative to the other sinks over time. The carbon that remains in the atmosphere contributes to radiative heating of the surface climate system — the atmosphere, land surface, and ocean mixed layer. Since this system has a small heat capacity, the radiative energy source is balanced, on timescales beyond a decade, by heat fluxes downward from the ocean mixed layer and upward to space (Held et al. 2010). These fluxes are proportional to surface temperature change so thermal coupling to space, by radiative feedbacks, and into the ocean, by circulation and
*NOAA Pacific Marine Environmental Laboratory Contribution Number 4645
2
We know that the deep ocean plays a crucial role in the Earth’s climate, primarily through property redistribution via the large-scale overturning circulation, as well as serving as a massive reservoir for heat and carbon storage. Although the deep ocean has long been perceived to be slowly changing, the limited observations from the last few decades show pronounced changes in deep water mass properties. These changes suggest that the deep ocean has already begun storing excess heat and carbon from the atmosphere and is, thus, playing an important role in the Earth’s energy imbalance and carbon cycle.
Expanding the global ocean observation system into the deep ocean is in the best interest of humanity. The main obstacles to enhancing the deep ocean observing system include limited ship time, inadequate funding, and the technical challenges posed by collecting high-quality measurements in an extreme environment. This edition of Variations highlights the existing “state-of-the-art” methods to measure the deep ocean, some of the scientific insights that have already been gained from these observations, and new methodologies and technologies to expand the network of deep observations.
U S CL I VA RVA R I AT I O N S
Editor:Kristan Uhlenbrock
US CLIVAR Project Office1201 New York Ave NW, Suite 400
Washington, DC 20005202-787-1682 | www.usclivar.org
diffusion, jointly determine a surface warming magnitude that balances the radiative forcing. In contrast to its carbon uptake, the ocean has gained over 90% of the global energy imbalance (Rhein et al. 2013). Ocean uptake of carbon and heat mitigate surface warming but contribute impacts of their own through ocean acidification, habitat shifts, and sea level rise.
Consider the response of these balances to an anthropogenic pulse of carbon emitted to the atmosphere as simulated by climate models (Joos et al. 2013). During the emission, the ocean reduces warming of the surface climate system by removing atmospheric carbon, hence reducing the radiative forcing, and by taking up heat at an increasing rate. After emission, the offsetting effect of ocean carbon uptake continues for millennia until the ocean and atmosphere strike a new chemical balance, with the ocean containing most of the emitted carbon. Ocean heat uptake diminishes over this period as deep ocean temperatures approach equilibrium with the declining atmospheric CO2 forcing, a warming effect that opposes the carbon uptake. Models typically show these two effects balancing, leading to relatively stable warming over the post-emission period, although
Figure 1. Schematic balances for carbon and heat. CO2 accumulates significantly in the atmosphere, the land, and, increasingly, the ocean. Heat is lost to space and accumulates in the ocean.
.
CO2 Heat
.. .... . . . .... . . .. .
dominantpost-emissionbalances

3
U S C L I V A R V A R I A T I O N S
US CLIVAR VARIATIONS • Spring 2017 • Vol. 15, No. 2 3
there is a considerable range of simulated post-emission trends (Frölicher et al. 2014). Although the role of the processes described above is conceptually clearest in the post-carbon-emission period, they also contribute to the present-day response to anthropogenic emissions.
The balances that determine long-term climate evolution are effected by ocean circulation and diffusion distributing heat and carbon increases, stemming from anthropogenic emissions, throughout the ocean. Hence, deep and bottom water formation over centennial to millennial timescales is important for the long-term evolution of the warming. As discussed below, model simulations of present-day deep and bottom water formation and their response to changing climate differ greatly and suffer from well-known biases, calling into question their fidelity on long timescales. Consequently, observation and monitoring of deep and bottom water formation, properties, and circulation are crucial for constraining climate models and their projections.
The two major water-masses filling the deep ocean (Figure 2) are Antarctic Bottom Water (AABW), and North Atlantic Deep Water (NADW). AABW originates as a result of complex ocean-ice-atmosphere interactions around the margins of Antarctica, with plumes of very cold, dense waters formed on the continental shelves descending the continental slopes to the abyssal ocean, entraining offshore ambient waters by turbulent mixing as they do so
(Orsi et al. 1999). NADW is formed from a mixture of open-ocean convection to mid-depths in the Labrador Sea and turbulent plumes of dense overflows located between Greenland and the Shetland Islands (Yashayaev 2007). Together, AABW and NADW account for over half of the water-mass volume in the ocean, with the AABW volume estimated at 36% of the total, and NADW at 21% (Johnson 2008). Zonally averaged around the globe, AABW concentrations peak in the Southern Ocean and the abyss, whereas NADW has its highest concentrations in the North Atlantic Ocean, and at mid-depth.
Figure 2. Vertical meridional sections of fractional concentrations of North Atlantic Deep Water (NADW; top panels) and Antarctic Bottom Water (AABW; bottom panels) zonally averaged across the Indo-Pacific (left panels) and Atlantic (right panels) oeans, based on Johnson (2008). Concentrations are contoured at 0.1 intervals from < 0.1 (white) to > 0.9 (darkest blue). Select neutral isopycnals (thick black lines) are contoured, 28.03 and 27.6 kg m-3 in the Indo-Pacific and 28.11 and 27.7 kg m-3 in the Atlantic, as the approximate divisions (e.g., Lumpkin and Speer 2007) between northward flowing bottom waters, southward flowing deep waters, and the intermediate waters above them. Latitude is reversed in the Indo-Pacific versus the Atlan-tic, so the Antarctic is toward the center of the figure (negative values), and the Arctic toward its right and left borders (positive values).

4
These water masses play vital roles in the global ocean circulation (Figure 3; Talley 2013). AABW spreads northward from its formation regions in the Southern Meridional Overturning Circulation (SMOC; Heuzé et al. 2015), primarily via deep western boundary currents (DWBCs) that largely follow bathymetry. AABW mixes as it flows through sills and interacts with rough topography, ultimately filling much of the abyssal Pacific, Indian, and western South Atlantic oceans (Johnson 2008). NADW spreads south from its formation regions, first as part of the Atlantic Meridional Overturning Circulation (AMOC), in part via DWBCs. However, NADW only fills the abyssal North Atlantic and eastern South Atlantic. NADW is less dense than AABW, and so overlies it in the Atlantic. NADW is carried from the Atlantic into the other oceans via the
Antarctic Circumpolar Current, before contributing to AABW as well as spreading north in DWBCs.
The southward transport of NADW out of the North Atlantic has been estimated at about 15 Sv (1 Sv = 106 m3 s-1), with a similar magnitude northward transport of AABW out of the Southern Ocean (Lumpkin and Speer 2007). Dividing the volumes of these water masses by their transports yields rough estimates of their replacement timescales: about a millennium for AABW and approximately six centuries for NADW. These timescales are comparable to those from ocean radiocarbon data (Matsumoto 2007).
The AMOC effects a substantial transport of heat northward in the subtropical North Atlantic Ocean
A A B W
LC
DW
Subtropical/tropical upper ocean waters
N A D W
PDW/IDW
ITF
SAMW, AAIWUCD
W
NA
DW
AA
BW
NADW to Indian
Figure 3. Schematic of the global meridional circulation modified from Talley (2013). Antarctic Bottom Water (AABW) formed by cooling and brine rejection around Antarctica descends in dense plumes with turbulent entrainment (cyan swirls) and then spreads north. North Atlantic Deep Water (NADW) is formed by deep convection in the North Atlantic with contributions from turbulent dense overflows from the Greenland-Iceland-Norwegian Seas and then spreads south. AABW and NADW mix and upwell (cyan squiggly arrows) far from their formation regions, contributing to Lower Circumpolar Deep Water (LCDW) as well as Pacific and Indian Deep Waters (PDW/IDW) over time, with some NADW transiting to the Indian Ocean, where it mixes with IDW. PDW/IDW contribute to Upper Circumpolar Deep Water (UCDW). UCDW and LCDW moving south near the surface lose buoyancy from surface fluxes (orange arrows), feeding AABW formation, whereas UCDW moving north near the surface gains buoyancy and forms Subantarctic Mode Water (SAMW) and Antarctic Intermediate Water (AAIW). PDW/IDW and SAMW/AAIW gain buoyancy through surface fluxes to form subtropical/tropical upper ocean waters, with portions transiting the Indonesian Throughflow (ITF). These upper ocean waters lose buoyancy through surface fluxes in the North Atlantic and form NADW.

5
U S C L I V A R V A R I A T I O N S
US CLIVAR VARIATIONS • Spring 2017 • Vol. 15, No. 2 5
because of the large temperature contrast between the relatively cold NADW flowing south and the warmer upper ocean waters that flow north (Talley 2003). While the North Atlantic exports carbon southward, it exports less now than in preindustrial times (Macdonald et al. 2003), consistent with a substantial increase in carbon storage in that basin (Woosley et al. 2016). In contrast, the colder, deeper SMOC has a much smaller temperature contrast between AABW flowing north and the very old, but only slightly warmer Circumpolar Deep Water (CDW) flowing south and upwelling in the Antarctic Circumpolar Current, thence feeding both AABW and Antarctic Intermediate Water (AAIW) formation. Thus, the SMOC effects a relatively small heat transport. However, CDW — a mixture of “aged” AABW (including Pacific and Indian Deep Waters), various intermediate and mode waters, and some NADW — has not seen the sea surface for many centuries. Hence, it takes up significant amounts of heat and carbon, relative to preindustrial times, when exposed to the modern atmosphere with its increased carbon concentration and warmth (Russell et al. 2006). Much of this increase in carbon and heat is stored in AAIW as it flows north, with a smaller amount of warming and additional carbon stored in the AABW as it forms.
Variations in deep ocean water properties, including NADW and AABW, reflect surface forcing variations. In the deep Greenland Sea, cessation of ventilation has resulted in warming at a rate similar to the warming rate of Earth’s mean surface temperature over the past several decades (Somavilla et al. 2013). In contrast, formation rates, depths, and water properties of Labrador Sea Water, formed by open-ocean deep convection, have varied decadally, at least in part with fluctuations of the North Atlantic Oscillation (Yashayaev and Loder 2016). Striking warming is found in the AABW over recent decades throughout the Southern Ocean, extending into the abyssal Pacific, western South Atlantic, and eastern Indian1 oceans (Purkey and Johnson 2010; Desbruyères et al. 2016). Furthermore, AABW has been freshening over recent decades, especially in the Indian and Pacific sectors of the Southern Ocean (Purkey and Johnson 2013). Freshening of the Ross Sea Shelf waters, one of the components
of AABW in the region, linked with increased melting of marine terminating ice sheets (Jacobs and Giulivi 2010), may be one factor in observed AABW changes. The increased buoyancy from this freshening may result in a warmer, lighter variety of AABW and reduce the amount of AABW formed. In the Weddell Sea, one hypothesis is that the 1970s Weddell Polynya substantially cooled the deep and abyssal ocean in the region, and the AABW warming observed there may be partly a rebound from that cooling event (de Lavergne et al. 2014).
A frequently asked question is how the warming signal of AABW has already been observed in the North Pacific. The answer is that it has probably not been advected there yet, but is the result of a teleconnection of changing formation (either rates or densities) of AABW by planetary (Kelvin and Rossby) waves (Masuda et al. 2010). This teleconnection effects what oceanographers term an isopycnal “heave” signature of the changes, rather than an advective “water-mass” signature (Bindoff and McDougall 1994). To date, water-mass signatures (changing temperature-salinity relations) in the deep and abyssal ocean are most easily observed near the formation regions of NADW and AABW; although transient gasses such as chlorofluorocarbons, which were introduced into the atmosphere starting in the 1930s and can be observed in the ocean at extremely low concentrations, reveal advective signatures spreading from the formation regions of NADW (LeBel et al. 2008) and AABW (Orsi et al. 2002).
Deep ocean temperature and salinity changes play roles in both the global energy budget and sea level budgets. Ocean warming below 2000 m has been estimated to take up about 10% of Earth’s total energy imbalance during 2005–2015 (Johnson et al. 2016). Deep ocean warming is currently a smaller contributor to global sea level budgets (Purkey and Johnson 2010), since the thermal 1expansion coefficient of seawater is smaller for colder, deeper waters. However, deep ocean temperature and
1The deep western Indian Ocean has not been sampled since the World Ocean Circulation Experiment in 1994 owing to pirate activity.
6
References
Bindoff, N. L., and T. J. McDougall, 1994: Diagnosing climate change and ocean ventilation using hydrographic data. J. Phys. Oceanogr., 24, 1137–1152, doi: 10.1175/1520-0485(1994)024<1137:DCCAOV>2.0.CO;2.
Boé, J., A. Hall, and X. Qu, 2009: Deep ocean heat uptake as a major source of spread in transient climate change simulations. Geophys. Res. Lett., 36, doi:10.1029/2009GL040845.
Carrassi, A., V. Guemas, F. J. Doblas-Reyes, D. Volpi, and M. Asif, 2016: Sources of skill in near-term climate prediction: generating initial conditions. Climate Dyn., 47, 3693–3712, doi:10.1007/s00382-016-3036-4.
Cheng, W., J. C. H. Chiang, and D. X. Zhang, 2013: Atlantic Meridional Overturning Circulation (AMOC) in CMIP5 Models: RCP and historical simulations. J. Climate, 26, 7187–7197, doi:10.1175/JCLI-D-12-00496.1.
salinity variations can contribute substantially to regional sea level variations (Johnson et al. 2008). While deep anthropogenic carbon uptake concentrations are small, they are spread over a large volume and are expected to increase in the future. Furthermore, deep ocean warming has potential to have substantial effects on ecosystems, since historical temperature ranges are small (Levin and Le Bris 2015).
As noted above, predicting future deep ocean changes in a changing climate requires models, and on the flip side, deep ocean conditions can be important in verifying and initializing models. There has been much work in validating climate model ability to simulate the AMOC (Cheng et al. 2013), and analyses of climate impacts of a collapse of the AMOC (Vellinga and Wood 2002). Anti-correlation between preindustrial AMOC strength and global warming relative to equilibrium has been found in climate models (Winton et al. 2014), demonstrating the importance of accurate simulation of deep circulation.
Moreover, standard-resolution climate models generally do not do a good job at forming AABW as observed in the modern ocean (Heuzé et al. 2013), which can lead to unrealistic model deep ocean conditions, which in turn are well correlated with projected rates of warming in climate models (Boé et al. 2009). However, at least one high-resolution climate model forms AABW on the shelf, as observed, and the deep ocean in that model warms about four times faster under CO2 doubling than in the same model at standard resolution (Newsom et al. 2016). Initializing climate models with deep ocean conditions may also improve their estimates of ocean circulation (Carrassi et al. 2016).
Our present observing system of the deep ocean, discussed in the rest of this issue, is fairly sparse, given the importance and influence it has on the climate. GO-SHIP (Talley et al. 2016) collects invaluable, synoptic, coast-to-coast, full-depth, highly accurate, densely sampled (along-track) repeat oceanographic transects of a range of variables including temperature, salinity, velocity, dissolved oxygen and nutrient concentrations, carbon parameters, transient tracers, and more. However, these transects are relatively few and generally only occupied at decadal intervals. Moored measurements such as the RAPID array (McCarthy et al. 2015), which monitors the AMOC at 26.5°N, and OceanSites (Send et al. 2011) deep sensors provide well-resolved time series of and substantial insights into deep ocean variability, but are spatially sparse. Satellite measurements of gravity variations, often combined with satellite sea-surface height variation measurements and temperature and salinity data in the upper 2 km of the ocean from the Argo array, can also illuminate regional deep ocean circulation variability (Landerer et al. 2015). However, uncertainties on global average deep ocean temperature changes inferred from residual calculations using these data are large (Llovel et al. 2014). A global array of Deep Argo floats would greatly reduce these uncertainties (Johnson et al. 2015), complementing GO-SHIP sections, deep mooring measurements, and satellite data by providing large-scale, global, continuous in situ monitoring of varying deep ocean conditions. DeepGliders are another innovative and valuable tool that could increase sampling of the deep ocean along transects or at stations.

7
U S C L I V A R V A R I A T I O N S
US CLIVAR VARIATIONS • Spring 2017 • Vol. 15, No. 2 7
Ciais, P., and Coauthors, 2013: Carbon and Other Biogeochemical Cycles. Climate Change 2013: The Physical Science Basis. Contribution of Working Group I to the Fifth Assessment Report of the Intergovernmental Panel on Climate Change, T. F. Stocker, and Coauthors, Eds., Cambridge University Press, 465–570.
de Lavergne, C., J. B. Palter, E. D. Galbraith, R. Bernardello, and I. Marinov, 2014: Cessation of deep convection in the open Southern Ocean under anthropogenic climate change. Nature Climate Change, 4, 278–282, doi:10.1038/nclimate2132.
Desbruyères, D. G., S. G. Purkey, E. L. McDonagh, G. C. Johnson, and B. A. King, 2016: Deep and abyssal ocean warming from 35 years of repeat hydrography. Geophys. Res. Lett., 43, 10356–10365, doi:10.1002/2016GL070413.
Frölicher, T. L., M. Winton, and J. L. Sarmiento, 2014: Continued global warming after CO2 emissions stoppage. Nature Climate Change, 4, 40–44, doi:10.1038/nclimate2060.
Held, I. M., M. Winton, K. Takahashi, T. Delworth, F. Zeng, and G. K. Vallis, 2010: Probing the fast and slow components of global warming by returning abruptly to preindustrial forcing. J. Climate, 23, 2418–2427, doi:10.1175/2009JCLI3466.1.
Heuzé, C., K. J. Heywood, D. P. Stevens, and J. K. Ridley, 2013: Southern Ocean bottom water characteristics in CMIP5 models. Geophys. Res. Lett., 40, 1409–1414, doi:10.1002/grl.50287.
Jacobs, S. S., and C. F. Giulivi, 2010: Large multidecadal salinity trends near the Pacific–Antarctic continental margin. J. Climate, 23, 4508–4524, doi:10.1175/2010JCLI3284.1.
Johnson, G. C., 2008: Quantifying Antarctic Bottom Water and North Atlantic Deep Water volumes. J. Geophys. Res., 113, doi:10.1029/2007JC004477.
Johnson, G. C., S. G. Purkey, and J. L. Bullister, 2008: Warming and freshening in the abyssal southeastern Indian Ocean. J. Climate, 21, 5351–5363, doi:10.1175/2008JCLI2384.1.
Johnson, G. C., J. M. Lyman, and S. G. Purkey, 2015: Informing Deep Argo array design using Argo and full-depth hydrographic section data. J. Atmos. Ocean. Tech.., 32, 2187–2198, doi:10.1175/JTECH-D-15-0139.1.
Johnson, G. C., J. M. Lyman, and N. G. Loeb, 2016: Correspondence: Improving estimates of Earth's energy imbalance. Nature Climate Change, 6, 639–640, doi:10.1038/nclimate3043.
Joos, F., and Coauthors, 2013: Carbon dioxide and climate impulse response functions for the computation of greenhouse gas metrics: A multi-model analysis. Atmos. Chem. Phys., 13, 2793–2825, doi:10.5194/acp-13-2793-2013.
Landerer, F. W., D. N. Wiese, K. Bentel, C. Boening, and M. M. Watkins, 2015: North Atlantic meridional overturning circulation variations from GRACE ocean bottom pressure anomalies. Geophys. Res. Lett., 42, 8114–8121, doi:10.1002/2015GL065730.
LeBel, D. A., and Coauthors, 2008: The formation rate of North Atlantic Deep Water and Eighteen Degree Water calculated from CFC-11 inventories observed during WOCE. Deep-Sea Res. Part I, 55, 891–910, doi:10.1016/j.dsr.2008.03.009.
Levin, L. A., and N. Le Bris, 2015: The deep ocean under climate change. Science, 350, 766–768, doi:10.1126/science.aad0126.
Llovel, W., J. K. Willis, F. W. Landerer, and I. Fukumori, 2014: Deep ocean contribution to sea level and energy budget not detectable over the past decade. Nature Climate Change, 4, 1031–1035, doi:10.1038/nclimate2387.
Lumpkin, R., and K. Speer, 2007: Global ocean meridional overturning. J. Phys. Oceanogr., 37, 2550–2562, doi:10.1175/JPO3130.1.
Macdonald, A. M., M. O. Baringer, R. Wanninkhof, K. Lee, and D. W. R. Wallace, 2003: A 1998–1992 comparison of inorganic carbon and its transport across 24.5°N in the Atlantic. Deep-Sea Res. Part II, 50, 3041–3064, doi:10.1016/j.dsr2.2003.07.009.
Masuda, S., and Coauthors, 2010: Simulated rapid warming of abyssal North Pacific waters. Science, 329, 319–322, doi:10.1126/science.1188703.
Matsumoto, K., 2007: Radiocarbon-based circulation age of the world oceans. J. Geophys. Res., 112, doi:10.1029/2007JC004095.
McCarthy, G. D., and Coauthors, 2015: Measuring the Atlantic Meridional Overturning Circulation at 26°N. Prog. Oceanogr., 130, 91–111, doi:10.1016/j.pocean.2014.10.006.
Newsom, E. R., C. M. Bitz, F. O. Bryan, R. Abernathey, and P. R. Gent, 2016: Southern Ocean deep circulation and heat uptake in a high-resolution climate model. J. Climate, 29, 2597–2619, doi:10.1175/JCLI-D-15-0513.1.
Orsi, A. H., G. C. Johnson, and J. L. Bullister, 1999: Circulation, mixing, and production of Antarctic Bottom Water. Prog. Oceanogr., 43, 55–109, doi:10.1016/S0079-6611(99)00004-X.
Orsi, A. H., W. M. Smethie, and J. L. Bullister, 2002: On the total input of Antarctic waters to the deep ocean: A preliminary estimate from chlorofluorocarbon measurements. J. Geophys. Res., 107, doi:10.1029/2001JC000976.
Purkey, S. G., and G. C. Johnson, 2010: Warming of global abyssal and deep Southern Ocean waters between the 1990s and 2000s: Contributions to global heat and sea level rise budgets. J. Climate, 23, 6336–6351, doi:10.1175/2010JCLI3682.1.
Purkey, S. G., and G. C. Johnson, 2013: Antarctic Bottom Water warming and freshening: Contributions to sea level rise, ocean freshwater budgets, and global heat gain. J. Climate, 26, 6105–6122, doi:10.1175/JCLI-D-12-00834.1.
Rhein, M., and Coauthors, 2013: Observations: Ocean. Climate Change 2013: The Physical Science Basis. Contribution of Working Group I to the Fifth Assessment Report of the Intergovernmental Panel on Climate Change, T. F. Stocker, and Coauthors, Eds., Cambridge University Press, 255–315.
Russell, J. L., K. W. Dixon, A. Gnanadesikan, R. J. Stouffer, and J. R. Toggweiler, 2006: The Southern Hemisphere westerlies in a warming world: Propping open the door to the deep ocean. J. Climate, 19, 6382–6390, doi:10.1175/JCLI3984.1.
Send, U., and M. Lankhorst, 2011: The global component of the US Ocean Observatories Initiative and the global OceanSITES project. Oceans ’11 MTS/IEEE Kona, doi:10.23919/OCEANS.2011.6106959.
Somavilla, R., U. Schauer, and G. Budéus, 2013: Increasing amount of Arctic Ocean deep waters in the Greenland Sea. Geophys. Res. Lett., 40, 4361–4366, doi:10.1002/grl.50775.
Talley, L. D., 2003: Shallow, intermediate, and deep overturning components of the global heat budget. J. Phys. Oceanogr., 33, 530–560, doi:10.1175/1520-0485(2003)033<0530:SIADOC>2.0.CO;2.
Talley, L. D., 2013: Closure of the global overturning circulation through the Indian, Pacific, and Southern oceans: Schematics and transports. Oceanography, 26, 80–97, doi: 10.5670/oceanog.2013.07.
Talley, L. D., and Coauthors, 2016: Changes in ocean heat, carbon content, and ventilation: A review of the first decade of GO-SHIP global repeat hydrography. Annu. Rev. Mar. Sci., 8, 185–215, doi:10.1146/annurev-marine-052915-100829.
Vellinga, M., and R. A. Wood, 2008: Impacts of thermohaline circulation shutdown in the twenty-first century. Climatic Change, 91, 43–63, doi:10.1007/s10584-006-9146-y.
Winton, M., W. G. Anderson, T. L. Delworth, S. M. Griffies, W. J. Hurlin, and A. Rosati, 2014: Has coarse ocean resolution biased simulations of transient climate sensitivity? Geophys. Res. Lett., 41, 8522–8529, doi:10.1002/2014GL061523.
Woosley, R. J., F. J. Millero, and R. Wanninkhof, 2016: Rapid anthropogenic changes in CO2 and pH in the Atlantic Ocean: 2003–2014. Global Biogeochem. Cycles, 30, 70–90, doi:10.1002/2015GB005248.
Yashayaev, I., 2007: Hydrographic changes in the Labrador Sea, 1960–2005. Prog. Oceanogr., 73, 242–276, doi:10.1016/j.pocean.2007.04.015.
Yashayaev, I., and J. W. Loder, 2016: Recurrent replenishment of Labrador Sea Water and associated decadal-scale variability. J. Geophys. Res., 121, 8095–8114, doi:10.1002/2016JC012046.