variation of seed disperdal spectrum of woody plants
TRANSCRIPT

Seediscussions,stats,andauthorprofilesforthispublicationat:https://www.researchgate.net/publication/232382245
Variationofseeddispersalspectrumofwoodyplantsacrossarainfallgradientinnorth-easternBrazil
ArticleinJournalofAridEnvironments·February2003
DOI:10.1006/jare.2002.1038
CITATIONS
45
READS
131
3authors,including:
Someoftheauthorsofthispublicationarealsoworkingontheserelatedprojects:
MestradoViewproject
SeeddispersalandforestregenerationinfragmentedtropicalforestsView
project
MarceloTabarelli
FederalUniversityofPernambuco
177PUBLICATIONS5,310CITATIONS
SEEPROFILE
DulceAparecidaBarbosa
UniversidadeFederaldeSãoPaulo
120PUBLICATIONS698CITATIONS
SEEPROFILE
AllcontentfollowingthispagewasuploadedbyMarceloTabarellion14February2014.
Theuserhasrequestedenhancementofthedownloadedfile.

Journal of Arid Environments (2003) 53: 197–210doi:10.1006/jare.2002.1038, available online at http://www.idealibrary.com on
Variation of seed dispersal spectrum of woody plantsacross a rainfall gradient in north-eastern Brazil
M. Tabarelli*, A. Vicente & D. C. A. Barbosa
Departamento de Botanica, Universidade Federal de Pernambuco, Recife,Pernambuco 50670-091, Brazil
(Received 14 January 2002, accepted 7 May 2002)
This study tests the hypothesis that the percentage of tree and shrub specieswithin categories of seed dispersal, fruit size and type is directly related torainfall in the caatinga vegetation, a tropical dry forest of the north-easternBrazil. The percentage of vertebrate-dispersed species ranged from 11% in a246-mm year�1 plot to 53?6% in a 663-mm year�1 plot. In addition, thepercentage of berry species was positively correlated with annual rainfall,whereas the percentage of drupe species was negatively correlated. Amongthe group of vertebrate-dispersed species, a significant increase was found inthe percentage of Myrtaceae species (0–16?7%) from dry to moist plots. Ourresults support trends described in the literature reporting gradual andpredictable changes in seed dispersal mode in neotropical forests locatedacross rainfall gradients.
# 2002 Elsevier Science Ltd.
Introduction
Several studies have identified remarkable differences between dry and moistneotropical forests in terms of vegetation structure, woody plant species composition,plant species richness, reproductive biology and diversity of plant life forms (Frankieet al., 1974; Gentry, 1982a, 1983, 1988; Gentry & Dodson, 1987; Bullock, 1995;Medina, 1995; Pennington et al., 2000). For example, lowland dry forests have about50–70 plant species o2?5 cm diameter in 0?1-ha plots, semievergreen forests have100–150 species, whereas moist forests have 200–250 species (Gentry, 1988).Neotropical dry forests usually also have lower percentages of woody plant speciesdispersed by vertebrates, of species pollinated by generalist pollinators and ofevergreen species when compared with more humid forests (Howe & Smallwood,1982; Bullock, 1995).
More than remarkable differences between dry and moist forests, the studies byMurphy & Lugo (1986), Gentry (1995) and Medina (1995) support the idea ofpredictable and gradual changes in the structure of woody plant communities (i.e.species richness and composition, frequency of species within categories of life formand life-history strategies) along rainfall gradients in neotropical forests. According toMedina (1995), along a dry–moist forest gradient, we should expect a reduction in the
*Corresponding author. E-mail: [email protected]
0140-1963/03/020197 + 14 $35.00/0 # 2002 Elsevier Science Ltd.

198 M. TABARELLI ET AL.
number (and percentage) of woody deciduous species and an increase in the numberof evergreen woody plant species and C3 epiphytes. The review by Bullock (1995)showed some evidence that strategies of pollination and seed dispersal changegradually from dry to moist forests.
The caatinga vegetation is a kind of dry forest (sensu Mooney et al., 1995;Pennington et al., 2000) and scrub vegetation that occurs in north-eastern Brazil(IBGE, 1985; Sampaio, 1995). The caatinga vegetation ranges from well-developedstands of dry forest with canopy trees 17 m tall and 2220–28,020 plants ha�1 (stemdiameter at soil level X3 cm) to 5 m-tall scrub types with 619 plants ha�1 (Sampaio,1996). Such variation in vegetation structure is conditioned by soil type andtopography, human disturbance and, most important, by the amount of annualrainfall (Sampaio & Salcedo, 1993; Sampaio, 1995) that ranges from 240 to 900 mmthroughout the caatinga vegetation (IBGE, 1985; Lins, 1989). In certain regions ofcaatinga vegetation, average annual rainfall explained 86% of the variation in theheight of woody plants (Sampaio et al., 1981). Several studies (e.g. Andrade-Lima,1981; Santos et al., 1992; Sampaio, 1995) have also documented changes in woodyplant species composition associated with variation in the vegetation structure andphysical environment. However, we should also expect predictable and gradualchanges in the percentage of trees and shrubs within different categories of growthform, seed dispersal, pollination mode and phenology in plots of caatinga vegetationsituated across rainfall gradients.
This study tests the hypotheses that in the caatinga vegetation the percentage ofvertebrate-dispersed tree and shrub species gradually increases along a rainfallgradient (i.e. from dry to moist plots). In addition, among the vertebrate-dispersedspecies, the percentage of large- and fleshy-fruited species gradually increases,whereas the percentage of species with small fruits and with partially sclerocarpicfruits decrease along the rainfall gradient. We quantified the percentage of specieswithin categories of seed dispersal, fruit size and fruit type sampled in 20 plots of thecaatinga vegetation located across a rainfall gradient of 246–694 mm year�1.Differences on seed dispersal, fruit size and type are analysed at two spatial scales:between-plots and between-precipitation categories. The relationships between seeddispersal mode, fruit morphology, taxonomic composition and annual rainfall arediscussed. Finally, we discuss the way that geographically proximal ecosystems, likethe Atlantic rain forest, may affect the frequency of vertebrate-dispersed tree andshrub species with particular fruit types in the caatinga vegetation.
Methods
Caatinga and the study sites
The caatinga vegetation of Brazil (hereafter caatinga) includes several woodlandvegetation types from seasonally tropical dry forest (sensu Mooney et al., 1995;Pennington et al., 2000) to scrub vegetation (Sampaio, 1995). Caatinga covers730,000 km2 of north-eastern Brazil and represents a distinctive feature of theBrazilian semi-arid or caatinga region (IBGE, 1985, Fig. 1). Vegetation types arespread over sedimentary basins, mountains and plateau (IBGE, 1985). Diversifiedgeology and relief support a large number of soil types including lithosols, regosols,latosols and sand soils (Sampaio, 1995). Throughout the caatinga region, vegetation isconstrained by annual rainfall which ranges from 240 to 900 mm (Fig. 1), and whichfalls within 3–7 months (IBGE, 1985; Lins, 1989). Bordering or completelysurrounded by caatinga, there are some high plateau, where annual rainfall exceeds1200 mm. Tracts of the Atlantic rain forest cover these high plateau, and they arelocally named brejo forests (sensu Andrade-Lima, 1982; Lins, 1989). Thus, caatingaand Atlantic forest border each other for hundreds of kilometres.

Figure 1. Location and average annual rainfall in the caatinga region of Brazil (IBGE, 1985).
VARIATION OF SEED DISPERSAL SPECTRUM 199
In the caatinga, richest woody plant families are Leguminosae, Euphorbiaceae,Compositae, Solanaceae, Boraginaceae and Cactaceae (Rodal & Melo, 1999;Pennington et al., 2000). At present, 322 woody plant species have been recordedfor the caatinga vegetation (Rodal & Melo, 1999). Among them, at least 57 species arewidely distributed among the neotropical dry forests (Pennington et al., 2000).Sampaio (1995) provided an overview about caatinga.
In order to test the hypotheses, we used published plant surveys conducted in 20different plots of caatinga rather than surveys carried out by ourselves. Plots werelocated inside a 160,000-km2 polygon including the States of Piauı, Pernambuco,Paraıba, Alagoas and Sergipe, at distances from 100 to 800 km from the AtlanticOcean. Plant surveys were conducted at sites with average annual rainfall ranging from246 to 694 mm, and with different soil types (Table 1). These plant surveysrepresented the best-published information available on woody plant speciescomposition at the local level and they covered a large part of the rainfall gradientobserved in the caatinga (246–900 mm year�1 for caatinga vegetation). Plant surveyswere conducted based on different methods, but they used plant sample criteria (from5 cm DBH to all woody plant species, Table 2) that permitted them to record arepresentative portion if not all tree and shrub species found at each plot.
Seed dispersal, fruit size and type vs. annual rainfall
All tree and shrub species reported from the 20 plots were classified into classes ofseed dispersal, fruit size and fruit type on the basis of: (1) a reasonably goodknowledge of their fruit morphology; (2) detailed accounts of species life-history traitsprovided in the literature (van Roosmalen, 1985; Barroso et al., 1999); and (3)checking herbarium specimens.

Table 1. Main characteristics of the 20 plots of caatinga vegetation analysed in this study
Plot Location(Lat. S, Long. W)
Elevation(m)
Rainfall* (mm year�1) Soil typew
Cabaceiras 71290–361170 500 246 Non-calcic brown, litholicBarra de Sao Miguel 71450–36119 500 363 Non-calcic brown, litholicSerra Branca 71290–36139 500 386 Non-calcic brown, litholicSao Joao do Cariri 71230–361510 500 386 Non-calcic brown, litholicVale do Moxoto 81300–37138
0400 400 Quartz sand, litholic,
Santa Maria da Boa Vista 81450–391500
453 454 LatosolCaninde 91370–37151
0280 529 Cambisol, non-calcic brown
Poco Redondo 91480–371410
230 542 Regosol, solonetzBrejo da Madre de Deus 81090–36119
0627 553 Regosol
Petrolina 91020–401140
337 570 CambisolCustodia 81060–37140
0500 574 Regosol, non-calcic brown
Parnamirim 81040–391300
400 580 Podzol, non-calcic brownAlagoinha 81270–36144
0762 584 Litholic, podzolic
Sertanea 81040–371160
450 600 Regosol, non-calcic brownBuıquez 81350–37115
0835 600 Quartz sand
Ibimirim 81390–371350
600 631 Quartz sandSerra Talhada 71570–38117
0500–700 650 Cambisol, litholic
Nossa Senhora da Gloria 101130–371250
291 663 PodzolicSao Raimundo Nonato 81440–42129
0600 688 Latosol
Caruaru 81140–351550
537 694 Regosol, litholic
*Data provided by the authors of each plant survey.wRefers to predominant soil types.zRefers to a particular type of caatinga.
200
M.
TA
BA
RE
LL
IE
TA
L.

Table 2. Sampling effort and criteria used in the plant surveys carried out at the 20 plots of caatinga vegetation considered in this study
Plot Sample size(no. of individuals)
Sampling criteria* No. of woodyplant species
Vegetationheight (m)w
Source of floristic data
Cabaceiras 0?1 ha (297) All woody species 9 6 Lira (1979)Barra de Sao Miguel 0?1 ha (74) All woody species 7 3 Lira (1979)Serra Branca 0?2 ha (335) All woody species 9 7 Lira (1979)Sao Joao do Cariri 0?2 ha (315) All woody species 10 7?5 Lira (1979)Vale do Moxoto 0?42 ha (257) 5 BSD 16 F Rodal (1984)Santa Maria da Boa Vista ? All woody species 65 F Drumond et al. (1982)Caninde 0?45 ha (1664) 3 BSD 29 16 Fonseca (1991)Poco Redondo 0?3 ha (1029) 3 BSD 31 15 Fonseca (1991)Brejo da Madre de Deus 1 ha (2828) 3 BSD 26 F Andrade (2000)Petrolina 1?4 ha (2234) 3 BSD 38 14 Nascimento (1998)Custodia 1 ha (2180) 5 BSD 35 15 Araujo et al. (1995)Parnamirim 0?2 ha (640) All woody species 22 12 Santos (1987)Alagoinha 1 ha (flora) All woody species 26 F Griz & Machado (2001)Sertanea 1 ha (4977) 3 BSD 28 9 Figueiredo (2000)Buıque (400) 3 BSD 79 9 Gomes (1999)Ibimirim ? All woody species 60 F Rodal et al. (1999)Serra Talhada 0?3 ha (flora) All woody species 40 F Ferraz et al. (1998)Nossa Senhora da Gloria 0?4 ha (1086) 5 DBH 29 15 Souza (1983)Sao Raimundo Nonato 1 ha (5827) 3 BSD 40 9?5 Lemos (1999)Caruaru 0?6 ha (2286) 3 BSD 42 19 Alcoforado-Filho (1993)
*Refers to the minimum size in cm of diameter at breast height (DBH) or basal stem diameter (BSD) of plants sampled.wRefers to maximum plant height.
VA
RIA
TIO
NO
FS
EE
DD
ISP
ER
SA
LS
PE
CT
RU
M201

202 M. TABARELLI ET AL.
Seed-dispersal modes were defined according to mutually exclusive categoriesdescribing the following life-history traits: (1) vertebrate-dispersed species: thoseproducing diaspores attached to a fleshy pulp, aril, or other features typicallyassociated with vertebrate dispersal agents (endozoochorous species sensu vanRoosmalen, 1985); and (2) abiotically dispersed species: those presenting wingedseeds, plumes, or other wind-dispersal devices that slow the rate of seed fall; or thosedispersed entirely by free fall or propelled explosively by a fruit that opens suddenly orby a trip lever. This last category includes the secondarily ant-dispersed species ofEuphorbiaceae (elaiosome-bearing seeds, e.g. Manihot and Jatropha), as they areprimarily autochoric species (Webster, 1994; Machado et al., 1997).
Vertebrate-dispersed species were further classified in relation to fruit size accordingto the following size classes: (1) fruits smaller than 0?6 cm in length; (2) fruits sizing of0?6–1?5 cm; (3) fruits sizing of 1?6–3?0 cm; and (4) fruits larger than 3?0 cm in length.We use these categories because there is a great deal of intra-specific variation in fruitsize within these size classes for a large proportion of the woody plant species in theAtlantic forest and caatinga (Barroso et al., 1999; Silva & Tabarelli, 2000; M.Tabarelli, unpublished data). For convenience, we simply refer to fruits within theseincreasingly larger size classes as small, medium-sized, large and very large. Fruits ofvertebrate-dispersed species were also classified as: (1) berry, monocarp or pseudo-fruit (fleshy fruits); and (2) drupe, pod or capsule (partially sclerocarpic fruits)according to van Roosmalen (1985).
We also grouped the species from the 20 plots within the following categories ofannual rainfall: (1) 400 mm (2 plots, 70 spp., 400–454 mm), (2) 500 mm (7 plots, 108spp., 529–584 mm); and (3) 600 mm (7 plots, 192 spp., 600–694 mm). Species in 300and 200 mm categories were not included because several taxa had classificationlimited to generic level. For each plot and precipitation category F the two spatiallevels of analysis F we thus obtained the percentage of trees and shrubs within eachcategory of dispersal mode, fruit size and type. Distribution of abiotically andvertebrate-dispersed species in terms of rainfall gradient and in space (i.e. number ofplots) was analysed. For each species, we calculated the difference between maximumand minimum rainfall at which each species was recorded, and the number of plotseach species was recorded.
In order to examine the relationships between seed dispersal mode, taxonomiccomposition and annual rainfall, we quantified the number (and proportion) ofspecies within the Myrtaceae in each plot, and in the three categories of rainfalldescribed above (400, 500 and 600 mm categories). Analysis was restricted toMyrtaceae because other families and genera had a small number of vertebrate-dispersed species recorded, which was incompatible to statistical analysis. We alsoexcluded Cactaceae species from all the analyses because our hypotheses are valid forforest tree and shrubs of tropical dry forests.
Statistical analysis
We examined the relationship between the percentage of species within modes of seeddispersal, fruit size and fruit type and average annual rainfall (between-plotdifferences) using Spearman rank correlation coefficients (Sokal & Rohlf, 1995).Differences in the percentage of species among categories of average annual rainfall(between-precipitation category differences) were examined by G-test (Sokal & Rohlf,1995). Differences between abiotically and veterbrate-dispersed species in terms ofdistribution across the rainfall gradient and space were analysed by Mann–Whitneytests (Sokal & Rohlf, 1995). We also used a Spearman rank correlation coefficient toexamine the relationship between the percentage of Myrtaceae among the vertebrate-dispersed species and average annual rainfall (between-plot differences). A G-test wasused to analyse the distribution of Myrtaceae species within the categories of annual

VARIATION OF SEED DISPERSAL SPECTRUM 203
rainfall (between-precipitation category differences). All analyses were carried outusing the SYSTAT 6?0 software package (Wilkinson, 1996).
In all the analyses, we compared plots from different sites and we were unable tocontrol for some differences in the surrounding vegetation matrix, plot size, samplesize and sampling criteria, which could introduce some bias in our results. However,such differences are expected to explain any trend detected only if differences in thesurrounding matrix, plot size, sample size and sampling criteria varied linearly acrossthe rainfall gradient, which was decidedly not the case. We, therefore, assume thatbetween-plots and -precipitation categories differences regarding dispersal mode andfruit morphology (i.e. size and type) are primarily associated with rainfall rather thanparticular differences between sites, plot size or methods. If this is true, then thetrends uncovered should share similar causal relationships at both spatial scales.
Results
Seed dispersal, fruit size and type vs. annual rainfall
In the 20 plots, 107 vertebrate-dispersed species and 162 abiotically dispersed specieswere recorded (39?7% and 60?3%, respectively). The percentage of vertebrate-dispersed species ranged from 11% in a 246-mm year�1 plot to 53?6% in a 663-mm year�1 plot and a positive correlation was found between average annual rainfalland the percentage of vertebrate-dispersed species (Fig. 2; rs ¼ 0?66, po0?01,N ¼ 20). In addition, the percentage of vertebrate-dispersed species ranged from21?4% in the 400 mm category to 40?7% in the 600 mm category (Fig. 3), whichrepresented a significant increase of ca. 90% along the gradient of annual rainfall(G ¼ 8?2, df ¼ 3, p ¼ 0?01).
Among the vertebrate-dispersed species middle-sized and very large fruits prevailed(46?7% and 25?2%, respectively). Significant correlation between fruit size andrainfall was not found at any spatial level (i.e. between-plots and -precipitationcategories), although the percentage of small fruit species decreased from 20% in400 mm to 13?2% in 600 mm category, and large fruit species increased from 6?6% to14?5%, respectively (Fig. 4). Berry and drupe were the most common fruit typesamong vertebrate-dispersed species (32?7% and 28?9%, respectively), followed bycapsule (21?5%), pod (8?4%), and others (i.e. monocarp plus pseudo-fruit, 8?4%). At
0
10
20
30
40
50
60
200 300 400 500 600 700 800
Average annual rainfall (mm)
Ve
rte
bra
te-d
isp
ers
ed
sp
ec
ies
(%
)
Figure 2. Relationship between percentage of vertebrate-dispersed species and average annualrainfall in the caatinga vegetation of Brazil (N = 269).

0
20
40
60
80
100
400 500 600
Categories of average annual rainfall (mm)
Wo
od
y p
lan
t s
pe
cie
s (%
)
Abiotically-dispersed
Vertebrate-dispersed
N= 70 N= 108 N= 192
Figure 3. Percentage of vertebrate-dispersed species within categories of average annualrainfall in the caatinga vegetation of Brazil. Numbers above each vertical bar represent thenumber of species examined in each category of annual rainfall.
0
20
40
60
80
100
400 500 600
Categories of average annual rainfall (mm)
Ve
rte
bra
te-d
isp
ers
ed
sp
ec
ies
(%
)
> 3.0 cm
1.6 - 3.0 cm
0.6 - 1.5 cm
< 0.6 cm
N = 15 N = 38 N = 76
Figure 4. Percentage of species with different fruit size within categories of average annualrainfall in the caatinga vegetation of Brazil. Numbers above each vertical bar represent thenumber of species examined in each category of annual rainfall.
204 M. TABARELLI ET AL.
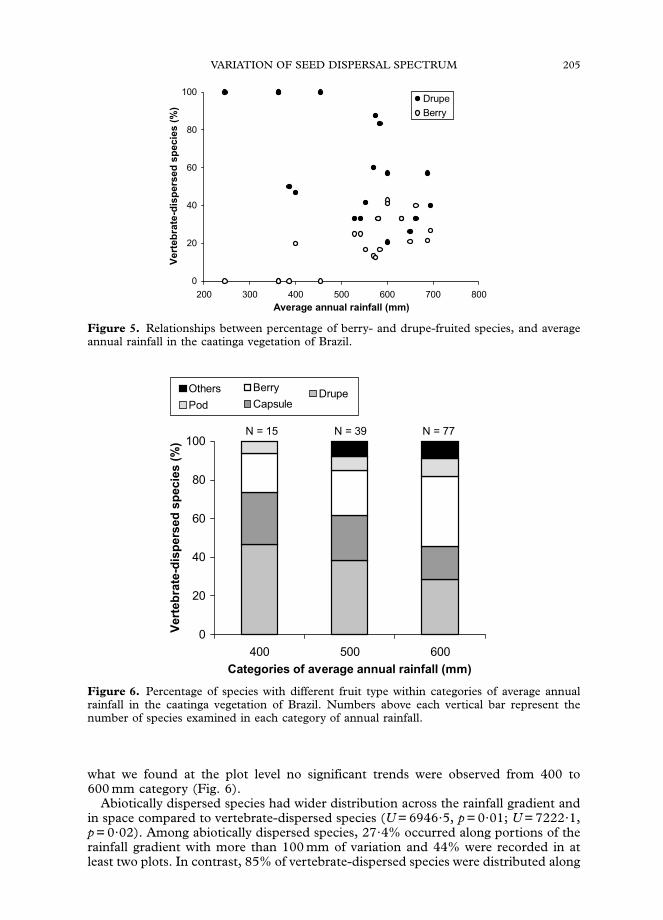
the plot level, the percentage of berry-fruited species was positively correlated withannual rainfall, whereas the percentage of drupe-fruited species was negativelycorrelated (Fig. 5, rs = 0?73, po0?001, N = 20; rs =�0?55, p = 0?01, N = 20). Berry-and drupe-fruited species prevailed among precipitation categories, but in contrast to
0
20
40
60
80
100
200 300 400 500 600 700 800
Average annual rainfall (mm)
Ve
rte
bra
te-d
isp
ers
ed
sp
ec
ies
(%
)
Drupe
Berry
Figure 5. Relationships between percentage of berry- and drupe-fruited species, and averageannual rainfall in the caatinga vegetation of Brazil.
0
20
40
60
80
100
400 500 600
Categories of average annual rainfall (mm)
Vert
eb
rate
-dis
pers
ed
sp
ecie
s (
%)
Others
Pod
Berry
CapsuleDrupe
N = 15 N = 39 N = 77
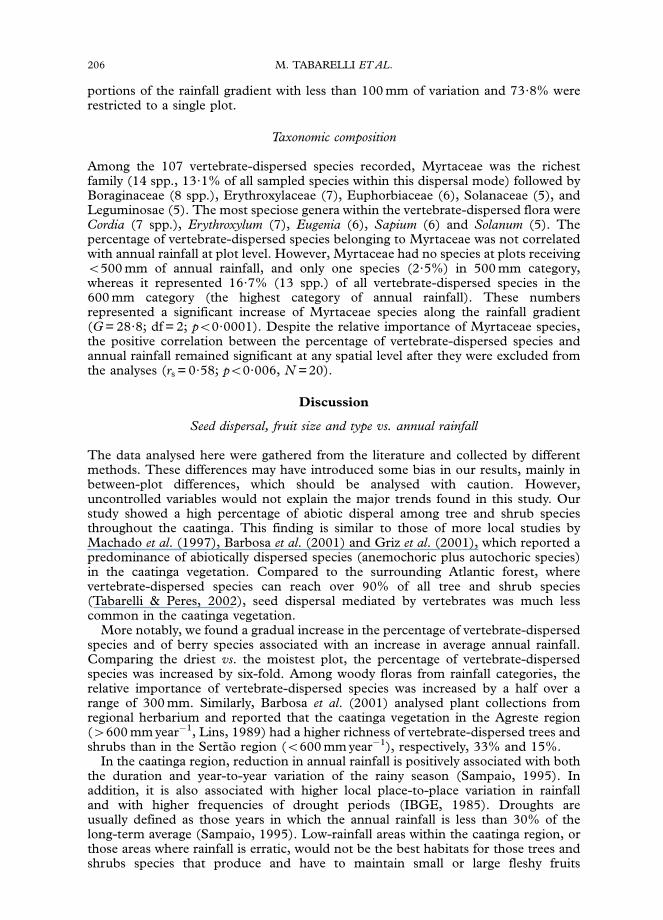
Figure 6. Percentage of species with different fruit type within categories of average annualrainfall in the caatinga vegetation of Brazil. Numbers above each vertical bar represent thenumber of species examined in each category of annual rainfall.
VARIATION OF SEED DISPERSAL SPECTRUM 205
what we found at the plot level no significant trends were observed from 400 to600 mm category (Fig. 6).
Abiotically dispersed species had wider distribution across the rainfall gradient andin space compared to vertebrate-dispersed species (U = 6946?5, p = 0?01; U = 7222?1,p = 0?02). Among abiotically dispersed species, 27?4% occurred along portions of therainfall gradient with more than 100 mm of variation and 44% were recorded in atleast two plots. In contrast, 85% of vertebrate-dispersed species were distributed along
206 M. TABARELLI ET AL.
portions of the rainfall gradient with less than 100 mm of variation and 73?8% wererestricted to a single plot.
Taxonomic composition
Among the 107 vertebrate-dispersed species recorded, Myrtaceae was the richestfamily (14 spp., 13?1% of all sampled species within this dispersal mode) followed byBoraginaceae (8 spp.), Erythroxylaceae (7), Euphorbiaceae (6), Solanaceae (5), andLeguminosae (5). The most speciose genera within the vertebrate-dispersed flora wereCordia (7 spp.), Erythroxylum (7), Eugenia (6), Sapium (6) and Solanum (5). Thepercentage of vertebrate-dispersed species belonging to Myrtaceae was not correlatedwith annual rainfall at plot level. However, Myrtaceae had no species at plots receivingo500 mm of annual rainfall, and only one species (2?5%) in 500 mm category,whereas it represented 16?7% (13 spp.) of all vertebrate-dispersed species in the600 mm category (the highest category of annual rainfall). These numbersrepresented a significant increase of Myrtaceae species along the rainfall gradient(G = 28?8; df = 2; po0?0001). Despite the relative importance of Myrtaceae species,the positive correlation between the percentage of vertebrate-dispersed species andannual rainfall remained significant at any spatial level after they were excluded fromthe analyses (rs = 0?58; po0?006, N = 20).
Discussion
Seed dispersal, fruit size and type vs. annual rainfall
The data analysed here were gathered from the literature and collected by differentmethods. These differences may have introduced some bias in our results, mainly inbetween-plot differences, which should be analysed with caution. However,uncontrolled variables would not explain the major trends found in this study. Ourstudy showed a high percentage of abiotic disperal among tree and shrub speciesthroughout the caatinga. This finding is similar to those of more local studies byMachado et al. (1997), Barbosa et al. (2001) and Griz et al. (2001), which reported apredominance of abiotically dispersed species (anemochoric plus autochoric species)in the caatinga vegetation. Compared to the surrounding Atlantic forest, wherevertebrate-dispersed species can reach over 90% of all tree and shrub species(Tabarelli & Peres, 2002), seed dispersal mediated by vertebrates was much lesscommon in the caatinga vegetation.
More notably, we found a gradual increase in the percentage of vertebrate-dispersedspecies and of berry species associated with an increase in average annual rainfall.Comparing the driest vs. the moistest plot, the percentage of vertebrate-dispersedspecies was increased by six-fold. Among woody floras from rainfall categories, therelative importance of vertebrate-dispersed species was increased by a half over arange of 300 mm. Similarly, Barbosa et al. (2001) analysed plant collections fromregional herbarium and reported that the caatinga vegetation in the Agreste region(4600 mm year�1, Lins, 1989) had a higher richness of vertebrate-dispersed trees andshrubs than in the Sertao region (o600 mm year�1), respectively, 33% and 15%.
In the caatinga region, reduction in annual rainfall is positively associated with boththe duration and year-to-year variation of the rainy season (Sampaio, 1995). Inaddition, it is also associated with higher local place-to-place variation in rainfalland with higher frequencies of drought periods (IBGE, 1985). Droughts areusually defined as those years in which the annual rainfall is less than 30% of thelong-term average (Sampaio, 1995). Low-rainfall areas within the caatinga region, orthose areas where rainfall is erratic, would not be the best habitats for those trees andshrubs species that produce and have to maintain small or large fleshy fruits

VARIATION OF SEED DISPERSAL SPECTRUM 207
(i.e. moist-but-soft-skinned fruit) due to the long dry season and high evaporation/insolation during the moist season.
In fact, water appears to be important for producing fleshy fruits, since severalstudies in tropical forests (dry and moist) and savannas showed a positive relationshipbetween fleshy fruits produced by trees and shrubs and fruiting in the rainy season( Janzen, 1967; Lieberman, 1982; Gottsberger & Silberbauer-Gottsberger, 1983;Rathcke & Lacey, 1985; Mantovani & Martins, 1988; Morellato et al., 1989; Bullock,1995; Medina, 1995; Machado et al., 1997; Oliveira, 1998; Ribeiro & Tabarelli,2002). This is also true for caatinga vegetation, in which Machado et al. (1997) andGriz & Machado (2001) registered a concentration of fleshy-fruit trees and shrubsfruiting during the rainy season. According to Bullock (1995), not only is rainfallcorrelated with the frequency of zoochory in trees, but also sites that are drier andmoister because of local topography, support lower and higher frequencies ofzoochorous tree species, respectively.
We should also mention that local and regional frequency of vertebrate-dispersedspecies may be influenced by both the behaviour and abundance of vertebrate seeddispersers (see Machado et al., 1997, Griz & Machado, 2001). Whatever the cause orcauses (still quite uncertain), our results provide strong support for the trendsemerging from literature, of a gradual and predictable change in seed dispersal modesand fruit morphology in neotropical forests across rainfall gradients within regions ofstrong seasonality.
Annual rainfall, taxonomic composition, and vertebrate-dispersed species
Myrtaceae species accounted for 12?6% of all vertebrate-dispersed species sampled inthe 20 caatinga plots analysed in this study and we found a strong increase in theoccurrence of Myrtaceae species along the annual rainfall gradient. Our results alsosuggested a similar pattern for vertebrate-dispersed species within Annonaceae,Rutaceae and Leguminosae (sensu lato) families, but we did not have enough data toproperly test it. Myrtaceae species are usually shrub to small evergreen trees (o10 cmDBH) that grow up in lower strata (shade-tolerant species), and more rarely reach thevegetation upper strata (Tabarelli et al., 1999). Species of this family usually produceberries 41?5 cm length, and the pulp contains over 80% of water (Moermond &Denslow, 1985). Thus, Myrtaceae species appear to explain part of the trends wefound regarding the frequency of both seed dispersal mode and fruit type acrossrainfall gradients in the caatinga vegetation.
Myrtaceae is the most speciose woody plant family in the Brazilian Atlantic forest(Mori et al., 1983, Lima & Guedes-Bruni, 1997), which is a species diversity centre forthis family in South America (Landrum, 1981, 1986; Gentry, 1982b). For brejos Fthe Atlantic forest ‘islands’ within the arid caatinga region (Andrade-Lima, 1982) Fincomplete information reveals at least 35 Myrtaceae species (Sales et al., 1998). Incontrast to what is observed in the Atlantic forest, Myrtaceae is poorly represented incaatinga vegetation (Rodal & Melo, 1999). Thirteen (92?9%), from the 14 Myrtaceaespecies that we analysed in this study, were restricted to 1–2 plots of caatinga in themoistest portion of the rainfall gradient (i.e. o600 mm year�1), whereas they arefrequent in the Atlantic forest plots. Similarly, vertebrate-dispersed tree species ofLeguminosae analysed in this study (species of Hymenaea and Swartzia) were onlyrecorded in the caantiga sites, which received more than 500 mm year�1 of rainfall andhave also been widely recorded in the Atlantic forest (Siqueira, 1994; Lorenzi, 1998;Sales et al., 1998).
These considerations lead us to hypothesize that the frequency of vertebrate-dispersed species along rainfall gradients in the caatinga vegetation depends partiallyof the species from surrounding Atlantic forest, such as Myrtaceae and Leguminosaespecies. More specifically, several vertebrate-dispersed species may have suitable
208 M. TABARELLI ET AL.
habitats in brejos and in the continuous Atlantic forest, from which they colonize thesurrounding or the moistest sites covered by caatinga vegetation. This hypothesis isalso supported by the fact that vertebrate-dispersed species had narrower distributionon both the rainfall gradient and in space when compared to abiotically dispersedspecies. Further studies should investigate species distribution within families orgenus, which are notable for having several fruit types and dispersal modes, in order toimprove the understanding about the contribution of the Atlantic forest for vertebrateseed dispersal in caatinga. Our results not only confirm the relationships between seeddispersal, fruit morphology and rainfall in very seasonal forests, but they show theutility of studying plant community organization in relation to environmentalgradients.
We thank the Brazilian Research Council (CNPq) for funding this study. We also thank twoanonymous reviewers for constructive criticisms on the manuscript.
References
Alcoforado-Filho, F.G. (1993). Composicao florıstica e fitossociologia de uma area de caatingaarborea no municıpio de Caruaru-Pernambuco. M.Sc. thesis, Universidade Federal Rural dePernambuco, Recife. 220 pp.
Andrade, W.M. (2000). Variacoes de abundancia em populacoes de plantas da caatinga. M.Sc.thesis, Universidade Federal Rural de Pernambuco, Recife. 54 pp.
Andrade-Lima, D. (1981). The caatinga dominium. Revista Brasileira de Botanica, 4:149–163.
Andrade-Lima, D. (1982). Present day forest refuges in North-eastern Brazil. In: Prance, G.T.(Ed.), Biological Diversification in the Tropics, pp. 245–254. New York: Columbia UniversityPress. 713 pp.
Araujo, E.L., Sampaio, E.V.S.B. & Rodal, M.J.N. (1995). Composicao florıstica e fitossociologiade tres areas de caatinga de Pernambuco. Revista Brasileira de Biologia, 55: 595–607.
Barbosa, D.C.A., Silva, P.G.G. & Barbosa, M.C.A. (2001). Tipos de frutos e sındromes dedispersao de especies lenhosas da caatinga de Pernambuco. In: Tabarelli, M. & Silva, J.M.C.(Eds), Diagnostico da Biodiversidade de Pernambuco, pp. 609–622. Recife: SECTMA e EditoraMassangana. 722 pp.
Barroso, G.M., Morim, M.P., Peixoto, A.L. & Ichaso, C.L.F. (1999). Frutos e Sementes:Morfologia Aplicada a Sistematica de Dicotiledoneas. Vicosa: Universidade Federal de Vicosa.444 pp.
Bullock, S.H. (1995). Plant reproduction in neotropical dry forests. In: Bullock, S.H., Mooney,H.A. & Medina, E. (Eds), Seasonally Dry Tropical Forests, pp. 277–303. Cambridge:Cambridge University Press. 450 pp.
Drumond, M.A., Lima, P.C.F., Souza, S.M. & Lima, J.L.S. (1982). Sociabilidade das especiesflorestais da caatinga em Santa Maria da Boa Vista-Pe. Boletim de Pesquisa Florestal, 4: 47–59.
Ferraz, E.M.N., Rodal, M.J.N., Sampaio, E.V.S.B. & Pereira, R.C.A. (1998). Composicaoflorıstica em trechos de vegetacao de caatinga e brejo de altitude na regiao do Vale do Pajeu,Pernambuco. Revista Brasileira de Botanica, 21: 7–15.
Figueiredo, L.S. (2000). Influencia dos sıtios de estabelecimentos na forma das plantas depopulacoes simpatricas da caatinga. M.Sc. thesis, Universidade Federal Rural de Pernambu-co, Recife. 46 pp.
Fonseca, M.R. (1991). Analise da vegetacao arbustiva-arborea da caatinga hiperxerofila donoroeste do Estado de Sergipe. Ph.D. thesis, Universidade Estadual de Campinas, Campinas.
Frankie, G.W., Baker, H.G. & Opler, P.A. (1974). Comparative phenological studies of trees intropical wet and dry forest in the lowland of Costa Rica. Journal of Ecology, 62: 881–919.
Gentry, A.H. (1982a). Patterns of neotropical plant species diversity. Evolution Biology, 16: 1–84.Gentry, A.H. (1982b). Neotropical floristic diversity: phytogeographical connections between
Central and South America: Pleistocene climatic fluctuations, or an accident of the Andeanorogeny? Annals of Missouri Botanical Garden, 69: 557–593.
Gentry, A.H. (1983). Dispersal ecology and diversity in neotropical forest communities.Sonderband Naturwissenschaftlicher Verein Hamburg, 7: 303–314.

VARIATION OF SEED DISPERSAL SPECTRUM 209
Gentry, A.H. (1988). Changes in plant community diversity and floristic composition onenvironmental gradients. Annals of Missouri Botanical Garden, 75: 1–34.
Gentry, A.H. (1995). Diversity and floristic composition of neotropical dry forests. In: Bullock,S.H., Mooney, H. A. & Medina, E. (Eds), Seasonally Dry Tropical Forests, pp. 146–193.Cambridge: Cambridge University Press. 450 pp.
Gentry, A.H. & Dodson, C.H. (1987). Diversity and biogeography of neotropical vascularepiphytes. Annals of Missouri Botanical Garden, 74: 205–233.
Gomes, A.P.S. (1999). Florıstica e fitossociologia de uma vegetacao arbustiva subcaducifolia nomunicıpio de Buıque-Pernambuco. M.Sc. thesis. Universidade Federal Rural de Pernambuco,Recife. 57 pp.
Gottsberger, G. & Silberbauer-Gottsberger, I. (1983). Dispersal and distribution in thevegetation of Brazil. Sonderband Naturwissenschaftlicher Verein Hamburg, 7: 315–352.
Griz, L.M.S. & Machado, I.C.S. (2001). Fruiting phenology and seed dispersal syndromes incaatinga, a tropical dry forest in the northeast of Brazil. Journal of Tropical Ecology, 17:303–321.
Griz, L.M.S., Machado, I.C.S. & Tabarelli, M. (2001). Ecologia de dispersao de sementes:progressos e perspectivas. In: Tabarelli, M. & Silva, J.M.C. (Eds), Diagnostico da Biodiversidadede Pernambuco, pp. 597–608. Recife: SECTMA e Editora Massangana. 722 pp.
Howe, H.F. & Smallwood, J. (1982). Ecology of seed dispersal. Annual Review of Ecology andSystematics, 13: 201–228.
IBGE (1985). Atlas Nacional do Brasil: Regiao Nordeste. Rio de Janeiro: IBGE.Janzen, D. H. (1967). Synchronization of sexual reproduction of trees within the dry season in
Central America. Evolution, 21: 620–637.Landrum, R.L. (1981). A monograph of the genus Myrceugenia (Myrtaceae). Flora Neotropica,
29.Landrum, R.L. (1986). Campomanesia, Pimenta, Blepharocalyx, Legrandia, Acca, Myrrhinium,
and Luma (Myrtaceae). Flora Neotropica, 45: 1–179.Lemos, J.R. (1999). Fitossociologia do componente lenhoso de um trecho de vegetacao arbustiva
caducifolia espinhosa no Parque Nacional Serra da Capivara, Piauı, Brasil. M.Sc. thesis,Universidade Federal de Pernambuco, Recife. 55 pp.
Lieberman, D. (1982). Seasonality and phenology in a dry tropical forest in Ghana. Journal ofEcology, 70: 791–806.
Lima, H.C. & Guedes-Bruni, R.R. (1997). Serra de Macae de Cima: Diversidade Florıstica eConservacao em Mata Atlantica. Rio de Janeiro: Jardim Botanico do Rio de Janeiro. 346 pp.
Lins, R.C. (Coord.). (1989). As Areas de Excecao do Agreste de Pernambuco. Recife: Sudene.328 pp.
Lira, O.C. (1979). Continuum vegetacional nos Cariris Velhos, Paraıba. M.Sc. thesis,Universidade Federal Rural de Pernambuco, Recife. 43 pp.
Lorenzi, H. (1998). Arvores Brasileiras: Manual de Identificacao e Cultivo de Plantas ArboreasNativas do Brasil. Nova Odessa: Editora Plantarum. 378 pp.
Machado, I. C. S., Barros, L. M. & Sampaio, E. V. S. B. (1997). Phenology of Caatinga species atSerra Talhada, PE, Northeastern Brazil. Biotropica, 29: 57–68.
Mantovani, W. & Martins, F. R. (1988). Variacoes fenologicas das especies do cerrado daReserva Biologica de Moji Guacu, Estado de Sao Paulo. Revista Brasileira de Botanica, 11:101–112.
Medina, E. (1995). Diversity of life forms of higher plants in neotropical dry forests. In: Bullock,S.H., Mooney, H.A. & Medina, E. (Eds), Seasonally Dry Tropical Forests, pp. 221–242.Cambridge: Cambridge University Press. 450 pp.
Moermond, T.C. & Denslow, J.S. (1985). Neotropical avian frugivores: patterns of behavior,morphology, and nutrition, with consequences for fruit selection. In: Buckley, P.A., Foster,M.S., Morton, E.S., Ridgely, R.S. & Buckley, F.G. (Eds), Neotropical Ornithology.Ornithological Monographs, Vol. 36, pp. 865–896. Washington, DC: The AmericanOrnithologists’ Union. 1044 pp.
Mooney, H.A., Bullock, S.H. & Medina, E. (1995). Introduction. In: Bullock, S.H., Mooney,H.A. & Medina, E. (Eds), Seasonally Dry Tropical Forests, pp. 1–8. Cambridge: CambridgeUniversity Press. 450 pp.
Morellato, L.P.C., Rodrigues, R.R., Leitao Filho, H.F. & Joly, C.A.A. (1989). Estudocomparativo da fenologia de especies arboreas de floresta de altitude e floresta mesofilasemidecıdua na Serra do Japi, Jundiaı, Sao Paulo. Revista Brasileira de Botanica, 12: 85–98.

210 M. TABARELLI ET AL.
ViewView
Mori, S.A., Boom, B.M., Carvalino, A.M. & Santos, T.S. (1983). Ecological importance ofMyrtaceae in a eastern Brazilian wet forest. Biotropica, 15: 68–70.
Murphy, P.G. & Lugo, A.E. (1986). Ecology of tropical dry forests. Annual Review of Ecology andSystematics, 17: 67–88.
Nascimento, C.E.S. (1998). Estudo florıstico e fitossociologico de um remanescente de caatingaa margem do rio Sao Francisco, Petrolina-Pernambuco. M.Sc. thesis, Universidade FederalRural de Pernambuco, Recife. 84 pp.
Oliveira, P. E. (1998). Fenologia e biologia reprodutiva de especies de Cerrado. In: Sano, S.M.& Almeida, S.P. (Eds), Cerrado: Flora e Ambiente, pp. 169–192. Planaltina: Embrapa-CPAC.556 pp.
Pennington, R.T., Prado, D.E. & Pendry, C.A. (2000). Neotropical seasonally dry forests andQuaternary vegetation changes. Journal of Biogeography, 27: 261–273.
Rathcke, B. & Lacey, E.P. (1985). Phenological patterns of terrestrial plants. Annual Review ofEcology and Systematics, 16: 179–214.
Ribeiro, L.F. & Tabarelli, M. (2002). A structural gradient in cerrado vegetation of Brazil:changes in woody plant density, species richness, life-history, and plant composition. Journal ofTropical Ecology, 18: 1–20.
Rodal, M.J.N. (1984). Fitoecologia de uma area do medio Vale do Moxoto, Pernambuco. M.Sc.thesis, Universidade Federal Rural de Pernambuco, Recife. 443 pp.
Rodal, M.J.N. & Melo, A.L. (1999). Levantamento preliminar das especies lenhosas da caatingade Pernambuco. In: Araujo, F.D., Prendergast, H.D.V. & Mayo, S.J. (Eds), Plantas do NordesteF Anais do I Workshop Geral. pp. 53–62. Kew: Royal Botanic Gardens. 150 pp.
Rodal, M.J.N., Nascimento, L.M. & Melo, A.L. (1999). Composicao florıstica de um trecho devegetacao arbustiva caducifolia no municıpio de Ibimirim, PE, Brasil. Acta Botanica Brasılica,13: 15–28.
Sales, M.F., Mayo, S.J. & Rodal, M.J.N. (1998). Plantas Vasculares das Florestas Serranas dePernambuco. Recife: Universidade Federal Rural de Pernambuco. 130 pp.
Sampaio, E.V.S.B. (1995). Overview of the Brazilian Caatinga. In: Bullock, S.H., Mooney, H.A.& Medina, E. (Eds), Seasonally Dry Tropical Forests, pp. 35–63. Cambridge: CambridgeUniversity Press. 450 pp.
Sampaio, E.V.S.B. (1996). Fitossociologia. In: Sampaio, E.V.S.B., Mayo, S.J. & Barbosa, M.R.V.(Eds), Pesquisa Botanica Nordestina: Progressos e Perspectivas, pp. 203–224. Recife: SociedadeBotanica do Brasil, Secao Regional de Pernambuco. 416 pp.
Sampaio, E.V.S.B. & Salcedo, I.H. (1993). Effects of fire severities on coppicing of Caatingavegetation in Serra Talhada, PE, Brazil. Biotropica, 25: 452–460.
Sampaio, E.V.S.B., Andrade-Lima, D. & Gomes, M.A.F. (1981). O gradiente vegetacional dascaatingas e areas anexas. Revista Brasileira de Botanica, 4: 27–30.
Santos, M.F.A.V. (1987). Caracterısticas dos solos e da vegetacao em sete areas de Parnamirim,Pernambuco. M.Sc. thesis, Universidade Federal Rural de Pernambuco. Recife. 225 pp.
Santos, M.F.A.V., Ribeiro, M.R. & Sampaio, E.V.S.B. (1992). Semelhancas vegetacionais emsete solos de caatinga. Pesquisa Agropecuaria Brasileira, 27: 305–314.
Silva, J.M.C. & Tabarelli, M. (2000). Tree species impoverishment and the future flora of theAtlantic forest of northeast Brazil. Nature, 404: 72–74.
Siqueira, M.F. (1994). Analise florıstica e ordenacao de especies arboreas da Mata Atlanticaatraves de dados binarios. M.Sc. thesis. Universidade Estadual de Campinas, Campinas.145 pp.
Sokal, R.R. & Rohlf, F.G. (1995). Biometry. New York: W.H. Freeman and Company.Souza, G.V. (1983). Estrutura da vegetacao da caatinga hipoxerofila do Estado de Sergipe. M.Sc.
thesis. Universidade Federal Rural de Pernambuco, Recife. 95 pp.Tabarelli, M. & Peres, C.A. 2002. Abiotic and vertebrate seed dispersal in the Brazilian Atlantic
forest: implications for forest regeneration. Biological Conservation, 106: 165–176.Tabarelli, M., Mantovani, W. & Peres, C.A. (1999). Effects of habitat fragmentation on plant
guild structure in the montane Atlantic forest of southeastern Brazil. Biological Conservation,91: 119–127.
Van Roosmalen, M.G.M. (1985). Fruits of the Guianan Flora. Utrecht: Institute of SystematicBotany, Utrecht University. 483 pp.
Webster, G.L. (1994). Classification of the Euphorbiaceae. Annals of Missouri Botanical Garden,81: 3–32.
Wilkinson, L. (1996). SYSTAT, version 6?0. SPSS, Chicago, IL, U.S.A.
publication stats publication stats