variation of particle induced ionization due to different ... · variation of particle induced...
TRANSCRIPT

Variation of particle induced ionization due to differentmodels and boundary conditions
Jan Maik Wissinga, May-Britt Kallenrodea,Nadine Wietersb, Holger Winklerb and Miriam Sinnhuberb
a
FB Physik
b
Institute of Environmental Physics
October 7, 2009
J.M. Wissing (UOS) variation of ionization models October 7, 2009 1 / 21
introduction
introduction
particle induced ionization
...is used as input for climate modeling
...is linked to NOx production and ozone
...should not depend (severely) on the model. General agreementis desirable... but realistic?
J.M. Wissing (UOS) variation of ionization models October 7, 2009 2 / 21

introduction motivation
motivation
good agreement (at altitudes covered by both models, 35-85 km)
104 106 108 1010
ionisation rate @m-3s-1D
104
102
100
10-2
10-4
Pre
ssure@P
aD
0
16
31
49
66
81
94
108
144
233
444
altitude
appro
x.@k
mD
2003 doy 302 6-8h
aimos : solid
Jackman : dashed
J.M. Wissing (UOS) variation of ionization models October 7, 2009 3 / 21

introduction motivation
motivation
poor agreement
106 108
ionisation rate @m-3s-1D
104
102
100
10-2
10-4
Pre
ssure@P
aD
0
16
31
49
66
81
94
108
144
233
444
altitude
appro
x.@k
mD
2003 doy 302 22-24h
aimos : solid
Jackman : dashed
J.M. Wissing (UOS) variation of ionization models October 7, 2009 4 / 21

introduction general problem: no perfect agreement
introduction
general problem
Ionization models do not always “perfectly” agree.
Which conditions impair intercomparison of ionization models?
This talk will discuss:reasons andimplications on climate and atmosphere modeling.
J.M. Wissing (UOS) variation of ionization models October 7, 2009 5 / 21

usual suspects
possible reasons
potential suspects for variations between models are:
horizontal resolution (cap definition)particles considered (in particular electrons)different input data sets due to satellite selection (e.g. slightlydifferent orbit, instrument performance)
Basic assumption: altitude/particle energy range is adequate.
J.M. Wissing (UOS) variation of ionization models October 7, 2009 6 / 21

usual suspects polar cap
horizontal resolution (in particular cap definition)
polar cap
Common assumption: homogeneous precipitation in the polar capHowever the extension of the polar cap may differ:
In 1D models the polar cap often is defined as 60◦ polewards.
In 3D models the cap definition mightbe based on direct measurements. (e.g.AIMOS empirically uses the high-energeticPOES channels to determine the polarcap.) [Wissing and Kallenrode, 2009]
night
180
°E
90°E
0°E
270°E
107 108 109 1010 1011
flux @m-2 s-1 sr-1 MeV-1D
mep0P1
Kp 3.3
night
180
°E
90°E
0°E
270°E
102 103 104 105 106 107
flux @m-2 s-1 sr-1 MeV-1D
mep0P4
Kp 3.3
J.M. Wissing (UOS) variation of ionization models October 7, 2009 7 / 21

usual suspects polar cap
polar cap definition: impact on ozone depetion modeling?
same flux: October event 2003, protons onlysame climate model: Bremen 3d-CTM, altitude range up to 65 kmpolar cap definition: 60◦ poleward vs. empirical
0˚ 60˚ 120˚ 180˚ 240˚ 300˚ 0˚−90˚
−45˚
0˚
45˚
90˚
Bremen 3d−CTM ∆O3 [%] 56km Oct. 27, 2003AIMOS ionisationrates (protons homogeneous)
−60−30−15−10
−5−2−1
0
0˚ 60˚ 120˚ 180˚ 240˚ 300˚ 0˚−90˚
−45˚
0˚
45˚
90˚
Bremen 3d−CTM ∆O3 [%] 56km Oct. 27, 2003AIMOS ionisationrates (protons)
−60−30−15−10
−5−2−1
0
0˚ 60˚ 120˚ 180˚ 240˚ 300˚ 0˚−90˚
−45˚
0˚
45˚
90˚
Bremen 3d−CTM ∆O3 [%] 56km Oct. 27, 2003AIMOS ionisationrates (protons + electrons)
−60−30−15−10
−5−2−1
0
0˚ 60˚ 120˚ 180˚ 240˚ 300˚ 0˚−90˚
−45˚
0˚
45˚
90˚
Bremen 3d−CTM ∆O3 [%] 56km Oct. 28, 2003AIMOS ionisationrates (protons homogeneous)
−60−30−15−10
−5−2−1
0
0˚ 60˚ 120˚ 180˚ 240˚ 300˚ 0˚−90˚
−45˚
0˚
45˚
90˚
Bremen 3d−CTM ∆O3 [%] 56km Oct. 28, 2003AIMOS ionisationrates (protons)
−60−30−15−10
−5−2−1
0
0˚ 60˚ 120˚ 180˚ 240˚ 300˚ 0˚−90˚
−45˚
0˚
45˚
90˚
Bremen 3d−CTM ∆O3 [%] 56km Oct. 28, 2003AIMOS ionisationrates (protons + electrons)
−60−30−15−10
−5−2−1
0
0˚ 60˚ 120˚ 180˚ 240˚ 300˚ 0˚−90˚
−45˚
0˚
45˚
90˚
Bremen 3d−CTM ∆O3 [%] 56km Oct. 29, 2003AIMOS ionisationrates (protons homogeneous)
−60−30−15−10
−5−2−1
0
0˚ 60˚ 120˚ 180˚ 240˚ 300˚ 0˚−90˚
−45˚
0˚
45˚
90˚
Bremen 3d−CTM ∆O3 [%] 56km Oct. 29, 2003AIMOS ionisationrates (protons)
−60−30−15−10
−5−2−1
0
0˚ 60˚ 120˚ 180˚ 240˚ 300˚ 0˚−90˚
−45˚
0˚
45˚
90˚
Bremen 3d−CTM ∆O3 [%] 56km Oct. 29, 2003AIMOS ionisationrates (protons + electrons)
−60−30−15−10
−5−2−1
0
0˚ 60˚ 120˚ 180˚ 240˚ 300˚ 0˚−90˚
−45˚
0˚
45˚
90˚
Bremen 3d−CTM ∆O3 [%] 56km Oct. 30, 2003AIMOS ionisationrates (protons homogeneous)
−60−30−15−10
−5−2−1
0
0˚ 60˚ 120˚ 180˚ 240˚ 300˚ 0˚−90˚
−45˚
0˚
45˚
90˚
Bremen 3d−CTM ∆O3 [%] 56km Oct. 30, 2003AIMOS ionisationrates (protons)
−60−30−15−10
−5−2−1
0
0˚ 60˚ 120˚ 180˚ 240˚ 300˚ 0˚−90˚
−45˚
0˚
45˚
90˚
Bremen 3d−CTM ∆O3 [%] 56km Oct. 30, 2003AIMOS ionisationrates (protons + electrons)
−60−30−15−10
−5−2−1
0
0˚ 60˚ 120˚ 180˚ 240˚ 300˚ 0˚−90˚
−45˚
0˚
45˚
90˚
Bremen 3d−CTM ∆O3 [%] 56km Oct. 31, 2003AIMOS ionisationrates (protons homogeneous)
−60−30−15−10
−5−2−1
0
0˚ 60˚ 120˚ 180˚ 240˚ 300˚ 0˚−90˚
−45˚
0˚
45˚
90˚
Bremen 3d−CTM ∆O3 [%] 56km Oct. 31, 2003AIMOS ionisationrates (protons)
−60−30−15−10
−5−2−1
0
0˚ 60˚ 120˚ 180˚ 240˚ 300˚ 0˚−90˚
−45˚
0˚
45˚
90˚
Bremen 3d−CTM ∆O3 [%] 56km Oct. 31, 2003AIMOS ionisationrates (protons + electrons)
−60−30−15−10
−5−2−1
0
1
0˚ 60˚ 120˚ 180˚ 240˚ 300˚ 0˚−90˚
−45˚
0˚
45˚
90˚
Bremen 3d−CTM ∆O3 [%] 56km Oct. 27, 2003AIMOS ionisationrates (protons homogeneous)
−60−30−15−10
−5−2−1
0
0˚ 60˚ 120˚ 180˚ 240˚ 300˚ 0˚−90˚
−45˚
0˚
45˚
90˚
Bremen 3d−CTM ∆O3 [%] 56km Oct. 27, 2003AIMOS ionisationrates (protons)
−60−30−15−10
−5−2−1
0
0˚ 60˚ 120˚ 180˚ 240˚ 300˚ 0˚−90˚
−45˚
0˚
45˚
90˚
Bremen 3d−CTM ∆O3 [%] 56km Oct. 27, 2003AIMOS ionisationrates (protons + electrons)
−60−30−15−10
−5−2−1
0
0˚ 60˚ 120˚ 180˚ 240˚ 300˚ 0˚−90˚
−45˚
0˚
45˚
90˚
Bremen 3d−CTM ∆O3 [%] 56km Oct. 28, 2003AIMOS ionisationrates (protons homogeneous)
−60−30−15−10
−5−2−1
0
0˚ 60˚ 120˚ 180˚ 240˚ 300˚ 0˚−90˚
−45˚
0˚
45˚
90˚
Bremen 3d−CTM ∆O3 [%] 56km Oct. 28, 2003AIMOS ionisationrates (protons)
−60−30−15−10
−5−2−1
0
0˚ 60˚ 120˚ 180˚ 240˚ 300˚ 0˚−90˚
−45˚
0˚
45˚
90˚
Bremen 3d−CTM ∆O3 [%] 56km Oct. 28, 2003AIMOS ionisationrates (protons + electrons)
−60−30−15−10
−5−2−1
0
0˚ 60˚ 120˚ 180˚ 240˚ 300˚ 0˚−90˚
−45˚
0˚
45˚
90˚
Bremen 3d−CTM ∆O3 [%] 56km Oct. 29, 2003AIMOS ionisationrates (protons homogeneous)
−60−30−15−10
−5−2−1
0
0˚ 60˚ 120˚ 180˚ 240˚ 300˚ 0˚−90˚
−45˚
0˚
45˚
90˚
Bremen 3d−CTM ∆O3 [%] 56km Oct. 29, 2003AIMOS ionisationrates (protons)
−60−30−15−10
−5−2−1
0
0˚ 60˚ 120˚ 180˚ 240˚ 300˚ 0˚−90˚
−45˚
0˚
45˚
90˚
Bremen 3d−CTM ∆O3 [%] 56km Oct. 29, 2003AIMOS ionisationrates (protons + electrons)
−60−30−15−10
−5−2−1
0
0˚ 60˚ 120˚ 180˚ 240˚ 300˚ 0˚−90˚
−45˚
0˚
45˚
90˚
Bremen 3d−CTM ∆O3 [%] 56km Oct. 30, 2003AIMOS ionisationrates (protons homogeneous)
−60−30−15−10
−5−2−1
0
0˚ 60˚ 120˚ 180˚ 240˚ 300˚ 0˚−90˚
−45˚
0˚
45˚
90˚
Bremen 3d−CTM ∆O3 [%] 56km Oct. 30, 2003AIMOS ionisationrates (protons)
−60−30−15−10
−5−2−1
0
0˚ 60˚ 120˚ 180˚ 240˚ 300˚ 0˚−90˚
−45˚
0˚
45˚
90˚
Bremen 3d−CTM ∆O3 [%] 56km Oct. 30, 2003AIMOS ionisationrates (protons + electrons)
−60−30−15−10
−5−2−1
0
0˚ 60˚ 120˚ 180˚ 240˚ 300˚ 0˚−90˚
−45˚
0˚
45˚
90˚
Bremen 3d−CTM ∆O3 [%] 56km Oct. 31, 2003AIMOS ionisationrates (protons homogeneous)
−60−30−15−10
−5−2−1
0
0˚ 60˚ 120˚ 180˚ 240˚ 300˚ 0˚−90˚
−45˚
0˚
45˚
90˚
Bremen 3d−CTM ∆O3 [%] 56km Oct. 31, 2003AIMOS ionisationrates (protons)
−60−30−15−10
−5−2−1
0
0˚ 60˚ 120˚ 180˚ 240˚ 300˚ 0˚−90˚
−45˚
0˚
45˚
90˚
Bremen 3d−CTM ∆O3 [%] 56km Oct. 31, 2003AIMOS ionisationrates (protons + electrons)
−60−30−15−10
−5−2−1
0
1
[Wis
sing
etal
.,20
09b]
detailedinformation:
by N. Wietersand M.Sinnhuber in afew minutes
No significant difference
Note: only solar protons are considered here (magnetosphericparticles don’t get down to 56 km)
J.M. Wissing (UOS) variation of ionization models October 7, 2009 8 / 21

usual suspects missing particle species
missing particle species: impact on modeling?
Yes, electrons are significant!
Limited impact on altitudes below 65 km and within a solar eventbut definetely existent.Extended impact on altitudes above 65 km and withingeomagnetically quiet time and of cause in the auroral region.
advertisementMore on this topic will be shown by Nadine Wieters and MiriamSinnhuber in a couple of minutes.
However none of the figures in the motivation contains electronionization.
J.M. Wissing (UOS) variation of ionization models October 7, 2009 9 / 21

usual suspects satellite selection
satellite selection
different input data set
295 297.5 300 302.5 305 307.5 310
day of year
10-3
10-2
10-1
100
101
102
103
104
flu
x@i
on
sHc
m2
ssr
Me
VL-
1D GOES10 vs. GOES11 HdashedL
p+ 40-80
p+ 15-40
p+ 9-15
p+ 4-9
Α 21-60
Α 10-21
Α 4-10
energy @MeVD
106 108 1010
ionisation rate @m-3s-1D
104
102
100
10-2
10-4
Pre
ssure@P
aD
0
16
31
49
66
81
94
108
144
233
444
altitude
appro
x.@k
mD
GOES11: 3
GOES11: 5
GOES10: 3
GOES10: 5
POES+GOES10: 5data and number of fits
0.01 1 100
particle energy @MeVD
1000
1.´106
1.´109
1.´1012
part
icle
flux@H
m2s
sr
MeVL-
1D
spectrum fits northern polar cap: 2003 doy 302 4-6h
GOES11GOES10POES
channels
nominally same instrumentsdifferent satellites (GOES-10/11)variation of input data (satellite inmagnetosphere/magnetosheath)causes variation of ionization dataup to an order of magnitude
106 108 1010
ionisation rate @m-3s-1D
104
102
100
10-2
10-4
Pre
ssure@P
aD
0
16
31
49
66
81
94
108
144
233
444
altitude
appro
x.@k
mD
GOES11: 3
GOES11: 5
GOES10: 3
GOES10: 5
POES+GOES10: 5data and number of fits
0.01 1 100
particle energy @MeVD
1000
1.´106
1.´109
1.´1012
pa
rtic
leflu
x@H
m2s
sr
MeVL-
1D
spectrum fits northern polar cap: 2003 doy 302 4-6h
GOES11GOES10POES
channels
J.M. Wissing (UOS) variation of ionization models October 7, 2009 10 / 21

boundary condition effects
Assuming these qualifications (same resolution, particle data, species) arefulfilled - variations persist!
May boundary conditions be the culprit?fit function?energy range?
J.M. Wissing (UOS) variation of ionization models October 7, 2009 11 / 21

boundary condition effects operation methods
insights into ionization operation methodssatellite measurements
0.001 0.01 0.1 1 10 100
energy @MeVD
103
104
105
106
107
108
109
1010
1011
1012
1013
flu
x@H
m2s
sr
Me
VL-
1D
energy channels: POES + GOES10�11, day 302, 2003, 20-22h
fit function
0.001 0.01 0.1 1 10 100
energy @MeVD
102
103
104
105
106
107
108
109
1010
1011
1012
1013
flu
x@H
m2s
sr
Me
VL-
1D
fit: energy spectra day 302, 2003, 20-22h
ionization model: ionization as function of particle energy
[Wis
sing
and
Kal
lenr
ode,
2009
]
100 eV 1 keV 10 keV 100 keV 1 MeV 10 MeV 100 MeV
particle energy
100
200
300
400
altitude@k
mD
altitude of maximum energy deposition vs. particle energy - solar max. 60N
protons
electrons
106 108
ionisation rate @m-3s-1D
104
102
100
10-2
10-4
Pre
ssu
re@P
aD
0
16
31
49
66
81
94
108
144
233
444
altitu
de
ap
pro
x.@k
mD
2003 doy 302 20-22h
J.M. Wissing (UOS) variation of ionization models October 7, 2009 12 / 21

boundary condition effects fit of the energy spectrum
fit of the energy spectrum
fit function: the link between satellite measurements and ionization model
creation of a (necessarily) continuous particle spectra alwaysincludes assumptions on the shape of the spectra (fit function)
Note:The fit function seems to be one of the pivotal (or even the main)driver/s of errors.
J.M. Wissing (UOS) variation of ionization models October 7, 2009 13 / 21

boundary condition effects fit functions
fit functions
typical fit functions
Power-Lawsshock accelerationN(E) = KCE−γ
straight line in log-log graphBoltzmann distribution
thermal spectraN(E) = KBexp(−E/(kT ))straight line in linear-log graph
additional variablesenergy range of the spectranumber of fits/intersectionsvariable or fixed position of intersections
J.M. Wissing (UOS) variation of ionization models October 7, 2009 14 / 21
boundary condition effects fit functions
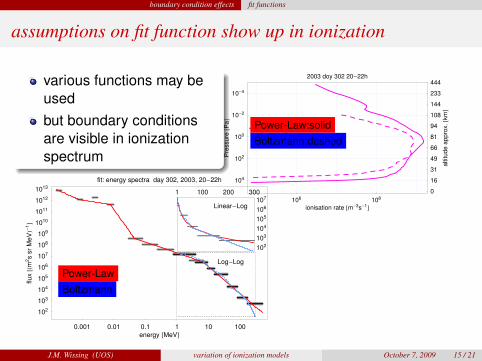
assumptions on fit function show up in ionization
various functions may beusedbut boundary conditionsare visible in ionizationspectrum
0.001 0.01 0.1 1 10 100
energy @MeVD
102
103
104
105
106
107
108
109
1010
1011
1012
1013
flu
x@H
m2s
sr
Me
VL-
1D
fit: energy spectra day 302, 2003, 20-22h
aimos: redJackman: blue
1 100 200 300
102
103
104
105
106
107
Log-Log
Linear-Log106 108
ionisation rate @m-3s-1D
104
102
100
10-2
10-4
Pre
ssure@P
aD
0
16
31
49
66
81
94
108
144
233
444
altitude
appro
x.@k
mD
2003 doy 302 20-22h
aimos : solid
Jackman : dashed
Power-LawBoltzmann
Power-Law:solidBoltzmann:dashed
impact of fit function
Every fit function shows it’s characteristics in the ionization profile.In case of fixed intersections the ionization profile even may showconstant characteristics.
J.M. Wissing (UOS) variation of ionization models October 7, 2009 15 / 21

boundary condition effects fit functions
assumptions on fit function show up in ionization
various functions may beusedbut boundary conditionsare visible in ionizationspectrum
0.001 0.01 0.1 1 10 100
energy @MeVD
102
103
104
105
106
107
108
109
1010
1011
1012
1013
flu
x@H
m2s
sr
Me
VL-
1D
fit: energy spectra day 302, 2003, 20-22h
aimos: redJackman: blue
1 100 200 300
102
103
104
105
106
107
Log-Log
Linear-Log106 108
ionisation rate @m-3s-1D
104
102
100
10-2
10-4
Pre
ssure@P
aD
0
16
31
49
66
81
94
108
144
233
444
altitude
appro
x.@k
mD
2003 doy 302 20-22h
aimos : solid
Jackman : dashed
Power-LawBoltzmann
Power-Law:solidBoltzmann:dashed -
--
-
-
impact of fit function
Every fit function shows it’s characteristics in the ionization profile.In case of fixed intersections the ionization profile even may showconstant characteristics.
J.M. Wissing (UOS) variation of ionization models October 7, 2009 15 / 21

boundary condition effects impact of the energy range
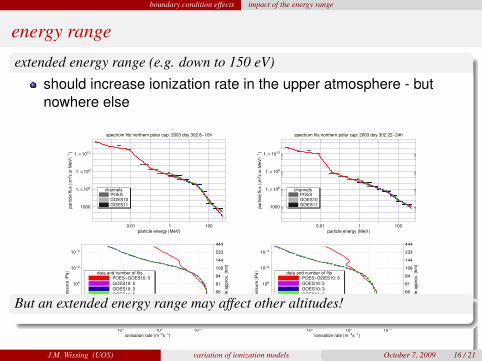
energy range
extended energy range (e.g. down to 150 eV)
should increase ionization rate in the upper atmosphere - butnowhere else
106 108 1010
ionisation rate @m-3s-1D
104
102
100
10-2
10-4
Pre
ssure@P
aD
0
16
31
49
66
81
94
108
144
233
444
altitude
appro
x.@k
mD
GOES11: 3
GOES11: 5
GOES10: 3
GOES10: 5
POES+GOES10: 5data and number of fits
0.01 1 100
particle energy @MeVD
1000
1.´106
1.´109
1.´1012
part
icle
flux@H
m2s
sr
MeVL-
1D
spectrum fits northern polar cap: 2003 doy 302 8-10h
GOES11GOES10POES
channels
106 108 1010
ionisation rate @m-3s-1D
104
102
100
10-2
10-4
Pre
ssure@P
aD
0
16
31
49
66
81
94
108
144
233
444
altitude
appro
x.@k
mD
GOES11: 3
GOES11: 5
GOES10: 3
GOES10: 5
POES+GOES10: 5data and number of fits
0.01 1 100
particle energy @MeVD
1000
1.´106
1.´109
1.´1012
part
icle
flux@H
m2s
sr
MeVL-
1D
spectrum fits northern polar cap: 2003 doy 302 22-24h
GOES11GOES10POES
channels
But an extended energy range may affect other altitudes!
J.M. Wissing (UOS) variation of ionization models October 7, 2009 16 / 21
boundary condition effects impact of the energy range
energy range
extended energy range (e.g. down to 150 eV)
should increase ionization rate in the upper atmosphere - butnowhere else
106 108 1010
ionisation rate @m-3s-1D
104
102
100
10-2
10-4
Pre
ssure@P
aD
0
16
31
49
66
81
94
108
144
233
444
altitude
appro
x.@k
mD
GOES11: 3
GOES11: 5
GOES10: 3
GOES10: 5
POES+GOES10: 5data and number of fits
0.01 1 100
particle energy @MeVD
1000
1.´106
1.´109
1.´1012
part
icle
flux@H
m2s
sr
MeVL-
1D
spectrum fits northern polar cap: 2003 doy 302 8-10h
GOES11GOES10POES
channels
106 108 1010
ionisation rate @m-3s-1D
104
102
100
10-2
10-4
Pre
ssure@P
aD
0
16
31
49
66
81
94
108
144
233
444
altitude
appro
x.@k
mD
GOES11: 3
GOES11: 5
GOES10: 3
GOES10: 5
POES+GOES10: 5data and number of fits
0.01 1 100
particle energy @MeVD
1000
1.´106
1.´109
1.´1012
part
icle
flux@H
m2s
sr
MeVL-
1D
spectrum fits northern polar cap: 2003 doy 302 22-24h
GOES11GOES10POES
channels
But an extended energy range may affect other altitudes!
J.M. Wissing (UOS) variation of ionization models October 7, 2009 16 / 21

boundary condition effects impact of the energy range
Extended energy range impliesvariations at lower altitude dueto other fit parameters
general problem
Variations due to energy rangeand fit function affect allionization models based onparticle measurements.
106 108 1010
ionisation rate @m-3s-1D
104
102
100
10-2
10-4
Pre
ssure@P
aD
0
16
31
49
66
81
94
108
144
233
444
altitude
appro
x.@k
mD
GOES11: 3
GOES11: 5
GOES10: 3
GOES10: 5
POES+GOES10: 5data and number of fits
0.01 1 100
particle energy @MeVD
1000
1.´106
1.´109
1.´1012
part
icle
flux@H
m2s
sr
MeVL-
1D
spectrum fits northern polar cap: 2003 doy 302 6-8h
GOES11GOES10POES
channels
J.M. Wissing (UOS) variation of ionization models October 7, 2009 17 / 21

direct effects of the ionization model direct effects of the ionization model
direct effects of the ionization model
Assuming that boundary condition effects are under control, do theionization models agree now?
J.M. Wissing (UOS) variation of ionization models October 7, 2009 18 / 21
direct effects of the ionization model direct effects of the ionization model
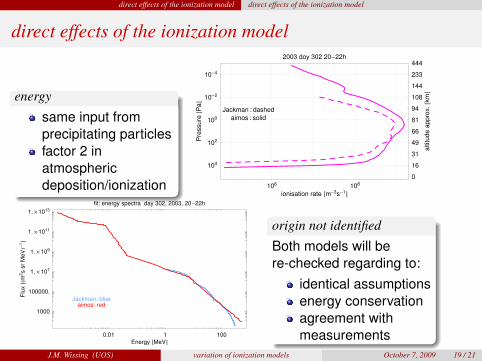
direct effects of the ionization model
energy
same input fromprecipitating particlesfactor 2 inatmosphericdeposition/ionization 106 108
ionisation rate @m-3s-1D
104
102
100
10-2
10-4
Pre
ssure@P
aD
0
16
31
49
66
81
94
108
144
233
444
altitude
appro
x.@k
mD
2003 doy 302 20-22h
aimos : solid
Jackman : dashed
0.01 1 100
Energy @MeVD
1000
100000.
1.´107
1.´109
1.´1011
1.´1013
Flu
x@H
m2s
sr
Me
VL-
1D
fit: energy spectra day 302, 2003, 20-22h
aimos: redJackman: blue
origin not identified
Both models will bere-checked regarding to:
identical assumptionsenergy conservationagreement withmeasurements
J.M. Wissing (UOS) variation of ionization models October 7, 2009 19 / 21

summary
summary
input values
no 3D resolution needed for proton ioniozation below 65 km (60◦
cap)electron impact should be considered (listen to next talks ;-)similar instruments on different satellites may cause a factor 10 inionization
fit function
every kind of/assumption on the fit function severely affectsionization profiledifferent energy range may also affect the ionization rate asminimal variation in the spectrum fit easily creates significantvariation in the ionization profileimpact of fit function and energy range is as important as theionization model itself
open question
How to improve the model chain?Which part of of the model chain has to be adjusted:
ionization modules orproduction rates/interaction cross sections (NOx, HOx)?
J.M. Wissing (UOS) variation of ionization models October 7, 2009 20 / 21
summary
Thanks to...Charles Jackman for providing spectra and ionization rates for thecomparison.the DFG for their financial support.the audiance.
references
Wissing, J.M., and M.-B. Kallenrode, Atmospheric Ionization Module OSnabruck (AIMOS)1: A 3D model to determine atmospheric ionization by energetic charged particles fromdifferent populations, J. Geophys. Res., 114, A06104, doi:10.1029/2008JA013884, 2009
Wissing, J.M., M.-B. Kallenrode, M. Sinnhuber, H. Winkler, N. Wieters, AIMOS 2, J.Geophys. Res. in press, 2009
J.M. Wissing (UOS) variation of ionization models October 7, 2009 21 / 21