variation in growth rates of branching corals along … in growth rates of branching corals along...
TRANSCRIPT
1Scientific RepoRts | 7: 2920 | DOI:10.1038/s41598-017-03085-1
www.nature.com/scientificreports
Variation in growth rates of branching corals along Australia’s Great Barrier ReefKristen D. Anderson 1,2, Neal E. Cantin2, Scott F. Heron 3,4,5, Chiara Pisapia1 & Morgan S. Pratchett1
Coral growth is an important component of reef health and resilience. However, few studies have investigated temporal and/or spatial variation in growth of branching corals, which are important contributors to the structure and function of reef habitats. This study assessed growth (linear extension, density, and calcification) of three branching coral species (Acropora muricata, Pocillopora damicornis and Isopora palifera) at three distinct locations (Lizard Island, Davies/Trunk Reef, and Heron Island) along Australia’s Great Barrier Reef (GBR). Annual growth rates of all species were highest at Lizard Island and declined with increasing latitude, corresponding with differences in temperature. Within locations, however, seasonal variation in growth did not directly correlate with temperature. Between October 2012 and October 2014, the highest growth of A. muricata was in the 2013–14 summer at Lizard Island, which was unusually cool and ~0.5 °C less than the long-term summer average temperature. At locations where temperatures reached or exceeded the long-term summer maxima, coral growth during summer periods was equal to, if not lower than, winter periods. This study shows that temperature has a significant influence on spatiotemporal patterns of branching coral growth, and high summer temperatures in the northern GBR may already be constraining coral growth and reef resilience.
Coral reefs are important ecosystems, providing invaluable goods and services to tropical nations1 as well as sup-porting a great diversity of reef-associated organisms2–4. The value and productivity of coral reef ecosystems are strongly linked to the condition of coral assemblages, and especially the structural complexity and habitat diver-sity provided by coral-rich habitats5. Accordingly, widespread declines in coral cover and structural complexity, as reported in a number of locations6, 7 directly effect local diversity and productivity8, 9, thereby undermining the ecological and economic value of reef ecosystems. Sustained and ongoing declines in abundance of corals are largely attributed to increasing incidence of whole coral mortality caused by acute disturbances7. However, acute disturbances (e.g., mass coral bleaching) as well as chronic disturbances (e.g., sustained shifts in environmental conditions) can have important demographic consequences for reef building corals10, 11, further contributing to declines in live coral cover.
Coral growth rates are known to be strongly linked to environmental conditions. Individual coral growth is regulated by a wide range of both biotic and abiotic factors12. However, at large latitudinal scales, aragonite saturation state, temperature, and light control the geographic distribution of corals, as they are critical factors for photosynthesis (energy acquisition) and calcification13. Beyond the latitudinal limit of reef formation (~30°), aragonite saturation is generally too low (Ωarag < 3) to enable reef accretion and formation14. At lower latitudes coral growth generally increases in accordance with increasing temperature, carbonate saturation and light inten-sity12. Across 14 degrees of latitude on Australia’s Great Barrier Reef (GBR) (10 °S to 24 °S), an increase of 1 °C in annual average sea surface temperature (SST) was correlated with an increase in calcification rates by 0.3 g cm−2 year−1 for massive Porites15.
1ARC Centre of Excellence for Coral Reef Studies, James Cook University, Townsville, QLD, 4811, Australia. 2Australian Institute of Marine Science, PMB 3, Townsville, Queensland, 4810, Australia. 3Coral Reef Watch, U.S. National Oceanic and Atmospheric Administration, College Park, MD, 20740, USA. 4Global Science & Technology, Inc., Greenbelt, MD, 20770, USA. 5Marine Geophysical Laboratory, Physics Department, College of Science and Engineering, James Cook University, Townsville, QLD 4811, Australia. Correspondence and requests for materials should be addressed to K.D.A. (email: [email protected])
Received: 1 December 2016
Accepted: 24 April 2017
Published: xx xx xxxx
OPEN
www.nature.com/scientificreports/
2Scientific RepoRts | 7: 2920 | DOI:10.1038/s41598-017-03085-1
Despite the generally positive relationship between coral growth and temperature, ocean warming is of great concern for scleractinian corals16, 17. Most notably, corals may bleach when the local temperatures exceed typical summer maxima by 1 °C18. However, even before corals bleach sustained increases in local temperatures may lead to declines in growth or performance. For example, the optimum temperature for coral calcification is typically 1–3 °C below the local summer maximum19, 20, such that ocean warming will constrain coral growth by reducing the time that environmental conditions are conducive to maximum rates of calcification12. Ocean warming is pur-ported to be key factor contributing to observed declines in growth of massive corals across many reef locations (Australia21, Thailand22, Red Sea23, Florida24).
While the effects of ocean warming on coral growth are relatively well understood, current knowledge regarding projected changes in aragonite saturation (Ωarag) on coral reefs and how this will effect demography of scleractinain corals is very limited25. Increases in atmospheric carbon dioxide (CO2) from 280 ppm in the pre-industrial period to present day concentrations of 401 ppm26 have resulted in a decrease in the surface ocean pH from a global average of 8.21 to 8.10, as well as corresponding shifts in aragonite saturation27. As the aragonite saturation declines, the carbonate saturation state of the internal calcifying fluid declines and the rate of calcifi-cation decreases28. Albright et al.29 used alkalinity enrichment to demonstrate that net community calcification increases significantly when ocean chemistry is restored to conditions expected to have occurred in pre-industrial times.
The purpose of this study was to quantify growth rates (specifically, linear extension, density and calcification) of three branching corals (Acropora muricata (cf. A. formosa), Pocillopora damicornis and Isopora palifera) at three distinct locations along the Great Barrier Reef, Australia (Figs 1 and 2). Until recently, much of the work on changes in coral growth rates along marked environmental gradients and the documented effects of climate change have focused on massive coral species, largely due to relative ease in documenting coral growth rates from
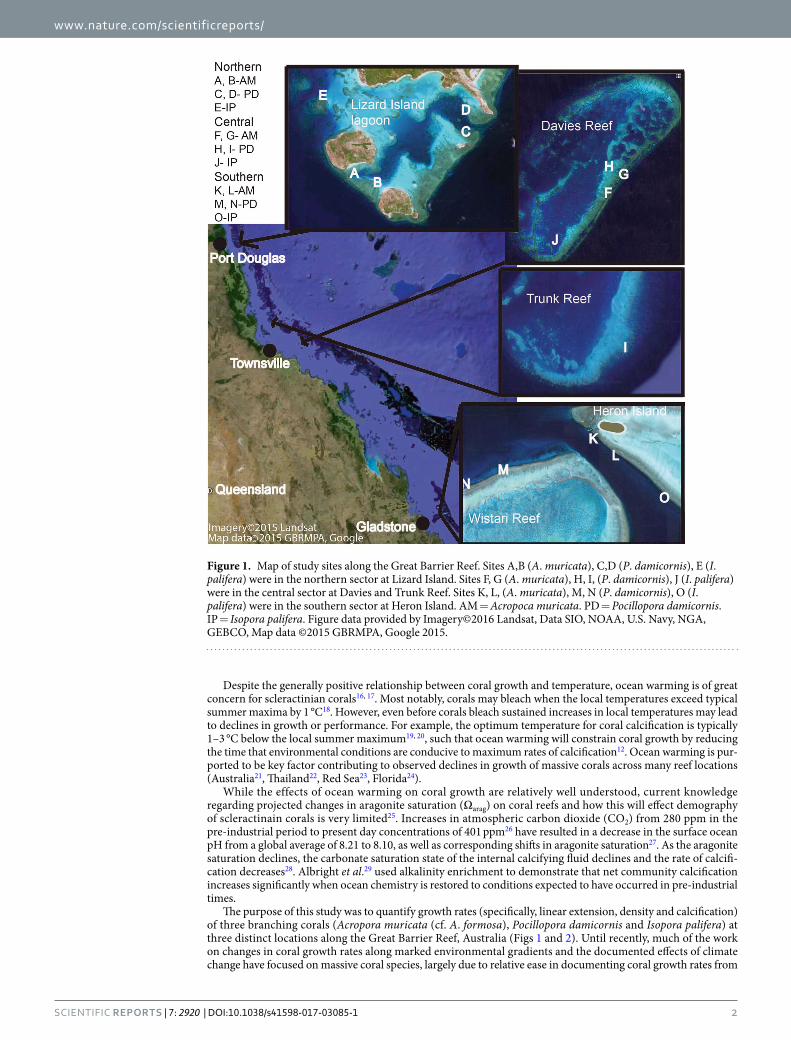
Figure 1. Map of study sites along the Great Barrier Reef. Sites A,B (A. muricata), C,D (P. damicornis), E (I. palifera) were in the northern sector at Lizard Island. Sites F, G (A. muricata), H, I, (P. damicornis), J (I. palifera) were in the central sector at Davies and Trunk Reef. Sites K, L, (A. muricata), M, N (P. damicornis), O (I. palifera) were in the southern sector at Heron Island. AM = Acropoca muricata. PD = Pocillopora damicornis. IP = Isopora palifera. Figure data provided by Imagery©2016 Landsat, Data SIO, NOAA, U.S. Navy, NGA, GEBCO, Map data ©2015 GBRMPA, Google 2015.
www.nature.com/scientificreports/
3Scientific RepoRts | 7: 2920 | DOI:10.1038/s41598-017-03085-1
the alternating high and low density banding12. The spatial trends in growth rates of most branching coral species are unknown and yet they are arguably the most ecologically important corals in providing reef complexity, and therefore, reef biodiversity30. Declines in the growth rates of branching corals, which are among the fastest grow-ing corals, may also have significant impacts on reef growth12. Investigating variability in growth of branching corals over large temporal and spatial scales, where there are substantial differences in environmental conditions may provide insight into how these corals will respond to changing environmental conditions.
ResultsStaining of branching corals to monitor growth is a common method, however some loss of stained branches and colonies is inevitable. Moderate levels of background coral mortality and injuries are common for fast growing and typically short-lived, branching corals31. Furthermore, despite return visits to study sites every six or twelve months, several stained colonies could not be found. Of the 720 A. muricata branches stained in this study, 70% (540/720) were recovered and healthy, and were used in analyses of coral growth. Of those excluded, 20% had died since staining but were still intact, while the remainder were not found. For P. damicornis, 90% (108/120) of the colonies stained were found healthy and used in this study. Of the 12 colonies not included, 7 died, 4 were not found and 1 did not stain well. For Isopora palifera, 90% (27/30) of stained colonies were found healthy and used in the study, while the fate of the other 10% is unknown (possibly lost due to poor tag retention).
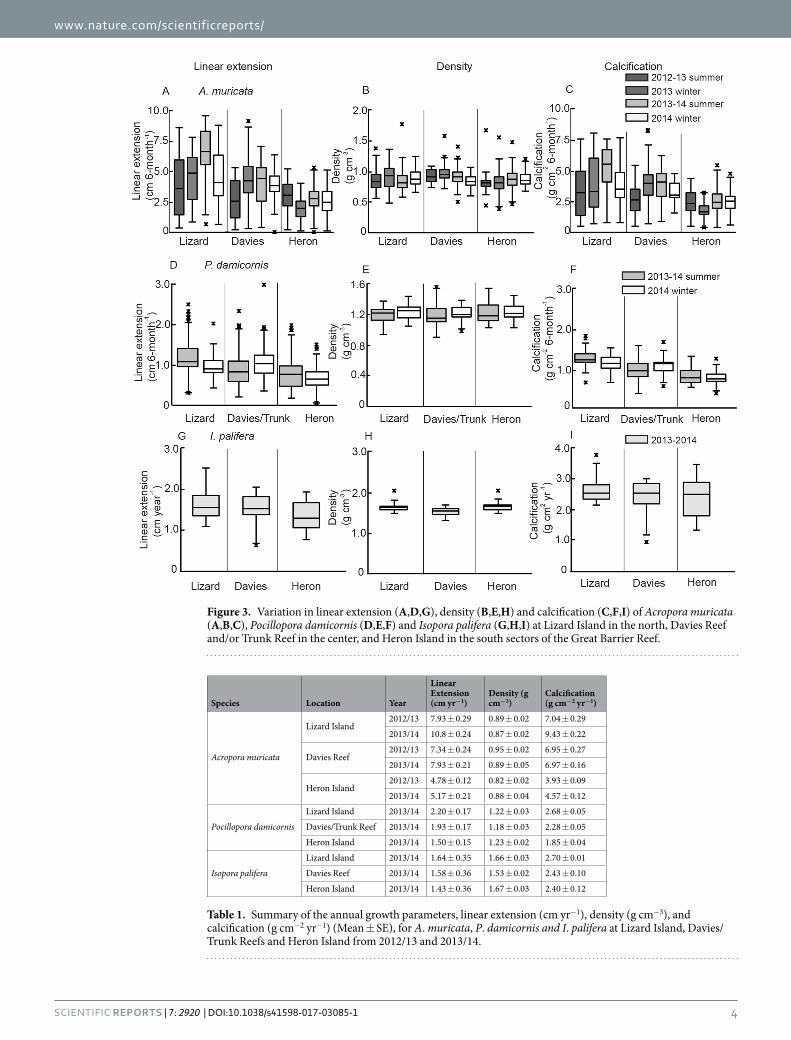
Intraspecific variation in growth. Acropora muricata. Average linear extension was greatest at Lizard Island (4.78 ± 0.19 cm 6-month−1) (mean ± SE) compared to Davies Reef (3.81 ± 0.42 cm 6-month−1) and Heron Island (2.49 ± 0.08 cm 6-month−1). Linear extension rates measured at Lizard Island were significantly greater than Heron Island (lme, t = −3.390, p = 0.003; Supplementary Table S2), but were not significantly different from Davies Reef (lme, t = −1.250, p = 0.229). When evaluating variation among sampling periods within each reef, linear extension showed significant inter-annual variation (Nested ANOVA p < 0.05; Supplementary Table S3). At Lizard Island for example, the lowest (3.69 ± 0.43 cm 6-months−1) and greatest (6.56 ± 0.43 cm 6-months−1) linear extension rates were in the 2012–13 summer and 2013–14 summer, respectively (Fig. 3A).
The average bulk skeletal density of A. muricata on the Great Barrier Reef was 0.88 ± 0.01 g cm−3, and did not vary significantly among locations (Fig. 3B; lme, p > 0.05, Supplementary Table S2). There was, however, significant temporal variation in density of newly accreted skeleton at Davies Reef between sampling periods (Nested ANOVA, F3/45 = 3.319, p = 0.028, Supplementary Table S3) but no consistent trend with respect to season (Fig. 3B).
Calcification rates of A. muricata (measured as total weight per volume of skeletal material added at growing tips, i.e. the product of branch tip density and linear extension) decreased along the north-south latitudinal gradi-ent along the GBR and were largely reflective of variation in linear extension (Supplementary Fig. S2). The average 6-month calcification rate at Heron Island (2.20 ± 0.4 g cm−2) was 40% less than Lizard Island (3.70 ± 0.4 g cm−2) and significantly varied (lme, t = −3.280, p = 0.004; Supplementary Table S2). Similar significant variation in calcification (34% less) was observed between Davies Reef (3.31 ± 0.5 g cm−2) and Heron Island (Fig. 3C; lme, t = −2.47, p = 0.024). However, calcification rates between Lizard and Davies were comparable (lme, t = −0.759, p = 0.458; Supplementary Table S2). Within each reef, there was significant variation in calcification rates (Nested ANOVA p < 0.05; Supplementary Table S3, Fig. 3C). Annual rates of coral growth are often compared among species12 and calculated annual rates of linear extension, density and calcification from this study are provided in Table 1.
Pocillopora damicornis. Average linear extension of P. damicornis was higher at Lizard Island (1.04 ± 0.09 cm 6-month−1), compared to Davies/Trunk Reefs (0.91 ± 0.11 cm 6-month−1) and Heron Island (0.69 ± 0.09 cm 6-month−1). There were significant differences in linear extension between Lizard and Heron Island (Fig. 3D; lme, t = −3.270, p = 0.011; Supplementary Table S2), but intermediate levels recorded at Davies/Trunk Reef were not significantly different to those recorded at Lizard Island or Heron Island (lme, t = −2.17, p = 0.062). Significant seasonal differences in growth of P. damicornis was apparent at Lizard and Davies/Trunk (Nested ANOVA p < 0.05), but not Heron (Nested ANOVA, p > 0.05, Supplementary Table S3). Skeletal bulk density
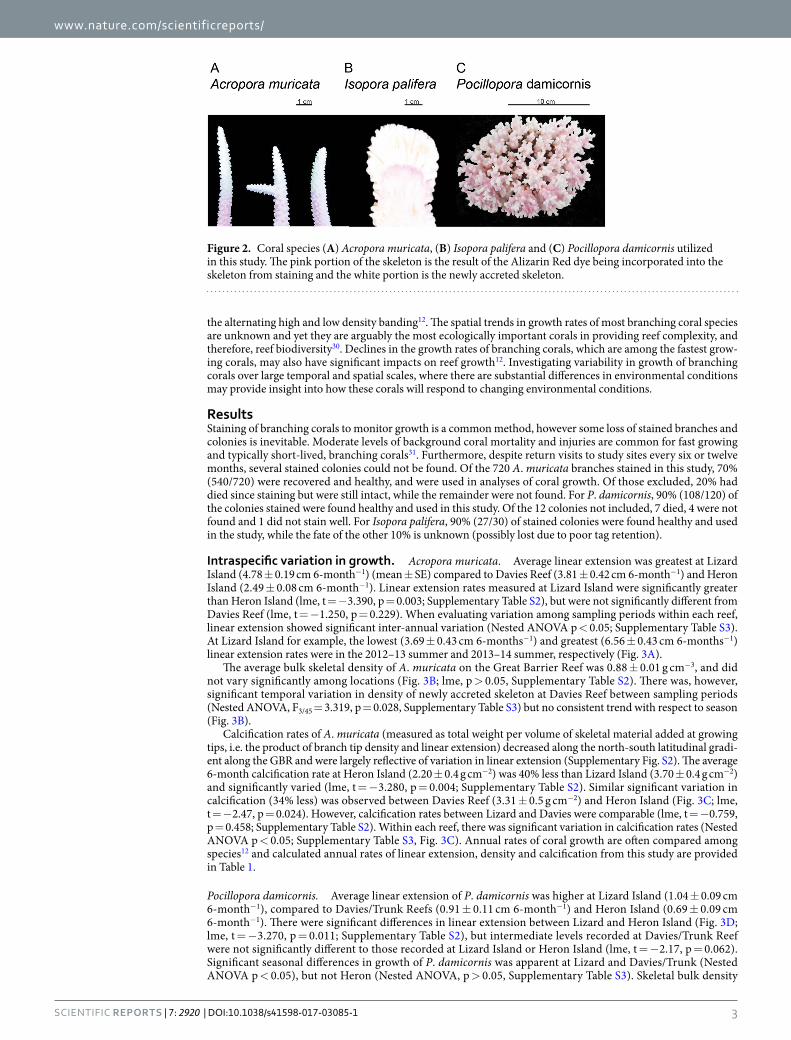
Figure 2. Coral species (A) Acropora muricata, (B) Isopora palifera and (C) Pocillopora damicornis utilized in this study. The pink portion of the skeleton is the result of the Alizarin Red dye being incorporated into the skeleton from staining and the white portion is the newly accreted skeleton.
www.nature.com/scientificreports/
4Scientific RepoRts | 7: 2920 | DOI:10.1038/s41598-017-03085-1
Figure 3. Variation in linear extension (A,D,G), density (B,E,H) and calcification (C,F,I) of Acropora muricata (A,B,C), Pocillopora damicornis (D,E,F) and Isopora palifera (G,H,I) at Lizard Island in the north, Davies Reef and/or Trunk Reef in the center, and Heron Island in the south sectors of the Great Barrier Reef.
Species Location Year
Linear Extension (cm yr−1)
Density (g cm−3)
Calcification (g cm−2 yr−1)
Acropora muricata
Lizard Island2012/13 7.93 ± 0.29 0.89 ± 0.02 7.04 ± 0.29
2013/14 10.8 ± 0.24 0.87 ± 0.02 9.43 ± 0.22
Davies Reef2012/13 7.34 ± 0.24 0.95 ± 0.02 6.95 ± 0.27
2013/14 7.93 ± 0.21 0.89 ± 0.05 6.97 ± 0.16
Heron Island2012/13 4.78 ± 0.12 0.82 ± 0.02 3.93 ± 0.09
2013/14 5.17 ± 0.21 0.88 ± 0.04 4.57 ± 0.12
Pocillopora damicornis
Lizard Island 2013/14 2.20 ± 0.17 1.22 ± 0.03 2.68 ± 0.05
Davies/Trunk Reef 2013/14 1.93 ± 0.17 1.18 ± 0.03 2.28 ± 0.05
Heron Island 2013/14 1.50 ± 0.15 1.23 ± 0.02 1.85 ± 0.04
Isopora palifera
Lizard Island 2013/14 1.64 ± 0.35 1.66 ± 0.03 2.70 ± 0.01
Davies Reef 2013/14 1.58 ± 0.36 1.53 ± 0.02 2.43 ± 0.10
Heron Island 2013/14 1.43 ± 0.36 1.67 ± 0.03 2.40 ± 0.12
Table 1. Summary of the annual growth parameters, linear extension (cm yr−1), density (g cm−3), and calcification (g cm−2 yr−1) (Mean ± SE), for A. muricata, P. damicornis and I. palifera at Lizard Island, Davies/Trunk Reefs and Heron Island from 2012/13 and 2013/14.
www.nature.com/scientificreports/
5Scientific RepoRts | 7: 2920 | DOI:10.1038/s41598-017-03085-1
of P. damicornis was not significantly different across the latitudinal gradient of the Great Barrier Reef with an average density of 1.21 ± 0.02 g cm−3 (Fig. 3E; lme p > 0.05, Supplementary Table S3). There was also no varia-tion in skeletal density with respect to season (Nested ANOVA p > 0.05, Supplementary Table S3). Calcification rates per 6-months were greatest at Lizard Island (1.10 ± 0.06 g cm−2), significantly greater than Davies/Trunk (1.07 ± 0.07 g cm−2) and Heron Island (0.84 ± 0.06 g cm−2) (Fig. 3F; lme p < 0.05, Supplementary Table S2). Along the GBR, there was no significant variation in calcification between the 2013–14 summer and 2014 winter sam-pling periods (Nested ANOVA, p > 0.05, Supplementary Table S3). Calculated annual rates of linear extension, density and calcification are provided in Table 1.
Isopora palifera. Average linear extension across all locations for I. palifera was 1.49 ± 0.03 cm yr−1. Linear extension was greatest at Lizard Island (1.64 ± 0.06 cm yr−1) but was not significantly different to growth rates recorded at Davies Reef (1.51 ± 0.06 cm yr−1) or Heron Island (1.33 ± 0.06 cm yr−1) (lme, p > 0.05; Supplementary Table S2, Fig. 3G). In contrast, annual skeletal density was greatest at Heron Island (1.33 g cm−3) compared to the Lizard Island and Davies Reef (Fig. 3H), but did not significantly vary between reefs (lme, p > 0.05, Supplementary Table S2). Annual calcification rates were only 8% greater at Lizard Island (2.69 ± 0.22 cm yr−1) compared to Davies Reef and Heron Island (Fig. 3I) and were not significantly different (lme, p > 0.05; Supplementary Table S2).
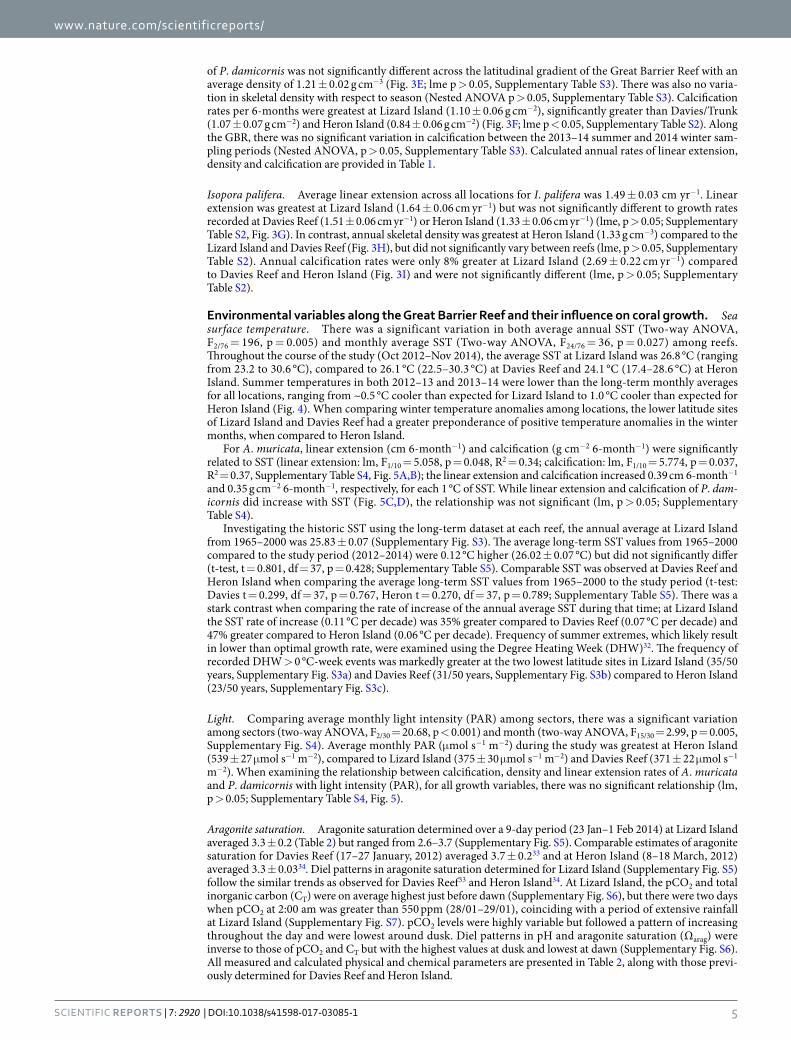
Environmental variables along the Great Barrier Reef and their influence on coral growth. Sea surface temperature. There was a significant variation in both average annual SST (Two-way ANOVA, F2/76 = 196, p = 0.005) and monthly average SST (Two-way ANOVA, F24/76 = 36, p = 0.027) among reefs. Throughout the course of the study (Oct 2012–Nov 2014), the average SST at Lizard Island was 26.8 °C (ranging from 23.2 to 30.6 °C), compared to 26.1 °C (22.5–30.3 °C) at Davies Reef and 24.1 °C (17.4–28.6 °C) at Heron Island. Summer temperatures in both 2012–13 and 2013–14 were lower than the long-term monthly averages for all locations, ranging from ~0.5 °C cooler than expected for Lizard Island to 1.0 °C cooler than expected for Heron Island (Fig. 4). When comparing winter temperature anomalies among locations, the lower latitude sites of Lizard Island and Davies Reef had a greater preponderance of positive temperature anomalies in the winter months, when compared to Heron Island.
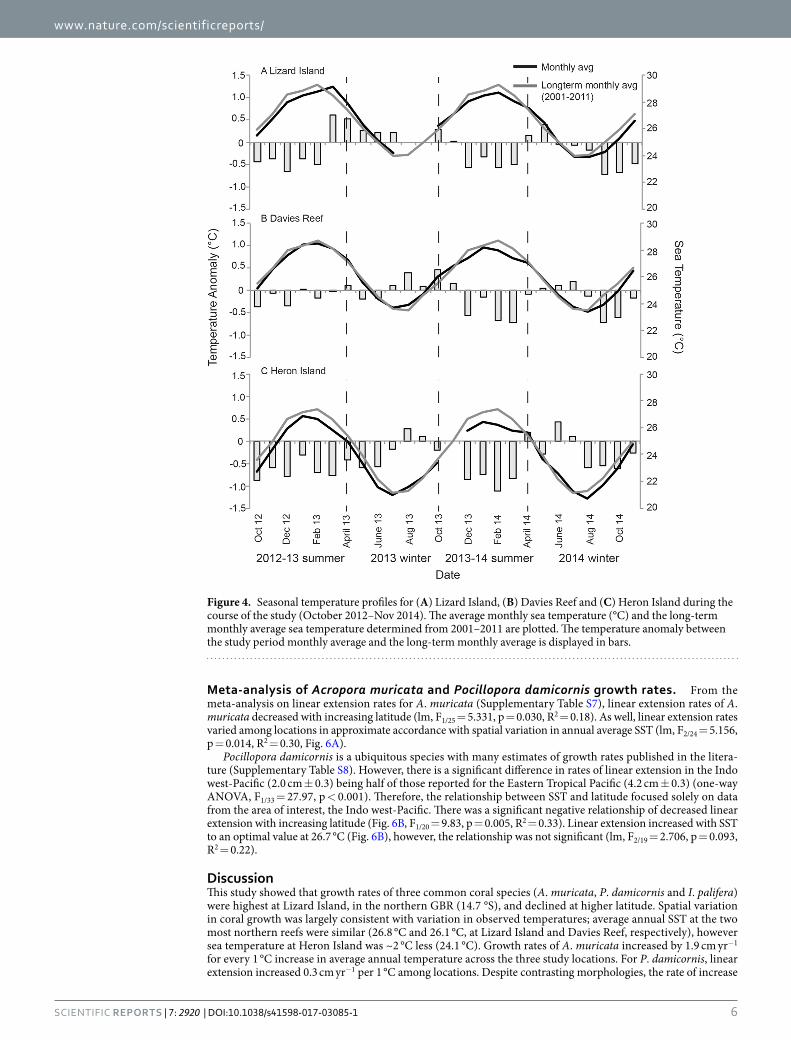
For A. muricata, linear extension (cm 6-month−1) and calcification (g cm−2 6-month−1) were significantly related to SST (linear extension: lm, F1/10 = 5.058, p = 0.048, R2 = 0.34; calcification: lm, F1/10 = 5.774, p = 0.037, R2 = 0.37, Supplementary Table S4, Fig. 5A,B); the linear extension and calcification increased 0.39 cm 6-month−1 and 0.35 g cm−2 6-month−1, respectively, for each 1 °C of SST. While linear extension and calcification of P. dam-icornis did increase with SST (Fig. 5C,D), the relationship was not significant (lm, p > 0.05; Supplementary Table S4).
Investigating the historic SST using the long-term dataset at each reef, the annual average at Lizard Island from 1965–2000 was 25.83 ± 0.07 (Supplementary Fig. S3). The average long-term SST values from 1965–2000 compared to the study period (2012–2014) were 0.12 °C higher (26.02 ± 0.07 °C) but did not significantly differ (t-test, t = 0.801, df = 37, p = 0.428; Supplementary Table S5). Comparable SST was observed at Davies Reef and Heron Island when comparing the average long-term SST values from 1965–2000 to the study period (t-test: Davies t = 0.299, df = 37, p = 0.767, Heron t = 0.270, df = 37, p = 0.789; Supplementary Table S5). There was a stark contrast when comparing the rate of increase of the annual average SST during that time; at Lizard Island the SST rate of increase (0.11 °C per decade) was 35% greater compared to Davies Reef (0.07 °C per decade) and 47% greater compared to Heron Island (0.06 °C per decade). Frequency of summer extremes, which likely result in lower than optimal growth rate, were examined using the Degree Heating Week (DHW)32. The frequency of recorded DHW > 0 °C-week events was markedly greater at the two lowest latitude sites in Lizard Island (35/50 years, Supplementary Fig. S3a) and Davies Reef (31/50 years, Supplementary Fig. S3b) compared to Heron Island (23/50 years, Supplementary Fig. S3c).
Light. Comparing average monthly light intensity (PAR) among sectors, there was a significant variation among sectors (two-way ANOVA, F2/30 = 20.68, p < 0.001) and month (two-way ANOVA, F15/30 = 2.99, p = 0.005, Supplementary Fig. S4). Average monthly PAR (μmol s−1 m−2) during the study was greatest at Heron Island (539 ± 27 μmol s−1 m−2), compared to Lizard Island (375 ± 30 μmol s−1 m−2) and Davies Reef (371 ± 22 μmol s−1 m−2). When examining the relationship between calcification, density and linear extension rates of A. muricata and P. damicornis with light intensity (PAR), for all growth variables, there was no significant relationship (lm, p > 0.05; Supplementary Table S4, Fig. 5).
Aragonite saturation. Aragonite saturation determined over a 9-day period (23 Jan–1 Feb 2014) at Lizard Island averaged 3.3 ± 0.2 (Table 2) but ranged from 2.6–3.7 (Supplementary Fig. S5). Comparable estimates of aragonite saturation for Davies Reef (17–27 January, 2012) averaged 3.7 ± 0.233 and at Heron Island (8–18 March, 2012) averaged 3.3 ± 0.0334. Diel patterns in aragonite saturation determined for Lizard Island (Supplementary Fig. S5) follow the similar trends as observed for Davies Reef33 and Heron Island34. At Lizard Island, the pCO2 and total inorganic carbon (CT) were on average highest just before dawn (Supplementary Fig. S6), but there were two days when pCO2 at 2:00 am was greater than 550 ppm (28/01–29/01), coinciding with a period of extensive rainfall at Lizard Island (Supplementary Fig. S7). pCO2 levels were highly variable but followed a pattern of increasing throughout the day and were lowest around dusk. Diel patterns in pH and aragonite saturation (Ωarag) were inverse to those of pCO2 and CT but with the highest values at dusk and lowest at dawn (Supplementary Fig. S6). All measured and calculated physical and chemical parameters are presented in Table 2, along with those previ-ously determined for Davies Reef and Heron Island.
www.nature.com/scientificreports/
6Scientific RepoRts | 7: 2920 | DOI:10.1038/s41598-017-03085-1
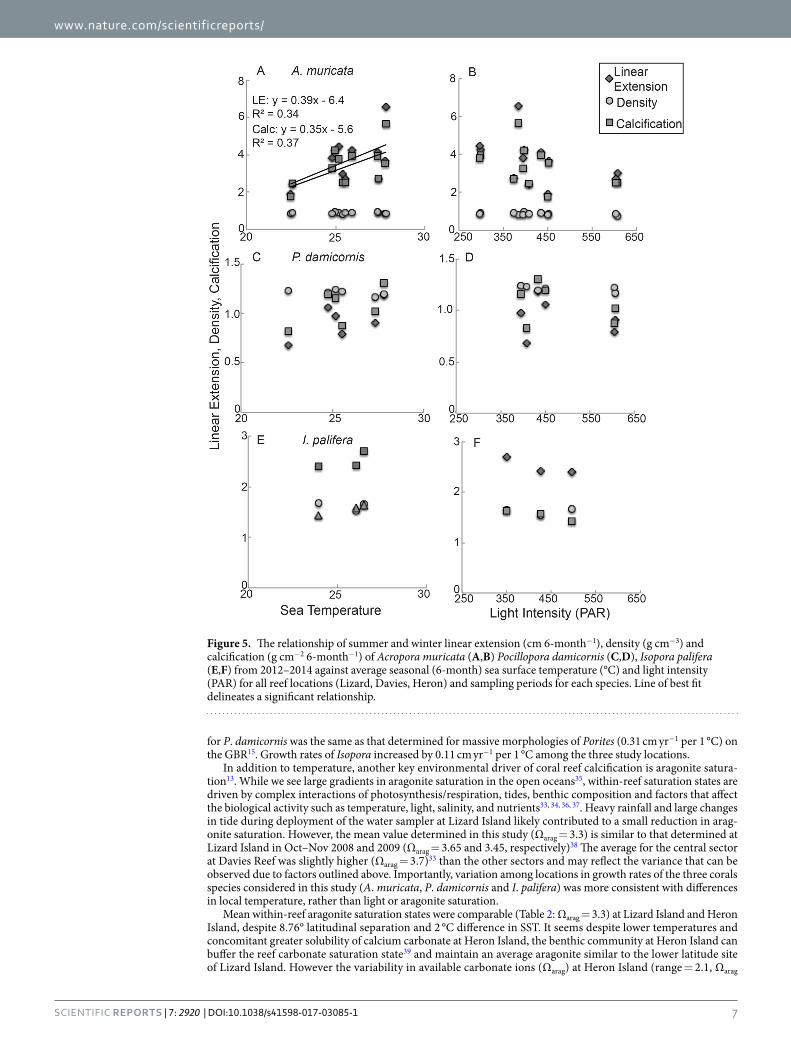
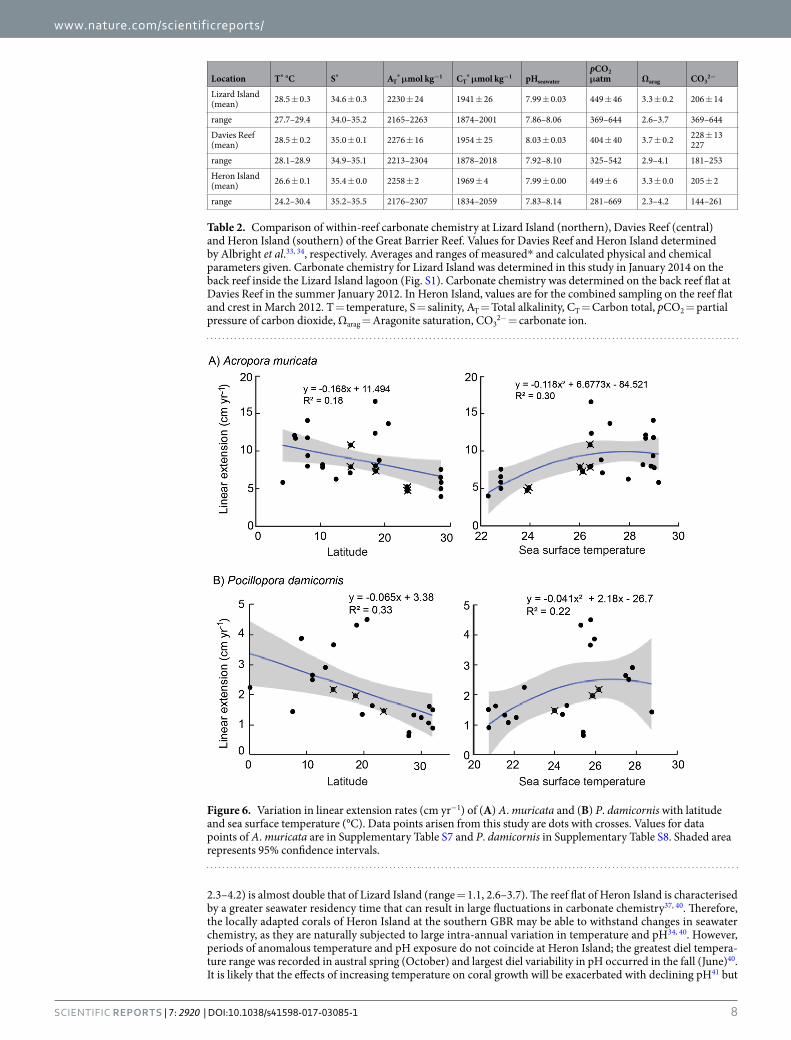
Meta-analysis of Acropora muricata and Pocillopora damicornis growth rates. From the meta-analysis on linear extension rates for A. muricata (Supplementary Table S7), linear extension rates of A. muricata decreased with increasing latitude (lm, F1/25 = 5.331, p = 0.030, R2 = 0.18). As well, linear extension rates varied among locations in approximate accordance with spatial variation in annual average SST (lm, F2/24 = 5.156, p = 0.014, R2 = 0.30, Fig. 6A).
Pocillopora damicornis is a ubiquitous species with many estimates of growth rates published in the litera-ture (Supplementary Table S8). However, there is a significant difference in rates of linear extension in the Indo west-Pacific (2.0 cm ± 0.3) being half of those reported for the Eastern Tropical Pacific (4.2 cm ± 0.3) (one-way ANOVA, F1/33 = 27.97, p < 0.001). Therefore, the relationship between SST and latitude focused solely on data from the area of interest, the Indo west-Pacific. There was a significant negative relationship of decreased linear extension with increasing latitude (Fig. 6B, F1/20 = 9.83, p = 0.005, R2 = 0.33). Linear extension increased with SST to an optimal value at 26.7 °C (Fig. 6B), however, the relationship was not significant (lm, F2/19 = 2.706, p = 0.093, R2 = 0.22).
DiscussionThis study showed that growth rates of three common coral species (A. muricata, P. damicornis and I. palifera) were highest at Lizard Island, in the northern GBR (14.7 °S), and declined at higher latitude. Spatial variation in coral growth was largely consistent with variation in observed temperatures; average annual SST at the two most northern reefs were similar (26.8 °C and 26.1 °C, at Lizard Island and Davies Reef, respectively), however sea temperature at Heron Island was ~2 °C less (24.1 °C). Growth rates of A. muricata increased by 1.9 cm yr−1 for every 1 °C increase in average annual temperature across the three study locations. For P. damicornis, linear extension increased 0.3 cm yr−1 per 1 °C among locations. Despite contrasting morphologies, the rate of increase
Figure 4. Seasonal temperature profiles for (A) Lizard Island, (B) Davies Reef and (C) Heron Island during the course of the study (October 2012–Nov 2014). The average monthly sea temperature (°C) and the long-term monthly average sea temperature determined from 2001–2011 are plotted. The temperature anomaly between the study period monthly average and the long-term monthly average is displayed in bars.
www.nature.com/scientificreports/
7Scientific RepoRts | 7: 2920 | DOI:10.1038/s41598-017-03085-1
for P. damicornis was the same as that determined for massive morphologies of Porites (0.31 cm yr−1 per 1 °C) on the GBR15. Growth rates of Isopora increased by 0.11 cm yr−1 per 1 °C among the three study locations.
In addition to temperature, another key environmental driver of coral reef calcification is aragonite satura-tion13. While we see large gradients in aragonite saturation in the open oceans35, within-reef saturation states are driven by complex interactions of photosynthesis/respiration, tides, benthic composition and factors that affect the biological activity such as temperature, light, salinity, and nutrients33, 34, 36, 37. Heavy rainfall and large changes in tide during deployment of the water sampler at Lizard Island likely contributed to a small reduction in arag-onite saturation. However, the mean value determined in this study (Ωarag = 3.3) is similar to that determined at Lizard Island in Oct–Nov 2008 and 2009 (Ωarag = 3.65 and 3.45, respectively)38 The average for the central sector at Davies Reef was slightly higher (Ωarag = 3.7)33 than the other sectors and may reflect the variance that can be observed due to factors outlined above. Importantly, variation among locations in growth rates of the three corals species considered in this study (A. muricata, P. damicornis and I. palifera) was more consistent with differences in local temperature, rather than light or aragonite saturation.
Mean within-reef aragonite saturation states were comparable (Table 2: Ωarag = 3.3) at Lizard Island and Heron Island, despite 8.76° latitudinal separation and 2 °C difference in SST. It seems despite lower temperatures and concomitant greater solubility of calcium carbonate at Heron Island, the benthic community at Heron Island can buffer the reef carbonate saturation state39 and maintain an average aragonite similar to the lower latitude site of Lizard Island. However the variability in available carbonate ions (Ωarag) at Heron Island (range = 2.1, Ωarag
Figure 5. The relationship of summer and winter linear extension (cm 6-month−1), density (g cm−3) and calcification (g cm−2 6-month−1) of Acropora muricata (A,B) Pocillopora damicornis (C,D), Isopora palifera (E,F) from 2012–2014 against average seasonal (6-month) sea surface temperature (°C) and light intensity (PAR) for all reef locations (Lizard, Davies, Heron) and sampling periods for each species. Line of best fit delineates a significant relationship.
www.nature.com/scientificreports/
8Scientific RepoRts | 7: 2920 | DOI:10.1038/s41598-017-03085-1
2.3–4.2) is almost double that of Lizard Island (range = 1.1, 2.6–3.7). The reef flat of Heron Island is characterised by a greater seawater residency time that can result in large fluctuations in carbonate chemistry37, 40. Therefore, the locally adapted corals of Heron Island at the southern GBR may be able to withstand changes in seawater chemistry, as they are naturally subjected to large intra-annual variation in temperature and pH34, 40. However, periods of anomalous temperature and pH exposure do not coincide at Heron Island; the greatest diel tempera-ture range was recorded in austral spring (October) and largest diel variability in pH occurred in the fall (June)40. It is likely that the effects of increasing temperature on coral growth will be exacerbated with declining pH41 but
Location T* °C S* AT* μmol kg−1 CT
* μmol kg−1 pHseawater
pCO2 μatm Ωarag CO3
2−
Lizard Island (mean) 28.5 ± 0.3 34.6 ± 0.3 2230 ± 24 1941 ± 26 7.99 ± 0.03 449 ± 46 3.3 ± 0.2 206 ± 14
range 27.7–29.4 34.0–35.2 2165–2263 1874–2001 7.86–8.06 369–644 2.6–3.7 369–644
Davies Reef (mean) 28.5 ± 0.2 35.0 ± 0.1 2276 ± 16 1954 ± 25 8.03 ± 0.03 404 ± 40 3.7 ± 0.2 228 ± 13
227
range 28.1–28.9 34.9–35.1 2213–2304 1878–2018 7.92–8.10 325–542 2.9–4.1 181–253
Heron Island (mean) 26.6 ± 0.1 35.4 ± 0.0 2258 ± 2 1969 ± 4 7.99 ± 0.00 449 ± 6 3.3 ± 0.0 205 ± 2
range 24.2–30.4 35.2–35.5 2176–2307 1834–2059 7.83–8.14 281–669 2.3–4.2 144–261
Table 2. Comparison of within-reef carbonate chemistry at Lizard Island (northern), Davies Reef (central) and Heron Island (southern) of the Great Barrier Reef. Values for Davies Reef and Heron Island determined by Albright et al.33, 34, respectively. Averages and ranges of measured* and calculated physical and chemical parameters given. Carbonate chemistry for Lizard Island was determined in this study in January 2014 on the back reef inside the Lizard Island lagoon (Fig. S1). Carbonate chemistry was determined on the back reef flat at Davies Reef in the summer January 2012. In Heron Island, values are for the combined sampling on the reef flat and crest in March 2012. T = temperature, S = salinity, AT = Total alkalinity, CT = Carbon total, pCO2 = partial pressure of carbon dioxide, Ωarag = Aragonite saturation, CO3
2− = carbonate ion.
Figure 6. Variation in linear extension rates (cm yr−1) of (A) A. muricata and (B) P. damicornis with latitude and sea surface temperature (°C). Data points arisen from this study are dots with crosses. Values for data points of A. muricata are in Supplementary Table S7 and P. damicornis in Supplementary Table S8. Shaded area represents 95% confidence intervals.
www.nature.com/scientificreports/
9Scientific RepoRts | 7: 2920 | DOI:10.1038/s41598-017-03085-1
temperature-induced increases in coral metabolism42 may counteract any negative response such that the syner-gistic affects remain unclear. Understanding how these stressors synergistically affect coral growth and survival will be imperative for predicting persistence of the reef community.
Meta-analyses of large-scale variation in growth (linear extension) for both A. muricata and P. damicornis revealed generally increasing linear extension rates with decreasing latitude, as shown previously for massive Porites15. While temperature may be just one of several environmental parameters that vary with latitude, and thereby account for observed differences in growth12, it is striking how these spatial patterns correspond to var-iation in local annual mean temperatures. Notably however, the best model to describe the relationship between linear extension rates of both A. muricata and P. damicornis with SST is a saturating relationship, showing that growth is largely invariant to changes in annual mean temperature between 26 and 30 °C (Fig. 6).
A meta-analyses was not completed on Isopora palifera as this is the first study to publish growth characteris-tics on this species. The only other record of linear extension for Isopora sp. (I. cuneata) was at a subtropical loca-tion in Australia, Lord Howe Island, that averaged 1.96 ± 0.07 cm yr−1 from 2010–1143. This is a greater growth rate than reported for the genus in this study on the GBR (1.43–1.64 cm yr−1) but comparison between the two studies is flawed as the species and methodologies between the two studies differed. The colonies from Lord Howe Island were not sliced to the dominant axis of growth and linear growth may have been overestimated; In this study, initial investigation revealed the linear extension determined externally from the stain line to column tip without sectioning was overestimated by an average of 0.35 ± 0.1 cm (mean ± SE, N = 13). As a result, in this study all columns of I. palifera were sectioned to determine linear extension.
The effects of increasing SST on coral growth will vary spatially, depending upon the local thermal history, the extent to which corals are locally adapted, and the extent to which growth is constrained by cool winter or warm summer temperatures12. At the low latitude site Lizard Island, the lowest growth rate of A. muricata was in the 2012–13 summer (Fig. 3A), a summer that started to be on average cooler, but by March–April was ~0.5 °C greater than the 10-year long-term average (Fig. 4A) which may have caused sublethal effects of reduced growth. The positive temperature anomalies continued into the 2013 winter (Fig. 4A) and may have contributed to growth rates of A. muricata being sustained over the winter months. At Lizard Island, A. muricata growth during the 2013–2014 summer was 30% greater than all other sampling periods. During this summer, that majority of these months were 0.5 °C less than the long-term average suggesting temperatures at Lizard Island are already past their thermal optimum in the summer and reductions of 0.5 °C (to ~28.5 °C) from what is often experienced would be more favorable for growth. This trend of constrained coral growth in summer months has also been reported in Western Australia44 and in the Persian Gulf45. At the higher latitude site of Heron Island, positive temperature anomalies in the winter months may be leading to higher growth rates, unrestricted by cooler temperatures. Similarly, P. damicornis did not display expected seasonal trends in growth rates (Fig. 3B). At all locations, the 2013–14 summer had negative temperature anomalies compared to the previous 10-years (Fig. 4). Moreover, the beginning of the 2014 winter months was unusually warm, which may have allowed P. damicornis growth rates to remain similar to the previous summer. Thus, temporal trends in growth rates of branching species on the Great Barrier Reef exhibited high seasonal variability with no clear trend with respect to temperature; unusually warm winters at Heron Island and unusually cool summers at Lizard Island were associated with the highest growth rates obscuring expected seasonal trends.
Future growth rates of corals are likely to be increasingly constrained by temperatures exceeding the optimal for coral growth and survivorship46 and it is evident that lower latitude locations on the GBR are already expe-riencing an increased severity of thermal stress (Supplementary Fig. S3). Increasing temperature is the biggest threat to corals due to the predicted increase in occurrences of coral bleaching events47. The Great Barrier Reef in 2016 had just experienced its third mass bleaching event with the two previous bleaching events in 1998 and 200217. There was spatial variability between the events, with 1998 and 2002 events largely impacting the central GBR and the 2016 event impacting the lower latitudes of the GBR17. With repeated bleaching events, these sites may experience shifts in the coral composition to those more thermo-tolerant species, leading to declines in structural complexity which would have important consequences on fishes and mobile invertebrates associated with live coral habitats2, 30, 48.
High latitude sites such as the southern GBR may initially serve as refugia from thermal stress. However, even high latitude sites can be affected by thermal stress or declining saturation state leading to reductions in growth rates43. The relative benefits of increasing temperature versus constraints imposed by declines in aragonite will play a dominant role in determining the fate of coral in the future46. Heron Island already exhibits reduced rates of coral calcification (50% less for staghorn A. muricata, 30% less for P. damicornis and 8% less for I. palifera (Fig. 3)) compared to those at Lizard Island, likely driven by considerably lower annual average sea temperature. Therefore, increases in temperature may have a positive effect on coral growth at the southern GBR, but there is limited understanding of the constraints imposed by ocean acidification on coral accretion at these high latitude locations. Overall, declines in aragonite saturation are expected to be less influential on calcification than rising sea temperature49, 50 throughout this century.
In conclusion, growth rates of three dominant coral species varied spatially along the GBR, largely in conjunc-tion with differences in average annual temperatures. Based on limited temporal sampling of carbonate chemistry, within-reef aragonite saturation was comparable among these locations, suggesting that reef ecosystems do have considerable capacity to buffer latitudinal gradients in oceanic aragonite saturation. There was also no consistent trend in variation in solar radiation among reefs relative to observed variation in growth rates, though this may impose increased constraints on coral growth at higher latitudes51. Linear extension rates at Heron Island, where annual SST was on average 2 °C lower, were 20%, 33%, and 34% less for I. palifera, P. damicornis and A. muricata, respectively, compared to Lizard Island. Ocean warming may therefore, lead to moderate increases in growth rates of corals at southern locations (see also Pratchett et al.12), whereas increasing temperatures may increasingly constrain coral growth (especially during summer) at lower latitudes. Continued monitoring of coral growth rates
www.nature.com/scientificreports/
1 0Scientific RepoRts | 7: 2920 | DOI:10.1038/s41598-017-03085-1
in combination with environmental conditions, such as temperature stress and within reef carbonate chemistry, will be essential to better appreciate likely impacts of climate change on corals and reef ecosystems.
MethodsCoral species. Coral growth (specifically, linear extension, density, calcification) was quantified for three coral species (Acropora muricata (cf. A. formosa), Pocillopora damicornis, and Isopora palifera) that were com-mon and abundant at widely separated locations along the length of the GBR. Acropora muricata is a staghorn coral that often dominates in shallow water lagoons, forming large mono-specific thickets. P. damicornis is an abundant, ubiquitous species and the recent amendment of the Pocillopora complex taxonomy52 was used to aid identification of P. damicornis. I. palifera is abundant in high wave energy areas forming submassive clumps that contain columns and ridges53.
Study sites. This study was conducted at three distinct locations, spread along 1,187 km of Australia’s Great Barrier Reef (Fig. 1). The northernmost location was Lizard Island (14.7°S), followed by Davies Reef (18.8°S) and Trunk Reef (18.4°S), and finally Heron Island (23.4°S) in the south. At each of the three locations, coral growth was documented at 2 sites for A. muricata and P. damicornis, but only 1 site for I. palifera. Study sites were spe-cifically selected to provide comparable habitat and depth (5 m) at each reef, while also selecting areas with high abundance of each of the specific study species. In the central sector, P. damicornis was poorly represented at the first reef visited (Davies Reef) and therefore, additional sampling was undertaken at another nearby reef, Trunk Reef (Fig. 1I).
Coral growth. To quantify growth rates for each coral species, replicate colonies and/or branches were stained in situ using Alizarin Red54. As calcification takes place, the dye gets incorporated into the skeleton producing a permanent reference against which to measure all subsequent skeletal growth. The concentration of Alizarin used was 12 mg L−1 and corals were exposed to the dye for 4 hours during the daylight hours of 900–160054. Stained corals were marked with cattle tags attached to the colony base, away from the growing tips to minimise disrup-tion to growth. In total, 240 colonies of A. muricata, 120 colonies of P. damicornis and 30 colonies of I. palifera were stained. Once collected, branches and colonies were placed in 10% sodium hypochlorite to remove the coral tissue and expose the skeleton (Fig. 2).
Acropora muricata. The sampling regime for A. muricata encompassed four 6-month periods at each reef: sum-mer 2012–2013 (Oct/Nov 2012–Mar/Apr 2013), winter 2013 (Apr 2013–Oct 2013), summer 2013–2014 (Oct/Nov 2013-Mar/Apr 2014), winter 2014 (Apr/May 2014–Oct-Nov 2014). Individual branches were enclosed in a 1 L plastic bag in situ and secured with an elastic band. Alizarin red was injected with a needle under the elastic band into the bag. Ten colonies of A. muricata, with three branches per colony were stained at each site, total-ling 20 colonies and 60 branches per reef (60 colonies/180 branches total) in October 2012. In April 2013, the stained colonies were collected and another set stained. This cycle of staining continued for two-years totalling 720 branches.
Growth measurements were determined for each branch of A. muricata. Linear extension (cm) was measured with Vernier calipers, recording the minimum distance from the stain line to tip of the apical polyp. Branches that had died prior to final collection were excluded from analysis. In addition, 0.02% (16/720) of branches had switched to zooxanthellae free (non-growing) tips through the course of the study that can result from interior conditions of the colony being less suitable for growth or branches growing too closely together55 and were excluded from analysis. To determine bulk skeletal density of the branching species A. muricata, corals were cut along the stain line with a geological saw using a 2 mm saw blade. The dry weight (g) of the cut branch tips was recorded. Branches were dipped in paraffin wax and the total enclosed volume was determined using water displacement technique56. Skeletal bulk density (g cm−3) was then determined by dividing the dry weight by the enclosed volume. Calcification (g cm−2) rates were calculated by multiplying the linear extension by the density15. However, these calcification rates are only of the apical newly grown branch and are not a measure of whole colony calcification.
Pocillopora damicornis. The sampling regime for P. damicornis encompassed one year, separated into two 6-month periods at each reef: summer 2013–2014 (Oct/Nov 2013–Mar/Apr 2014) and winter 2014 (Apr/May 2014–Oct/Nov 2014). 20 colonies per location (10 at each site) were stained. Colonies (max 20 cm diameter) were removed from the substrate and put into a 70 L clear plastic bag in situ with Alizarin dye released into the bag. For P. damicornis, the number of coral branches measured with callipers ranged from 10–20 (n = 10 for corals 8–15 cm in diameter, n = 20 for corals 15–20 cm in diameter). Branch measurements for P. damicornis were ran-domly sampled along the longest axis of growth (often the most upward projecting). Measured branches were sec-tioned with a saw and the bulk density and calcification was determined as described for A. muricata. In addition, areas of partial mortality due to algal overgrowth or smothering due to sediment were excluded. Calculated rates of density and calcification were averaged among branches and determined at the colony level.
Isopora palifera. Growth rates of I. palifera were determined for an entire year (Oct/Nov 2013–Oct/Nov 2014) at one site per location (Lizard Island, Davies Reef, Heron Island). At each location, 10 colonies were stained (30 colonies total) with 2–3 columns per colony. Columns of I. palifera were enclosed in a 4 L clear plastic bag, sealed at the base with an elastic band and the dye injected under the elastic band with a needle. To determine the linear extension of I. palifera, stained coral columns were sliced at 4.4 mm thickness until the maximum vertical axis of growth was determined and then photographed with a reference scale. Linear extensions were determined for each column by taking three measurements along the main vertical growth axis from the stain line to the end of the column on the digital image in Image J Fiji57. Density and calcification rates of I. palifera were determined
www.nature.com/scientificreports/
1 1Scientific RepoRts | 7: 2920 | DOI:10.1038/s41598-017-03085-1
from the digitised images of x-radiography adapted from Carricart-Ganivet & Barnes58 and detailed methodolo-gies can be found in Supplementary Materials.
Statistical Analysis. To assess spatial variation (among locations) in linear extension, calcification, and den-sity of corals, the package nlme59 was used to fit linear mixed-effects (lme) models using the statistical program R60. Separate analyses were conducted for each coral species (Acropora mucicata, Pocillopora damicornis, Isopora pal-ifera). For all models the fixed effect was location and as a random effect sampling period which was nested in site and then colony. Model selection was informed by Akaike information criterion (AIC) which measures the relatively quality of the model for the data set. The best models were selected based on lowest AIC, then fit by restricted maximum likelihood (Supplementary Table S1). Model assumptions, including normality of errors and homogeneity of variances, were evaluated graphically. To correct for heteroscedasticity and non-normality, a square-root transformation to the models was used (Supplementary Table S1). For each species, one-way analysis of variance (ANOVA) was used post hoc to investigate temporal variation in growth parameters within each location.
Annual rates of linear extension (cm yr−1), density (g cm−3) and calcification (g cm−2 yr−1) were determined averaging the 6-month means (x) for A. muricata and P. damicornis and standardizing for variation in sample size (N) between study periods using equation 1:
= ∑ ∗Σ−
NN
X (x ) , (1)month6
which was then converted to an annual rate.
Environmental Parameters. Sea surface temperature and light. Sea surface temperature (SST) and light (PAR) throughout the study was determined from the Integrated Marine Observing System (IMOS, http://www.aims.gov.au/docs/data/data.html, accessed March 6, 2015) and details of determining monthly averages found in Supplementary Materials. For each location, the long-term (2001–2011) average monthly SST was determined for comparison to the study period (2012–2014). Two-way ANOVA was used to determine significant variation between location SST/light and monthly time period. The relationship of A. muricata and P. damicornis density, linear extension and calcification rates were compared to the sampling period average SST and light for each reef and sampling period using linear regression (lm). As I. palifera was only investigated for one year at 3 sites, a sta-tistical relationship cannot be reliably established due to limited sample size.
Historic sea surface temperature trends were determined from the Extended Reconstructed Sea Surface Temperature (ERSST) dataset (2° and monthly resolution; www1.ncdc.noaa.gov/pub/data/cmb/ersst/v3b/netcdf/, accessed August 2015). Satellite SST data of higher-resolution, both spatially (1/24°, ~4 km) and tempo-rally (weekly), were also derived for the period 1985–2012 from the Pathfinder v5.2 night-only, 4 km-daily SST dataset (pathfinder.nodc.noaa.gov, accessed October 2013), with gaps filled following Heron et al.61. These data were recently used by Heron et al.62 to examine recent temperature trends and thermal stress patterns. However, as these data did not overlap the time periods of interest, 4 km-monthly composites were calculated and used to bias adjust the spatially and temporally lower resolution ERSST data to ensure relevance to the study. Trends in bias-adjusted ERSST were calculated annually from 1965 to 2014. In addition, accumulated thermal stress was calculated from ERSST using the Degree Heating Months (DHM) metric. Values were converted to Degree Heating Weeks (DHW32) for ease of comparison with established ecologically-relevant thresholds for significant bleaching and mortality of 4 and 8 °C-weeks32. At each reef, bias-adjusted ERSST during the course of the study (2012–2014) was compared to the long-term average (1965–2000) using a Student’s t-test.
Aragonite Saturation. Within-reef aragonite saturation had previously been determined at Davies Reef33 and Heron Island34 but was yet to be quantified using the same methodologies in the northern sector at Lizard Island. The carbonate chemistry was determined in the summer for 9 days from Jan 23 to Feb 1, 2014, inside the lagoon on the protected back reef flat, following Albright et al.33, 34. Detailed description of the methodologies can be found in Supplementary Materials.
Meta-analyses of coral growth. Linear extension is the metric most often reported in the literature for quanti-fying growth of branching corals12. To relate measurements of linear extension from along the GBR to other measure ments taken from further afield, separate meta-analyses was performed for A. muricata and P. damicornis, specifically testing for variation in linear extension with local average SST during the studies, as well as latitude. Only one other study had reported growth rates on Isopora at a subtropical location in Australia43 and therefore this species does not have enough data for a meta-analysis. A total of 13 and 16 studies that measured linear extension of A. muricata and P. damicornis, respectively, were used. Where applicable, if additional experimental conditions were imposed in the study, we used only growth estimates from “control” corals. SST was quantified (ERSST bias-adjusted using 4-km satellite values, as described above) for the dates of each study where provided; when sampling dates were not included, the year prior to publication was used. Study depths ranged from 0.5–15 m for A. muricata and 2–7 m for P. damicornis but depth was not reported in all the studies and could not be included in the analysis (Supplementary Tables S7, S8). However, the main question was to determine the relationship of linear extension across large temperature (annual average 21–29 °C) and latitudinal (0–30°) scales. Linear regression (lm) was used to investigate the fixed effect of lin-ear extension on the random effects of average SST and latitude. For both the A. muricata and P. damicornis data set, the models with latitude had a linear model to explain the relationship best, whereas, for SST a polynomial function provided a better relationship (based on comparison of R2). For P. damicornis, the relationship of linear extension with latitude required a square root transformation to normalize the residuals.
www.nature.com/scientificreports/
1 2Scientific RepoRts | 7: 2920 | DOI:10.1038/s41598-017-03085-1
Statistical analysis was completed in R60. All linear models were tested graphically to meet the assumptions of linear models (homogeneity of variance, linearity, independence).
Data availability. The datasets generated during and/or analysed during the current study are available from the corresponding author on reasonable request.
References 1. Moberg, F. & Rönnbäck, P. Ecosystem services of the tropical seascape: interactions, substitutions and restoration. Ocean Coast
Manage 46, 27–46, doi:10.1016/S0964-5691(02)00119-9 (2003). 2. Pratchett, M. S. et al. Effects of climate-induced coral bleaching on coral-reef fishes - Ecological and economic consequences.
Oceanogr Mar Biol Anun Rev 46, 251–296 (2008). 3. Pellissier, L. et al. Quaternary coral reef refugia preserved fish diversity. Science 344, 1016–1019, doi:10.1126/science.1249853 (2014). 4. Rogers, A., Blanchard, J. L. & Mumby, P. J. Vulnerability of coral reef fisheries to a loss of structural complexity. Curr Biol 24,
1000–1005, doi:10.1016/j.cub.2014.03.026 (2014). 5. Graham, N. A. J., Jennings, S., MacNeil, M. A., Mouillot, D. & Wilson, S. K. Predicting climate-driven regime shifts versus rebound
potential in coral reefs. Nature 518, 94–97, doi:10.1038/nature14140 (2015). 6. Gardner, T. A., Cote, I. M., Gill, J. A., Grant, A. & Watkinson, A. R. Long-term region-wide declines in Caribbean corals. Science 301,
958–960, doi:10.1126/science.1086050 (2003). 7. De’ath, G., Fabricius, K. E., Sweatman, H. & Puotinen, M. The 27–year decline of coral cover on the Great Barrier Reef and its causes.
PNAS 109, 17995–17999, doi:10.1073/pnas.1208909109 (2012). 8. Wilson, S. K., Graham, N. A. J., Pratchett, M. S., Jones, G. P. & Polunin, N. V. C. Multiple disturbances and the global degradation of
coral reefs: are reef fishes at risk or resilient? Global Change Biol 12, 2220–2234, doi:10.1111/j.1365-2486.2006.01252.x (2006). 9. Bell, J. D. et al. Mixed responses of tropical Pacific fisheries and aquaculture to climate change. Nature Clim Change 3, 591–599,
doi:10.1038/nclimate1838 (2013). 10. Hughes, T. P. et al. Climate change, human impacts, and the resilience of coral reefs. Science 301, 929–933, doi:10.1126/
science.1085046 (2003). 11. Hughes, T. P., Graham, N. A. J., Jackson, J. B. C., Mumby, P. J. & Steneck, R. S. Rising to the challenge of sustaining coral reef
resilience. Trends Ecol Evol 25, 633–642, doi:10.1016/j.tree.2010.07.011 (2010). 12. Pratchett, M. S. et al. Spatial, temporal and taxonomic variation in coral growth: Implications for the structure and function of coral
reef ecosystems. Oceanogr Mar Biol Anun Rev 53, 215–295 (2015). 13. Kleypas, J. A., MCManus, J. W. & Menez, L. A. B. Environmental limits to coral reef development: where do we draw the line? Am
Zool 39, 146–159, doi:10.1093/icb/39.1.146 (1999). 14. Guinotte, J., Buddemeier, R. & Kleypas, J. Future coral reef habitat marginality: temporal and spatial effects of climate change in the
Pacific basin. Coral Reefs 22, 551–558, doi:10.1007/s00338-003-0331-4 (2003). 15. Lough, J. M. & Barnes, D. J. Environmental controls on growth of the massive coral Porites. J Exp Mar Biol Ecol 245, 225–243 (2000). 16. Walther, G.-R. et al. Ecological responses to recent climate change. Nature 416, 389–395 (2002). 17. Hughes, T. et al. Global warming and recurrent mass bleaching of corals. Nature 544, doi:10.1038/nature21707 (2017). 18. Jokiel, P. L. & Coles, S. L. Response of Hawaiian and other Indo-Pacific reef corals to elevated temperature. Coral Reefs 8, 155–162 (1990). 19. Clausen, C. D. & Roth, A. A. Effect of temperature and temperature adaptation on calcification rate in the hermatypic coral
Pocillopora damicornis. Mar Biol 33, 93–100, doi:10.1007/BF00390713 (1975). 20. Marshall, A. T. & Clode, P. Calcification rate and the effect of temperature in a zooxanthellate and an azooxanthellate scleractinian
reef coral. Coral Reefs 23, 218–224, doi:10.1007/s00338-004-0369-y (2004). 21. De’ath, G., Fabricius, K. & Lough, J. Yes — Coral calcification rates have decreased in the last twenty-five years! Mar Geol 346,
400–402, doi:10.1016/j.margeo.2013.09.008 (2013). 22. Tanzil, J. T. I. et al. Regional decline in growth rates of massive Porites corals in Southeast Asia. Global Change Biol 19, 3011–3023,
doi:10.1111/gcb.12279 (2013). 23. Cantin, N. E., Cohen, A. L., Karnauskas, K. B., Tarrant, A. M. & McCorkle, D. C. Ocean warming slows coral growth in the central
Red Sea. Science 329, 322–325, doi:10.1126/science.1190182 (2010). 24. Helmle, K. P., Dodge, R. E., Swart, P. K., Gledhill, D. K. & Eakin, C. M. Growth rates of Florida corals from 1937 to 1996 and their
response to climate change. Nat Commun 2, 215 (2011). 25. Kleypas, J. A. & Langdon, C. Coral reefs and changing seawater carbonate chemistry. Coast Estuar Studies 61, 73–110 (2006). 26. NOAA. Trends in atmospheric carbon dioxide http://www.esrl.noaa.gov/gmd/ccgg/trends/global.html (2016). 27. Hoegh-Guldberg, O. et al. Coral reefs under rapid climate change and ocean acidification. Science 318, 1737–1742, doi:10.1126/
science.1152509 (2007). 28. Cohen, A. L., McCorkle, D. C., de Putron, S., Gaetani, G. A. & Rose, K. A. Morphological and compositional changes in the skeletons
of new coral recruits reared in acidified seawater: Insights into the biomineralization response to ocean acidification. Geochem Geophys Geosys 10, Q07005, doi:10.1029/2009GC002411 (2009).
29. Albright, R. et al. Reversal of ocean acidification enhances net coral reef calcification. Nature 531, 362–365, doi:10.1038/nature17155 (2016).
30. Coker, D., Wilson, S. & Pratchett, M. Importance of live coral habitat for reef fishes. Rev Fish Biol Fisheries 24, 89–126, doi:10.1007/s11160-013-9319-5 (2014).
31. Pisapia, C., Anderson, K. & Pratchett, M. S. Intraspecific variation in physiological condition of reef-building corals associated with differential levels of chronic disturbance. PloS ONE 9, e91529, doi:10.1371/journal.pone.0091529 (2014).
32. Liu, G., Strong, A. E. & Skirving, W. Remote sensing of sea surface temperatures during 2002 Barrier Reef coral bleaching. Eos Trans Am Geophys Union 84, 137–141, doi:10.1029/2003EO150001 (2003).
33. Albright, R., Langdon, C. & Anthony, K. R. N. Dynamics of seawater carbonate chemistry, production, and calcification of a coral reef flat, central Great Barrier Reef. Biogeosci 10, 6747–6758, doi:10.5194/bg-10-6747-2013 (2013).
34. Albright, R., Benthuysen, J., Cantin, N., Caldeira, K. & Anthony, K. Coral reef metabolism and carbon chemistry dynamics of a coral reef flat. Geophys Res Lett 42, doi:10.1002/2015GL063488 (2015).
35. Feely, R. A., Doney, S. C. & Cooley, S. R. Ocean acidification: present conditions and future changes in a high-CO2 World. Oceanography 22, 36–47 (2009).
36. Anthony, K. R. N., Kleypas, J. A. & Gattuso, J.-P. Coral reefs modify their seawater carbon chemistry – implications for impacts of ocean acidification. Global Change Biol 17, 3655–3666, doi:10.1111/j.1365-2486.2011.02510.x (2011).
37. Falter, J. L., Lowe, R. J., Zhang, Z. & McCulloch, M. Physical and biological controls on the carbonate chemistry of coral reef waters: effects of metabolism, wave forcing, sea level, and geomorphology. PLoS ONE 8, e53303, doi:10.1371/journal.pone.0053303 (2013).
38. Silverman, J. et al. Community calcification in Lizard Island, Great Barrier Reef: A 33 year perspective. Geochim Cosmochim Acta. doi:10.1016/j.gca.2014.09.011 (2014).
39. Anthony, K. R. N., Diaz-Pulido, G., Verlinden, N., Tilbrook, B. & Andersson, A. J. Benthic buffers and boosters of ocean acidification on coral reefs. Biogeosciences 10, 4897–4909, doi:10.5194/bg-10-4897-2013 (2013).
www.nature.com/scientificreports/
13Scientific RepoRts | 7: 2920 | DOI:10.1038/s41598-017-03085-1
40. Kline, D. I. et al. Six month in situ high-resolution carbonate chemistry and temperature study on a coral reef flat reveals asynchronous pH and temperature anomalies. PLoS ONE 10, e0127648, doi:10.1371/journal.pone.0127648 (2015).
41. Reynaud, S. et al. Interacting effects of CO2 partial pressure and temperature on photosynthesis and calcification in a scleractinian coral. Global Change Biology 9, 1660–1668, doi:10.1046/j.1529-8817.2003.00678.x (2003).
42. McCulloch, M., Falter, J., Trotter, J. & Montagna, P. Coral resilience to ocean acidification and global warming through pH up-regulation. Nature Clim. Change 2, 623–627 (2012).
43. Anderson, K. D., Heron, S. F. & Pratchett, M. Species-specific declines in the linear extension of branching corals at a subtropical reef, Lord Howe Island. Coral Reefs 34, 479–490 (2015).
44. Foster, T., Short, J. A., Falter, J. L., Ross, C. & McCulloch, M. T. Reduced calcification in Western Australian corals during anomalously high summer water temperatures. J Expl Mar Biol Ecol 461, 133–143, doi:10.1016/j.jembe.2014.07.014 (2014).
45. Samiei, J. V. et al. Variation in calcification rate of Acropora downingi relative to seasonal changes in environmental conditions in the northeastern Persian Gulf. Coral Reefs 1–12, doi:10.1007/s00338-016-1464-6 (2016).
46. van Hooidonk, R., Maynard, J. A., Manzello, D. & Planes, S. Opposite latitudinal gradients in projected ocean acidification and bleaching impacts on coral reefs. Global Change Biol 20, 103–112, doi:10.1111/gcb.12394 (2014).
47. Donner, S. D., Skirving, W. J., Little, C. M., Oppenheimer, M. & Hoegh-Guldberg, O. Global assessment of coral bleaching and required rates of adaptation under climate change. Global Change Biol 11, 2251–2265 (2005).
48. Stella, J., Pratchett, M., Hutchings, P. & Jones, G. Coral-associated invertebrates: diversity, ecological importance and vulnerability to disturbance. Oceanogr Mar Biol Anun Rev 49, 43–104 (2011).
49. Chan, N. C. S. & Connolly, S. R. Sensitivity of coral calcification to ocean acidification: a meta-analysis. Global Change Biol 19, 282–290, doi:10.1111/gcb.12011 (2013).
50. Kennedy, E. V. et al. Avoiding coral reef functional collapse requires local and global action. Current Biol 23, 912–918, doi:10.1016/j.cub.2013.04.020 (2013).
51. Muir, P. R., Wallace, C. C., Done, T. & Aguirre, J. D. Limited scope for latitudinal extension of reef corals. Science 348, 1135–1138, doi:10.1126/science.1259911 (2015).
52. Schmidt-Roach, S., Miller, K. J., Lundgren, P. & Andreakis, N. With eyes wide open: a revision of species within and closely related to the Pocillopora damicornis species complex (Scleractinia; Pocilloporidae) using morphology and genetics. Zoological Journal of the Linnean Society 170, 1–33, doi:10.1111/zoj.12092 (2014).
53. Veron, J. E. N. Corals of Australia and the Indo-Pacific. (Angus & Robertson, 1986). 54. Lamberts, A. E. In Coral reefs: research methods (eds D.R. Stoddart & R. E. Johannes) 253−257 (UNESCO, 1978). 55. Oliver, J. K. Intra-colony variation in the growth of Acropora formosa extension rates and skeletal structure of white (zooxanthellae-
free) and brown-tipped branches. Coral Reefs 3, 139–147, doi:10.1007/bf00301958 (1984). 56. Oliver, J. K., Chalker, B. E. & Dunlap, W. C. Bathymetric adaptations of reef-building corals at Davies Reef, Great Barrier Reef,
Australia. Long-term growth-response of Acropora formosa (Dana 1846). J Exp Mar Biol Ecol 73, 11–35 (1983). 57. Schindelin, J. et al. Fiji: an open-source platform for biological-image analysis. Nature Methods 9, 676–682 (2012). 58. Carricart-Ganivet, J. P. & Barnes, D. J. Densitometry from digitized images of X-radiographs: Methodology for measurement of
coral skeletal density. J Exp Mar Biol Ecol 344, 67–72, doi:10.1016/j.jembe.2006.12.018 (2007). 59. Pinheiro, J. C. & Chao, E. C. Efficient Laplacian and adaptive Gaussian quadrature algorithms for multilevel generalized linear mixed
models. J Comput Graph Stat (2012). 60. R Core Team. R: A language and environment for statistical computing (R Foundation for Statistical Computing, Vienna, Austria,
2013). 61. Heron, S. F. et al. Summer hot snaps and winter conditions: Modelling white syndrome outbreaks on Great Barrier Reef corals. PLoS
ONE 5, e12210, doi:10.1371/journal.pone.0012210 (2010). 62. Heron, S. F., Maynard, J. A., van Hooidonk, R. & Eakin, C. M. Warming trends and bleaching stress of the World’s coral reefs
1985–2012. Scientific Reports 6, 38402, doi:10.1038/srep38402 (2016).
AcknowledgementsThe authors would like to thanks the staff of Lizard Island, Heron Island and the James Kirby for their logistic support. Thanks to R. Albright for assistance in determining the carbonate chemistry at Lizard Island. Pathfinder data were provided by GHRSST and the US National Oceanographic Data Center, the development of which was supported in part by a grant from the NOAA Climate Data Record (CDR) Program for satellites. The contents of this manuscript are solely the opinions of the authors and do not constitute a statement of policy, decision, or position on behalf of NOAA or the U.S. Government.
Author ContributionsK.D.A., N.E.C., M.S.P. designed the study. K.D.A. and C.P. performed the fieldwork. K.D.A. performed the lab work. K.D.A., SFH undertook the analysis. K.D.A., N.E.C., S.F.H., C.P., M.S.P. wrote and reviewed the manuscript.
Additional InformationSupplementary information accompanies this paper at doi:10.1038/s41598-017-03085-1Competing Interests: The authors declare that they have no competing interests.Publisher's note: Springer Nature remains neutral with regard to jurisdictional claims in published maps and institutional affiliations.
Open Access This article is licensed under a Creative Commons Attribution 4.0 International License, which permits use, sharing, adaptation, distribution and reproduction in any medium or
format, as long as you give appropriate credit to the original author(s) and the source, provide a link to the Cre-ative Commons license, and indicate if changes were made. The images or other third party material in this article are included in the article’s Creative Commons license, unless indicated otherwise in a credit line to the material. If material is not included in the article’s Creative Commons license and your intended use is not per-mitted by statutory regulation or exceeds the permitted use, you will need to obtain permission directly from the copyright holder. To view a copy of this license, visit http://creativecommons.org/licenses/by/4.0/. © The Author(s) 2017