variability and capability: the foundation of competitive operations performance
TRANSCRIPT
George Foo
David J. Friedman
Variability and Capability: The Foundationof Competitive Operations Performance
From anoperations perspective, therearesix primary competitive prioritiesonwhich a company can elect tofocus: cost, quality, service, flexibility,time, and technology. Two tactics improve the performance ofthese priorities: enhancing current process capability byreducing variability, and usingtechnical innovation todefine new "breakthrough" capabilities. This paperdiscusses the importance ofboth tactics and reviews specific case studiesthatdemonstrate theirsignificance.
IntroductionDuringthe early 1980s, leading edu
cators1 ofmanufacturing strategymaintainedthat there werefourcompetitive priorities inoperations: quality, service, flexibility, andcost.Recently, becauseofa changein thecompetitive paradigm, the priority oftime hasbeen added.? as it relatesto the introductionofnewproducts and the reduction oftheinterval between receiving andfilling anorder.Wemaintain that there is a sixthpriority, manufacturing technology. After all, itwould be pointless fora company to have thelowest cost structureand the highestqualityvalues if it didnotpossessthe basictechnologyto manufacture a product.
Webelieve that there are two strategiesforenhancing the performance ofthesixcompetitive priorities: introducing technical innovation and reducing processvariability by improving processcapability. Wealsobelieve that anysuccessful manufacturingcompany musthave a balanced programthat embodies bothapproaches. To focussolely on reducing variability could place acompany injeopardy, because it would renderthe company vulnerable to a competitor witha "breakthrough" technology. Atthe otherextreme, to concentrate only on technicalinnovation without continuously improvingthe existing technology and processescouldalsobe lethal. Ambitious technical innovationsrequirepatience and are notalways successful. Even if an innovative product or process is developed, it does not ensure dominance whencompetitors enter the market.
Overthe years, AT&T manufacturing
has led a balanced attack on improving manufacturing performance. In itsJuly/August1990 issue, the AT&T TechnicalJournal discussedoneexample ofhow AT&Ts manufacturingefforts had improved its process capability. This issuewill add to that discussion,but it will emphasize howtechnical innovationaffects manufacturing.
Proce.. Capability In Competltlvene..Since Shewhart's" introduction of
control charts in the late 1920s, the heart ofprocess control has been consistency ofproduction. Classical control chartsweredesigned to highlight inconsistent ("out-ofcontrol") observations within a process.Operators andengineersfine-tuned a processbycombining control charts with traditionalquality improvement tools, suchas Paretoanalysis andfishbone diagrams. Pareto chartsuse a graphical display ofproblem sourceversusfrequency ofoccurrence to expose thelargestsourcesofproblems. The fishbonediagram (also called the cause-and-effectdiagram) starts with an effect (usually a problemor failure) andworks backward to identify allpossible causesofthis effect. Over aperiod oftime, fine-tuning techniques suchasthese would decreasevariability and improveprocesscapability. Aconvincing argument canbe madethat thisgradual, unending improvement (what the Japanese call Kaizen4) shouldbe the major competitive priority in manufacturingtoday. (The concept ofKaizen, developedbyMasaaki Imai, encourages continuous improvement to a process or organizationby involving everyone in implementing
2 AT&T TECHNICALJOURNAL• JULY/AUGUST 1992

- -
1.00.80.60.4
Decreasing variabilityon the procJ(Jction line
Arrival rate + service rate (percent)
0.2o
FIgure 2. The average throughput time of a slngle-serverqueue as a function of how much of the system's capacity Isbeing used. For a given system capacity, the throughputtime depends on the degree of variability In the system.
tUpper specification
limit(a)
Targetvalue
Quality characteristic
The Taguchi loss function
tLower specification
limit
FIgure 1. Two views of how variability affects customersatisfaction. (a) The digital view (as discussed In Bhote), Inwhich the customer Is 100-percent satisfied no matter hownarrowly a parameter falls Inside the product specification.If a parameter falls outside, the customer will be 100percent dissatisfied. (b) The Taguchl view, In which customer satisfaction Is represented as a curve. At zero, the customer Is satisfied. As the parameter moves up the curve,customer satisfaction decreases.
incremental changesin every aspectofwork.)Initially, the basicpremise ofreducing variability
to improve quality wasapplied both to manufacturingoutputand processes. To ensurecustomersatisfaction,these concepts have been updated andextended to otherareasofoperations.
Customer satisfaction. Bhote' statesthat variabilityis evil andexcessvariability is the graveyard ofpoormanagement. Variation createscustomer dissatisfactionand, eventually, economic loss. Consider Figure la (from
Quality characteristictLower specification
limit
(b)
tUpper specification
limit
Bhote), which portrays the traditional view ofproductspecifications. Nomatterhow narrowly a parameter fallswithin a specification limit, the customer will be lOO percent satisfied; no matterhownarrowly a parameter fallsoutside a specification limit, the customer will be lOO percentdissatisfied. In reality, customer satisfaction cannotbe measured in digital form, but rather is reflected bythecurve shown in Figure lb, which represents the view ofTaguchi." According toTaguchi, customer dissatisfactionis at zerowhen a product parameter is at,or veryclose to, the targetvalue. It increases as the parametermoves away from the targetvalue toward oneendor theotherofthe specification limit. Taguchi maintains thatlossofcustomer satisfaction canbe measured in monetarytenns.
Acase studythat clearly shows the effect ofvariability on customer satisfaction wasdescribed byDonaldPeterson, the former chairman ofthe FordMotor Company.? Although both the Mazda Hiroshima, Japan, andFordBatavia, Ohio, plants manufactured transmissionsfrom the samedesign, the final products weredramatically different. TheJapanese transmission was well likedbycustomers, while the onemadein Ohio wasnot. Customerscomplained thatgears on the Fordtransmissionsshifted poorly. When Fordengineers tookthe two transmissions apart, theycould actually see a difference. The
AT&T TECHNICAL JOURNAL. JULY/AUGUST 1992 3

Figure 3. Assembly 70Intervals for circuitboards manufactured
60on the Denver Worksassembly line. • June 1986
ImproVed shop-floor ~ 50 • JUly 1987~ .. April 1988
procedures and~
material flow dramati- c: 400
cally lowered the ~~
manufacturing Inter- ~ 30val and Its associated Q.
variability. The Denver J 20Works now assem-bles most circuit 10boards In less thantwo days.
0
4 8 12 16 20 24Time (days)
28 32 36 ~40
partsused in the Mazda transmission wereexceptionallywell manufactured andfinished, andevery measurementfell within extremely closetolerances. Even thoughtheFordtransmissions met the specifications, muchmorevariability existed in partsdimensions from onetransmission to another. Thisvariability in partsdimensions,although within specification, ledto increased variabilityin the final product Whenthe final product wasassembled, the Fordtransmissions varied inperformance andhada lower level ofcustomersatisfaction.
nme. The review ofelementary queueing theorydescribed in References 8 and9 discusses the relationshipbetween variability andtime. Figure 2shows theaverage throughput timeofa single-server queue (suchas that associated with a single machine onthe factoryfloor) as a function ofhowmuchsystem capacity is beingused. This is measured as the ratio ofthe arrival rate ofentities to the rate at which the resource (or machine)canoperate. Fora given percentage ofsystemcapacity,the throughput timedepends on the degreeofvariabilityin the system. Infact, if variability wereremoved, thethroughput timewould equalthe service time, the timerequired to perform the designated task.Thiswould continueuntil the arrival rate exceeded the service rate (therate at which a customerneed is satisfied). Atthis point,a queuewould form andgrowwithout bounds. Thisbasic
4 AT&T TECHNICAL JOURNAL. JULY/AUGUST 1992
principle applies notonly to queuesand manufacturingoperations, but to anyprocess.
The ordinate ofFigure 2 is the average throughput time, or timeit takesto complete a process. Noticethat the throughput timeis notconstant, andthat systemvariability decreases in directproportion to the variabilityin throughput time. Consequently, to assess the performance ofa process, wemustmeasure both the throughput timeanditsvariability.
There are two sourcesofvariability: the arrivalrateofentities andthe service rate. Onthe manufacturingfloor, the arrival rate at a given workstation may fluctuateformany reasons, suchas unpredictable arrival rateofcustomer orders,unsynchronized arrival rateofwork orquality deficiencies from preceding operations, or equipmentfailures. Similarly, the service rate may be affectedbyequipment problems, variable setuptimes, lackofclearinstructions to the machine operators, quality problems atthe workstation, a lackofoperator skills, etc.Even if equipmentis beingusedat an economically desirable capacity,suchas 80percent (seeFigure 2), small decreases intheservice rate (which use a higher level ofthe system's capacity) leadto a largeincrease in throughput time, or manufacturing intervals. Furthermore, increasing the variabilityofeither the arrival rate or the service rate also leadsto alargeincrease in throughput time.
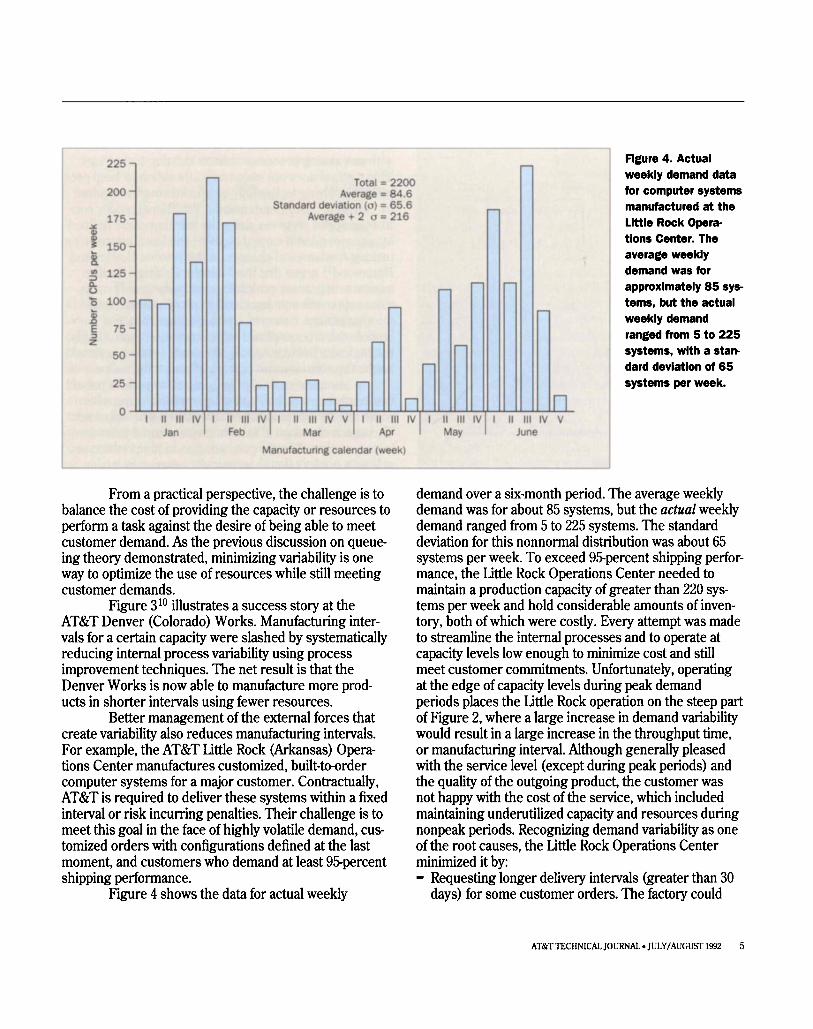
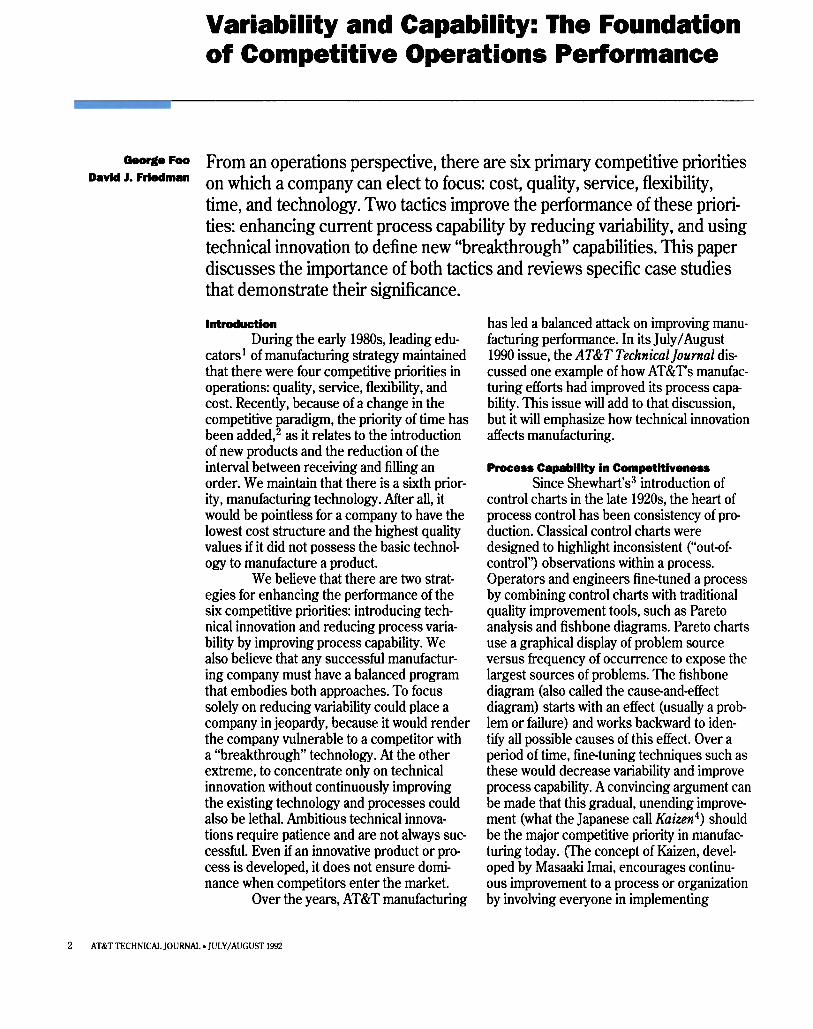
Figure 4. Actualweekly demand datafor computer systemsmanufactured at theLittle Rock Operations Center. Theaverage weeklydemand was forapproximately 85 systems, but the actualweekly demandranged from 5 to 225systems, with a standard deviation of 65systems per week.
y
- ,.....,.....
Total =2200- Average=84.6
,..... Standard deviation (0) =65.6 ,.....- ,..... Average + 2 0 =216
--
- - ,.....,.....-,..... - - ,.....
- -- -
- --
Innnnn~n In nI II III IV I II III IV I II III IV V I II III IV I II III IV I II III IV V
Jan Feb Mar A r Ma June
225
200
175~
I 150..8-fI) 125;:)0.o'0 100
BE 75~z
50
25
0
p
Manufacturing calendar (week)
Froma practical perspective, the challenge is tobalance the cost ofproviding the capacity or resourcestoperform a task against the desireofbeingable to meetcustomerdemand. Asthe previous discussion on queueingtheorydemonstrated, minimizing variability is oneway to optimize the use ofresourceswhile still meetingcustomerdemands.
Figure310 illustrates a successstoryat theAT&T Denver (Colorado) Works. Manufacturing intervalsfora certain capacity wereslashedby systematicallyreducing internal processvariability usingprocessimprovement techniques. The net result is that theDenver Worksis now able to manufacture more products in shorter intervals usingfewer resources.
Bettermanagement ofthe external forces thatcreatevariability alsoreducesmanufacturing intervals.Forexample, the AT&T little Rock (Arkansas) OperationsCentermanufactures customized, built-to-ordercomputer systemsfora major customer. Contractually,AT&T is requiredto deliver these systemswithin a fixedinterval or risk incurring penalties. Their challenge is tomeet this goalin the face ofhighly volatile demand, customized orders with configurations defined at the lastmoment, and customers whodemand at least95-percentshipping performance.
Figure4 shows the dataforactual weekly
demand overa six-month period. The average weeklydemand wasforabout85systems, but the actual weeklydemand rangedfrom 5 to 225 systems. The standarddeviation for this nonnormal distribution wasabout65systems per week. To exceed95·percent shipping performance, the little Rock Operations Centerneeded tomaintain a production capacity ofgreater than 220 systemsper weekandholdconsiderable amounts ofinventory, both ofwhich werecostly. Every attempt was madeto streamline the internal processesand to operate atcapacity levels low enoughto minimize costand stillmeetcustomercommitments. Unfortunately, operatingat the edge ofcapacity levels duringpeakdemandperiods places the little Rock operation on the steeppartofFigure2,wherea largeincrease in demand variabilitywould result in a large increase in the throughput time,or manufacturing interval. Although generally pleasedwith the service level (except duringpeakperiods) andthe quality ofthe outgoing product, the customer wasnothappy with the costofthe service, which includedmaintaining underutilized capacity and resourcesduringnonpeak periods. Recognizing demand variability as oneofthe rootcauses,the little Rock Operations Centerminimized it by:- Requesting longerdelivery intervals (greaterthan30
days) for somecustomerorders.The factory could
AT&TTECHNICALJOURNAL.JULY/AUGUSfl992 5
Technological Innoy.lon .1Id Competltly......Unfortunately, reduction ofvariability only
addressesthe narrow set ofquality issuesassociated
Figure 5. A typical distribution of somequalityparameterovera givenperiod of time before and after Kalzen wasapplied to the process. Surface-mount circuit-board assemblieswere visually Inspected. The lower bound (point A)remained fixed In value because of physical limits. As themean Inspection time approached pointA, It becameIncreasingly difficultto Improve the process.
with an existing processwithin an existing technology.This method doesnotencourage innovation to keeppacewith an evolving technology or breakthroughs requiredbychanging customer demands. Traditional quality controlcanspeedprogressalong the learning curve definedbya process, but it cannot redefine the learning curve bymaking fundamental changesin the system. Bowles andHammond" arguethat the Malcolm Baldrige Qualityassessment processevaluates a company mainly on itscloseness to the customer andon programs that minimize variability. However, the assessment processignores the process oftechnical innovation. Accordingly,the Malcolm Baldrige quality assessment process shouldnot be the solemeasure ofworld-class performance.
Another method ofassigning competitive prioritiesemphasizes technological innovations, usingwhatsomecall the "giant leap," or "breakthrough," approach.Through technological innovations, a company candominate a marketsharebyproducing a unique product, orat leasta product that is technically superior in quality orperformance. Ifa company uses only variability reductionto lower defect levels andfails to introduce innovations ina manufacturing process, the processwill encounter"sticking points," or quality thresholds. When thesethresholds are reached, procedures that had previouslymaintained the currentquality level can nolongerimprove the processsignificantly. Atthis point, only afundamental changeto the system (eitherin technologyor methodology) will keepit from remaining stalled. Thisfundamental changeredefines the factory's learningcurve, establishing a newlearning curve andpropellingthe factory toward a new, improved quality, or performance, threshold.
Figure 5 illustrates typical distribution ofa qualityparameter overa given period oftime. Forthis discussion, assume that Figure 5 presentsdatadrawn from asurface-mount circuit-board assembly shop. The qualitymetric is the timeit takestovisually inspect a printedwiring board afterthe soldering process. Overtime,applying Kaizen reducesthe variability ofthe process, asFigure 5 shows. The reduction invariability is not symmetric; the variability is decreased byeliminating thelonginspection times. The lower bound (designated byA) remains fixed invalue byphysical limits. Nomatterhow muchthe inspection operator tries, it is impossibleto manipulate the microscope morequickly thanA As aresult, Kaizen tendsto decrease variability asymmetrically, leading to a decrease inmeaninspection time.
- Original process- - - After Kalzen
Inspection time (minutes)
,\, \, \I II II II II II \I \I \I,I
A
then adjust order schedules to equalize production levels andminimize variability.
- Working with the customerto minimize the peakperiod byleveling the demand. This reduced demandvolatility and allowed manufacturing to cut the productioncapacity (which, in tum, cut the cost) but stillmaintain highshipping performance.
- Adding other products to the production line. Thesehelpto buffer peaksandvalleys in the productionschedule andspreadthe costofoperating the production line.
- Asking the salesforce to encourage customers toorder standard configurations, which take less timetomake andwhich minimize inventory.
6 AT&T TECHNICALJOURNAL. JULY/AUGUST 1992
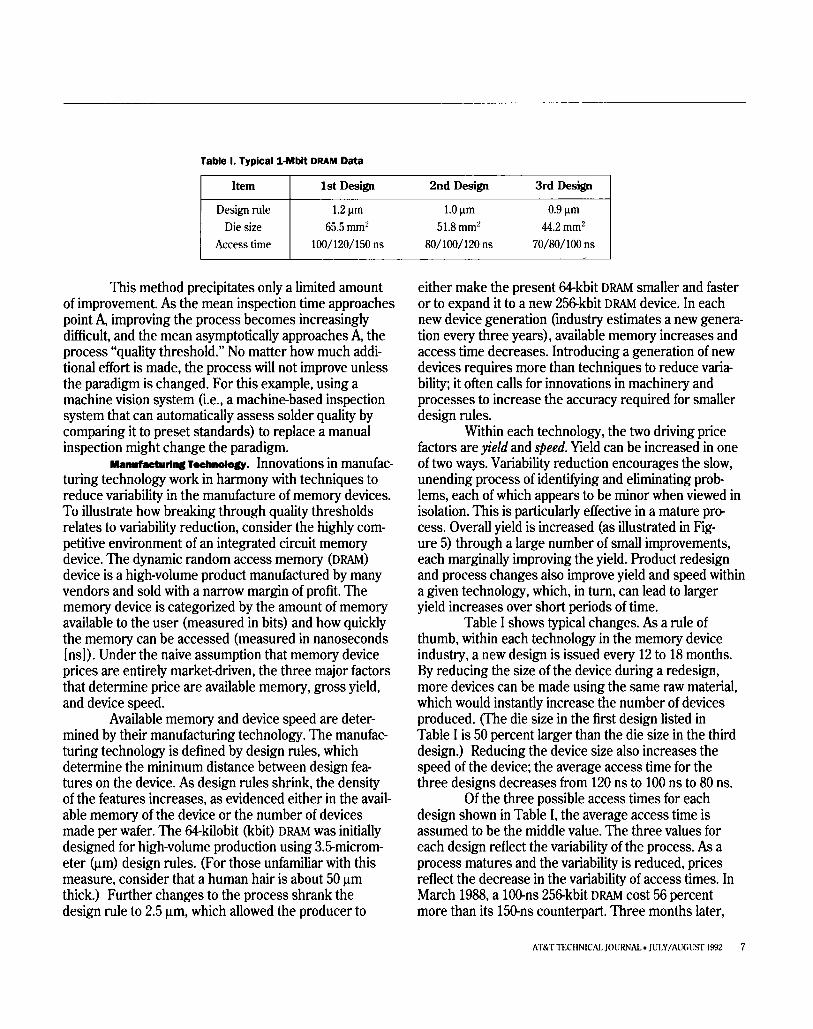
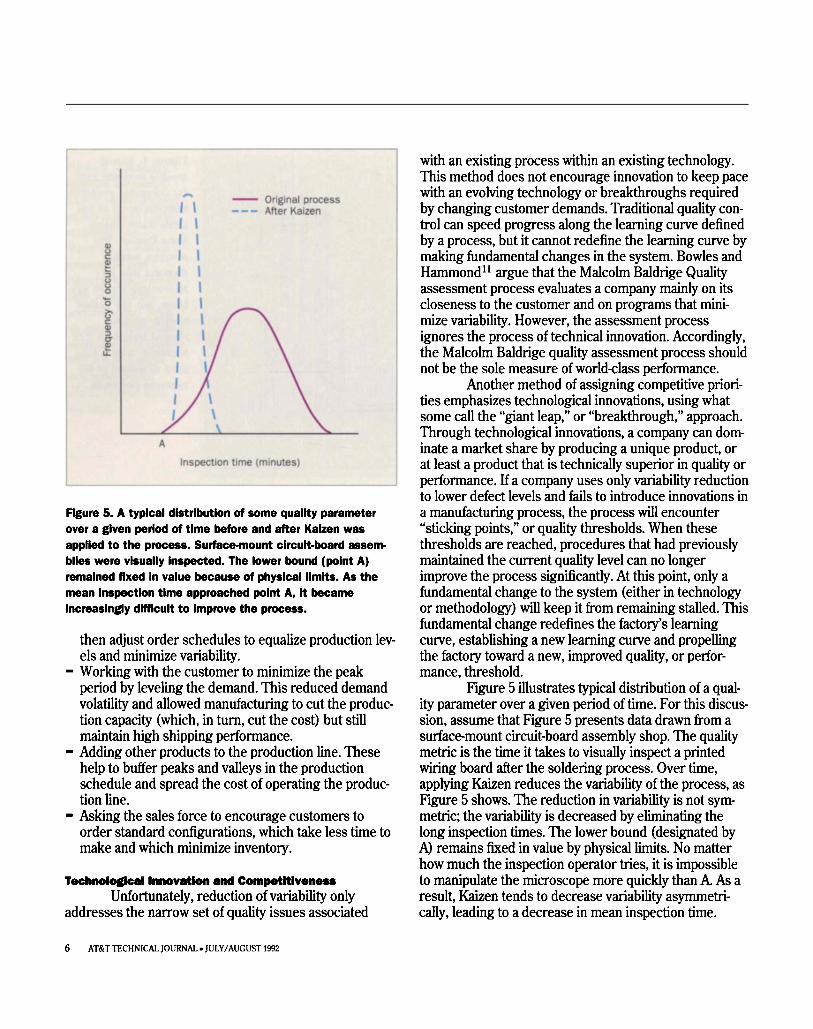
Table I. Typlcal1-Mblt DRAM Data
Item 1st Design 2nd Design 3rd Design
Designrule 1.2l!m 1.0l!m O.9l!mDiesize 65.5mm2 51.8mm2 44.2mm2
Access time 100/120/150 ns 80/100/120ns 70/80/100ns
This method precipitates only a limited amountofimprovement. Asthe meaninspection timeapproachespoint A, improving the processbecomes increasinglydifficult, and the meanasymptotically approaches A, theprocess"quality threshold." No matterhow muchadditional effort is made, the processwill not improve unlessthe paradigm is changed. For this example, usingamachine vision system (Le., a machine-based inspectionsystem that canautomatically assess solderquality bycomparing it to preset standards) to replace a manualinspection mightchangethe paradigm.
Manufacturing Technology. Innovations in manufacturingtechnology workin harmony with techniques toreducevariability in the manufacture ofmemory devices.To illustrate howbreaking throughquality thresholdsrelatesto variability reduction, considerthe highly competitive environment ofan integrated circuit memorydevice. The dynamic random accessmemory (DRAM)device is a high-volume productmanufactured by manyvendors and soldwith a narrow margin ofprofit. Thememory device is categorized by the amount ofmemoryavailable to the user (measured in bits) andhowquicklythe memory canbe accessed (measured in nanoseconds[ns]).Underthe naive assumption that memory devicepricesare entirely market-driven, the three major factorsthat determine priceare available memory, gross yield,and device speed.
Available memory and device speedare determined by their manufacturing technology. The manufacturingtechnology is defined bydesignrules,whichdetermine the minimum distance between designfeatures on the device. Asdesignrulesshrink,the densityofthe features increases, as evidenced either in the availablememory ofthe device or the numberofdevicesmadeper wafer. The 64-kilobit (kbit) DRAM wasinitiallydesigned forhigh-volume production using3.5-micrometer {J.Lm) design rules. (Forthose unfamiliar with thismeasure, considerthat a humanhair is about50urnthick.) Further changes to the processshrank thedesign rule to 2.5 urn, which allowed the producer to
either makethe present64-kbit DRAM smaller andfasteror to expand it to a new256-kbit DRAM device. In eachnewdevice generation (industry estimates a new generationevery three years),available memory increases andaccesstimedecreases. Introducing a generation ofnewdevices requiresmorethan techniques to reducevariability; it often calls forinnovations in machinery andprocessesto increase the accuracy required forsmallerdesign rules.
Within eachtechnology, the two driving pricefactors areyield andspeed. Yield canbe increased inoneoftwo ways. Variability reduction encourages the slow,unending processofidentifying andeliminating problems, eachofwhich appears to be minor whenviewed inisolation. This is particularly effective ina mature process. Overall yield is increased (as illustrated in Fig-ure 5) througha largenumberofsmall improvements,each marginally improving the yield. Product redesignand processchangesalso improve yield and speedwithina given technology, which, in turn,can leadto largeryield increases overshort periods oftime.
TableI shows typical changes. Asa ruleofthumb, within eachtechnology in the memory deviceindustry, a newdesign is issuedevery 12to 18months.By reducing the sizeofthe device duringa redesign,moredevices canbe madeusingthe sameraw material,which would instantly increase the numberofdevicesproduced. (The diesizein the first design listed inTableI is 50percentlargerthan the die sizein the thirddesign.) Reducing the device sizealso increases thespeedofthe device; the average accesstime forthethree designsdecreasesfrom 120 ns to 100 ns to 80ns.
Ofthe three possible accesstimesforeachdesign shown inTableI, the average accesstime isassumed to be the middle value. The three values foreach design reflect the variability ofthe process. Asaprocess maturesand the variability is reduced, pricesreflect the decreasein the variability ofaccesstimes. InMarch 1988, a 1ao-ns 256-kbit DRAM cost 56percentmorethan its 15O-ns counterpart. Three months later,
AT&TTECHNICAL JOURNAL • JULY/AUGUST 1992 7
DRAM price trends
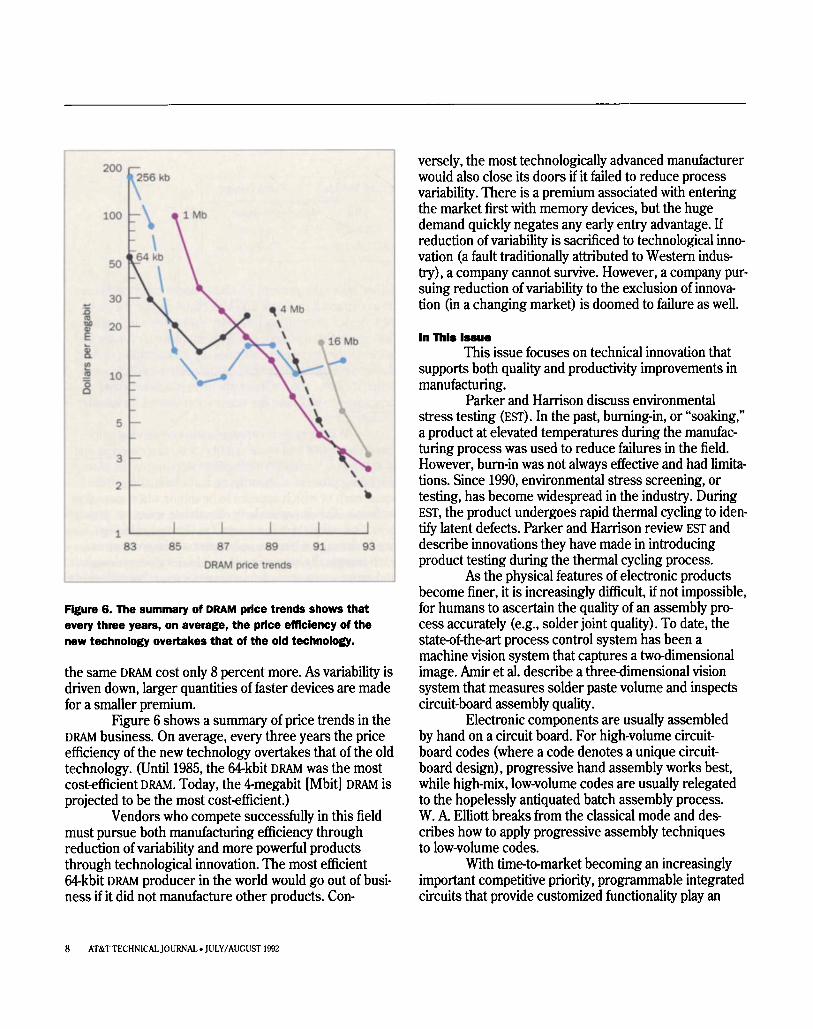
versely, the mosttechnologically advanced manufacturerwould alsocloseits doors if it failed to reduce processvariability. There is a premium associated with enteringthe marketfirstwith memory devices, but the hugedemand quickly negatesanyearly entryadvantage. Ifreduction ofvariability is sacrificed to technological innovation (afault traditionally attributed to Western industry),a company cannotsurvive. However, a company pursuingreduction ofvariability to the exclusion ofinnovation (in a changing market) is doomed to failure as well.
In ThI.I.....This issuefocuses on technical innovation that
supports bothquality and productivity improvements inmanufacturing.
ParkerandHarrison discussenvironmentalstress testing (ssr), In the past,burning-in, or "soaking,"a product at elevated temperatures duringthe manufacturingprocesswasused to reducefailures in the field.However, bum-in wasnotalways effective andhad limitations. Since 1990, environmental stress screening, ortesting, has become widespread in the industry. DuringESf, the productundergoes rapid thermal cycling to identifylatentdefects. ParkerandHarrison review ssr anddescribe innovations theyhave madein introducingproduct testingduringthe thermal cycling process.
Asthe physical features ofelectronic productsbecome finer, it is increasingly difficult, if not impossible,forhumansto ascertain the quality ofan assembly process accurately (e.g., solderjointquality). To date, thestate-of-the-art processcontrol systemhas been amachine vision systemthat capturesa two-dimensionalimage. Amir et al. describe a three-dimensional visionsystemthat measuressolderpastevolume and inspectscircuit-board assembly quality.
Electronic components are usually assembledby handon a circuit board. For high-volume circuitboardcodes (where a codedenotesa unique circuitboarddesign), progressive handassembly works best,while high-mix, low-volume codesare usually relegatedto the hopelessly antiquated batchassembly process.W. A Elliott breaksfrom the classical modeand describeshowto apply progressive assembly techniquesto low-volume codes.
With time-to-market becoming an increasinglyimportant competitive priority, programmable integratedcircuits that provide customized functionality play an
9391898785
1 ......_ .........__.........__........._-........__...1
83
200
100
50
30:t::.ciL 20E...8-e?tIS 108
5
3
2
Figure 6. The summary of DRAM price trends shows thatevery three years, on average, the price efficiency of thenew technology overtakes that of the old technology.
the same DRAM cost only 8 percentmore. Asvariability isdriven down, largerquantities offasterdevices are madefora smaller premium.
Figure 6 showsa summary ofpricetrends in theDRAM business. Onaverage, everythree years the priceefficiency ofthe newtechnology overtakes that ofthe oldtechnology. (Until 1985, the 64-kbit DRAM wasthe mostcost-efficient DRAM. Today, the 4-megabit [Mbit] DRAM isprojected to be the mostcost-efficient.)
Vendors whocompete successfully in this fieldmustpursueboth manufacturing efficiency throughreduction ofvariability and more powerful productsthroughtechnological innovation. The mostefficient64-kbit DRAM producerin the world would go out ofbusiness if it didnot manufacture other products. Con-
8 AT&TTECHNICALJOURNAL • JULY/AUGUST 1992
expanding role. Unfortunately, largenumbersofcontinually changing programmable logic devices createa logistical manufacturing nightmare. C.G. Bess,W. W. Jones,andE. E. Lewis designed and developed a highly flexibleprogrammable logic device programming and placementmachine.
Although cablemanufacture is not a glamorousaspectofelectronics manufacturing, it is critical to themanufacturing process. C. R Anderson, A R Brown, andG. G. Semensdescribehowthey automated the productionofcablesto improve quality and reducecost.
Small increasesin service rate canleadto largedecreasesin throughputtime. B. 1. Farrell et al. discussa newapproach to monitoring service effectiveness inanintegrated circuit manufacturing environment, withexamples that showits effect on service time.
Finally, B. D.Tull, Jr., describesthe introductionofa modem, three-dimensional, solids modelingcomputer-aided design/computer-aided manufacturing(CAD/CAM) systemthat slashes the timeandcost it takesto manufacture plastic parts.
SummaryFroman operations perspective, cost,quality,
service, flexibility, time, and technology are the keycompetitive priorities. For a manufacturing concerntoimprove these metrics, it mustcontinually strive toimprove its operational processcapabilities and to introducetechnological innovation. To achieve onewithoutthe other will yield, at best, short-term gainswithout sustaining world-elass performance.
References1. R H.Hayes andS.C.Wheelwright, Restoring OurCompetitive
Edge, Competing Through Manufacturing, JohnWiley andSons,New York, 1984.
2. G.Stalk, Ir., andT. M.Hount, Competing Against Time, How TimeBased Competition isReshaping Global Markets, The FreePress,New York, 1990.
3. W.A Shewhart, Economic Control ofQuality ofManufacturingProcesses, D.Van Nostrand, New York, 1931.
4. M.Imai, KAlZEN, The Key tojapan's Competitive Success, Random
House, New York, 1986.5. K R Bhote, World Class Quality, Design ofExperiments Made
Easier, More Cost Effective than SPC, American Management Association, New York, 1988.
6. G.Taguchi, System forExperimental Design: Engineering Methods toOptimize Quality andMinimize Cost, UNIPUB/Krause International Publications, New York, 1987.
7. D.E. Peterson, 'The TeamThat Made Carmaking Magic," WorldMonitor, Vol. 4,No. 10, October 1991, pp.42-47.
8. D.C.Krupka, "Time as a Primary System Metric," Symposium onFoundations ofWorld Class Manufacturing Systems, Washington,D.C., June 19, 1991, National Academy ofSciences.
9. W.Whitt, 'The Queueing Network Analyzer," Bell System Technicaljournal, Vol. 62, No.9,pp.2779-2815.
10. ]. D.Carboy, et al., "Striving forManufacturing Excellence at theDenver Works: ASummary," AT&TTechnicaljournal, Vol. 69, No.4,July/August 1990, pp.5-18.
11. ]. Bowles and]. Hammond, "Being 'Baldrige-Eligible' Isn'tEnough,"The New York Times, Section 3,page13, September 22, 1991.
(Manuscript received December 23, 1991)
George Foo is the director of Manufacturing and Engineeringin the Communications Products Sourcing and ManufacturingDivision of AT&T at the Little Rock (Arkansas) OperationsCenter. He is responsible for the manufacture and engineering of communications products at the Little Rock OperationsCenter. Mr. Foo received a B.S. in metallurgical engineeringfrom New York Polytechnic Institute, Brooklyn; an M.B.A. infinance from New York University, New York; and a Ph.D. inmaterials engineering from the Massachusetts Institute ofTechnology, Cambridge. He joined AT&T in 1977.DavidJ. Friedman is a member of technical staff in the Manufacturing Systems Engineering Department at AT&T BellLaboratories, Murray Hill, New Jersey. He works on applications of statistical process control and experimental design inmanufacturing, especially of integrated circuits. Mr. Friedmanjoined AT&T in 1986, after receiving a B.E.S. in engineeringscience from Johns Hopkins University, Baltimore, Maryland,and an M.S. in operations research and a Ph.D. in industrialand systems engineering from the Georgia Institute of Technology, Atlanta.
AT&T TECHNICAL JOURNAL. JULY/AUGUST 1992 9