varadhan, krishna kumar (2015) the mechanistic basis of...
TRANSCRIPT

Varadhan, Krishna Kumar (2015) The mechanistic basis of metabolic response to surgery and postoperative insulin resistance in patients having abdominal surgery. PhD thesis, University of Nottingham.
Access from the University of Nottingham repository: http://eprints.nottingham.ac.uk/29095/2/K_Varadhan_Thesis_Final_April2015.pdf
Copyright and reuse:
The Nottingham ePrints service makes this work by researchers of the University of Nottingham available open access under the following conditions.
This article is made available under the University of Nottingham End User licence and may be reused according to the conditions of the licence. For more details see: http://eprints.nottingham.ac.uk/end_user_agreement.pdf
For more information, please contact [email protected]
The mechanistic basis of metabolic response to
surgery and postoperative insulin resistance in
patients having abdominal surgery
Krishna K. Varadhan, M.B.B.S, M.R.C.S, MSc
Thesis submitted to The University of Nottingham for
the Degree of Doctor of Philosophy
April 2015
2
Abstract Postoperative insulin resistance (POIR) is a hallmark feature in patients having major
abdominal surgery. Surgical stress may induce changes in metabolic pathways that perturb
glucose homeostasis, resulting in stress hyperglycaemia. The studies described in the
present thesis set out to examine the evidence behind (1) the ‘Enhanced Recovery After
Surgery’ pathway (2) preoperative carbohydrate drinks, in attenuating the surgical stress
response and (3) to investigate the mechanistic basis of metabolic response to surgery and
the development of postoperative insulin resistance in patients having major abdominal
surgery.
Meta-analysis of randomised studies in patients having major abdominal surgery showed
that ERAS pathway was associated with a significant reduction in length of hospital stay
and postoperative complications. Meta-analysis of randomised studies using preoperative
CHO was also associated with reduced length of stay and decreased POIR in support of
reduced fasting times and preoperative carbohydrate drinks (CHO), before surgery.
The study in patients having major abdominal surgery showed that surgical trauma was
associated with increased skeletal muscle interleukin-6 and pyruvate dehydrogenase
kinase isoform-4 (PDK4) mRNA and protein expression. Increased PDK4 was associated
with a concomitant reduction in pyruvate dehydrogenase complex (PDC) activity that
controls the rate of muscle carbohydrate oxidation in mitochondria, and contributed to
impaired glucose tolerance and decreased mitochondrial ATP production postoperatively.
One hypothesis is that by maximising the contribution of carbohydrate derived oxidative
ATP regeneration by activating the PDC with the synthetic PDK4 inhibitor dichloroacetate
(DCA) and/or by increasing muscle glucose uptake using preoperative oral carbohydrates
(CHO) may reverse the changes in carbohydrate oxidation seen postoperatively. The results
from the study showed that administration of either CHO or CHO with DCA attenuates the
impairment of CHO oxidation and the development of POIR, induced by surgical stress.
Furthermore, DCA increased mitochondrial CHO oxidation above that achieved by CHO
alone, which waned by 48 hours after surgery.

3
Declaration
I declare that this dissertation is my own work and is based on research in the Division of
Gastrointestinal Surgery and the School of Biomedical Sciences, University of Nottingham
from March 2010 to March 2013.
I confirm that the conception of idea, literature search, data collection and interpretation,
statistics and writing of the manuscript for the meta-analyses were performed by me. The
data collection work was performed along with my co-authors, Mr. Sherif Awad and
Professor Dileep Lobo. The manuscripts were proof-read by Professor Dileep Lobo before
publication in the format, as presented in this thesis.
I confirm that the procedures presented within the thesis in chapters 5 and 6, have been
undertaken by me with the following exceptions
The metabolic assays (Insulin, cortisol, glycogen) and plasma cytokines and gene
expressions in chapter 6 were done by Dr. Dumitru Constantin-Teodosiu. Analysis for the
mitochondrial ATP production rates were performed by Dr. Dumitru Constantin-Teodosiu
and Ryan Atkins. Dr. Despina Constantin performed the western blotting described in
chapters 5 and 6. Ms. Elaine Blackshaw performed the gut permeability test in chapter 5.

4
Acknowledgements
The work presented in this thesis would not have been possible without the support
and guidance from a number of individuals, to whom I express my sincere gratitude
and thanks.
To my supervisor and mentor, Professor Dileep N. Lobo for the privilege and
opportunity to work under his expert guidance. He has always been a great source of
inspiration and support throughout my time in Nottingham and to whom I deeply
indebted
To my supervisor Professor Paul L. Greenhaff, for his guidance and support,
throughout my research and for providing invaluable critical appraisal of my studies
To Professor John Atherton, Professor Robin Spiller and Professor Guru Aithal, at the
Nottingham Digestive Diseases Centre NIHR Biomedical Research Unit for supporting
my research
Special thanks Dr. Dumitru Constantin-Teodosiu and Dr. Despina Constantin for
always being available and seeing this research project to fruition
To Professor John Scholefield, for having the belief in me and supporting me in all my
endeavours
To the research team, Tracey Goldsmith, Elaine Simpson, Melanie Lingaya, Denise
Sinclair, Kate Shepherd, Val Heath and Tiffany Hamilton for their time and support in
my studies

5
To Professor Brian J Rowlands, for his support and providing me the opportunity for
research
To the hospital staff and research participants without whom this research would
not have been possible
To my sponsors, Nottingham Digestive Diseases Centre NIHR Biomedical Research
Unit, Enhanced Recovery After Surgery Society, European Society for Clinical
Nutrition and Metabolism, Dunhill Trust, and Nottingham University Hospitals
Charities
Finally to my parents and my loving family,
for their encouragement, sacrifice and everlasting faith in me.

6
Table of contents
Abstract .............................................................................................................. 2
Declaration ........................................................................................................... 3
Acknowledgements ................................................................................................. 4
Table of contents .................................................................................................... 6
Publications ........................................................................................................ 11
Published Abstracts ............................................................................................... 12
Presentations ...................................................................................................... 13
List of Abbreviations............................................................................................... 14
Chapter 1 ........................................................................................................... 16
General Introduction .............................................................................................. 16
1.1 Enhanced Recovery After Surgery (ERAS) ................................................................................ 20
1.2. Components of ERAS .............................................................................................................. 22
1.2 Postoperative insulin resistance .............................................................................................. 29
1.3. Metabolic response to Surgery ............................................................................................... 32
1.3.1 Metabolic response: Evolution of concept ........................................................................... 32
1.3.2 The ebb and flow phase of metabolic response ................................................................... 34
1.4. Postoperative insulin resistance (POIR) .................................................................................. 39
1.4.1 Role of cytokines ................................................................................................................... 43
1.4.2 Role of preoperative fasting in surgical patients .................................................................. 46
1.5.1 PI3K/Akt1/FOXO signalling pathway ..................................................................................... 48
1.5.2 Role of Pyruvate Dehydrogenase Complex and Pyruvate dehydrogenase kinase in POIR ... 55
1.5.3 Role of Mitochondria ............................................................................................................ 57
1.6 Hypothesis ................................................................................................................................ 58
1.7 Aims .......................................................................................................................................... 61
Chapter 2 ........................................................................................................... 62
Analytical Methods ................................................................................................ 62

7
2.1 Human Volunteers ................................................................................................................... 63
2.2 Blood sampling and analysis .................................................................................................... 63
2.2.1 Blood glucose ........................................................................................................................ 64
2.2.2 Plasma Insulin ....................................................................................................................... 64
2.2.3 Plasma Free Fatty Acid .......................................................................................................... 66
2.2.4 Plasma Cortisol ...................................................................................................................... 67
2.2.5 Plasma cytokines ................................................................................................................... 69
2.3 51Cr-EDTA gut permeability test ............................................................................................... 69
2.4 Muscle Sampling ...................................................................................................................... 70
2.5 Muscle mRNA and protein analysis ......................................................................................... 70
2.5.1 Real-time quantitative polymerase chain reaction (PCR) ..................................................... 70
2.5.2 Muscle total RNA isolation .................................................................................................... 74
2.5.3 cDNA synthesis (reverse transcription) ................................................................................. 75
2.5.5 Taqman analysis .................................................................................................................... 78
2.6 Western blotting ...................................................................................................................... 79
2.6.1 Overview of Western blotting protocol ................................................................................ 79
2.6.2 Extraction of muscle proteins ............................................................................................... 80
2.6.3 SDS-PAGE, transfer and Western blotting ............................................................................ 81
2.7 Analysis of Muscle Glycogen .................................................................................................... 82
2.7.1 Extraction procedure for measurement of muscle glycogen ............................................... 82
2.7.2 Measurement of muscle glycogen content using spectrophotometery .............................. 83
2.8 Isolation and Suspension of Mitochondria from Muscle Tissue .............................................. 85
2.8.1 Overview ............................................................................................................................... 85
2.8.2 Laboratory Protocol .............................................................................................................. 85
2.9 Mitochondrial ATP production Rate Analysis (MAPR Analysis) ............................................... 86
2.9.1 Overview ............................................................................................................................... 86
2.9.2 Laboratory Protocol .............................................................................................................. 88

8
2.9.3 Substrates for ATP Production .............................................................................................. 88
Pyruvate/Malate ............................................................................................................................ 89
Glutamate/succinate ..................................................................................................................... 89
2.9.3 Pyruvate dehydrogenase Complex assay .............................................................................. 91
Chapter 3 ........................................................................................................... 92
The enhanced recovery after surgery (ERAS) pathway for patients undergoing major elective open
colorectal surgery: A meta-analysis of randomized controlled trials ........................................... 92
3.1 Introduction ............................................................................................................................. 93
3.2 Methods ................................................................................................................................... 95
3.2.1 Criteria for considering studies for this review ..................................................................... 95
3.2.2 Outcome measures ............................................................................................................... 95
3.2.3 Search methods for identification of studies ........................................................................ 96
3.2.4 Data collection and analysis .................................................................................................. 96
3.2.5 Data extraction...................................................................................................................... 97
3.2.6 Statistical analysis ................................................................................................................. 97
3.3 Results ...................................................................................................................................... 98
3.3.1 Eligible Studies ...................................................................................................................... 98
3.3.2 Meta-analysis of RCTs ......................................................................................................... 109
3.4 Discussion ............................................................................................................................... 112
Chapter 4 ......................................................................................................... 117
A meta-analysis of randomised controlled trials on preoperative oral carbohydrate treatment in elective
surgery ........................................................................................................... 117
4.1 Introduction ........................................................................................................................... 118
4.2 Materials and Methods .......................................................................................................... 119
4.2.1 Eligibility .............................................................................................................................. 119
4.2.3 Data collection .................................................................................................................... 121
4.2.4 Assessment of quality and risk of bias of included studies ................................................. 122
4.2.5 Statistical analysis ............................................................................................................... 123

9
4.3 Results .................................................................................................................................... 123
4.3.1 Eligible studies..................................................................................................................... 123
4.3.2 Characteristics of included studies ..................................................................................... 128
4.3.4 Patient characteristics ......................................................................................................... 130
4.3.5: Length of hospital stay ....................................................................................................... 137
4.3.6 Insulin resistance................................................................................................................. 140
4.3.7 Pulmonary and surgical complications ............................................................................... 144
4.3.7 Postoperative nausea and vomiting ................................................................................... 145
4.4 Discussion ............................................................................................................................... 146
Chapter 5 ......................................................................................................... 154
The mechanistic basis of metabolic response to surgery and the development of postoperative insulin
resistance in patients having major abdominal surgery ....................................................... 154
5.1 Background & Aims ................................................................................................................ 155
5.2 Methods ................................................................................................................................. 158
5.2.1 Experimental design and sample collection ....................................................................... 158
5.2.2 Statistics .............................................................................................................................. 160
5.3 Results .................................................................................................................................... 160
5.4 Discussion ............................................................................................................................... 174
Chapter 6 ......................................................................................................... 182
Randomised control trial of Preoperative carbohydrate and Dichloroacetate on skeletal muscle insulin
resistance following major abdominal surgery ................................................................ 182
6.1 Introduction ........................................................................................................................... 183
6.1.1 Preoperative carbohydrate treatment (CHO) ..................................................................... 183
6.1.2 Dichloroacetate ................................................................................................................... 185
6.2 Hypothesis and aims .............................................................................................................. 186
6.3. Methods ................................................................................................................................ 187
6.3.1 Study design and ethics ...................................................................................................... 187
6.3.2 Inclusion criteria & Exclusion criteria .................................................................................. 188

10
6.3.3 Preoperative Interventions ................................................................................................. 188
6.3.4 Blood tests .......................................................................................................................... 190
6.3.5 Muscle biopsy ..................................................................................................................... 190
6.3.6 Primary endpoint ................................................................................................................ 191
6.3.7 Secondary endpoints .......................................................................................................... 191
6.3.8 Sample size justification ...................................................................................................... 191
6.4 Results .................................................................................................................................... 192
6.4.1 Gene expression in Rectus Abdominis and Vastus Lateralis Muscle .................................. 192
6.4.2 Metabolic assays ................................................................................................................. 196
6.5 Discussion ............................................................................................................................... 202
Chapter 7 ......................................................................................................... 206
General discussion .............................................................................................. 206
7.1 Research objectives & Aims ................................................................................................... 207
7.2 Study outcomes ..................................................................................................................... 208
7.3 Future work and limitations ................................................................................................... 216
References ....................................................................................................... 219
Chapter 8 ......................................................................................................... 247
Appendix ......................................................................................................... 247
8.1 MAPR analysis (Mitochondrial ATP Production Rate)............................................................ 248
8.2 Muscle Acetyl CoA Analysis .................................................................................................... 250
8.3 Glycogen Assay....................................................................................................................... 252
8.4 Lactate assay .......................................................................................................................... 255

11
Publications
1. A meta-analysis of randomised controlled trials on preoperative oral carbohydrate
treatment in elective surgery. Awad S*, Varadhan KK*, Ljungqvist O, Lobo DN. Clinical
Nutrition. 2013 Feb; 32(1):34-44. (*Joint first authors).
2. Enhanced recovery after gastrointestinal surgery. Mitchell WK, Varadhan KK, Lobo DN,
Ljungqvist O. Book chapter in ‘Contentious issues in surgical gastroenterology’, 2011.
Edited by Huug Obertop and Samiran Nundy.
3. The enhanced recovery after surgery (ERAS) pathway for patients undergoing major
elective open colorectal surgery: A meta-analysis of randomized controlled trials.
Varadhan KK, Neal KR, Dejong CHC, Fearon KCH, Ljungqvist O, Lobo DN. Clinical Nutrition.
2010 Aug; 29(4):434-40. Epub 2010 Jan 29
4. Enhanced recovery after surgery: the future of improving surgical care. Varadhan KK,
Lobo DN, Ljungqvist O. Critical Care Clinics. 2010 Jul; 26(3):527-47.

12
Published Abstracts
1. Surgical Stress Increases Muscle PDK4 mRNA Expression and Impairs Muscle PDC
Activity, and May Underlie Postoperative Muscle Insulin Resistance. Varadhan KK, Atkins
RP, Constantin-Teodosiu D, Perkins AC, Greenhaff PL, Lobo DN. British Journal of Surgery,
2012; 99 (Suppl 4)
2. Preoperative carbohydrates in elective surgery. Awad S, Varadhan KK, Ljungqvist O,
Lobo DN. British Journal of Surgery, 2012; 99 (Suppl 4):43.
3. Gastrointestinal surgery mediated increases in gut permeability and expression of IL-6
and PDK4 mRNAs in quadriceps muscle may underpin the post-operative increase in
whole-body insulin resistance in humans. Varadhan KK, Atkins RP, Constantin-Teodosiu D,
Perkins AC, Greenhaff PL, Lobo DN. Journal of American College of Surgeons, Vol 213, (3),
Supplement, September 2011, Pages S53.
4. Rates of skeletal muscle mitochondrial ATP production are reduced during elective
abdominal surgery in humans. Atkins RP, Varadhan KK, Constantin-Teodosiu D, Perkins AC,
Greenhaff PL, Lobo DN. Journal of American College of Surgeons, Vol 213, (3), Supplement,
September 2011, Pages S59.

13
Presentations
1. Surgery mediated increase in circulating free fatty acids may be associated with
inhibition of muscle glucose metabolism and the development of postoperative
hyperglycemia. Poster presentation, Surgical congress, ESPEN, Barcelona, September
2012.
2. Gastrointestinal surgery mediated increases in gut permeability and expression of IL-6
and PDK4 mRNAs in quadriceps muscle may underpin the post-operative increase in
whole-body insulin resistance in humans. Varadhan KK, Atkins RP, Constantin-Teodosiu D,
Blackshaw E, Perkins AC, Greenhaff PL, Lobo DN. Annual Congress of American College of
Surgeons, October 2011.
3. Rates of skeletal muscle mitochondrial ATP production are reduced during elective
abdominal surgery in humans. Atkins RP, Varadhan KK, Constantin-Teodosiu D, Blackshaw
E, Perkins AC, Greenhaff PL, Lobo DN. Annual Congress of American College of Surgeons,
October 2011.
4. Surgical Stress Increases Muscle PDK4 mRNA Expression and Impairs Muscle PDC
Activity, and May Underlie Postoperative Muscle Insulin Resistance. Varadhan KK, Atkins
RP, Constantin-Teodosiu D, Perkins AC, Greenhaff PL, Lobo DN. Society of Academic and
Research Surgery, January 2012.
5. Preoperative carbohydrates in elective surgery. Awad S, Varadhan KK, Ljungqvist O,
Lobo DN. Society of Academic and Research Surgery, January 2012. (Poster).
6. The enhanced recovery after surgery (ERAS) pathway for patients undergoing major
elective open colorectal surgery: A meta-analysis of randomized controlled trials. (Oral).
Krishna K Varadhan, Keith R Neal, Cornelius H C Dejong, Kenneth C H Fearon, Olle
Ljungqvist, Dileep N Lobo. Society of Academic and Research Surgery (SARS) meeting,
January 2010.

14
List of Abbreviations
ATP Adenosine tri-phosphate
Atrogin 1 Atrophy gene 1
BMI body mass index
cDNA complementary DNA
CRP C-reactive protein
elF Eukaryotic initiation factor
ETC electron transport chain
FOXO1 forkhead transcription factor 1
FFA free fatty acids
FBC full blood count
GSK3β Glycogen synthase kinase β
IRS insulin receptor substrate
MAFbx Muscle atrophy F-BOX
MMC Mitochondrial membrane complex
mRNA Messenger RNA
mTOR Mammalian target of rapamycin

15
MuRF1 Muscle RING finger
p70s6k Ribosomal protein S6 kinase
PCr phosphocreatine
PCR Polymerase chain reaction
PDC pyruvate dehydrogenase complex
PDK4 pyruvate dehydrogenase kinase 4
TCA tricarboxylic acid cycle
U&E Urea and electrolytes

16
Chapter 1
General Introduction

17
“It’s not stress that kills us; it is our reaction to it”. Hans Selye
For most patients, undergoing major surgery can be a stressful and an overwhelming
event. The stress response to surgery is characterised by autonomic, hormonal, and
metabolic changes that follow injury or trauma. The ‘surgical stress response’ manifests
itself in the postoperative period, as a syndrome of hypermetabolism, a hyperdynamic
cardiovascular state and inflammation (Bone et al, 1992). Besides the surgical stress and
the consequent changes in carbohydrate and protein metabolism, the patients have to
deal with the fear, fatigue and pain of undergoing surgery, which have a major impact on
recovery and delays return to their pre-surgical functional state. Moreover, perioperative
care is not standardised with existing variations in clinical practice between different
hospitals, professionals and countries, which complicate the patient’s journey through
surgery.
Post-operative insulin resistance (POIR), a state in which the peripheral tissues are
rendered less responsive to the glucose-lowering, antilipolytic and anabolic properties of
the insulin, is central to the metabolic response following surgery. The resultant
hyperglycaemia secondary to the surgical stress labelled as ‘stress hyperglycaemia’
(Thorell et al., 1999b), contributes to increased postoperative morbidity, length of stay
and prolonged recovery (Thorell et al., 1999b, van den Berghe et al., 2001, Jackson et al.,
2012). Evidence from studies in burns injury (Gore et al., 2001), trauma (Laird et al., 2004,
Sung et al., 2005, Jeschke et al., 2004), and critically ill patients (Bochicchio et al., 2005,
Pittas et al., 2004), show a causal relationship between hyperglycaemia and increased
morbidity and mortality. By maintaining euglycaemia, significant clinical benefits of
reduction in mortality by 43%, intensive care stay, ventilator support and reduced risk of

18
infections by 36%, have been reported in this group of patients (Van den Berghe et al.,
2006, Finfer et al., 2009). However, the underlying mechanisms that contribute to POIR,
are less well defined in patients having major surgery.
POIR could be attributed partly, to the metabolic response to surgery, described by
Cuthbertson (Cuthbertson, 1932). The metabolic response to surgery is a complex,
integrated series of events that occur, both, locally at the site of injury and within the
body. The mechanism has probably evolved to mobilise substrates needed for organ
function and tissue repair and to aid recovery. However, additional factors such as
magnitude of surgery and infection can modify the metabolic response and could
potentially lead to a catabolic state and further organ damage. Therefore, a major goal of
modern surgery is to minimise this surgical stress induced alterations to physiological
functions and to restore the body to its pre-injury state in order to shorten recovery
times.
In an attempt to attenuate the surgical stress response in patients having surgery, the
‘Enhanced Recovery After Surgery’ (ERAS) Society published an evidence based
consensus protocol in 2009 (Lassen et al., 2009a). The protocol combined several
perioperative treatment strategies such as preoperative carbohydrate drinks, avoidance
of prolonged fasting, etc. that were individually evaluated in randomised controlled
studies and reported clinical benefits of reduced complications and length of hospital
stay.
Therefore, measures to reduce surgical stress and the mechanisms underlying the
development of POIR are of major clinical interest to improve clinical outcomes and to
enhance recovery after surgery.

19
In this introductory chapter, the principles of the ERAS protocol that is reported to
enhance recovery in surgical patients will be reviewed. Subsequently, the effect of
surgical stress and the metabolic response to injury along with the changes in insulin
signalling mechanisms that are involved in the development of POIR will be discussed
which will lead to the development of the hypothesis and aims of this present research
work.

20
1.1 Enhanced Recovery After Surgery (ERAS)
Over the last few decades, surgical care has improved immensely with advancement of
knowledge, and in systems of care delivery to ensure that optimal treatment is provided
to the critically ill surgical patient. The ERAS protocol was designed to address the
aforementioned perioperative issues and combines the principles of ‘multimodal surgical
care’, originally pioneered by Henrik Kehlet (Kehlet, 1997). ERAS comprises a series of
perioperative interventions such as reduced fasting and preoperative carbohydrate
drinks, epidural anaesthesia, early enteral nutrition, etc., (Fig 1.1 & Tables 1,2,3) that
when implemented together could lead to a major reduction in the risk of complications,
length of hospital stay and development of POIR (Thorell et al., 1999b). Studies, including
randomised controlled trials that reported clinical benefits of these interventions such as
reduced risk of postoperative complications and length of hospital stay, were examined
and the validity of these perioperative interventions were appraised with the efforts of
the ‘ERAS group’, (later known as the ERAS society), which published the common
consensus guidelines in 2005 (Fearon et al., 2005). From accumulating evidence from
several randomised controlled trials of the benefits of individual elements of
perioperative care, the ERAS society published an updated evidence-based consensus
protocol in 2009, which marked a paradigm shift in perioperative care, when ERAS
protocols were originally used in colorectal surgery, extended to gynaecological,
orthopaedic and urological surgery, subsequently (Lassen et al., 2009a).
Thus, the ERAS protocol comprises a multidisciplinary, evidence-based approach to
perioperative care, that is designed to attenuate the stress response to major surgery, to
facilitate the maintenance of preoperative body compositions and organ functions and in

21
doing so, achieve early recovery. The principles of ERAS rest on the concepts of patient
education, ‘pre-habilitation’ of patients including information and counselling, metabolic
preparation with pre-operative carbohydrate treatment and nutritional supplements;
intra-operative strategies to minimise surgical stress such as thoracic epidural analgesia,
minimally invasive or careful choice of operative technique, goal-directed fluid therapy,
post-operative rehabilitation such as early enteral feeding, early mobilisation, avoidance
of opioids, attainment of pre-agreed milestones and discharge criteria (Fig 1.1). In this
regard, it was suggested that the ERAS elements such as avoidance of pre-operative
fasting and allowing patients carbohydrate drinks up to 2 hours before surgery reduces
the surgical stress response and enabled the patient to undergo surgery in a
‘metabolically fed’ state.
Figure 1.1: Philosophy of ERAS [Varadhan et al. Crit Care Clin 26 (2010) 527–547]. The principle
objectives of ERAS protocol are, to modulate inflammation and the immune response,
attenuating the hypermetabolic response to surgery, optimizing glucose control, and providing
nutritional support to enhance recovery.

22
1.2. Components of ERAS
Most of the ERAS interventions in Figure 1.2 are derived from existing high quality
evidence, whilst the other less studied elements are put together from common
consensus opinion or from a traditional-care setting. The rationale for incorporating
these elements in the ERAS pathway and the summary of recommendations for
individual elements, with the grades of evidence according to the ‘Centre for Evidence
Based Medicine’, Oxford, England, are illustrated in Tables 1–3.
Figure 1.2: Philosophy of ERAS [Varadhan et al. Crit Care Clin 26 (2010) 527–547] (Adapted from
Enhanced recovery after surgery: A consensus review of clinical care for patients undergoing
colonic resection. Fearon et al. Clinical Nutrition (2005) 24, 466-477)
Table 1.1 shows ERAS elements that are instituted in the preoperative period, whereas
Tables 1.2 and 1.3 illustrate the elements that form the ERAS pathway in the intra- and
postoperative periods, respectively.

23
Table 1.1: Summary of recommendations: Preoperative interventions of ERAS
Preoperative
elements
Rationale Recommendations
(Note: * indicates that
recommendation is an ERAS-
consensus statement based
on available evidence)
Leve
l of
evid
en
ce
Preadmission
information and
counselling
Preadmission counselling ensures a clear understanding of
the intended perioperative care to be received with
emphasis on attaining specific pre-set targets, would help
in alleviating the stress responses to surgery (Blazeby et
al., 2009, Egbert et al., 1964, Disbrow et al., 1993, Klafta
and Roizen, 1996, Mahomed et al., 2002)
Oral & written patient Information
regarding hospitalization, pain relief,
achieving postoperative targets such
as early nutrition, mobilization and
discharge
*
No bowel preparation
Bowel preparation leads to dehydration and changes in fluid & electrolyte balance (Holte et al., 2004). No change (Guenaga, 2005) or rather an increased risk of complications such as prolonged postoperative ileus as well as increased risk of anastomotic leakage from mechanical bowel preparation (Platell and Hall, 1998, Ram et al., 2005, Jung et al., 2007, Slim et al., 2004)
Patients undergoing elective colonic resection above peritoneal reflection should not receive routine oral bowel preparation. May be considered in low rectal resection where a diverting stoma is planned (Platell et al., 2006)
A
Preoperative fasting & Preoperative carbohydrate loading
27-45% of hospitalized patients are malnourished (Naber et al., 1997, Schutz and Pirlich, 2006). This increased risk may be due to the combined effects of tissue wasting, impaired immune function, impaired healing and organ dysfunction (Arora and Rochester, 1982, Giner et al., 1996) Preoperative carbohydrate loading reduces the incidence of complications (Svanfeldt et al., 2007, Kaska et al., 2006) and facilitate accelerated recovery through early return of gut function and shorter hospital stay leading to an improved perioperative well-being (Noblett et al., 2006b, Nygren et al., 2001, Yuill et al., 2005)
The consensus guidelines from a Cochrane review (Brady et al., 2003) and guidelines from anaesthetic societies recommend clear fluids until 2 hours before induction of anaesthesia and a 6 hour fast for solid food (Lassen et al., 2009a)
A
No long acting sedatives/ premedication
Long acting sedatives, hypnotics and opioids (pre-emptive analgesia) were thought to reduce anxiety and stress related to surgery, but these effects are far outweighed by the risk of prolonged recovery due to inability to drink or mobilize postoperatively. No effect on postoperative pain relief by starting analgesic treatment before the operation(Moiniche et al., 2002). Short acting anxiolytics have not shown prolonged recovery or length of stay (Smith and Pittaway, 2000, Smith and Pittaway, 2003)
Medications causing long term sedation should be avoided; Short acting medications given to facilitate insertion of epidural catheter are acceptable
A
Antimicrobial Prophylaxis
Prophylactic antibiotics minimize infectious complications in colorectal surgery (Song and Glenny, 1998)
A single dose, one hour prior to skin incision and further doses for procedures lasting more than 3 hours (Song and Glenny, 1998)
A
Thromboembolic prophylaxis
Increased risk of thromboembolic complications in certain high risk patients undergoing major abdominal surgery is associated with prolonged hospitalization and recovery
Subcutaneous low-dose unfractionated heparin or subcutaneous low-molecular-weight heparin(Wille-Jorgensen et al., 2001, McLeod et al., 2001)
A
24
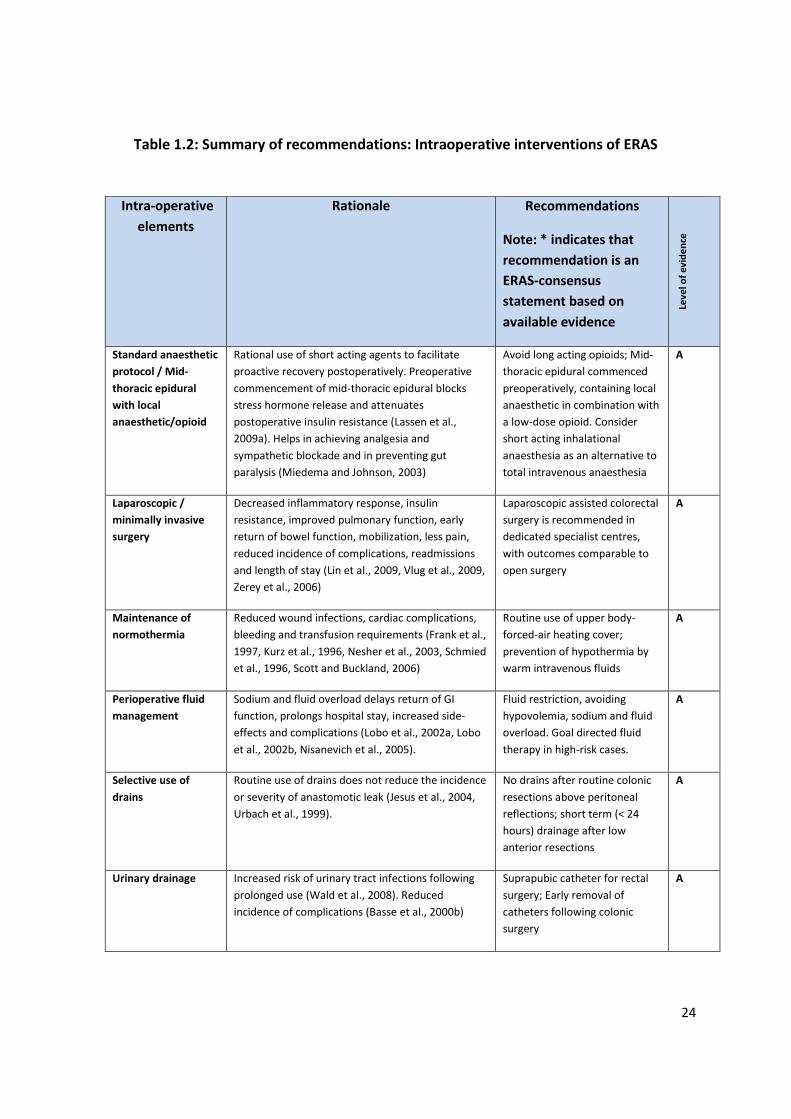
Table 1.2: Summary of recommendations: Intraoperative interventions of ERAS
Intra-operative
elements
Rationale Recommendations
Note: * indicates that
recommendation is an
ERAS-consensus
statement based on
available evidence
Leve
l of
evid
en
ce
Standard anaesthetic
protocol / Mid-
thoracic epidural
with local
anaesthetic/opioid
Rational use of short acting agents to facilitate
proactive recovery postoperatively. Preoperative
commencement of mid-thoracic epidural blocks
stress hormone release and attenuates
postoperative insulin resistance (Lassen et al.,
2009a). Helps in achieving analgesia and
sympathetic blockade and in preventing gut
paralysis (Miedema and Johnson, 2003)
Avoid long acting opioids; Mid-
thoracic epidural commenced
preoperatively, containing local
anaesthetic in combination with
a low-dose opioid. Consider
short acting inhalational
anaesthesia as an alternative to
total intravenous anaesthesia
A
Laparoscopic /
minimally invasive
surgery
Decreased inflammatory response, insulin
resistance, improved pulmonary function, early
return of bowel function, mobilization, less pain,
reduced incidence of complications, readmissions
and length of stay (Lin et al., 2009, Vlug et al., 2009,
Zerey et al., 2006)
Laparoscopic assisted colorectal
surgery is recommended in
dedicated specialist centres,
with outcomes comparable to
open surgery
A
Maintenance of
normothermia
Reduced wound infections, cardiac complications,
bleeding and transfusion requirements (Frank et al.,
1997, Kurz et al., 1996, Nesher et al., 2003, Schmied
et al., 1996, Scott and Buckland, 2006)
Routine use of upper body-
forced-air heating cover;
prevention of hypothermia by
warm intravenous fluids
A
Perioperative fluid
management
Sodium and fluid overload delays return of GI
function, prolongs hospital stay, increased side-
effects and complications (Lobo et al., 2002a, Lobo
et al., 2002b, Nisanevich et al., 2005).
Fluid restriction, avoiding
hypovolemia, sodium and fluid
overload. Goal directed fluid
therapy in high-risk cases.
A
Selective use of
drains
Routine use of drains does not reduce the incidence
or severity of anastomotic leak (Jesus et al., 2004,
Urbach et al., 1999).
No drains after routine colonic
resections above peritoneal
reflections; short term (< 24
hours) drainage after low
anterior resections
A
Urinary drainage Increased risk of urinary tract infections following
prolonged use (Wald et al., 2008). Reduced
incidence of complications (Basse et al., 2000b)
Suprapubic catheter for rectal
surgery; Early removal of
catheters following colonic
surgery
A

25
Postoperative
elements
Rationale Recommendations
Leve
l of
evi
de
nce
No routine use of
nasogastric tube
Facilitates earlier return of bowel function. Not
associated with increased risk of complications or
length of stay(Nelson et al., 2007, Yang et al.,
2008)
Nasogastric tubes should not
be used routinely in the
postoperative period. Used in
selected cases of
postoperative ileus, or unless
severe PONV
A
Aggressive treatment of postoperative nausea and vomiting (PONV)
Facilitates early oral feeding. Symptoms related to postoperative ileus and opioids can be more stressful than postoperative pain. Female gender, non-smoking status, history of motion sickness or PONV and postoperative opioids confer high risk
Individuals at moderate risk (>2 factors) should receive prophylactically with dexamethosone sodium phosphate at induction or serotonin receptor antagonist at the end of surgery (Carlisle and Stevenson, 2006, Wallenborn et al., 2006)
A
Prevention of postoperative ileus
Surgical stress, opioids and bowel handling, fluid overload predispose to ileus and impairs GI function leading to delayed discharge. Oral magnesium oxide promotes postoperative bowel function (Basse et al., 2000a, Basse et al., 2001)
Mid-thoracic epidural analgesia, avoidance of fluid overload and laparoscopic approach, where possible is recommended. A low dose postoperative laxative such as magnesium oxide may also be considered
Postoperative analgesia / Mid-thoracic epidural analgesia
TEDA results in better pain relief and earlier return of bowel function compared with patient controlled analgesia (Block et al., 2003, Marret et al., 2007, Taqi et al., 2007, Turunen et al., 2009). Ineffective pain control, analgesia with oral or intravenous opiates, lack of mobility, loss of appetite contributes to the delayed gastrointestinal recovery (Bisgaard and Kehlet, 2002). TEDA also results in attenuated stress response, insulin resistance, reduced incidence of respiratory and cardiovascular complications (Kehlet and Wilmore, 2002)
Continuous epidural mid-thoracic low-dose local anaesthetic and opioid combinations for approximately 48 hours, following elective colonic surgery and approximately 72-96 hours following pelvic surgery. Acetominophen (paracetomol) for baseline analgesia (4g/d) postoperatively. Boluses for breakthrough pain. NSAIDS started following removal of epidural (multimodal analgesia). Remove catheter if present
A
Early oral nutrition Less gut permeability, early return of bowel function, reduced length of stay and complications (Bisgaard and Kehlet, 2002, Lewis et al., 2009, Lassen et al., 2008, Maessen et al., 2009)
Oral diet, day of surgery with nutritional supplements (200ml, energy dense, 2-3 times daily) until normal food intake is achieved. Continued for several weeks in nutritionally depleted patients
A
Early mobilization Decreases insulin resistance, risk of thromboembolism and pulmonary dysfunction. Increases muscle strength and facilitates early discharge
Encourage independence and mobilization for at least 2 hours on the day of surgery (e.g. turning, sitting in bed) and 6 hours thereafter (e.g. walking)
*

26
Table 1.3: Summary of recommendations: Postoperative elements of ERAS
For the purpose of this thesis, the ERAS interventions such as avoidance prolonged
fasting and preoperative carbohydrate drinks in patients having surgery will be reviewed.
The principles of ERAS emphasise avoidance of prolonged fasting, as prolonged fasting of
both solids and liquids and the metabolic stress from surgery, leads to fluid deficits
(Noblett et al., 2006b) and POIR. ERAS guidelines permit fluids and solids up to two and
six hours prior to surgery, respectively, to ensure that patients are in a ‘metabolically fed’
state (Thorell et al., 1999b). The traditional practice and belief that fasting from midnight
ensures an empty stomach and thereby reduces the risk of pulmonary aspiration in
elective surgical patients, has no scientific evidence behind this dogma. A Cochrane
review of surgical patients showed that fasting from midnight does not reduce gastric
content nor raises the pH of gastric fluid compared with patients allowed clear fluids until
2 hours before anaesthesia (Brady et al., 2003). Recommendations from anaesthetic
societies report that shortened fluid fast until 2 hours before surgery as well as a 6 hour
fast for solid food, does not result in increased risk of pulmonary aspiration, differences
in gastric pH, volume or increased morbidity even in high risk patients (Smith et al.,
2011a, Ljungqvist and Soreide, 2003, Soreide et al., 1997, Warner et al., 1993, ASA
practice guidelinesHolness and Sugden, 1999).
Discharge criteria Addressing patients’ special needs and anticipating problems delaying discharge facilitates early recovery and does not increase readmission rates (Andersen et al., 2007)
Criteria for discharge: Mobilized to preoperative level, pain control on oral analgesic, return of gut function and no complications in need of hospital care
*
Systematic audit Documenting defined outcomes following implementation of ERAS programs ensures standard of care and identifies areas for improvement
A systematic audit should be performed to allow direct comparison across institutions
*

27
Similarly, there are no conclusive data to support the fact that patients with diabetes
have delayed emptying for fluids and when given along with normal diabetic medication,
gastric emptying of a carbohydrate drink was shown to be normal. Many studies show
that carbohydrate treatment results in a better-maintained lean body mass (Yuill et al.,
2005) and muscle strength (Henriksen et al., 2003, Noblett et al., 2006b), less
postoperative losses of nitrogen and protein (Crowe et al., 1984, Svanfeldt et al., 2007),
accelerated recovery (Nygren et al., 2001, Noblett et al., 2006a)
Evidence shows that there is an up-regulation of skeletal muscle PDK4 mRNA expression
after 48 hours of starvation, associated with a 42% reduction in insulin sensitivity and
provision of carbohydrate derived pyruvate was associated with reduced muscle
pyruvate dehydrogenase kinase (PDK4) mRNA and protein expressions and increased
liver glycogen content (Awad et al., 2010). Raised PDK4 mRNA expression in muscle has
been shown to inhibit pyruvate dehydrogenase complex activity, which is the rate-
limiting step in carbohydrate oxidation (described in detail in section 1.5.2). This suggests
that muscle PDK4 would be a prime target in carbohydrate oxidation and that CHO
favours oxidative glucose disposal in skeletal muscle by its effect on PDK4.
Dysregulation of protein kinase B (Akt1) signalling was implicated in insulin resistance
which causes inhibition of FOXO transcription factors which in turn regulates PDK4
activity by phosphorylation. A study in patients by Wang et al investigated whether
altered insulin dependent activation of the phosphatidyl-inositol 3 kinase (PI3K)/Akt
signalling pathway would contribute to the development of POIR (Wang et al., 2010).
POIR and subjective wellbeing were significantly better in the CHO group than in the
fasting/placebo group. At the end of surgery, muscle protein tyrosine kinase activities, as

28
well as PI3K and PKB levels were significantly increased in the CHO group. The
PI3K/Akt/FOXO signalling pathway is discussed in detail in section 1.5.
Despite the initial reluctance and difficulties in implementation of ERAS principles, many
randomised controlled trials (RCT) were undertaken, implementing some or most of the
ERAS interventions in surgical patients and comparing their clinical outcomes against
those treated in the traditional way. Some studies showed clinical benefits of reduced
length of hospital stay, complications and early recovery, whilst others reported mixed
results. This was thought to be a problem with either implementation or adherence to
the ERAS protocol and differences in practice amongst various surgical units (Kehlet,
2009).
In an attempt to analyse and validate the effect of the perioperative interventions on
clinical outcomes of patients treated using ERAS principles, a systematic review and
meta-analysis of randomised controlled trials of ERAS in patients having abdominal
surgery was performed. RCTs that studied the effects of preoperative carbohydrate
drinks in surgical patients with particular reference to the development of POIR, were
also systematically reviewed. The results of both the systematic reviews are presented in
subsequent chapters, in this thesis (Chapter 3 and Chapter 4).

29
1.2 Postoperative insulin resistance
The term ‘Insulin resistance’ refers to a blunting of the stimulatory effect of insulin on
tissue glucose uptake. The development of surgical induced insulin resistance syndrome
(elevated blood glucose and fatty-acid concentrations, reduced muscle glucose uptake,
and increased liver glucose production), which occurs concurrently with increased oxygen
consumption, hyper-lactatemia and protein catabolism, has been a consistent feature in
the postoperative period, following major surgical interventions, thereby delaying
recovery (Ljungqvist et al., 2005, Van den Berghe et al., 2003). However, the
pathogenesis of ‘stress hyperglycaemia’, very much like the patient’s condition, is likely
to be dynamic, change over time and normalises when the counter-regulatory hormonal
surge and pro-inflammatory response abates during recovery (Clement et al., 2004,
Meduri et al., 2009).
POIR, as indicated by a decrease in insulin sensitivity, refers to the ability of insulin to
support glucose homeostasis, by promoting glucose uptake in insulin-sensitive tissues or
organs (or whole body glucose uptake) is measured by the average rate of exogenous
glucose infusion after reaching a steady state level during a hyperinsulinaemic
euglycaemic clamp study, to maintain euglycaemia for 30 min, (M-value). It is more
pronounced in the 1-2 days following surgery, which then takes several days to recover
to basal levels (Fig 1.3). (Ljungqvist et al., 2005, Van den Berghe et al., 2003, Cerra, 1987).
There is also a strong correlation between the magnitude of surgery and the degree of
insulin sensitivity. By measuring insulin sensitivity both preoperatively and 24 hours after
elective surgery in otherwise healthy individuals, it was found that insulin sensitivity was
reduced by approximately 50% after uncomplicated elective open cholecystectomy

30
(Thorell et al., 1994). A 50-60% decrease in insulin sensitivity has been shown to be
associated with major abdominal surgery (Fig 1.4) and surgery using minimally invasive
techniques such as laparoscopic cholecystectomy showed with a significantly less
pronounced reduction in insulin sensitivity compared with open surgery (Thorell et al.,
1999b, Ljungqvist, Thorell et al., 1993, Thorell et al., 1996c). Moreover, the relative
reduction in insulin sensitivity was found to be constant, after a given operation, with a
coefficient of variation of 12.3% or less (Thorell et al., 1993).
It has also been reported that the degree of POIR, along with other surgical factors such
as type of surgery and perioperative blood loss significantly best predicted the length of
hospital stay, with a predictive value of 71% (Thorell et al., 1999b). Another study in
diabetic and non-diabetic patients undergoing cardiac surgery, reported that insulin
resistance is associated with 5-fold increase in the risk of complications, risk of severe
infection by more than 10-fold and a decrease in insulin sensitivity by 50% (Sato et al.).
Therefore, it is clear that interventions that attenuate the development of insulin
resistance in the perioperative setting and during critical illness may have a major effect
on recovery.

31
Figure 1.4: Percentage reduction in insulin sensitivity and magnitude of operation.
Figure 1.3: Degree of insulin insulin sensitivity in the postoperative period, as
measured by Hyperinsulinaemic euglycaemic clamp.

32
1.3. Metabolic response to Surgery
1.3.1 Metabolic response: Evolution of concept
Sir David Paton Cuthbertson, in his series of experiments in the late 1920s, established
the associations of increased nitrogen loss, breakdown of lean tissue (particularly skeletal
muscle), fever and increased oxygen consumption to the post-traumatic catabolic state.
In his study of calcium metabolism, he investigated the effects of bed rest on healthy
volunteers and in individuals with non-inflammatory dysfunction of the knee joint and
found that bed rest caused a slight increase in the excretion of nitrogen, potassium,
sulphur and creatine, which returned to baseline levels with time. Interestingly, his
subsequent experiments on patients with long bone fractures, showed much greater
losses in the above parameters than those associated with bed rest alone. This negative
nitrogen balance was maximal from day 2 to day 8 after injury and lasted for up to 1
month (Cuthbertson, 1929, Cuthbertson, 1930, Cuthbertson, 1932). Studies that followed
linked the activation of the hypothalamic-pituitary-adrenal axis (HPA) and the release of
stress hormones to the systemic metabolic response (Hume, 1953, Egdahl, 1959, Goodall
et al., 1957). Hume and Egdahl, described the adrenal cortical response to limb injury in
dogs caused by trauma or burns, which produced an immediate and sustained increase
of adrenal hormones. However, the response was abated if the sciatic nerve or spinal
cord were transected, demonstrating the importance of afferent nerve signals to mediate
the HPA response. The effect of stress hormones such as cortisol, glucagon and
epinephrine infusion in healthy volunteers over a 74-hour period to achieve
concentrations similar to patients undergoing surgery compared with saline infusion,
showed a significant hypermetabolism, negative nitrogen balance, glucose intolerance,

33
insulin resistance and leucocytosis, pointing to the role of stress hormones in the
metabolic response to surgery (Bessey et al., 1984). Similarly, evidence from patients
with burns showed a strong association between the hypermetabolic response of burn
injury and the secretion of catecholamines (Wilmore et al., 1974). A positive correlation
between the injury severity and the plasma concentration of catecholamines and
dopamine, secondary to an increased sympathetic activity has also been reported in
some studies (Ljungqvist, 2009, Frayn et al., 1985). The importance of neuronal pathways
in eliciting the stress response was reported in a study by Brandt et al, in which they
studied the effects of epidural anaesthesia on patients undergoing elective abdominal
surgery. They showed that the neuraxial blockade attenuated the activation of the HPA
axis, dampened reflex neurogenic responses to the liver and intestinal tract and
postoperative pain. This was associated with a reduction in the secretion of catabolic
hormones, reduced hyperglycaemia and attenuated negative nitrogen balance (Brandt et
al., 1978). Furthermore, a study in patients undergoing upper abdominal surgery, showed
that epidural blockade of catecholamine release also reduced the degree of POIR (Uchida
et al., 1988). Therefore, inhibition of the endocrine-metabolic response to surgery by
neurogenic blockade may reduce the morbidity precipitated in high-risk patients by the
catabolic response to surgery.
Thus, it is evident that the metabolic response to surgery is initiated by the neurogenic
stimuli from the site of injury, which plays a crucial part in the metabolic response to
surgery and that stress hormones play a vital role in the propagation of the response.
However, the cellular and molecular mechanisms that lead to changes in substrate
utilisation and POIR in patients undergoing surgery, have not been well defined.
34
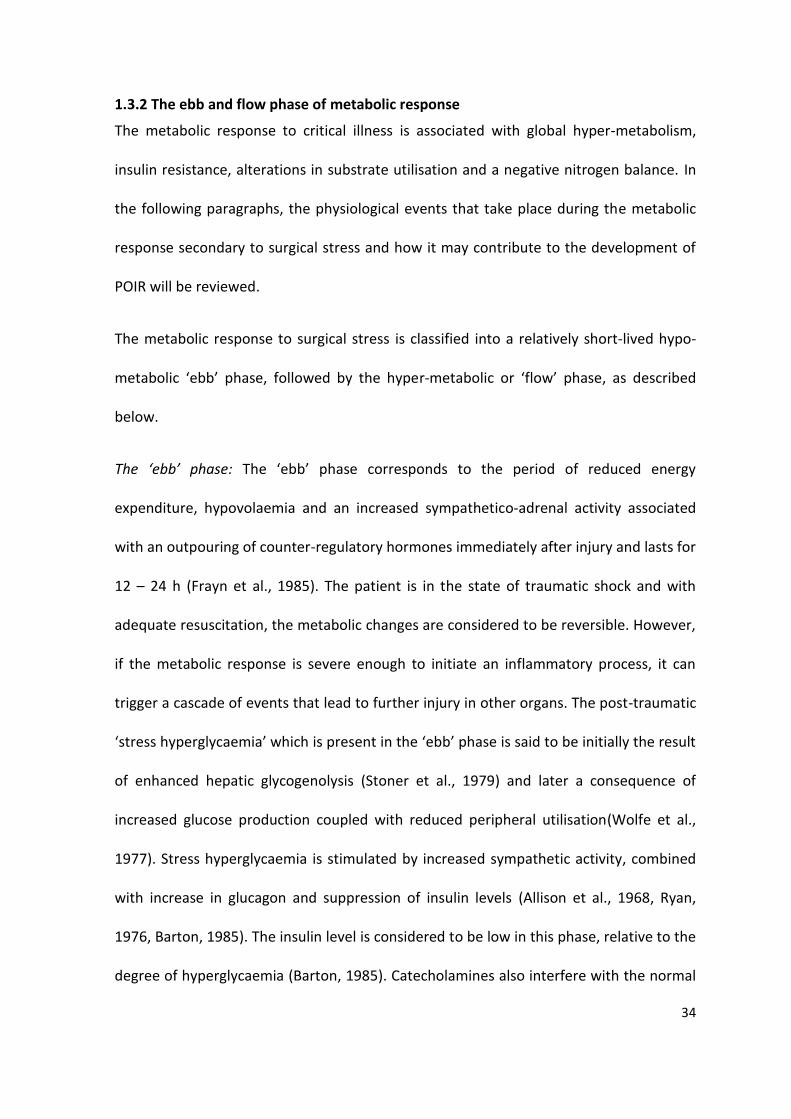
1.3.2 The ebb and flow phase of metabolic response
The metabolic response to critical illness is associated with global hyper-metabolism,
insulin resistance, alterations in substrate utilisation and a negative nitrogen balance. In
the following paragraphs, the physiological events that take place during the metabolic
response secondary to surgical stress and how it may contribute to the development of
POIR will be reviewed.
The metabolic response to surgical stress is classified into a relatively short-lived hypo-
metabolic ‘ebb’ phase, followed by the hyper-metabolic or ‘flow’ phase, as described
below.
The ‘ebb’ phase: The ‘ebb’ phase corresponds to the period of reduced energy
expenditure, hypovolaemia and an increased sympathetico-adrenal activity associated
with an outpouring of counter-regulatory hormones immediately after injury and lasts for
12 – 24 h (Frayn et al., 1985). The patient is in the state of traumatic shock and with
adequate resuscitation, the metabolic changes are considered to be reversible. However,
if the metabolic response is severe enough to initiate an inflammatory process, it can
trigger a cascade of events that lead to further injury in other organs. The post-traumatic
‘stress hyperglycaemia’ which is present in the ‘ebb’ phase is said to be initially the result
of enhanced hepatic glycogenolysis (Stoner et al., 1979) and later a consequence of
increased glucose production coupled with reduced peripheral utilisation(Wolfe et al.,
1977). Stress hyperglycaemia is stimulated by increased sympathetic activity, combined
with increase in glucagon and suppression of insulin levels (Allison et al., 1968, Ryan,
1976, Barton, 1985). The insulin level is considered to be low in this phase, relative to the
degree of hyperglycaemia (Barton, 1985). Catecholamines also interfere with the normal

35
feedback control of insulin and glucagon secretion by circulating glucose levels and
contribute to the development of stress hyperglycaemia (Halter et al., 1984). It has also
been reported that raised cortisol in the postoperative period is a predictor of
postoperative insulin resistance in non-diabetic patients after cardiac surgery (Lehrke et
al., 2008).
The ‘flow’ phase: The ‘ebb’ phase is followed usually by a period of haemodynamic
instability which can last about 3 days, and may require fluid resuscitation with colloids
and inotropes. Subsequently, the patient progresses on to the more prolonged ‘flow’
phase which peaks around 3-5 days and abates by 7-10 days and merges into the
anabolic or the recovery phase (Mizock, 2001). The flow phase is reported to be
characterised by a high metabolic rate with an increased energy expenditure, breakdown
of protein and fat, negative nitrogen balance, weight loss, and rising insulin levels (Frayn,
1986), and as a consequence there is increased glucose production (the important
gluconeogenic precursors being alanine and glutamine) possibly due to the action of
counter-regulatory hormones such as catecholamines, glucocorticoids and glucagon (Hill,
1988). It has been reported that nearly one-fifth of the body’s store of protein is lost over
the first 3 weeks, most during the first 10 days, predominantly from the skeletal muscle
(about 65%) which leads to problems with respiratory function and subsequent weaning
from ventilators (Windsor and Hill, 1988a).
Another consequence of the hyper-metabolic phase is an increased turnover of free fatty
acid and glycerol from adipose tissue probably due to increased catecholamine activity,
and an increased lactate production from muscle glycogenolysis and metabolism in the
hypoxic injured tissues (Wilmore et al., 1980, Frayn, 1985), that is subsequently utilized

36
by the liver for gluconeogenesis in the ‘Cori cycle’, for maintaining the energy supply in
the traumatised patient (Shaw and Wolfe, 1989). The ultimate goal of this acute phase is
to meet the metabolic needs of the elevated energy expenditure, increase availability of
amino acids for gluconeogenesis, to promote wound healing, increase immune cell
replication and acute phase proteins synthesis in the liver and to conserve fluid for the
repair process.
Following acute stress conditions such as surgery, trauma, burns and sepsis, protein
catabolism predominantly from the skeletal muscle, is accelerated and the protein
synthetic response to feeding is impaired, resulting in reduced muscle mass and strength,
impaired immune response, reduced gut function, increased clinical complications and
mortality or prolonged convalescence (Christensen et al., 1982, Windsor and Hill, 1988b,
Iapichino et al., 1981, Wolfe et al., 1983, Wolfe et al., 1989).
Many studies have shown that the post-traumatic state is accompanied by loss of body
protein and negative nitrogen balance (Rennie et al., 1984, O'Keefe et al., 1974,
Wernerman et al., 1986). A study in patients having open cholecystectomy in which
protein synthesis was determined from the total concentration size and distribution of
ribosomes, has demonstrated depressed muscle protein synthesis even after 30 days
following surgery (Petersson et al., 1990). In patients having major surgical procedures
and critically injured patients, loss of one-fifth of the body’s store of protein could occur
in the first three weeks, with most loss in the first 10 days, mainly from skeletal muscle
(Vary, 1998). This leads to prolonged convalescence, problems with respiratory function
and weaning from ventilators, resulting in morbidity and mortality (Monk et al., 1996,
Windsor and Hill, 1988a) .

37
Thus, it is evident that the metabolic response is characterised by well-coordinated
autonomic, hormonal, and metabolic responses that follow injury or trauma. This
manifests as a syndrome consisting of hypermetabolism, a hyperdynamic cardiovascular
state and clinical features of fever or hypothermia, tachycardia and lecukocytosis.
Importantly, depending on the intensity of stress and patient factors such as fluid status,
infection etc., it is associated with increased oxygen consumption, hyperglycemia,
hyperlactatemia and protein catabolism which can affect patient recovery (Cerra, 1987).
The main features of the ebb and flow phases are represented in the table 1.4.
Table 1.4: The ebb and flow phases of Cuthbertson (adapted from Hill et al, British Journal of Surgery, 1998; 85, 884-890)
Ebb phase Flow phase
Metabolism Hypometabolic Hypermetabolic
Oxygen consumption Decreased Increased
Core temperature Low Raised
Energy expenditure Decreased Increased
Cardiac output Decreased Increased
Tissue perfusion Poor Normal
Extremities Cold and clammy Warm and pink
Nitrogen loss Normal Increased
Glucose production Normal Increased
Blood glucose Increased Increased
Lactate Increased Normal
Free fatty acids Increased Increased
Catecholamines and cortisol Increased Increased
Insulin Decreased Increased
Glucagon Raised Raised or normal glucagon
Cytokine production Normal Increased
Insulin resistance Increased Increased

38
Figure 1.5: Metabolic response to trauma: reflex stimuli from site of surgical trauma, alerts the
central nervous system, mainly the neurons of the paraventricular nucleus of the hypothalamus,
that stimulates the production of corticotropin-releasing hormone and activate the
hypothalamic-pituitary-adrenal axis (HPA) and the brain stem to stimulate peripheral autonomic
nervous system responses. This integrated ‘stress’ response, controls primary bodily functions
such as arousal, cardiovascular tone, respiration, altered gastrointestinal function and
intermediate metabolism.
Liver Gluconeogenesis,
Glycogenolysis

39
1.4. Postoperative insulin resistance (POIR)
Postoperative insulin resistance is central to the metabolic response to surgery. The key
feature of the ‘hypermetabolic’ stress response involves increased endogenous hepatic
glucose production while insulin-stimulated peripheral glucose uptake is reduced (Baron
et al., 1988). However, it is not fully understood how the metabolic signalling pathways
that regulate whole body glucose and fat metabolism are perturbed as a result of surgical
stress and contribute to the development of POIR.
Skeletal muscle plays an important role for the regulation of glucose metabolism. It
contributes to more than 30% of resting metabolic rate and 80% of whole body glucose
uptake(de Lange et al., 2007). Insulin is the most important hormone of metabolic
regulation through its integrated action on carbohydrate, lipid and protein metabolism. It
stimulates glucose uptake in insulin-sensitive tissues such as liver, muscle and adipose
tissue and suppresses the endogenous glucose production in the liver. In the liver and
muscle, insulin promotes glycogen synthesis by activating the enzyme glycogen synthase,
increase synthesis and uptake of fatty acids (FA), by activation of acetyl-CoA carboxylase
and inhibition of FA release by inactivation of hormone-sensitive lipase. Conversely,
catecholamines, cortisol, glucagon and growth hormone, raise blood glucose by
enhanced glycogenolysis and gluconeogenesis.
Glucose is transported through cell membranes by facilitated carrier-mediated diffusion,
by the glucose transporters (GLUT1, GLUT2 and GLUT4) that differentially regulate
glucose uptake in various tissues (Shepherd and Kahn, 1999, Pessin and Bell, 1992).
GLUT4 is the major isoform in insulin-sensitive tissues such as skeletal muscle, cardiac
muscle and adipose tissue. Upon stimulation by insulin binding to its receptor, GLUT4 is

40
translocated to the cell-membrane to permit the movement of glucose down a
concentration gradient across cell membranes, a rate-limiting step in glucose uptake in
these insulin sensitive tissues (Pessin and Saltiel, 2000).
Plasma insulin levels vary rapidly in response to fluctuations in glucose levels. Under
normal physiological conditions, the increased concentration of glucose in the portal
blood stimulates insulin release from the β-cells of pancreatic islets and suppresses
secretion of glucagon from the α-cells. Conversely, in the fasting or post-absorptive state,
the stored metabolic reserves of glycogen, triacylglycerol and protein are released at
times of increased metabolic demand, in response to the hormone, glucagon, resulting in
increased liver glycogenolysis and gluconeogenesis, in liver and kidney.
However, the effect of surgery on insulin levels, glucose uptake and oxidation shows
mixed results. Many studies in patients undergoing surgery have highlighted important
cellular events in carbohydrate metabolism that may lead to postoperative muscle insulin
resistance and hyperglycaemia.
Thorell et al, measured insulin sensitivity in patients undergoing open cholecystectomy
using a euglycaemic, hyperinsulinaemic clamp and reported that the postoperative
insulin resistance was associated with a significantly higher plasma concentrations of
glucose, noradrenaline and glucagon whilst the levels for insulin, growth hormone,
cortisol and adrenaline were unaltered (Thorell et al., 1994). Other studies in patients
undergoing major elective surgery reported that postoperative hyperglycaemia (Brandi et
al., 1990, Crowe et al., 1984), was associated with increased insulin requirements to
maintain euglycaemia (Brandi et al., 1990) and a raise in counter-regulatory hormones,
whole body protein oxidation and energy expenditure (Brandi et al., 1990). Wright et al

41
also noted that glucose utilisation was significantly depressed during and after operation
along with suppression of insulin secretion during operation together with increased
plasma cortisol levels and an increased urinary catecholamine excretion(Wright et al.,
1974).
Brandi et al, in their study of insulin resistance in patients undergoing major elective
surgery, reported that patients were hyperglycaemic (7.3 ± 0.6 versus 4.2 ± 0.3 mmol/l
glucose pre-surgery, mean ± SEM, P <0.01) with normal insulin concentrations (73 ± 15
versus 64 ± 18 pmol/l). Furthermore, eight times more insulin was needed than before
surgery, (14.14 ± 1.15 versus 1.78 ± 0.29 pmol min-1 kg-1, P less than 0.001) to maintain
euglycaemia(Brandi et al., 1990). Another study by the same author, using a three-step
iso-glycaemic insulin clamp combined with indirect calorimetry, [6-3H]glucose infusion
and the forearm technique, also reported impaired whole-body glucose disposal by 33-
60%, in patients 6 -8 hours after undergoing major abdominal surgery whilst the hepatic
glucose production at baseline was less suppressed by insulin (Brandi et al., 1993).
Forearm glucose extraction was markedly depressed at all insulin levels and forearm
lactate release was in excess of concurrent glucose uptake, suggesting ongoing
glycogenolysis despite insulin. This was associated with increased cortisol, lactate and
total lipolysis (plasma free fatty acid and glycerol levels).
Other studies investigating serum insulin changes in surgical patients, have reported
lower insulin levels at the start of surgery compared with intraoperative and
postoperative periods (Crowe et al., 1984, Nygren et al., 1998b, Aarimaa et al., 1974),
and impaired insulin response both intra-operatively (Wright et al., 1974, Barton, 1985)
and soon after surgery (Stenberg et al., 1984, Aarimaa et al., 1974).

42
Crowe et al studied the effect of glucose infusion commenced either the night before
operation with that of glucose infusion commenced postoperatively in patients having
abdominal surgery. The values of intra-operative plasma glucose concentrations were
increased compared with the levels at the time of induction of anaesthesia while plasma
insulin concentrations only showed a mild increase (insulin levels in mU/l: at induction of
anaesthesia: 5±2; mean intraoperative: 7±3; on day-1 postop: 17±5; day-3 postop: 11±3).
Wright et al, also investigated the changes in glucose utilisation and insulin secretion
during surgery in patients having inguinal herniorraphy, vagotomy and pyloroplasty and
aorto-femoral bypass (Wright et al., 1974) and reported that glucose utilisation was
significantly depressed during and after operation, to a degree which increased with the
severity of operation. Suppression of insulin secretion was observed during operation
together with increased plasma cortisol levels and an increased urinary catecholamine
excretion. Similarly, Stenberg et al, also found the increase of insulin in response to
glucose was significantly (p<0.001) reduced 2 hours after laparotomy as compared to
control subjects (Stenberg et al., 1984).
Using isotope labelling techniques, Shaw et al, demonstrated a decreased glucose
oxidation in septic and trauma patients (Shaw and Wolfe, 1985, Shaw et al., 1985, Jahoor
et al., 1986). They studied the metabolic response in severely-ill patients suffering from
blunt trauma, and compared the data with normal controls. Whilst the glucose uptake
was increased in patients (21 ± 2 mmol/kg/minute vs. 14 ± 1 mmol/kg/minute), the
trauma patients had an impaired capacity to directly oxidize plasma glucose (23 ± 4% vs
36 ± 2%). However, a study in septic, non-diabetic patients which investigated the effect
of two levels of insulinaemia (250 mIU/l in step 1 and 1250 mIU/l in step 2) in the

43
presence of a euglycaemic clamp on glucose metabolism, showed both glucose uptake
and oxidation were not significantly different when compared with controls.
A study in septic rats also reported hyperlactatemia and reduced activity of the pyruvate
dehydrogenase complex which regulates an important rate-limiting step in carbohydrate
oxidation (Vary, 1996).
A study investigating the effects of cardiac surgery on the development of POIR, in non-
diabetic patients highlighted that postoperative serum cortisol level was a better
predictor for inflammatory insulin resistance, followed by IL-6, leptin and adiponectin.
The study reported a slow rise in serum cortisol, resistin and leptin which peaked at 22
hours after surgery (Lehrke et al., 2008). They also reported that the comparable pattern
of regulatory proteins in chronic environment of obesity and in acute inflammation
suggests similar causative mechanisms of insulin resistance.
Thus it is clear that the antagonistic actions of counter-regulatory hormones such as
glucagon, cortisol and catecholamines impair the metabolic actions of insulin and may
contribute to the acute insulin resistance in the immediate postoperative period(Krentz,
1996). Therefore, it is suggested from the aforementioned studies, that a failure of
cellular glucose utilisation along with the changes in insulin response, is an important
event in the metabolic response to injury that may lead to the stress induced
hyperglycaemia, noticed in patients undergoing major abdominal surgery.
1.4.1 Role of cytokines
Surgery is associated with a pronounced inflammatory response with the release of pro-
inflammatory cytokines. Cytokine-mediated inflammatory response could be one of the
molecular triggers for the metabolic response to surgery. Studies show that the cytokines

44
produced locally at the site of surgical trauma act locally on the wound and also on
distant organs such as the liver, gut and skeletal muscle. The cytokines stimulate
important mediators such as platelet activating factor, oxygen free radicals, nitric oxide
and arachidonic acid metabolites, which act both directly on the cells and indirectly by
altering regional blood flow (Hebert et al., 1995, Bulkley, 1993). IL-6 mediated
inflammatory response is thought to be responsible for the fever and metabolic changes
in the acute phase of illness that has been consistently found in sepsis, trauma and
postoperative states and a marked IL-6 response is found to correlate with the severity of
illness. Furthermore, the effects of TNF on the hemodynamic changes and tissue injury in
septic shock, and causing endothelial damage, inducing disseminated intravascular
coagulation, multiple organ failure and death has also been reported (Martin et al., 1997,
Tang, 1996, Bach et al., Svoboda et al., 1994, Tompkins, 1997, Bach et al., 1997). A study
on the systemic cytokine response to trauma in patients having aortic surgery, reported
an increase in IL-6 levels that peaked at 4-48 hours after surgery, was significantly higher
and also preceded the clinical onset of major complications (Baigrie et al., 1992). It has
also been shown that the metabolic pathways involved in insulin-mediated glycogen
synthesis are more sensitive to the inhibitory effects of cytokines such as interleukin (IL-
6) and tumour necrosis factor (TNF) and counter-regulatory hormones (Baron et al.,
1988). A recent review identified the role of IL-6 as a ‘myokine’, produced in the skeletal
muscle and responsible for the metabolic regulation and changes in insulin signalling (Pal
et al., 2014). Cytokines along with counter-regulatory hormones such as catecholamines
and glucocorticoids can induce insulin resistance by inhibition of insulin binding to
insulin-receptor and subsequent GLUT4 translocation (Chiasson et al., 1981, Mizock,

45
2001). Furthermore, a study reported that non-insulin mediated glucose uptake in tissues
such as lung, liver, spleen and wounds are also modulated by TNF and IL-1 by stimulation
of GLUT1 synthesis, plasma membrane concentration and activity (Dimitriadis et al.,
1997).
Cytokines are also reported to influence skeletal muscle catabolism by modulating
protein synthesis and degradation and inhibit regulatory actions of anabolic hormones
(Vary, 1998). TNF, when infused into animals induced a net catabolic state by mediating
increased catabolism at the level of specific tissues, by activating the HPA axis and
causing anorexia (Flores et al., 1989, Mealy et al., 1990). Flores et al estimated the rates
of protein synthesis and degradation in muscle and liver tissues in intact rats treated with
several doses of recombinant IL 1 and/or TNF. They reported that rats exposed
systemically to sub-lethal doses of TNF responded with increasing muscle and decreasing
liver proteolysis, similar to that observed in inflammation and in cancer.
Cytokines other than IL-6 and TNF-α, such as plasminogen activator inhibitor 1,
angiotension and leptin are also secreted by adipose tissue, which may also contribute to
insulin resistance. Whilst TNF-α, and IL-6 is reported to impair insulin signalling and
increase lipolysis , angiotensinogen and leptin are associated with increased insulin
resistance (Devaraj et al., 2004).
Thus, it is possible that the development of POIR in surgical patients could be partly
attributed to the metabolic response to surgery. The surgical stress induced
inflammatory response mediated by the interaction of pro-inflammatory cytokines and
counter-regulatory hormones regulated by central nervous system, may interfere with

46
the normal carbohydrate metabolism especially in the liver and skeletal muscle that may
lead to POIR and stress hyperglycaemia seen in patients having major abdominal surgery.
1.4.2 Role of preoperative fasting in surgical patients
Traditionally, patients having surgery fast between 12-18 hours whilst awaiting surgery
which may contribute to insulin resistance (Svanfeldt et al., 2005). A period of brief
fasting or hypo-caloric nutrition has been associated with reduction in insulin sensitivity
(Nygren et al., 1997b, Nygren et al., 1997a, Svanfeldt et al., 2003).
In the post-absorptive or fasted state, it is reported that insulin-independent tissues such
as brain and splanchnic organs account for the majority of whole-body glucose disposal
(50% and 25% respectively), whilst the insulin dependent tissues such as skeletal muscle
account for the reminder of glucose utilisation (25%). During fasting, plasma glucose
concentration is about 5 mmol/l and insulin concentration is about 60 pmol/l. Liver
releases glucose from its stored energy reserves by glycogenolysis (65-75%) and
subsequently by gluconeogenesis (25-35%) to maintain whole body glucose homeostasis.
Liver glycogen reserves are sufficient for only a period of 24 hours, gluconeogenesis
proceeds at the expense of muscle protein. It has been reported that the initial period of
starvation (2-3 days) is accompanied by mobilisation of amino acids from skeletal muscle
to support the augmented rate of hepatic gluconeogenesis and that increased protein
breakdown rather than depressed protein synthesis may contribute to gluconeogenesis
(Magnusson et al., 1990). Therefore, if the patients do not return to enteral feeding after
surgery, they enter the period of starvation where the process of gluconeogenesis is
augmented, the important precursors being lactate, alanine and glycerol, which initiates

47
the catabolic process (Nygren, 2006). This metabolic adaptation also leads to increased
circulating fatty acids (FFA) from lipolysis to be used as a metabolic fuel in muscle,
secondary to the effects of increased adrenergic stimulation and decreased insulin levels.
Increased oxidation of FFA and the production of ketone bodies, which is used as fuel in
tissues such as brain, can minimise further protein breakdown (Nygren, 2006). Therefore,
it is evident that fasting which contributes to the metabolic stress in patients having
surgery, is strongly associated with the development of POIR. Avoidance of fasting or
reduced fasting times before surgery, can therefore attenuate the development of POIR
and improve glucose and protein metabolism. The role of surgical stress on the metabolic
response and POIR is summarised below.
Figure 1.6: Surgical stress and the metabolic response

48
1.5 Molecular mechanisms
1.5.1 PI3K/Akt1/FOXO signalling pathway
Under normal conditions, stimulation with growth factors, such as insulin-like growth
factor-1 (IGF-1), and hormones, such as insulin, leads to the activation of the
phosphatidylinositol-3 kinase (PI3K)/Akt signalling cascade. Phosphorylation of Forkhead
box O (FOXO) by Akt1 leads to their exclusion from the nucleus, and a reduction in the
expression of key genes involved in the regulation of carbohydrate oxidation [pyruvate
dehydrogenase kinase 4 (PDK4)]. This results in increased pyruvate dehydrogenase
complex activity. Activated PDC is important for the conversion of carbohydrate-derived
pyruvate into acetyl-CoA which is the rate limiting step for carbohydrate oxidation.
Skeletal muscle plays an important role in the insulin-mediated glucose disposal in
humans (DeFronzo et al., 1981). Insulin binding to its receptor stimulates activation of
receptor tyrosine kinase, which phosphorylates multiple intracellular substrates including
insulin receptor substrate (IRS1). IRS1 activation of the PI3 kinase is responsible for
insulin signalling mediated glucose homeostasis. Insulin mediated glucose entry into
skeletal muscle, is facilitated by PI3 kinase stimulated translocation of insulin-responsive
glucose transporter (GLUT4) to the plasma membrane by phosphorylating the protein
kinase B (Akt) (Chow et al., 2010). Therefore, any alteration in this important signalling
mechanism may contribute to the development of POIR, seen in patients having major
abdominal surgery.
The insulin-like growth factor-1 (IGF-1)/phosphatidyl-inositol-3 kinase (PI3K)/Akt1
pathway, through inhibition of FOXO transcription factors play an important role in the

49
regulation of muscle carbohydrate metabolism and protein synthesis. In the following
section, the components of this pathway and their potential role in the development of
POIR will be discussed.
Forkhead Box O (FoxO) proteins belong to the mammalian forkhead transcription factors
in the ‘O’ class, FoxO1, FoxO3, FoxO4 and FoxO6. They play a significant role during
normal cellular function as well as during progressive disease and govern diverse
functions of differentiation, proliferation, survival and longevity during multiple cellular
environments that can involve oxidative stress. They are expressed in tissues of the
reproductive system of males and females, skeletal muscle, the cardiovascular system,
lung, liver, pancreas, spleen, thymus and the nervous system (Castrillon et al., 2003,
Furuyama et al., 2000, Furuyama et al., 2002, Hoekman et al., 2006, Maiese et al., 2008,
Modur et al., 2002). FoxOs are also expressed in skeletal muscle and their expression
levels are changed in response to energy metabolism. Expression levels of FoxO1 and
FoxO3a were increased in skeletal muscle by starvation and glucocorticoid treatment
(Furuyama et al., 2003). Dexamethasone treatment in chronically instrumented,
lipopolysaccharide LPS infused male Sprague-Dawley rats, inhibited the cytokine-
mediated inhibition of Akt/FOXO signalling in the induction of muscle atrophy and
impairment of muscle carbohydrate oxidation and also reduced the LPS-mediated
increase in cathepsin-L mRNA expression and enzyme activity by 43%. Furthermore,
dexamethasone-suppressed LPS-induced pyruvate dehydrogenase kinase 4 (PDK4) mRNA
upregulation by ∼50% (P <0.01), and prevented LPS-mediated muscle glycogen
breakdown and lactate accumulation (Crossland et al., 2010).

50
Akt and regulation of FoxO transcription factors
In regards to the inhibition of FoxO protein activity, the serine-threonine kinase protein
kinase-b (Akt) is a primary mediator of phosphorylation of FoxO. FoxOs are mainly
regulated via reversible changes in subcellular localization by Akt dependent
phosphorylation. Several serine/threonine kinases, including the Akt family of protein
kinases and the related SGK (serum and glucocorticoid inducible kinase) are activated by
phosphoinositide kinase (PI3K) upon stimulation and activation by insulin or other growth
factors via their binding to their tyrosine kinase receptors. Akt dependent
phosphorylation of FOXO transcription factors at the N-terminal site, creates a binding
motif for 14-3-3 proteins and also interferes with the DNA binding domain of FOXO that
facilitates the translocation of FOXO from the nucleus into the cytoplasm(Van Der Heide
et al., 2004). Akt activity and cytoplasmic localization are necessary for FoxO1
ubiquitination and subsequent proteosome-dependent degradation (Huang et al., 2005).
The nuclear exclusion and cytoplasmic translocation of FoxO also inhibits transcription of
the muscle specific ubiquitin ligases, MAFbx and MuRF1 that causes skeletal muscle
atrophy.
The protein kinase Akt, is an upstream activator of protein synthesis and has been shown
to have growth-promoting effects in muscle. Other factors that are downstream of Akt,
such as mTOR and p70s6 kinase are regulated by Akt and are involved in muscle protein
synthesis (Rommel et al., 2001). Decreased phosphorylation of both mTOR and p70S6
kinase is shown to be consistent with decreased translation rate and muscle unloading
(Bodine et al., 2001b) and overexpression of Akt is associated with attenuation of
denervation-induced atrophy in rodents by 70% (Hornberger et al., 2001).

51
Furthermore, it has been reported that Akt signalling also mediates other cellular
functions such as modulation of glycolysis through the regulation of phosphofructokinase
and regulation of protein synthesis such as activation of mTOR and p70skk and inhibition
of glycogen synthase kinase 3 (GSK3). An interesting study in myotubes transfected with
Akt, showed that Akt inhibited the Dexamethasone induced dephosphorylation of FOXOs
and consequently blocked the induction of atrogin-1 (MAFbx), demonstrating that the
activity of AKT 1 is sufficient to inactivate FOXOs and reduce atrogin-1 (MAFbx)
expression (Nader, 2005) .
Myostatin, a member of the Transforming Growth Factor-β family, has been associated
with muscle wasting in conditions such as immobilization (Carlson et al., 1999), HIV
infection (Gonzalez-Cadavid et al., 1998) and chronic muscle disuse (Reardon et al.,
2001). Myostatin has also been shown to inhibit muscle carbohydrate oxidation
(McPherron and Lee, 2002) and inhibits protein synthesis via the Akt/mammalian target
of rapamycin (mTOR)/p70S6k signalling pathway (Trendelenburg et al., 2009). Myostatin
overexpression in myoblasts induces muscle wasting by directly inhibiting
phosphorylation of Akt, thereby increasing activity of FOXO transcription factors and its
expression of downstream targets. FoxO1, in addition to activation of the ubiquitin
ligases, could also enhance muscle atrophy through inhibition of myogenesis resulting
from enhanced myostatin expression (Allen and Unterman, 2007).
Surgical patients are prone for oxidative stress resulting from free radical injury from
ischemic tissues. Oxidative stress may result in the release of reactive oxygen species
(ROS) is reported to be associated with mitochondrial DNA mutations in tissue injury and
aging. Both, cellular survival and longevity are intimately dependent on exposure to

52
oxidative stress and induction of apoptotic pathways (Chong et al., 2005, Yui and
Matsuura, 2006). It has been reported that Akt can prevent cellular apoptosis and is
usually cyto-protective, such as during free radical exposure (Chong et al., 2003,
Matsuzaki et al., 1999), hyperglycaemia (Anitha et al., 2006), hypoxia and oxidative stress
(Kang et al., 2003a, Kang et al., 2003b).
A critical component of muscle metabolism during fasting or other catabolic states is a
switch from oxidation of carbohydrates as the major energy source to fatty acids. FoxO1
is involved in this adaptive response (Bastie et al., 2005). In calorie restriction (CR) or
starvation, FoxOs are in the nucleus, and therefore active transcriptionally, and are
associated with increased hepatic glucose production, decreased insulin secretion, and
degradation of skeletal muscle for supplying substrates for glucose production.
FOXO transcription factors are also involved in the inhibition of muscle carbohydrate
oxidation, via increased pyruvate dehydrogenase kinase-4 (PDK4) transcription
(Furuyama et al., 2003) as a result of impaired stimulation of PI3K and Akt1 (Kim et al.,
2006). PDK4 phosphorylates and inactivates the pyruvate dehydrogenase complex (PDC),
which promotes pyruvate entry into mitochondria and thereby regulates carbohydrate
oxidation. Insulin and IGF-1 can suppress FoxO protein activity through activation of Akt
(Guo et al., 1999, Nakae et al., 1999). In terms of protein synthesis, IGF-1 is also involved
in myoblast differentiation through PI3K/Akt (Tureckova et al., 2001). Inactivation of IGF
signaling by targeted mutagenesis of IGF1 receptor leads to muscle hypoplasia (Liu et al.,
1993), whereas overexpression of IGF1 results in enlarged myofibers (Coleman et al.,
1995). FOXO proteins can stimulate the insulin-like growth factor-binding protein-1
promoter by binding to the insulin-responsive sequence.

53
Studies on animal models and healthy volunteers have also shown a strong association of
insulin signalling and the role of FOXO transcription factors, in causing insulin resistance
and skeletal muscle wasting. Specifically, using an animal-endotoxaemia model, the study
by Crossland et al, has shown that an inhibition of PI3K/Akt1 signaling, and activation of
the Forkhead Box O (FOXO) family of transcription factors that lie downstream of
PI3K/Akt1, occurs concomitantly with muscle atrophy and the impairment of muscle
carbohydrate oxidation (Crossland et al., 2008). Importantly, these events were
accompanied by marked upregulation of FOXO gene targets, i.e. muscle atrophy F-box
(MAFbx), muscle RING finger 1 (MuRF1) and pyruvate dehydrogenase kinase-4 (PDK4),
which strongly suggests a role for Akt/FOXO signaling in the simultaneous induction of
muscle atrophy and impairment of muscle carbohydrate oxidation during endotoxaemia
(fig 1.7A and 1.7 B).
In keeping with this premise, activation of FOXO, as a result of impaired Akt signaling, has
been implicated in the induction of muscle atrophy, via upregulation of E3-ubiquitin
ligases MAFbx and MuRF1 (Stitt et al., 2004), which are considered to be key regulators
of muscle protein breakdown (Bodine et al., 2001a).
Impaired Akt/FOXO signaling has also been implicated in muscle insulin resistance,
through FOXO-mediated up-regulation of PDK4 and reduction in the mitochondrial
pyruvate dehydrogenase complex (PDC) activity which controls the rate of
carbohydrate/pyruvate oxidation (Kim et al., 2006). An increase in muscle PDK4
expression down-regulates the activity of PDC, leading to an impairment of muscle
carbohydrate oxidation (Crossland et al., 2008). Based on the above evidence, we
contend that the systemic inflammatory response secondary to surgical trauma could be

54
responsible for the concomitant activation of muscle protein breakdown and induction of
muscle insulin resistance.
LPS study in rodents
A
Crossland et al, J Physiol 586.22 (2008) pp 5589–5600
FOXOP
Cytoplasm
Control
Pyruvate Dehydrogenase Complex activity
Carbohydrate oxidation
Insulin /IGF-1
PDK4
Nucleus
Akt1P
Pyruvate Dehydrogenase Complex activity
Carbohydrate oxidation
Cytokines, eg. TNF-α
PDK4
Nucleus
Akt1
FOXO
CytoplasmP
P
Sepsis
B
Fig 1.7 A: Stimulation with growth factors, such as insulin-like growth factor-1 (IGF-1), and hormones, such
as insulin, leads to the activation of the phosphatidylinositol-3 kinase (PI3K)/Akt signalling cascade.
Phosphorylation of Forkhead box O (FOXO) by Akt1 leads to their exclusion from the nucleus, and a
reduction in the expression of key genes involved in the regulation of carbohydrate oxidation pyruvate
dehydrogenase kinase-4 (PDK4). (Figure adapted from Crossland et al, J Physiol 586.22 (2008) pp 5589-
5600)
Fig 1.7 B: LPS-induced endotoxaemia: Akt1 is in a predominantly dephosphorylated / inactive state,
possibly due to elevated cytokine levels, such as tumour necrosis factor-α (TNF-α). This enables FOXO
factors to up-regulate PDK4 causing inhibition of the pyruvate dehydrogenase complex (PDC). Inhibiting the
activity of PDC by phosphorylation of the complex, prevents the conversion of carbohydrate-derived
pyruvate into acetyl-CoA which is the rate limiting step for carbohydrate oxidation. (Figure adapted from
Crossland et al, J Physiol 586.22 (2008) pp 5589-5600).

55
1.5.2 Role of Pyruvate Dehydrogenase Complex and Pyruvate dehydrogenase kinase in
POIR
PDC is a multi-enzyme complex located on the inner mitochondrial membrane and
controls the rate limiting step in carbohydrate oxidation, the conversion of pyruvate into
mitochondrial acetyl-CoA by oxidative decarboxylation of pyruvate. PDC activation and
acetyl-CoA availability limit oxygen dependent mitochondrial ATP formation. Therefore
the impairment of PDC activation has an important role in muscle metabolism, as it
represents the only entry point for carbohydrates, (derived from circulating glucose or
intramuscular glycogen) into the mitochondria for complete oxidation (Pilegaard and
Neufer, 2004). The activation status of the PDC is controlled by a covalent modification
(via phosphorylation-dephosphorylation), involving competing pyruvate dehydrogenase
kinase (PDK) and phosphatase (PDP) reactions. The resulting inter-conversion cycle
determines the amount of PDC existing in non-phosphorylated (active) form, i.e. PDCa.
Phosphorylation of specific serine residues within the enzyme pyruvate dehydrogenase,
catalysed by PDK, renders it inactive, whereas dephosphorylation and activation of PDC is
catalysed by pyruvate dehydrogenase phosphatase (Wieland, 1983). The PDK family
comprises of four isoforms (PDK1-4), of which PDK2 and PDK4 mRNA are most abundant
in human skeletal muscle (Bowker-Kinley et al., 1998, Spriet et al., 2004).
It is reported that an increase in free fatty acids (FFA) during energy deficit may be an
important regulator of PDK4 expression in resting skeletal muscle (Holness et al., 2003),
which explains up-regulation of PDK4 mRNA in response to prolonged fasting (Wolfe et
al., 1987, Dobbins et al., 1998), obesity (Wolfe and Peters, 1987), and in pathologies such
as insulin resistance (Baldeweg et al., 2000) and type-2 diabetes (Reaven et al., 1988). A

56
study investigating the dose-response relationship between elevated FFA levels and
impaired insulin-mediated glucose disposal in normal glucose-tolerant subjects showed
inhibition of insulin stimulated glucose uptake inversely correlates with the increased FFA
levels produced by the lipid infusion (Belfort et al., 2005). This study also showed that an
increase of plasma FFA levels disrupts insulin signalling by inhibiting insulin receptor
tyrosine phosphorylation, insulin receptor substrate-1 (IRS-1) tyrosine phosphorylation,
PI3-kinase activity and AKT serine phosphorylation (Belfort et al., 2005).
Fasting, in addition to exercise, increases the expression of lipoprotein lipase, the enzyme
that hydrolyses plasma triglycerides into fatty acids and glycerol for uptake by the muscle
cell (Goldberg, 1996, Greiwe et al., 2000, Rauramaa et al., 1980). FoxO1 levels under
numerous conditions parallel lipoprotein lipase expression, and overexpression of FoxO1
in C1C2 myocytes increases lipoprotein lipase (Kamei et al., 2003). Chronic exposure to
elevated levels of free fatty acids can increase reactive oxygen species production in cells
and can lead to mitochondrial DNA damage and impaired pancreatic ß-cell function
(Rachek et al., 2006). Smaller skeletal muscle mitochondria and a decrease in the levels of
mitochondrial proteins and mitochondrial DNA in adipocytes have been associated with
the development of insulin resistance. Furthermore, Insulin resistance has also been
associated with elevation in fat accumulation and altered mitochondrial oxidative and
phosphorylation activity in the elderly (Choo et al., 2006, Kelley et al., 2002, Petersen et
al., 2003, Pospisilik et al., 2007). However, the mechanisms by which FFAs up-regulate
PDK4 expression and inhibit PDC-controlled CHO oxidation in surgical patients, has not
been investigated previously. Thus it would be interesting to study the link between an

57
overnight fast on circulating FFA in surgical patients and whether it is associated with the
development of muscle insulin resistance.
1.5.3 Role of Mitochondria
Mitochondria play a key role in cell-survival, generates the majority of cell’s supply of
adenosine triphosphate (ATP) synthesis through aerobic respiration and oxidation of
substrates such as glucose, pyruvate and NADH. Studies report changes in markers of
mitochondrial metabolism associated with depressed oxidative function and impaired
switching to carbohydrate substrate from fasted to fed state in insulin resistant states.
Mitochondria convert the products of carbohydrate, protein and fat metabolism to CO2
and water using the enzymes of the electron transport chain namely, NADH
dehydrogenase (Complex I), succinate dehydrogenase (Complex II), cytochrome C
(Complex III) and cytochrome c oxidase (Complex IV). Electrons from NADH + H+ and
FADH2, are transported from matrix to the Complexes I and II of the electron transport
chain (ETC), creating an electro-chemical gradient and in the process, synthesize ATP
within the mitochondrial matrix. The important contributor to the ETC, is the oxidation of
acetyl-CoA in the tricyclic acid cycle (Johannsen and Ravussin, 2009).
Therefore, it would be interesting to study if surgical stress induces changes in
mitochondrial function and contribute to decreased energy production in the form of
ATP.

58
1.6 Hypothesis
Stress induced hyperglycaemia is common in patients having major surgery and the
development of POIR and hyperglycaemia has been associated with poor postoperative
outcomes. Minimising the effects of insulin resistance and managing perioperative
changes in metabolism has been shown to be improve outcomes in surgical care. In this
context, ERAS principles may help to attenuate the undesirable consequences of the
metabolic response to critical illness and enhance anabolic activity during recovery.
Evidence from studies using the ERAS pathway report that perioperative interventions
such as reduced fasting times, preoperative carbohydrate treatment and early enteral
nutrition are associated with improved postoperative outcomes. However, the
mechanisms that link insulin resistance to surgical stress remain to be determined and
how these perioperative interventions attenuate the effect of surgical stress remains to
be largely explored.
Previous studies in surgical patients looking at the gene expression changes in skeletal
muscle during surgery suggested a possible role for inflammation in the development of
insulin resistance (Witasp et al., 2009b). Studies have reported increases in plasma
concentrations of stress hormones after surgery (Thorell et al., 1993, Thorell et al., 1994),
and plasma concentrations of pro-inflammatory cytokines have been shown to positively
correlate with the degree of insulin resistance after surgery (Baigrie et al., 1992, Shenkin
et al., 1989). These studies suggest the possible role of inflammation and surgical stress
in the development of POIR.

59
A recent randomised study on the molecular mechanisms underlying the protective
effects of preoperative feeding using an oral nutrition supplement (ONS) containing
carbohydrates, glutamine and antioxidants has shown a significant decrease in muscle
PDK4 mRNA, and PDK4 protein expression in the ONS group (Awad et al., 2010). Whilst
these perioperative interventions to improve muscle insulin sensitivity in patients having
major abdominal surgery seem promising, they require further evaluation of the
molecular mechanisms involved, to confirm their efficacy for perioperative risk reduction
and to optimise treatment of patients having surgery.
Figure.1.7 showing the potential role of surgical stress induced changes in
Akt/FOXO/PDK4 signalling in causing postoperative muscle insulin resistance
Cytokines / Gut permeabilitySurgical stress
PDK4
Pyruvate Dehydrogenase ComplexCarbohydrate oxidation
Nucleus
Postoperative insulin resistance

60
One possible hypothesis for the development of POIR and hence the theme of this
present research is as follows:
Inflammatory states such as those induced by surgical stress following major abdominal
surgery result in systemic release of cytokines and bacterial products, possibly secondary
to bacterial translocation. Therefore it is possible that the changes in the systemic
inflammatory response over time, occurring as a result of inflammation and/or infection
caused by surgical stress, may trigger changes in insulin signalling and important
downstream targets such as PDK4 and PDC activity resulting in the development of
skeletal muscle insulin resistance (fig. 1.7)
The reduction in Akt1 activity may lead to the activation of FOXO family of transcription
factors leading to an increased transcription of MAFbx, MuRF and PDK-4 causing muscle
protein breakdown and decreased carbohydrate oxidation (through PDC inhibition),
respectively. The effect of surgical stress on Akt/ Foxo /PDK4 mediated protein
degradation and insulin resistance has not been studied in human skeletal muscle
previously. Therefore, the aims of this thesis were to test the aforementioned hypothesis
by examining the components of these signalling pathways, in the blood and muscle
biopsy specimens in patients undergoing major elective open abdominal surgery.

61
1.7 Aims
The aims of this this thesis were three-fold,
(1) To examine the evidence behind the principles of ERAS pathway and the effect of
preoperative carbohydrate drinks on postoperative outcomes, in patients undergoing
major abdominal surgery using a systematic review and meta-analytical approach
(2) To study the molecular basis of the metabolic response to surgery underlying the
development of postoperative muscle insulin resistance with particular emphasis on
changes in insulin signalling and mitochondrial function. Specifically, to investigate
whether alterations in the insulin mediated, Akt/FOXO and PDK4 signaling pathway
underlies the development of insulin resistance following surgical stress and whether
these changes in the signaling mechanisms are associated with increased inflammatory
gene expression in skeletal muscle and
(3) To study the effect of interventional strategies such as preoperative carbohydrate
drinks and dichloroacetate in attenuating the development of POIR and the resultant
changes in the underlying molecular mechanisms, in patients undergoing major
abdominal surgery.

62
Chapter 2
Analytical Methods

63
2.1 Human Volunteers
Patients who were having major abdominal surgery were contacted and given detailed
information about the studies. Those who expressed interest in the study were invited
for a screening visit after an overnight fast (from 22.00 on the night prior to experimental
day). On arrival, patients completed a general health questionnaire and when considered
to satisfy the eligibility criteria, a written informed consent was obtained for the patients
to be included in the studies. Data were collected for demographics, height, weight,
blood pressure, nutrition status, clinical diagnosis and surgical procedure planned,
following which serial blood samples were taken and an oral glucose tolerance test
(OGTT) was performed during the screening visit. The OGTT was repeated again on the
second day after surgery, to assess postoperative insulin resistance. The studies were
approved by the Cambridgeshire Medical Research Committee and NHS Ethics
Committee and performed at Nottingham University Hospitals Queen’s Medical Centre .
2.2 Blood sampling and analysis
Patients were asked to rest in a semi-reclined position on a bed while the hand was
placed into a heated box for 15 minutes at approximately 55°C, for collection of
arterialised blood samples(Gallen and Macdonald, 1990), from either the antecubital or
cephalic veins using a retrograde cannula (21 g Venflon) and subsequently transferred
into EDTA tubes, and immediately placed on ice. The line was kept patent using a slow
0.9% saline infusion, for the duration of the study. On the day of surgery, the samples
were collected about 30 minutes preoperatively and also immediately postoperatively
after skin closure. Blood samples were also obtained from the patients on the morning of
the second day after surgery, following an overnight fast. The serum was separated out

64
in a cold centrifuge at 3,000 rpm for 10 minutes and immediately frozen at −80° C until
further analysis.
2.2.1 Blood glucose
Blood glucose was collected from patients who participated in the studies (chapters 5
and 6), and immediately introduced into an automated analyser, to measure the
concentration of whole blood glucose.
2.2.2 Plasma Insulin
Plasma insulin levels were measured using an ELISA kit from Mercodia (Uppsala,
Sweden). The enzyme-linked immunosorbent assay (ELISA) assay principle is detailed
below (fig 2.1).
Figure 2.1
A microplate pre-coated with
capture antibody is provided.
Samples or standards are added and
any analyte present is bound by the
immobilised antibody. Unbound
materials are washed away.
A second HRP-labeled antibody
(detection antibody) is added and
binds to the captured analyte.
Unbound detection antibody is washed
away.

65
Principle of the procedure
Mercodia Insulin ELISA is a solid phase two-site enzyme immunoassay. It is based on the
direct sandwich technique in which two monoclonal antibodies are directed against
separate antigenic determinants on the insulin molecule. During incubation insulin in the
sample reacts with peroxidase-conjugated anti-insulin antibodies and anti-insulin
antibodies bound to microplate wells. A simple washing step removes unbound enzyme
labelled antibody. The bound conjugate is detected by reaction with 3,3’,5,5-
tetramethylbenzidine (TMB). The reaction is stopped by adding acid to give a colorimetric
endpoint that is read spectrophotometrically at 450 nm.
Tetramethylbenzidine (TMB)
substrate solution is added to the
wells and a blue colour develops in
proportion to the amount of analyte
present in the sample. Colour
development is stopped turning the
colour in the wells to yellow. The
absorbance of the colour at 450 nm
is measured.

66
2.2.3 Plasma Free Fatty Acid
Extraction methods are widely used for the colorimetric determination of non-esterified
fatty acids (NEFA) in serum. NEFA are converted to their copper salts that are extracted
into an organic solvent. The salts are then complexed with a dye for purposed of
colorimetric measurement. Alternatively, extracted NEFA are titrated with standard alkali
to an acid base indicator endpoint. These approaches are time consuming, hazardous and
not easily automated. Wako has made extensive studies of NEFA quantitation and has
succeeded in developing an original enzymatic method which is available in a series of
individual reagents. This enzymatic method is accurate, precise, simple and fast. The
need for an extraction step has been eliminated and the method can be automated.
The Wako enzymatic method (Wako HR series NEFA-HR2; in vitro enzymatic calorimetric
assay, Wako Diagnostics, USA), relies upon the acylation of coenzyme A (CoA) by the fatty
acids in the presence of added acyl-CoA synthetase (ACS). The acyl-CoA thus produced is
oxidized by added acyl-CoA oxidase (ACOD) with generation of hydrogen peroxide, in the
presence of peroxidase (POD) permits the oxidative condensation of 3-methy-N-ethyl-
N(β-hydroxyethyl)-aniline (MEFA) with 4-aminoantipyrine to form a purple coloured
adduct which can be measured colorimetrically at 550 nm.

67
2.2.4 Plasma Cortisol
Cortisol, also known as hydrocortisone, is the primary glucocorticoid produced and
secreted by the adrenal cortex. It is found either free or bound to corticosteroid-binding
globulin (CBG) in the blood. Cortisol is involved in glucose homeostasis, inflammation,
hypersensitivity, immunosuppression, and disease resistance.
The steps for plasma cortisol assay are as follows:
· Prepare all reagents, standard dilutions, and samples as directed in the product insert.
· Remove excess microplate strips from the plate frame, return them to the foil pouch
containing the desiccant pack, and reseal.
Calibrator Diluent · Add 150 µL of Calibrator Diluent to the
non-specific binding (NSB) wells.
· Add 100 µL of Calibrator Diluent to the
zero standard (B0) wells.
100 µL Standard, Control, or Sample · Add 100 µL of Standard, control, or
sample to the appropriate wells.
50 µL Conjugate
· Add 50 µL of Conjugate to all wells.

68
50 µL Primary Antibody Solution ·
Add 50 µL of Primary Antibody Solution to each well (except the NSB wells). Cover with a
plate sealer, and incubate at room temperature for 2 hours on a horizontal orbital
microplate shaker.
· Aspirate each well and wash, repeating the process 3 times for a total of 4 washes.
200 µL Substrate Solution · Add 200 µL Substrate Solution to each
well. Incubate at room temperature for 30
minutes on the benchtop. PROTECT FROM
LIGHT.
50 µL Stop Solution · Add 50 µL of Stop Solution to each well.
Read at 450 nm within 30 minutes. Set
wavelength correction to 540 nm or 570
nm.

69
2.2.5 Plasma cytokines
Plasma TNF-α, and IL-6 were measured using ELISA Quantikine Human kits from R & D
Systems (Minneapolis, USA). The Quantikine Human TNF-alpha Immunoassay is a 3.5 or
4.5 hour solid phase ELISA designed to measure human TNF-α in cell culture supernates,
serum, and plasma. It contains E. coli-derived recombinant human TNF-alpha and
antibodies raised against this protein. It has been shown to accurately quantitate the
recombinant factor. Results obtained with naturally occurring TNF-α samples showed
linear curves that were parallel to the standard curves obtained using the Quantikine kit
standards. These results indicate that this kit can be used to determine relative mass
values for natural human TNF-α.
The Quantikine Human IL-6 Immunoassay is a 4.5 hour solid phase ELISA designed to
measure IL-6 in cell culture supernates, serum, and plasma. It contains recombinant
human IL-6 and antibodies raised against recombinant human IL-6 and has been shown
to accurately quantitate the recombinant factor. Results obtained using natural IL-6
showed linear curves that were parallel to the standard curves obtained using the E. coli-
expressed Quantikine kit standards. These results indicate that this kit can be used to
determine relative mass values for natural human IL-6.
2.3 51Cr-EDTA gut permeability test
For the study described in chapter 5, a 51Cr-EDTA gut permeability test using an oral
preparation containing 1.8 MBq of 51-chromium labelled ethylene-diamine-tetra-acetate
(51Cr-EDTA), (Department of Medical Physics, University of Nottingham, U.K.) in 100 mL
of water was performed during the screening visit and on the 2nd postoperative day. 24
hour urine sample was collected and a small sample of urine was counted for

70
radioactivity by a γ-scintillation counter in triplicate (IGE Millennium VG camera with
Hawkeye CT and Wallac Wizard 3 automatic gamma counter). Results were expressed as
the percentage urinary excretion of the orally administered dose of 51Cr-EDTA.
2.4 Muscle Sampling
Muscle biopsies of approximately 100 – 200 mg, were taken from rectus abdominis and
vastus lateralis muscles at the beginning and at the end of surgery, using a conchotome,
whilst the patients were under the effect of general anaesthesia. Another biopsy from
vastus lateralis was obtained on the second day after surgery in chapter 5, using 1%
lignocaine local anaesthesia. The samples obtained were dissected free of connective
tissue and fat and were immediately snap-frozen in liquid nitrogen for future analysis.
The specimens obtained at the end of surgery were taken from the contralateral side to
avoid false measurements due to local tissue injury.
2.5 Muscle mRNA and protein analysis
2.5.1 Real-time quantitative polymerase chain reaction (PCR)
Overview of quantitative real-time PCR
The technique of real-time PCR is a widely-used method for rapidly and accurately
quantifying selected mRNA transcripts in a sample, and was first developed in the early
1990s by Higuchi et al. (Higuchi et al., 1993). It is used to detect the products of PCR as
they accumulate after each thermal cycle, without interfering with the reaction itself.
Reverse transcription PCR (RT-PCR) enables the reverse transcription of a desired RNA
template into single-stranded cDNA, followed by its exponential amplification. Two
synthetic DNA oligonucleotides, designed to be complementary in sequence to opposite

71
ends of the amplicon of interest, are annealed to the DNA template, after first heating
the reaction mixture to allow strand separation. In the presence of the four
deoxyribonucleoside triphosphates, DNA polymerase synthesises new DNA from the two
primers in a 5’ to 3’ direction (Figure 2.2). This process is repeated, resulting in the
exponential amplification of the amplicon product.
Figure 2.2: A diagrammatic representation of the steps of the PCR reaction and the role of
TaqMan probes in real time PCR.
In real-time PCR, using a fluorogenic-labelled DNA oligonucleotide probe, the reaction
can be monitored over time. TaqMan probes are short oligonucleotides that are
constructed with a fluorescent reporter dye and a corresponding quencher dye at each
end and designed to hybridise to the target strand within the boundaries of the
amplicon. When the probe is intact, the proximity of the quencher greatly reduces the
fluorescence emitted by the reporter dye, by a process known as Fluorescence
Resonance Energy Transfer (FRET). During the PCR, the DNA polymerase extends the DNA
strand from the annealed primers until it encounters the TaqMan probe downstream of

72
the primer. The 5’ exonuclease activity of DNA polymerase is used to cleave the TaqMan
probe to remove the nucleotides and proceed with polymerisation. This process
physically separates the reporter dye from the quencher dye, thus increasing reporter
dye signal. Additional reporter dye molecules are cleaved from their probes with each
PCR cycle, resulting in an increase in fluorescence intensity, which can be detected
spectrophotometrically.
By measuring the increase in fluorescence emission after each thermal cycle, the kinetics
of the PCR reaction can be monitored in real time. Generally, there are three main
phases during amplification: the exponential, linear and plateau phase (Figure 2.3).
Figure 2.3: Example of a real-time PCR plot showing the three main phases of the
reaction; the exponential, linear and plateau phase. A threshold of fluorescence is set in
the exponential phase, and the cycle number at which reporter emission of the sample
reaches this threshold is reported as the cycle threshold (Ct) value.
Initially, fluorescence levels are lower than can be detected, but increase with each cycle
number, proportional to the amount of amplicon produced. It is during the exponential
phase (when amplicon number is doubling every cycle (assuming 100% efficiency) that
samples can be analysed, where the fluorescence detected is directly proportional to the
quantity of cDNA in the sample. A threshold value of fluorescence is set in the

73
exponential phase of the reaction, and the cycle number at which this is reached is
reported as the cycle threshold (Ct) value. Thus, the higher the quantity of cDNA in the
sample at the beginning of the reaction, the sooner the threshold value of fluorescence
will be reached.
Relative quantification of mRNA from the Ct data is performed using the standard curve
or the comparative Ct method (see User Bulletin No. 2 for ABI Prism 7700 Sequence
Detection System (P/N 4303859); Applied Biosystems). The standard curve method
involves analysis of a serially diluted standard on each plate examined. Samples are
expressed as a fold change relative to the undiluted standard (unless the standard
concentration is known, in which case absolute quantification of mRNA is possible). This
method requires less optimisation than the Ct method, but relies on accurate pipetting of
the standard and for absolute quantification, accurate determination of the standard
concentration. The comparative Ct method relies upon an endogenous reference to
quantify RNA rather than a standard curve. Relative quantification is based on changes in
steady-state mRNA levels of the target gene, relative to levels of an endogenous control
(a housekeeping gene). Relative expression of target mRNA between two groups can be
determined by the formula:
Relative amount of target mRNA = 2-ΔΔCt
Where: ΔΔCt = ΔCttreatment group – ΔCtcontrol group
and: ΔCt = Cttarget gene – Ctendogenous reference
i.e. the normalisation of ΔCt of the treatment group to the mean ΔCt of the control
group, with ΔCt being the difference between the threshold cycle of the gene of interest
and the endogenous control. The advantages of the comparative Ct method are that a

74
standard curve is not necessary for each plate, and sample-to-sample variations in RT-
PCR efficiency and pipetting errors are corrected by use of the endogenous reference.
However, for the 2-ΔΔCt formula to be valid, the amplification efficiency of the target and
endogenous reference has to be approximately equal. The chosen housekeeping gene
chosen (HMBS) is crucial to the reliability of the results.
Appropriate housekeeping genes chosen for use as an endogenous reference are
generally those that are required for the maintenance of the cell, are ubiquitously
expressed, and are transcribed at a relatively constant level. Importantly, their
expression levels must not be affected by experimental conditions. Common
housekeeping genes include 18S RNA, β-actin, glyceraldehyde 3-phosphate
dehydrogenase (GAPDH) and albumin. In these studies, the housekeeping gene
hydroxymethylbilane synthase (HMBS), also known as porphobilinogen deaminase
(PBGD) was used as an endogenous reference for its Ct consistency through all the
experiments. HMBS exists in two isoforms (Chretien et al., 1988); one is expressed in
erythrocytes where it is involved in haem biosynthesis, and the other is expressed
ubiquitously, and has been suggested to be a reliable endogenous reference for use in
real-time PCR (Fink et al., 1999).
2.5.2 Muscle total RNA isolation
Total RNA was extracted from frozen wet muscle samples (20-30 mg) by homogenisation
using a polytron homogeniser for 30 s, in 800 μl ice-cold Tri Reagent® (Sigma-Aldrich,
Poole, UK) containing 10 μg/μl glycogen solution (Sigma-Aldrich, Poole, UK). The
homogenate was incubated at room temperature for 5 min then treated with a 160 μl
mixture of chloroform: isoamyl alcohol in a ratio of 49:1. Samples were shaken vigorously

75
for 30 s. Following incubation at room temperature for 2-3 min, the homogenate was
centrifuged at 12,000 g for 15 min at 4oC. The aqueous phase, containing RNA separated
from contaminating protein, was collected, and RNA was precipitated using ice-cold
isopropanol (Sigma-Aldrich, Poole, UK) at 1:1 water phase:alcohol. Samples were kept at
-20o C overnight to increase precipitation yield and subsequently pelleted by
centrifugation (12,000 g, 15 min). The RNA-containing pellets were left to dry at room
temperature for 5 min and washed in 800 μl of 75% ethanol, before being respun at
10,000 g for 10 min. The pellets were air-dried to remove ethanol and resuspended in 35
μl of RNase-free water. Total RNA was quantified through spectrophotometric
measurement at 260 nm and 280 nm, and RNA quality determined by the 260:280 nm
ratio.
2.5.3 cDNA synthesis (reverse transcription)
Extracted total RNA samples were diluted with RNase-free water to 0.1 μg/μl and reverse
transcription was carried out using 1 μg RNA. Total RNA was first incubated at 70o C for 5
min on a thermocycler (Eppendorf) in the presence of 1 μl random primers (500 μg/ml;
Promega, Madison, USA), to denature secondary structures and allow primers to anneal.
Reverse transcription was performed using 1 μl Maloney murine leukaemia virus (MMLV)
reverse transcriptase (200 U/μl), 5 μl of MMLV reverse transcriptase buffer, 0.5 μl of
RNase inhibitor (40 U/μl) and 1.25 μl of a pooled nucleotide mix, containing dATP, dGTP,
dCTP and dUTP at a concentration of 10 mM each (all from Promega). Samples were
made up to 30 μl using RNase-free water, and incubated at room temperature for 10
min, followed by 1 hr at 42oC for the reverse transcription reaction to occur, and finally

76
15 min at 70oC to inactivate the reverse transcriptase enzyme. Newly synthesised cDNA
samples were subsequently diluted 4-fold with RNase-free water and stored at -80o C.
2.5.4 Real-time Quantitative PCR
The housekeeping gene PBGD (Porphobilinogen deaminase) is amplified for
normalization of the data.
A PCR reaction mixture was set up in a 96-well PCR plate, with 2 µl cDNA template, in a
total reaction volume of 25 µl, consisting 1.25 µl primer/probe mix, 12.5 µl PCR Master
Mix (Eurogentec, Qiagen) and 8.75 µl RNase-free water. Reactions for all samples as well
as a non-template control and ‘RT-minus’ was performed in duplicate on the ABI Prism
7000 Sequence Detection System (Applied Biosystems). Parameters for PCR includes 1
cycle of 50o C for 2 min, 1 cycle of 95o C for 10 min followed by 40 cycles of 95o C for 15 s
and 60o C for 1 min. For FOXO1, a slightly different template was used for Taqman: 1
cycle of 50o C for 2 min, 1 cycle of 95o C for 15 min then 45 cycles of 76o C for 30 s, 94o C
for 15 s and 56o C for 30 s.
RT-PCR involves reverse transcription of an RNA template into single-stranded cDNA,
followed by its exponential amplification in a PCR reaction. Reverse transcription
followed by PCR is an effective method of detecting and quantifying mRNA in a sample.
Sensitivity, reproducibility and specificity are key factors for successful RT-PCR in the
analysis of gene expression. Relative quantification is based on changes in steady-state
mRNA levels of the target gene, relative to levels of an endogenous control (a
housekeeping gene). An ‘RT-minus’ control is included in the PCR reaction, to confirm
that no contaminating DNA is present.

77
During PCR, fluorescence is detected for each temperature cycle, which at the start is
lower than can be detected, and increases with each cycle number to eventually cross a
threshold fluorescence value. The cycle number where this occurs is defined as Ct, and
this always takes place during the exponential phase of amplification. The number of
copies of amplicon should double with every cycle, and the fluorescence detected is
directly proportional to the quantity of cDNA in the sample. The higher amount of cDNA
in the sample at the beginning of the reaction, the fewer number of cycles it takes to
reach the threshold fluorescence value, therefore the lower the Ct value. The amount of
amplified target is directly proportional to the amount of starting material only during
the exponential phase of the reaction. Relative expression between two groups can be
determined by: 2-ΔΔCt; where ΔΔCt = (Cttarget - CtPBGD)LPS - (Cttarget -
CtPBGD)Control and is the normalization of ΔCt of the sample to the average ΔCt of the
control group, with ΔCt being the difference between the average threshold cycle of the
endogenous control and gene of interest.
The ΔΔCt method was used to determine the relative quantification of gene expression in
the studies. Ct values for sample duplicates were averaged and the ΔCt determined by
subtraction of the average Ct value for the housekeeping gene, PBGD. This was done for
treated and control samples. ΔΔCt was calculated using 2 to the power of the difference
in ΔCt between samples, or the ΔCt of treated samples minus the mean ΔCt of controls,
and fold changes in mRNA expression for each gene from samples obtained before and
after surgery was calculated using the expression 2-ΔΔCt.

78
2.5.5 Taqman analysis
Taqman primer and probe (FAM) sets are obtained from Applied Biosystems (Foster City,
California, USA). Primer/probe sequences are not available due to protection of
intellectual property rights, but are designed to span across exon/exon boundaries, thus
ensuring the exclusion of genomic DNA as a template in the PCR reaction. Previous work
(Constantin et al., 2010) validated the primer and probe sets, which is achieved by
performing RT-PCR with a series of 2-fold cDNA template dilutions to generate standard
curves of Ct against log relative concentration. Given that all primer/probe sets amplified
cDNA with equal efficiency (data not shown), the comparative Ct method is used for the
relative quantification of gene expression. Specificity was assured by using TaqMan
probes that spanned only over exon-exon boundary within each unique transcript. A
minus RT reaction was amplified regularly along with the transcripts of interest to
identify the presence of genomic DNA, if any. The size of amplicon generated was
determined by electrophoresing the PCR products on 3% agarose and comparing it to the
theoretical size. Sensitivity of the gene expression assays were determined by serial
dilation curves of a known amount of cDNA. As a thumb rule 5 ng of cDNA could elicit
reliable amplification curves (Ct around 35) of low expressed transcripts.
Reactions for all samples as well as a non-template control and ‘RT-minus’ are performed
in duplicate on the ABI Prism 7700 Sequence Detection System (Applied Biosystems). A
PCR reaction mixture is set up in a 96-well reaction plate, with 2 μl of cDNA template in
each well, in a total reaction volume of 25 μl, consisting 1.25 μl of primer/probe mix, 12.5
μl of PCR Universal Master Mix (Eurogentec) and 8.75 μl of RNase-free water. Parameters
for the PCR reaction include 50o C for 2 min, 95oC for 10 min followed by 40 cycles of 95o

79
C for 15 s and 60o C for 1 min. The Ct values for each duplicate are averaged and the ΔCt
calculated by the subtraction of the corresponding mean Ct value for the normalization
gene HMBS. Data from all treatment groups are normalised to the average of the saline
control group.
2.6 Western blotting
2.6.1 Overview of Western blotting protocol
Western blotting is a routine technique used for the analysis of protein expression and
phosphorylation status that was first introduced by Towbin et al. in 1979 (Towbin et al.,
1979). The technique involves the use of specific antibodies to identify proteins that have
been separated according to their size by gel electrophoresis. After separation, proteins
are transferred to a membrane, which replicates the pattern of proteins on the gel,
allowing their detection on the membrane surface. It is the specificity of the interactions
between antibody and antigen that enables the target protein to be detected within the
sample.
Sodium dodecyl sulphate polyacrylamide gel electrophoresis (SDS-PAGE) is a standard
method used to separate proteins according to their molecular weight. Following
extraction from tissues, protein samples are diluted in a buffer containing SDS, an anionic
detergent used to denature and solubilise proteins. The function of SDS is to bind to the
polypeptide backbones so that they become negatively charged. SDS binds specifically in
a mass ratio of 1.4:1; therefore the negative charge on the polypeptide will be roughly
proportional to its length, ensuring that migration speed through the gel is determined
by the molecular weight of the protein. Samples may also be treated with DTT to reduce
disulphide bridges. Polyacrylamide gels are a neutrally charged, hydrophilic network of

80
long hydrocarbons cross-linked by methylene groups. The size of pore created in the gel
can be controlled by the total amount of acrylamide and cross-linker present, which
ultimately determines the separation of molecules within the gel Proteins are individually
separated by passing a current through the separating gel in a chamber containing an
SDS-containing migration buffer.
Following electrophoresis, the negatively-charged proteins in the gel are transferred, by
application of an electrical current, onto a membrane, which provides a sturdy support
for protein detection. The most commonly used membranes are polyvinylidene fluoride
(PVDF) and nitrocellulose. Membranes are placed next to the gel, sandwiched between
absorbent materials and clamped between solid supports to maintain tight contact
between the gel and membrane. Following transfer, membranes are blocked with either
non-fat milk or BSA to prevent any non-specific background binding of antibodies to the
membrane surface. The steps following blocking include incubation with a primary
antibody specific for the protein of interest, washing of the membrane and incubation
with a secondary antibody. Secondary antibodies are typically conjugated to enzymes
that allow for signal amplification and visualisation of the protein bands. Horseradish
peroxidase (HRP) is often used, which can be reacted with a chemiluminescent substrate,
producing light as a byproduct. The signal intensity should correlate with the abundance
of the protein on the membrane.
2.6.2 Extraction of muscle proteins
Cytosolic and nuclear proteins were extracted using a modification of the method by
Blough et al. (1999). Approximately 30 mg of frozen wet tissue was homogenised for 30 s
in 20 volumes of homogenisation buffer containing: 50 mM Tris-HCl, 1 mM EDTA, 1 mM

81
EGTA, 1% (v/v) IGEPAL and 0.1% (v/v) 2-mercaptoethanol (pH 7.5). To every 1 ml of
homogenisation buffer, 10 μl of a protease inhibitor and a phosphatase inhibitor cocktail
(Sigma-Aldrich, Poole, UK) was added. Muscle lysates were left on ice for 15 min before
being centrifuged (10,000 g, 5 min at 4o C). The supernatant, containing cytosolic
proteins, is stored at -80oC. The remaining pellet was resuspended in 500 μl of an ice-cold
buffer containing 20 mM HEPES, pH 7.9, 25% (v/v) glycerol, 500 mM NaCl, 1.5 mM MgCl2
and 0.2 mM EDTA, pH 8.0. To this, further protease and phosphatase inhibitors are
added (10 μl/ml), and samples were incubated on ice for 30 min, mixing intermittently.
Samples were spun down (3,000 g, 5 min) and the supernatant, containing nuclear
proteins, was stored at -80o C. Extracted proteins were quantified using the Bradford
assay (Bio-Rad, UK) and diluted to a concentration of 50 μg/30 μl with 7.5 μl of 4x
NuPAGE® LDS sample buffer (Invitrogen, UK) and 3 μl of fresh DTT (77 mg/ml). Prepared
samples were heated at 70o C for 10 min before loading.
2.6.3 SDS-PAGE, transfer and Western blotting
Twenty-five μg of protein was loaded onto a NuPAGE® 4-12% Bis-Tris gel (Invitrogen, UK)
and separated by molecular weight, at a constant voltage of 200 V for 1 h, using 1x Tris-
Glycine SDS running buffer (Invitrogen, UK). A pre-stained protein marker (Bio-Rad, UK)
was loaded onto each gel to indicate approximate band size. Following electrophoresis,
proteins were transferred overnight at 4o C to a PVDF membrane, sandwiched within a
cassette consisting of two sheets of blotting paper and one sponge on either side of the
PVDF and gel (with care taken not to introduce air bubbles), and within a chamber
containing 1x Tris-Glycine plus 20% (v/v) methanol. Following transfer, equal loading of

82
samples was confirmed by Ponceau S staining of the membrane. Membranes were
subsequently blocked with 5% (w/v) BSA in 1% Tris-buffered saline (TBS) for 1 hr at room
temperature, followed by an overnight incubation at 4oC with a polyclonal rabbit primary
antibody (Cell Signaling Technology, Danvers, USA).
The following day, membranes were washed in TBS-Tween for 15 min (changing the
solution every 5 min) and incubated for 1 hr with the secondary antibody, which is HRP-
conjugated donkey anti-rabbit antibody (GE Healthcare, Little Chalfont, UK). Bands were
visualised by development with enhanced chemiluminescence (ECL) reagents (Pierce,
UK). Reagent A and B were mixed in a 1:1 ratio and pipetted onto the membrane,
ensuring complete coverage. After 2 min, membranes were blotted to remove the
detection reagents, and in the dark room, blots are exposed to X-ray film and
subsequently developed. Films were scanned and bands are quantified by densitometry
using GeneTools software (Syngene, Frederick, USA). Values were adjusted by subtracting
the background and normalized to an actin protein control for cytosolic proteins and
lamin for nuclear proteins (New England BioLabs, Hitchin, UK).
2.7 Analysis of Muscle Glycogen
2.7.1 Extraction procedure for measurement of muscle glycogen
Freeze dried powdered aliquots of muscle tissue were extracted according to the method
of Harris et al (Harris et al., 1974). Freeze-dried muscle samples of 6-10 mg of dissected
muscle fibres, devoid of all visible connective tissue and blood contamination were
powdered in a percussion pestle and mortar and aliquot weighed (2-3 mg). The muscle
metabolites were extracted from the powdered muscle using 0.5 M ice-cold perchloric

83
acid (PCA) containing 1 mM EDTA for 10 minutes maintained on ice. Proteins and
unwanted cell debris were removed by centrifugation at 22,000 g for 3 minutes at 4° C
and the resulting supernatant was neutralised with 2.2 M KHCO3 for at least 15 minutes,
producing perchlorate and carbon dioxide. The solution was centrifuged at 22,000 g for 3
minutes at 4° C and the supernatant (extract) removed and frozen at –80° C prior to
analysis.
2.7.2 Measurement of muscle glycogen content using spectrophotometery
Muscle glycogen concentrations were determined spectrophotometerically using the
methods described by Harris et al (Harris et al., 1974). The contents of these metabolites
were measured indirectly from changes in the absorbance of NADH and NADPH. Both the
oxidised and reduced forms of these reducing agents absorb light at 260 nm, while only
the reduced form absorbs light at 340 nm. The complete utilisation of the metabolite is
coupled to a reaction utilising the NAD+/NADH or NADP+/NADPH systems by means of
common intermediates (see individual assays). Metabolite concentration can then be
calculated from the recorded changes in absorbance according to the Beer- Lambert law:
C = DA / (e x d); where: A = absorbance; C = concentration (of metabolite, mmol L-1); e =
molar extinction coefficient; d = light path (cm); (1mM NADH e340nm= 6.22 cm2 mmol-1)*;
*1mM solution of NADH gives an absorbance equal to 6.22 absorbance units at 340 nm
Glycogen assay
Principle:
1: Glu + ATP HK Glu 6-P + ADP
2: Glu 6-P + NAD+ G6PDH P-gluconolactone + NADH

84
Muscle glycogen extract was removed from –80° C storage, fast thawed under hot water,
vortexed and stored on ice. Glucose assay buffer containing 32 % G1 (Triethanolamine
(100 mM), KOH (40 mM), MgAC2.4 H2O (30 mM), EDTA.Na2.2 H2O (1 mM), pH 8.2), 2 %
ATP (0.75 mM), 2 % DTT (1 mM), 4 % NAD+ (1 mM) and 60 % distilled water, with 40 µl of
undiluted G6PDH (Sigma-Aldrich) was prepared. Muscle extract (50 µl) or water (50 µl) or
Standard (1.5 mmol glucose; 50 µl) were transferred into a cuvette along with 250 µl of
glucose assay buffer and agitated to mix. Baseline absorbance was taken using a standard
spectrophotometer at 366 nm before 5 µl of undiluted hexokinase (HK; Sigma-Aldrich)
was added to each cuvette and agitated to mix. Absorbance changes were monitored
until the reaction reached end point, then the concentration (mmol glucosyl units kg-1 of
dry muscle) was determined using the following formula:
((V2 x (A2 – Abl2) – V1 x (A1 – Abl1)) / (SV x 3.4) x EF
Where,
V2 = final volume in cuvette (i.e. SV + Buffer + HK enzyme (µl))
A2 = absorbance value at end point
Abl2 = absorbance value of water blank at end point
V1 = initial volume (i.e. SV + Buffer (µl))
A1 = absorbance value at baseline
Abl1 = absorbance value of water blank at baseline
SV = sample volume (µl)
3.4 = 1 mM of NADH has absorbance value of 3.4 at 366 nm
EF = extraction factor (volume NaOH + HCl and Citric acid buffer + AGG / muscle powder
weight (mg))

85
2.8 Isolation and Suspension of Mitochondria from Muscle Tissue
2.8.1 Overview
In order to assay mitochondrial function in skeletal muscle, mitochondria are isolated and
re-suspended from muscle tissue immediately after extraction from the subject. Muscle
samples were obtained using a conchotome biopsy from the superficial portion of the
vastus lateralis, Mitochondria were isolated and resuspended immediately after
extraction from muscle tissue. The immediacy of the procedure, and its performance on
unfrozen tissue, reflects the necessity to maintain mitochondrial double membrane
structure. It is crucial for mitochondria to be actively respiring for maximal ATP
production rates to be assayed.
2.8.2 Laboratory Protocol
Approximately 40 mg of muscle tissue (retained on ice) was finely diced on a cooled glass
plate, and weighed in milligrams, to two decimal places (Mettler Toledo scales, model
XS105). The muscle was homogenised for 3 minutes on ice, using a pestle homogeniser
and a glass homogenisation vessel (Camlab homogeniser, model K43), in homogenisation
buffer (pH 7.2, KCl 100mM (Sigma Aldrich, UK), KH2PO4 50 mM (Sigma Aldrich, UK), Tris
50mM (Sigma Aldrich, UK), MgCl2 5mM (Sigma Aldrich, UK), EDTA 1mM (Sigma Aldrich,
UK), ATP 1.8mM (Sigma Aldrich, UK)). The crude homogenate was centrifuged at 650 g
for 3 minutes, at ~-4o C (Hettich refrigerated centrifuge, model EBA12R). The resultant
supernatant was transferred to a clean test tube and centrifuged at 15,000 g for 3
minutes, at ~-4o C. Following this, the supernatant was removed and discarded before
resuspending the mitochondria-rich pellet in the original homogenisation buffer. This was
then centrifuged at 15000 g for 3 minutes, at ~-4o C. After removal of the supernatant,

86
the pellet was resuspended in a resuspension solution (pH 7.2, HSA 0.5 mg/ml, sucrose
240 mM, monopotassium phosphate 15mM, magnesium acetate tetrahydrate 2 mM,
EDTA 0.5 mM). The mitochondrial suspension was then retained on ice prior to
mitochondrial ATP production rate analysis (MAPR), or was frozen at -80o C for other
analysis.
2.9 Mitochondrial ATP production Rate Analysis (MAPR Analysis)
2.9.1 Overview
Having produced an isolated mitochondrial suspension from muscle extract, the rates of
ATP production were determined using a luminescence technique as described by
Wibom et al. (Wibom et al., 2002). The method used in this thesis is a more accurate
method for the fact that it measures ATP directly as it is produced ex vivo, unlike the
classical method of determination either by measuring the isolated muscle’s oxygen
consumption or by measuring the activity of enzymes involved in the oxidative
phosphorylation pathway. The sensitivity obtained by this method is far greater than
measurements of oxygen consumption, as it is not affected by mitochondrial uncoupling.
Oxygen consumption is a function of complex IV of the electron transport chain. Under
normal conditions, the rate of oxygen consumption can be used to extrapolate the rate
of ATP production, as both processes are directly proportional. However, mitochondria
electron transport can become uncoupled if mitochondrial damage or membrane
perturbation has occurred. In this scenario, oxygen consumption will still occur
unhampered in the mitochondria, but no ATP will be produced in relation to this
consumption and instead heat is produced. Hence, measurements of mitochondrial
function extrapolated from oxygen consumption are prone to overestimation. Therefore,

87
direct measurement of ATP as it is produced provides an important novel insight, and
evolves previous conclusions made with indirect measurements.
The method measures the ATP production rate of isolated mitochondria in optimum
conditions. It relies on the properties of a reagent purchased from BioTherma
(BioTherma, Sweden) – a luciferase based ATP monitoring reagent. The luciferase binds
to ATP as it is hydrolysed and produces light (see reaction scheme in Fig 2.4)
Figure 2.4: Reaction Scheme for Luciferase Based ATP Monitoring Reagent.
1. Luciferin + ATP → Luciferyl Adenylate + PPi
2. Luciferyl Adenylate + O2→ Oxyluciferin + AMP + Light
Isolated mitochondria are introduced to the reagent, along with ADP and a substrate for
ATP production (e.g., Pyruvate). The substrate can be chosen in order to test
mitochondrial ability to utilise specific substrates. The substrates tested in this thesis are
thoroughly described in chapter, but for convenience they are described in the table
below. The increase in luminescence (due to the production of ATP) is monitored on a
BioOrbit 1253 luminometer (Bio-Orbit, Turku, Finland).

88
2.9.2 Laboratory Protocol
Isolated mitochondria from muscle is retained on ice, 12 cuvettes (final volume 1ml)
were made comprising of 800µl luciferase based ATP production monitoring reagent
(Lyophilized ATP monitoring reagent (BioTherma, Sweden), containing firefly luciferase,
D-luciferine 0.1g/L, L-luciferine 4mg/L, bovine serum albumin 1g/L, and Na2P2O7 1 µM)
dissolved in (sucrose 0.19M, monopotassium phosphate 19 mM, magnesium acetate
tetrahydrate 2.5 mM, EDTA 0.7 mM pH 7), 140µl of a substrate solution (described
below), 50 µl 0.6 mM ADP (Sigma Aldrich, UK), and (added last) 10 µl of diluted
mitochondrial suspension. The cuvettes were then transferred to the luminometer to
record luminescence over time. As luminescence is directly a result of the ATP content,
luminescence steadily increased as ATP was being produced by the active and intact,
isolated respiring mitochondria. After 3-5 minutes of activity, the cuvettes were injected
with 10 µl of 25 µM ATP. This is equivalent to a precise injection of 250 pmoles of ATP.
This injection triggers a burst of luminescence, which is recorded by the luminometer.
The cuvettes are then allowed to continue for a few more minutes before terminating
the experiment. Calculations are demonstrated below.
2.9.3 Substrates for ATP Production
Mitochondria are extremely versatile organelles and are capable of utilising a number of
different substrates to produce ATP. Carbohydrates and fatty acids are the main fuels,
but in this thesis we have tested mitochondria’s ability to use a number of different
substrates, to evaluate specific mechanisms of inflammation-induced pathology. The
substrates used are listed below, along with a detailed description of how they are
utilised by skeletal muscle mitochondria.
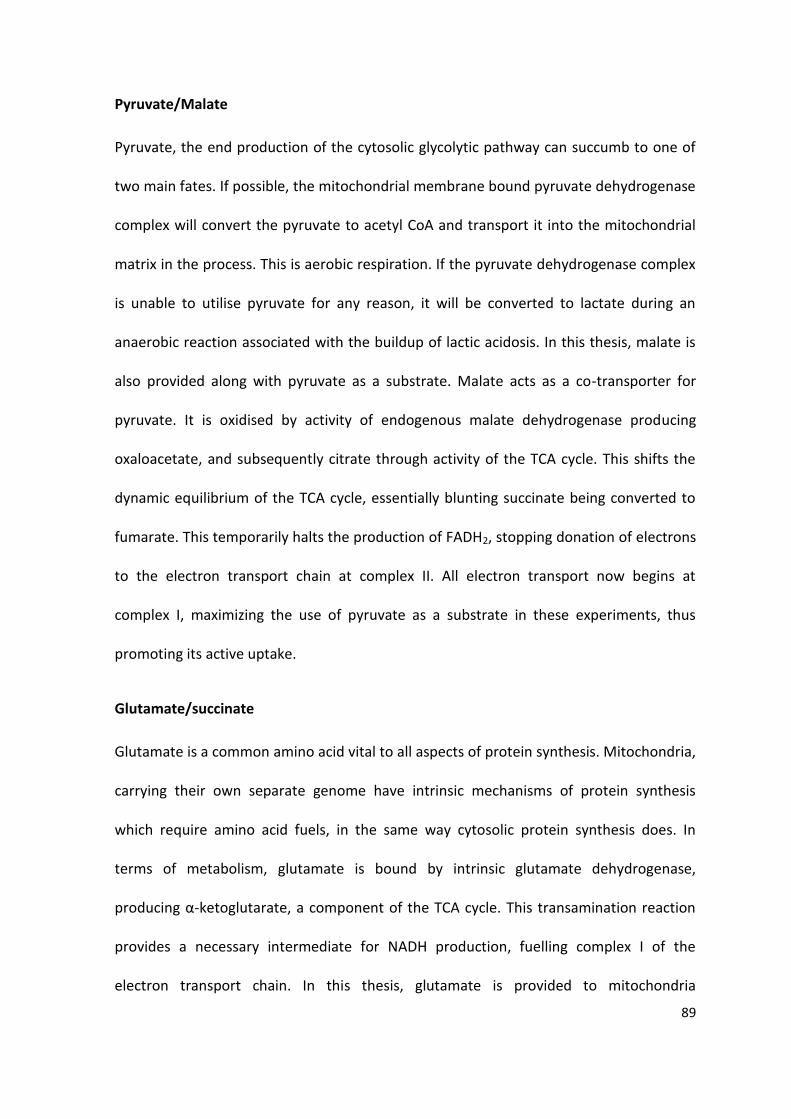
89
Pyruvate/Malate
Pyruvate, the end production of the cytosolic glycolytic pathway can succumb to one of
two main fates. If possible, the mitochondrial membrane bound pyruvate dehydrogenase
complex will convert the pyruvate to acetyl CoA and transport it into the mitochondrial
matrix in the process. This is aerobic respiration. If the pyruvate dehydrogenase complex
is unable to utilise pyruvate for any reason, it will be converted to lactate during an
anaerobic reaction associated with the buildup of lactic acidosis. In this thesis, malate is
also provided along with pyruvate as a substrate. Malate acts as a co-transporter for
pyruvate. It is oxidised by activity of endogenous malate dehydrogenase producing
oxaloacetate, and subsequently citrate through activity of the TCA cycle. This shifts the
dynamic equilibrium of the TCA cycle, essentially blunting succinate being converted to
fumarate. This temporarily halts the production of FADH2, stopping donation of electrons
to the electron transport chain at complex II. All electron transport now begins at
complex I, maximizing the use of pyruvate as a substrate in these experiments, thus
promoting its active uptake.
Glutamate/succinate
Glutamate is a common amino acid vital to all aspects of protein synthesis. Mitochondria,
carrying their own separate genome have intrinsic mechanisms of protein synthesis
which require amino acid fuels, in the same way cytosolic protein synthesis does. In
terms of metabolism, glutamate is bound by intrinsic glutamate dehydrogenase,
producing α-ketoglutarate, a component of the TCA cycle. This transamination reaction
provides a necessary intermediate for NADH production, fuelling complex I of the
electron transport chain. In this thesis, glutamate is provided to mitochondria

90
accompanied by both malate and succinate. The glutamate and malate substrate
combination acts similarly to the pyruvate and malate combination, blunting FADH2
production and limiting complex II activation. Providing glutamate and succinate together
allows activation of both complexes I and II of the electron transport chain, as succinate
is the precursor to the succinate dehydrogenase reaction, show in figure 2.5.
Figure 2.5 Mitochondrial ATP Production Rate Analysis.
The figure shows the multi stage graph generated by analysis of a single isolated
mitochondria sample, utilising a single substrate combination to produce ATP within a
cuvette. Stage 1 of the graph shows an increase in relative luminescence over time. This
increase is representational of ATP being produced by isolated mitochondria, respiring in
the luciferase reagent. After stage 1, a 150 pmol of ATP is injected into the cuvette. As a
result there is an increase in luminescence. This increase can be calculated (in relative

91
luminescence units) by extrapolating the curve in stage 3, back to the point of ATP
injection. Subsequently, this information can be used to calibrate stage 1 of the graph,
and convert ATP production in relative luminescence units/minute, to a quantity of
ATP/minute.
2.9.3 Pyruvate dehydrogenase Complex assay
PDC was measured according to Constantin-Teodosiu et al (Constantin-Teodosiu et al.,
1991). This is a radioactive assay for the determination of pyruvate dehydrogenase
complex activity in muscle tissue has been used. The assay measures the rate of acetyl-
CoA formation from pyruvate in a reaction mixture containing NAD+ and CoASH. The
acetyl-CoA is determined as [14C]citrate after condensation with [14C]-oxaloacetate by
citrate synthase. The method is specific and sensitive to the picomole range of acetyl-CoA
formed. Total pyruvate dehydrogenase complex (PDCt) activity is determined after
activation by pretreating the muscle homogenate with Ca2+, Mg2+, dichloroacetate,
glucose, and hexokinase. The precision of the method was determined by analyzing 4-5
samples of the same muscle piece. The coefficient of variation for PDCa was 8% and for
PDCt 5%.

92
Chapter 3
The enhanced recovery after surgery (ERAS) pathway for patients undergoing major
elective open colorectal surgery: A meta-analysis of randomized controlled trials

93
3.1 Introduction
Patients undergoing major open colorectal surgery traditionally undergo prolonged
rehabilitation during the postoperative period with profound changes in endocrine,
metabolic, neural and pulmonary function. Complication rates of 15-20% (Bokey et al.,
1995, Basse et al., 2000a), and even as high as 45-48% (Muller et al., 2009, Serclova,
2009) have been reported after major elective open colorectal surgery undertaken in the
setting of traditional perioperative care. This may not be surprising since many traditional
interventions that have been shown to be outdated, and even harmful, for patients
(Guenaga et al., 2009, Lobo et al., 2002a, Nelson et al., 2007, Rahbari et al., 2009, Awad
et al., 2009a) are still in use. For patients without complications, a key factor for
postoperative recovery is the return of bowel function and this is influenced by several
perioperative factors such as preoperative fasting and bowel preparation, analgesic and
anaesthetic techniques, magnitude and complications of surgery, fluid overload, and also
by the patients’ co-morbidities.
Enhanced recovery after surgery (ERAS) or ‘fast-track’ surgery pathways have been
developed to address these issues and to accelerate recovery by attenuating the stress
response so that the length of hospital stay and possibly the incidence of postoperative
complications and mortality can be reduced, with the added benefits of reducing
healthcare costs (Kehlet and Wilmore, 2002, Lassen et al., 2009b). The important
elements of ERAS and similar fast track programs in open colorectal surgery included in
these studies were factors shown to improve outcomes and many of them also
addressed traditional treatments that were proven to be outdated. These measures were

94
then amalgamated into treatment programs that included preoperative counselling, no
bowel preparation, no premedication, symbiotics administered before surgery, no
preoperative fasting but provision of clear carbohydrate enriched liquids until 2 h before
surgery, standard anaesthetic techniques, thoracic epidural anaesthesia, high inspired
oxygen concentrations, avoidance of perioperative fluid overload, maintenance of body
temperature, short/transverse incisions, non-opioid analgesia, no routine use of drains
and nasogastric decompression tubes, early removal of bladder catheters, standard
laxatives and prokinetics, and early postoperative feeding and mobilization.
It has been shown that these ‘multimodal rehabilitation’ or ‘fast-track’ surgery programs
improve surgical outcome with decreased hospitalization, increased patient satisfaction
and safety after discharge. A systematic review of three randomized controlled trials
(RCTs) and three case control trials, showed some benefits of the enhanced recovery
pathway in elective open colorectal surgery such as reduction in primary hospital stay
and morbidity (Wind et al., 2006). Three recent meta-analyses also showed a positive
influence of implementing the ERAS protocol in this group of patients (Gouvas et al.,
2009a, Eskicioglu et al., 2009a, Walter et al., 2009). However, the authors recommended
the need for further RCTs as, with a maximum of 198 randomized patients included in the
meta-analysis, the data available were too limited to draw firm conclusions. This
multimodal approach has been the subject of interest in several other non-randomized,
case controlled and prospective studies including a consensus review of optimal care
recommended by the ERAS group in patients undergoing major colorectal surgery
(Lassen et al., 2009b).

95
The purpose of the present meta-analysis of RCTs was to study the effect of ERAS
pathway in patients undergoing major elective open colorectal surgery in reducing the
length of primary hospital stay, and to examine the incidence of postoperative
complications, readmission rates and mortality.
3.2 Methods
3.2.1 Criteria for considering studies for this review
Studies comparing enhanced recovery programs with traditional perioperative care in
patients undergoing major elective open colorectal surgery were selected from the initial
search. RCTs documenting the individual elements of the ERAS pathway that were
implemented, with a minimum of four elements covering the pre-, intra- and
postoperative periods of the ERAS pathway, were subsequently included in this meta-
analysis.
Non-randomized studies, case-controlled trials, cohorts, retrospective studies and other
studies which did not fulfil the inclusion criteria were excluded.
3.2.2 Outcome measures
The primary outcome measure of this meta-analysis was length of primary hospital stay.
Secondary outcome measures were postoperative complications (total number of
patients with complications in each group), readmission rates and mortality.

96
3.2.3 Search methods for identification of studies
Electronic searches
Studies published between January 1966 and November 2009 were searched in Medline,
Embase, the Science Citation Index, the Cochrane Library and CINAHL databases. The
relevant studies were identified using the search terms colorectal surgery, colon, colonic,
colorectal, rectum. These results were combined with multimodal, fast track, enhanced
recovery, ERAS, accelerated, rehabilitation, convalescence, perioperative care and
ambulation in combination with the Boolean operators AND, OR and NOT. The ‘related
article’ function was used to identify any further articles that were eligible for inclusion in
the meta-analysis. The search included publications in all languages.
Searching other resources
The references from relevant articles were scanned and primary authors were consulted
for additional information as necessary. The authors of relevant papers were identified
from authorship of trials and review articles found in the search. Bibliographies of RCTs,
meta-analyses, and systematic reviews were hand-searched for studies that were not
captured by the initial electronic search. Experts in the subject were consulted to ensure
that no published or unpublished work had been missed.
3.2.4 Data collection and analysis
Two review authors inspected the citations identified from the search independently.
The quality of the retrieved articles was assessed separately by the two review authors

97
for inclusion according to the previously defined criteria. Any disagreement was resolved
by consensus discussions with the third member of the review team.
3.2.5 Data extraction
Data from included RCTs were extracted independently by two review authors. The
studies were assessed for the methodological quality, study design, inclusion and
exclusion criteria, reporting of outcome measures. Any missing data were obtained by
contacting the author and included in the analysis.
3.2.6 Statistical analysis
The focus of this meta-analysis was on the effect of the ERAS pathway on outcome
measures such as length of hospital stay, readmission rates, postoperative complications
and mortality, using the standard methods recommended by the Cochrane Collaboration.
Calculations of effect sizes for dichotomous variables are presented as risk ratio (RR) with
95% confidence intervals (CI) and for continuous outcomes as weighted mean differences
(WMD). Pooled analyses were performed using the random effects model with the
Mantel–Haenszel method. The random-effects method incorporates an assumption that
the different studies are estimating different, yet related, intervention effects and hence
explicitly accounts for heterogeneity. Statistical heterogeneity was assessed by
considering the I2 statistic alongside the χ2 'p' value. The I-squared statistic provides an
estimate of the percentage of inconsistency thought to be due to chance.(Higgins and
Green, 2008) The threshold values of I2 equal 25%, 50%, and 75%, representing low,
moderate, and high heterogeneity, respectively. These analyses were performed using

98
RevMan 5.0 (The Nordic Cochrane Center, The Cochrane Collaboration, Copenhagen,
Denmark).
3.3 Results
3.3.1 Eligible Studies
Six RCTs (Anderson et al., 2003, Delaney et al., 2003, Gatt et al., 2005, Khoo et al., 2007,
Muller et al., 2009, Serclova, 2009) fulfilled the inclusion criteria for the meta-analysis
(Figure 3.1), leading to a total of 452 patients, 226 in each group, being included (median
number of patients in each study 67, range 25-151). The characteristics of included
studies are presented in Table 3.1. All six studies reported appropriate randomization
methods sealed envelope in four studies (Serclova et al., 2009, Anderson et al., 2003,
Delaney et al., 2003, Gatt et al., 2005); random number generator in two (Muller et al.,
2009, Khoo et al., 2007). None of the RCTs were blinded. Due to the nature of these trials
and allocation of patients to treatment groups that become self-evident following
randomization, blinding of patient groups and observer was not always possible.
Therefore, all except one RCT (Delaney et al., 2003) had a Jadad score (Jadad et al., 1996)
of 3 (Table 3.2). Standard criteria were defined for inclusion, exclusion, length of hospital
stay, complications, readmissions and discharge in these studies. There were clear
definitions of the fast-track or enhanced recovery protocol with a minimum of 4 ERAS
elements implemented in the intervention group. The number of ERAS elements used in
all 6 RCTs, ranged from 4-12 with a mean of 9, as listed in Table 3.3. Five studies (Muller
et al., 2009, Serclova et al., 2009, Anderson et al., 2003, Delaney et al., 2003, Gatt et al.,

99
2005) reported a 30-day follow-up. In the study (Khoo et al., 2007) in which 14 day follow
up was reported, 30 day follow up data were obtained from the authors. There was no
reporting of protocol violations in three studies (Anderson et al., 2003, Gatt et al., 2005,
Khoo et al., 2007) but these were reported in the other three studies (Muller et al., 2009,
Serclova et al., 2009, Delaney et al., 2003). The use of epidurals in traditional care and
ERAS groups is illustrated in Table 3. 4.

100
Figure 3.1: PRISMA
Figure 3.1: PRISMA diagram showing selection of studies for the meta-analysis. From the
85 studies searched, six studies which fulfilled the inclusion criteria were included for the
meta-analysis.

101
Table 3.1.1: Characteristics of included studies
1. Anderson et al., 2003
Methods Consecutive series of patients, randomized into ERAS or Traditional care (TC) groups. 30 day postoperative follow up.
Participants Patients living independently at home and having left or right hemicolectomy.
Interventions Preoperative factors: Written preoperative information, preassessment by surgical registrar or anaesthetist, prebiotics (oligofructose) and probiotics (Trevis) for 7-14 days before surgery, no bowel preparation, oral carbohydrate loading.
Admitted the day before surgery, normal diet up to and including the evening meal. A drink containing 100 g carbohydrate (Maxijul) in 400 ml water at 2200 hours and 50 g in 400 ml 3-4 h before the operation. Perioperative anaesthetic factors were same in both groups.
Analgesia: Epidural sited between T7 and L1, initial bolus of 15-20 ml 0.25% bupivacaine, then continuous infusion until 24-36 h after surgery. PCA for control group.
Intraoperative factors: iv cefuroxime and metronidazole in both groups; transverse incision in optimization group; midline or paramedian incision in control group. Nasogastric tube only for decompression during surgery and removed at the end.
Postoperative factors: No nasogastric tubes or drains, free fluids on day of operation, light diet day 1, full diet day 2.
Epidural infusion (0.15% bupivacaine + fentanyl 2 µg/ml), epidural catheter removed 24 -36 h after surgery. Paracetomol 1 g qds, ibuprofen 400 mg tds, if required; parenteral morphine 5-10 mg (rescue analgesia); no oral opiates.
Chest physiotherapy, walk length of ward with physiotherapist. Encouraged to mobilise early on the evening after surgery.
Discharge criteria: Tolerating standard hospital diet, mobilizing safely around the ward, on oral analgesics.
Outcomes Twice daily patient review by the surgical research fellow or nutrition nurse specialist. Data recorded before operation and post operative days 1, 7 and 30.
Primary outcome: Length of hospital stay.
Secondary outcomes: Hand grip strength (non dominant hand),
Measures of physical function: FEV1 measured at time of surgery and when patient walked to the toilet unaided (mean distance 12.5 m),
Return of normal gastrointestinal function as indicated by the ability to tolerate a diet of three light meals a day.
Pain and fatigue scores recorded between 1100 and 2400 hours using visual analogue scale at rest, during mobilisation and coughing.

102
Table 3.1.2: Characteristics of included studies
2. Delaney et al., 2003
Methods Prospective RCT comparing a pathway of controlled rehabilitation with early ambulation and diet and traditional care after laparotomy and intestinal resection. A baseline visual analogue score, McGill pain score questionnaire (MGPQ), SF-36 and a previously validated quality of life questionnaire [Cleveland Clinic Global Quality of Life (CGQL)] were completed at randomization, discharge and postoperative days 10 and 30. Complications were determined prospectively and were reassessed by telephone follow-up or outpatient visit 30 days after surgery.
Participants All patients scheduled for elective segmental intestinal or rectal resection by laparotomy, including patients undergoing reoperation or pelvic surgery and those with comorbidities, were eligible for inclusion in the study. [5 patients (16%) in both groups had small bowel resections].
Exclusions: loop ileostomy closure and ventral hernia repair without scheduled intestinal resections.
Interventions Controlled Rehabilitation with Early Ambulation and Diet (CREAD) Protocol:
Orogastric tubes removed before extubation.
Patient controlled anaesthesia (PCA) for both groups. Analgesia supplemented with 30 mg of iv ketorolac every 6 h, as needed.
Post operative day 1, walk at least one circuit of the nursing floor (approx 60 meters) up to five times, sit out of bed between walks, regular incentive spirometry.
Non-carbonated liquids, offered solid food that evening if tolerating oral fluids.
Oral analgesia (oxycodone) on 2nd postoperative day, if either liquids or diet was tolerated, PCA was discontinued.
Discharge criteria: All patients passed flatus or stool, comfortable with oral analgesia, stand and walk unaided.
Outcomes Primary: Length of stay including readmissions and length of primary hospital stay.
Secondary: Evaluate the influence of patients' age < 70 years, effect of increasing surgeons’ experience, effect of diverting ileostomy, complication and readmission rates.

103
Table 3.1.3: Characteristics of included studies
3. Gatt et al., 2005
Methods RCT comparing a ten point multimodal optimization programme with conventional perioperative management.
Participants Consecutive patients undergoing major elective open colorectal surgery, living independently at home.
Exclusions : Failure to obtain consent, age <18 years, pregnancy, intolerance to probiotics and/or prebiotics, contraindication to one or more optimization strategy, contraindications to early postoperative discharge prescribed medications that may independently prolong hospital stay (e.g. anticoagulants), advanced malignancy on preoperative assessment, palliative surgery, emergency surgery and failure to perform colonic or rectal resection.
Interventions Ten point multimodal pathway:
Preoperative: Verbal and written preoperative information; preassessment by surgical registrar or anaesthetist, synbiotics (probiotics and prebiotics), avoidance of mechanical bowel preparation, oral carbohydrate loading and 3 h preoperative fast.
Perioperative: High inspired O2 concentrations (80%), transverse incision, no drains or nasogastric tubes
Postoperative: Early fluid and diet reintroduction, aggressive structured mobilization plan. Epidural analgesia for both groups until 24-36 h after surgery.
Discharge criteria: Tolerating three light meals a day, mobilizing safely and taking oral medications only.
Patients in the control group received none of the optimization measures. Admitted the day prior to surgery, fasted from midnight and received bowel preparation.
Outcomes Assessed twice a day and follow-up by the same researcher.
Physiological function: Spirometry (FEV1, FVC), grip strength, Physiological and Operative Severity Score for the enumeration of Mortality and morbidity(POSSUM), ASA scores, duration of catheterization, time to mobilization and fluid balance.
Psychological function: Cognitive function scoring, fatigue scoring, pain scoring and analgesic requirements.
Gut function: Time to tolerance of fluids and diet and duration of intravenous fluids.
Clinical outcome: Primary endpoint: length of hospital stay, complications and death, need for readmission, general practitioner visits.

104
Table 3.1.4: Characteristics of included studies
4. Khoo et al., 2007
Methods RCT of multimodal perioperative management protocol in patients undergoing elective open colorectal resection for cancer.
Participants All elective patients presenting with colorectal cancer; both colonic and rectal surgery; no
age limit.
Exclusions: if unable to mobilize independently over 100 m at preoperative assessment,
had contraindications to thoracic epidurals, or had pre-existing clinical depression,
palliation or other joint operations involving other surgical specialty.
Interventions All patients admitted morning prior to surgery, had standard bowel preparation (Fleet) and oral fluids up to 3 h prior to surgery. Control arm received 125 ml/h of intravenous fluids from 2200 hours.
Multimodal arm: Intravenous fluids restricted to 1500 ml unless bleeding in excess of 500 ml intraoperatively. Allowed free oral fluids immediately after the operation. Intravenous fluids discontinued when able to tolerate 200 ml of water over 30 minutes. Urine output not used to guide fluid therapy.
NG tube inserted for all patients in the multimodal group and removed in recovery. Oral feeding immediately following surgery in the multimodal, with regular domperidone, magnesium hydroxide 8% and liquid protein/calorie supplements from admission.
Thoracic epidural analgesia (TEDA) in 32 out of 35 patients. Patient controlled analgesia with morphine and cyclizine, if TEDA not possible. Epidural rate was not adjusted unless there were features of narcotization and discontinued 48 hours postoperatively. Regular oral analgesics postoperatively.
Mobilization from night of the operation and encouraged to meet predefined mobility targets. Catheters removed 24 h postoperatively following colonic resection and 72 h after total mesorectal excision.
Traditional Care: NG tube removed following morning unless there was > 200 ml of free drainage overnight.
TEDA (34 out of 35 patients) was titrated against pain and narcotization and removed when the rate was <1 ml/h. Oral analgesia given as required.
Mobilization: sat out and assisted to mobilize on 1st postoperative day, but not normally aggressively mobilized until discontinuation of the thoracic epidural.
Discharge criteria: when self-caring, stoma or bowel function, mobilizing independently (able to ambulate to toilet/bath and 100 m unassisted) and were comfortable on oral analgesia.
Outcomes Primary endpoints: Length of hospital stay, achievement of independent milestones.
Secondary endpoints: complications, readmission rates and mortality.

105
Table 3.1.5: Characteristics of included studies
5. Muller et al., 2009
Methods Multicentre study involving four teaching hospitals in northern Switzerland, RCT of fast track programme. Factors associated with significant reduction of complications (effective epidural analgesia and a stringent fluid regimen) were assessed using multivariate analysis.
Participants Patients who were older than 18 years, open elective colonic resection with a primary anastomosis.
Exclusion criteria: Emergency operations, contraindications to epidural anaesthesia, scheduled total colectomy or rectum resection, preoperatively immobile patients.
Interventions Both groups had thromboprophylaxis and antibiotics, no bowel preparation, patients were allowed to drink up to 4 hours prior to surgery. Standard anaesthetic procedures, median laparotomy, no nasogastric tubes or drains were used postoperatively in both the groups.
Fast track programme: Restricted fluid regime consisting of preoperative loading with Ringer’s lactate at 1 ml/kg/h and nil by mouth, with an intra-operative substitution of 5 ml/kg/h. All fluids discontinued on 1st postoperative day, unless any medical reason to continue. Additional fluid or vasopressors were given when mean arterial pressure <60 mm Hg or urine output 0.5 ml/kg/h.
Start drinking immediate postoperative period in fast track group. Two additional protein drinks were permitted for first 3 days and resume oral nutrition by day 1. Patients in the standard group were allowed to drink on day 2, increasing oral nutrition on day 2, with possible full oral nutrition by day 4.
Early mobilization in both groups.
Criteria for insertion of NG tube: 2 consecutive episodes of vomiting greater than 400 ml.
Epidural with ropivacaine 0.33% or bupivacaine 0.25% was placed at T6-9 preoperatively and removed on 2nd postoperative day. (61 out of 76 in fast-track and 59 out of 75 patients in control group had epidurals). Thereafter intravenous paracetamol only.
Discharge when fully mobile, pain controlled by oral analgesics only, tolerance of oral food and patients felt comfortable on discharge. Sufficient oral intake, when patients take more than 2/3 of daily meal.
Outcomes Primary end point: Total complications (general and surgical) occurring until 30 days after surgery. (Telephone follow-up if necessary).
Secondary end point: Median hospital stay, readmission rate, anastomotic leak.
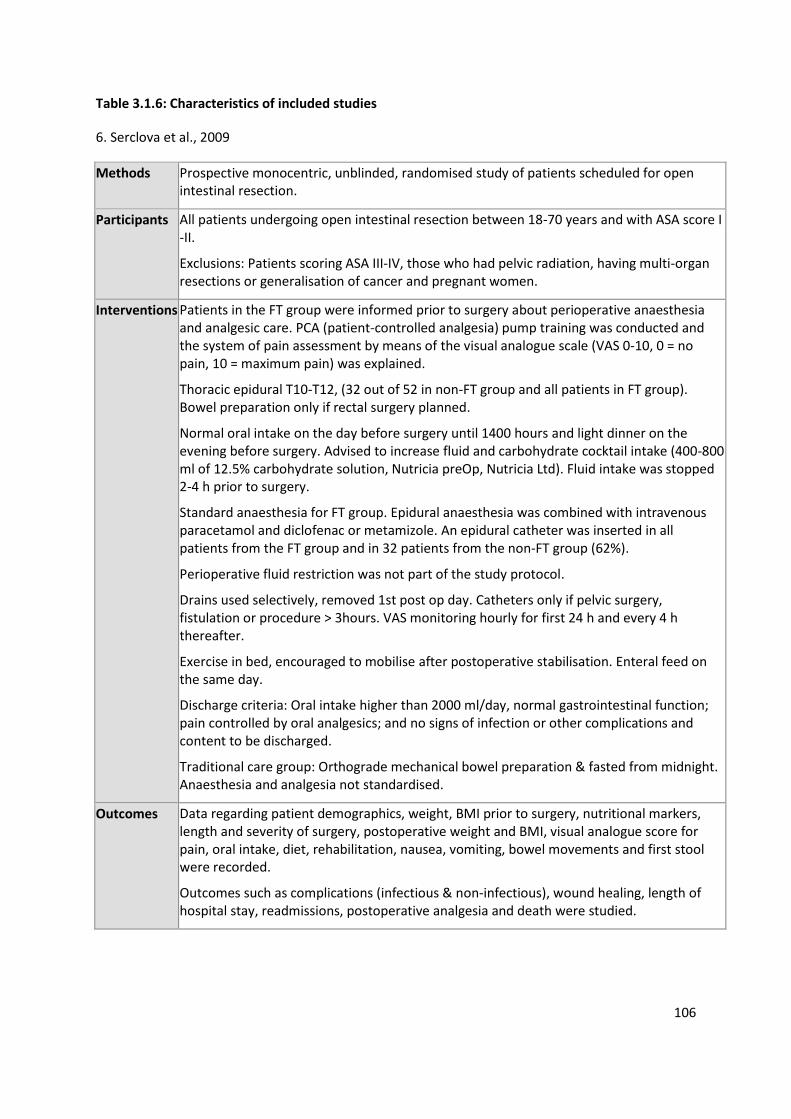
106
Table 3.1.6: Characteristics of included studies
6. Serclova et al., 2009
Methods Prospective monocentric, unblinded, randomised study of patients scheduled for open intestinal resection.
Participants All patients undergoing open intestinal resection between 18-70 years and with ASA score I -II.
Exclusions: Patients scoring ASA III-IV, those who had pelvic radiation, having multi-organ resections or generalisation of cancer and pregnant women.
Interventions Patients in the FT group were informed prior to surgery about perioperative anaesthesia and analgesic care. PCA (patient-controlled analgesia) pump training was conducted and the system of pain assessment by means of the visual analogue scale (VAS 0-10, 0 = no pain, 10 = maximum pain) was explained.
Thoracic epidural T10-T12, (32 out of 52 in non-FT group and all patients in FT group). Bowel preparation only if rectal surgery planned.
Normal oral intake on the day before surgery until 1400 hours and light dinner on the evening before surgery. Advised to increase fluid and carbohydrate cocktail intake (400-800 ml of 12.5% carbohydrate solution, Nutricia preOp, Nutricia Ltd). Fluid intake was stopped 2-4 h prior to surgery.
Standard anaesthesia for FT group. Epidural anaesthesia was combined with intravenous paracetamol and diclofenac or metamizole. An epidural catheter was inserted in all patients from the FT group and in 32 patients from the non-FT group (62%).
Perioperative fluid restriction was not part of the study protocol.
Drains used selectively, removed 1st post op day. Catheters only if pelvic surgery, fistulation or procedure > 3hours. VAS monitoring hourly for first 24 h and every 4 h thereafter.
Exercise in bed, encouraged to mobilise after postoperative stabilisation. Enteral feed on the same day.
Discharge criteria: Oral intake higher than 2000 ml/day, normal gastrointestinal function; pain controlled by oral analgesics; and no signs of infection or other complications and content to be discharged.
Traditional care group: Orthograde mechanical bowel preparation & fasted from midnight. Anaesthesia and analgesia not standardised.
Outcomes Data regarding patient demographics, weight, BMI prior to surgery, nutritional markers, length and severity of surgery, postoperative weight and BMI, visual analogue score for pain, oral intake, diet, rehabilitation, nausea, vomiting, bowel movements and first stool were recorded.
Outcomes such as complications (infectious & non-infectious), wound healing, length of hospital stay, readmissions, postoperative analgesia and death were studied.

107
Table 3.2: Quality assessment and study design
RCT
No of patients Age (years), Median (Range)
Follo
w-u
p (
day
s)
Co
nse
cuti
ve s
eri
es
of
pat
ien
ts
All
oca
tio
n
con
ceal
me
nt Method of
randomization
described &
appropriate Blin
din
g
De
scri
pti
on
n o
f d
rop
ou
ts &
w
ith
dra
wal
s
Jadad Score
ERAS Traditional
care ERAS Traditional care
Anderson et al., 2003
14 11 64 (55-68) 68 (65-75) 30 Yes No Yes Not blinded
Yes 3
Delaney et al., 2003
31 33 50.6±16.9 (mean±sd)
41.9±13.3 (mean±sd)
30 Yes No Yes Not blinded
No 2
Gatt et al., 2005
19 20 67 (59-76) 67 (60-73) 30 Yes No Yes Not blinded
Yes 3
Khoo et al., 2007
35 35 69.3
(46-88)
73
(46-85)
10-14
Yes No Yes Not blinded
Yes 3
Muller et al., 2009
76 75 62
(27-91)
59
(39-89) 30 Yes No Yes
Not blinded
Yes 3
Serclova et al., 2009
51 52 33 (20-66) 36 (18-68) 30 Yes Yes Yes Not blinded
Yes 3

108
Table 3.3: Summary of ERAS elements included in the RCTs
Study
Preoperative Perioperative Postoperative
Pre
op
erat
ive
cou
nse
llin
g
Pre
op
erat
ive
feed
ing
Syn
bio
tics
No
bo
wel
pre
par
atio
n
No
pre
med
icat
ion
Flu
id r
estr
icti
on
Per
iop
erat
ive
hig
h O
2
con
cen
trat
ion
s
Act
ive
pre
ven
tio
n o
f
hyp
oth
erm
ia
Epid
ura
l an
alge
sia
Sho
rt /
tran
sver
se in
cisi
on
s
No
ro
uti
ne
use
of
NG
tu
bes
No
ro
uti
ne
use
of
dra
ins
Enfo
rced
po
sto
per
ativ
e
mo
bili
zati
on
Enfo
rced
po
sto
per
ativ
e o
ral
feed
ing
No
sys
tem
ic m
orp
hin
e u
se
Stan
dar
d la
xati
ves
Earl
y re
mo
val o
f b
lad
der
cath
eter
Anderson
et al., 2003
Delaney et
al., 2003
Gatt et al.,
2005
Khoo et al.,
2007
Muller et
al., 2009
Serclova et
al., 2009 ×

109
Table 3.4: Use of epidurals in RCTs
3.3.2 Meta-analysis of RCTs
Patients undergoing major open colonic/colorectal surgery and managed with a
perioperative ERAS pathway had a primary hospital stay of 2.5 days less than those
managed with a traditional care pathway [WMD (Random, 95% CI) -2.51(-3.54, -1.47);
I2=55%, p<0.00001, Figure 3.2]. In addition, management within an ERAS pathway
resulted in significantly fewer postoperative complications [RR (95% CI): 0.53 (0.41, 0.69);
I²=0%; p<0.00001, Figure 3. 3]. Of the 452 patients, 4 died during the 30 day follow-up
period, with one death (myocardial infarction) in the ERAS group and three (2 myocardial
infarctions and 1 pulmonary embolism) in the traditional care group. The Forest plots in
Figures 3.4 and 3.5, demonstrate that there were no statistically significant differences in
readmission [RR (95% CI): 0.80 (0.32, 1.98); I²=9%; p=0.62] and mortality rates [RR (95%
CI): 0.53 (0.09, 3.15); I²=0%; p=0.49]., The I2-statistic showed significant heterogeneity for
the effect of ERAS on the length of hospital stay [χ²=11.04, df=5, p=0.05, I²=55%, Figure
3.2]. However, the results for complications, readmissions and mortality had no or very
low heterogeneity (I2=0-9%).
Study Traditional Care ERAS
Anderson et al., 2003
PCA until pain control with oral analgesics
Epidural for first 24-36h
Delaney et al., 2003
No epidurals, PCA for all patients No epidurals, PCA for all patients
Gatt et al., 2005 Epidurals for first 24-36h Epidurals for first 24-36h
Khoo et al., 2007 Epidurals (Median 3 days) Epidurals (Median 2 days)
Muller et al., 2009 Epidurals for 2 days after surgery Epidurals for 2 days after surgery
Serclova et al., 2009
Epidurals according to discretion of anaesthetists
Epidurals used for all patients

110
Figure 3.2: Forest plot of comparison: Length of Hospital Stay
Figure 3.2: Forest plot of comparison: Length of Hospital Stay [ERAS=enhanced recovery after
surgery; TC = traditional care]. ERAS was associated with 2.5 days lesser hospital stay compared
with traditional care.
Figure 3.3: Forest plot of comparison: Complications
Figure 3.3: Forest plot of comparison: Complications [ERAS=enhanced recovery after surgery; TC
= traditional care]. ERAS was associated with 47% reduction in risk of complications compared
with traditional care

111
Figure 3.4: Forest plot of comparison: Readmission
Figure 3.4: Forest plot of comparison: Complications [ERAS= enhanced recovery after surgery; TC
= traditional care]. No difference in readmission rates were observed with ERAS compared with
traditional care.
Figure 3.5: Forest plot of comparison: Mortality
Figure 3.5: Forest plot of comparison: Mortality [ERAS= enhanced recovery after surgery; TC =
traditional care]. No difference in mortality rates were observed with ERAS compared with
traditional care.

112
3.4 Discussion
The results from the present meta-analysis suggest that the implementation of four or
more elements of the ERAS pathway leads to a reduction in length of hospital stay by
more than 2 days and an almost 50% reduction in complication rates in patients
undergoing major open colonic/colorectal surgery. At the same time, no significant
difference was noted in readmission rates or mortality between the groups. Although no
firm conclusions could be made with regards to the latter two outcome measures, the
present meta-analysis indicates that early discharge and ERAS protocols did not seem to
increase the risk of readmission or mortality. However, these results are open to further
scrutiny due to the following reasons. There was significant heterogeneity for the effect
of ERAS on the length of hospital stay and hence, could potentially weaken the inferences
drawn. The effect of using epidurals on the postoperative pain outcome was investigated
in two studies using visual analogue scores (VAS) (Anderson et al., 2003, Gatt et al.,
2005). Anderson et al (Anderson et al., 2003) used epidurals only in the study group and
patient controlled analgesia in the control group. Their results showed that postoperative
pain did not differ significantly from preoperative levels in the ERAS group, but it was
increased in the control group. However the pain scores were similar in both groups by
day 7. This is in contrast to the study by Gatt and colleagues (Gatt et al., 2005) in which
epidurals were used in both groups with no recordable differences in pain scores.
Interpretation of the influence of epidurals on postoperative pain and other outcomes
was further complicated in the study by Serclova and co-workers (Serclova et al., 2009)
where the adoption of an epidural in the control arm was optional. When the rate of
epidural failure (28%) was added to the fact that not all patients received an epidural, the

113
presence of an effective epidural in the control group became a random event.
Postoperative pain was not studied as an outcome measure in the other studies which
used epidurals in both groups (Gatt et al., 2005, Khoo et al., 2007, Muller et al., 2009,
Serclova, 2009). Equally, a uniform method of reporting complications and their degree
of severity was not followed in these studies. The rate of complications in the control
arms varied widely from 45-75%, as was the reporting of specific complications, with
wound morbidity varying between 0 and 33%. One study (Anderson et al., 2003)
considered failures of treatment as a complication (e. g. ineffective epidural), whereas
another study (Khoo et al., 2007) reported a relatively high incidence of what may
otherwise be considered rare complications (e. g. 8% incidence of pressure sores). In such
circumstances caution needs to be exercised in combining results from one trial to
another. We have, therefore, included the number of patients with complications per
group rather than the total number of complications per group, for the meta-analysis.
The number of deaths (4 of 452 patients) was too small to detect significant differences
in mortality and all of them occurred within the primary hospital stay. All these studies
had a follow-up period of 30 days and therefore it is unlikely that any impact of
complications or mortality, on the primary length of hospital stay would have been
missed in the included RCTs.
A potential confounding factor in the RCTs is that some studies (Serclova et al., 2009,
Delaney et al., 2003) had included patients who underwent small bowel resections in the
study population. In addition, in the study by Serclova et al (Serclova et al., 2009) the
participants were between 18-70 years of age with ASA grades I and II, underwent open
intestinal resections with or without stoma and had a significantly longer hospital stay in

114
both groups compared to other included studies [mean (range) 7.4 (5-11) days in ERAS
group and 10.4 (7-22) days in the traditional care group]. This may have potentially
reduced the readmission rate and led to significant bias in reporting the outcomes. The
variation reported in outcomes from the different studies probably reflects the inherent
differences in practice that exists between different surgical units and countries.
However, despite all these differences between these studies, the ERAS groups
consistently showed faster recovery.
Another weakness of the RCTs included, and hence also of this meta-analysis, is the lack
of information regarding compliance with protocols and the elements of ERAS pathway in
the included studies and, hence, the significance of the contribution of the individual
elements to outcome could not be ascertained. A recent study has shown that when
instituting changes of treatment protocols of a more complex nature, such as the ERAS
pathway, it is difficult to reach full compliance with all the elements of the pathway
(Maessen et al., 2007). This weakness is an often under estimated factor as it is almost
never reported or even looked for. This is true not only for studies of implementation of
new protocols such as the present, but also in the general surgical literature. Another
drawback is that because of the inherent difficulties, none of the included studies were
blinded and the average Jadad score (Jadad et al., 1996) was 2.83. There was also a wide
variation in the number of elements of the ERAS pathway incorporated in each study,
though all of them may not be equally important. All studies included elements such as
preoperative counselling, no routine use of NG tubes, enforced postoperative
mobilization, early enteral feeding in the ERAS group. Other elements that were
commonly used in these studies were preoperative feeding, no bowel preparation,

115
epidural analgesia, no routine use of drains and no systemic morphine use. The use of
elements such as synbiotics, avoidance of fluid overload (fluid restriction), maintenance
of perioperative high oxygen concentration, short length incisions and early removal of
bladder catheter were less consistently applied.
However, there are reasons to believe that including as many ERAS elements as possible
in a clinical pathway may have resulted in a cumulative effect and contributed to
enhanced recovery in this group of patients. Aggressive rehabilitation with early
ambulation and feeding should stimulate the gastrointestinal tract and accelerate
recovery of bowel function, whilst routine use of nasogastric tubes or systemic morphine
would impair bowel function. The use of standard laxatives is still debatable, as the
standard measure of return of bowel function would be the ability to tolerate oral
feeding rather than just bowel movement.
There is also growing evidence in the literature, about the contribution of individual
elements comprising the ERAS pathway to a decrease in morbidity and facilitation of
early discharge (Guenaga et al., 2009, Lobo et al., 2002a, Nelson et al., 2007, Rahbari et
al., 2009, Awad et al., 2009a). A large consecutive series of 541 patients undergoing
colorectal resections with a structured care program of planned early discharge within a
fast track protocol also showed reduced readmission rates with no increase in the
incidence of morbidity and mortality (Andersen et al., 2007). These results concur with
other systematic reviews (Wind et al., 2006) and meta-analyses (Gouvas et al., 2009b,
Eskicioglu et al., 2009b, Walter et al., 2009) on the ERAS pathway and the inclusion of a
much larger number of patients (452) in the present meta-analysis, further strengthens
the conclusions. The other less studied elements which form part of ERAS may have also

116
contributed to the outcome, but evidence is lacking as there are no robust studies
supporting this hypothesis. These elements form part of the ERAS pathway based on
common consensus opinions and derived from traditional care settings. Further
prospective studies of ERAS pathway are needed with emphasis on strict protocol
compliance to examine these individual elements, so that critical elements that
contribute to the outcome, might be identified using a regression model.
Evidence from the literature, supports the view that the ERAS pathway seems to reduce
the overall healthcare cost (Kariv et al., 2007, Kehlet, 2005). From a health economics
point of view, the data suggest that, with the decrease in complications and hospital stay
and similar readmission rates, the cost of treatment per patient would be significantly
lower for those treated within an ERAS pathway than those receiving traditional care,
despite the need for dedicated staff to implement the pathway.
This meta-analysis has shown that ERAS pathways help to reduce both hospital stay and
complication rates. There is supportive evidence from the included studies that enhanced
recovery programs should be considered as standard perioperative care. To further
strengthen the evidence base and to develop a well-established clinical pathway, future
RCTs of ERAS pathways applying stringent criteria, with presentation of data regarding
protocol compliance, are recommended.

117
Chapter 4
A meta-analysis of randomised controlled trials on preoperative oral carbohydrate
treatment in elective surgery

118
4.1 Introduction
Preoperative fasting and surgery cause metabolic-stress and insulin resistance, which is
characterised by hyperglycaemia and decreased responsiveness of tissues (mainly
skeletal muscle and liver) to the biological actions of insulin (Awad et al., 2009b).
Development of insulin resistance is associated with increased morbidity (Sato et al.,
2010), mortality (Sato et al., 2010) and length of hospital stay (Thorell et al., 1999b).
Measures to attenuate development of insulin resistance, such as preoperative oral
treatment with complex carbohydrates may, therefore, be clinically beneficial. A number
of studies have examined the effects of preoperative carbohydrate treatment on
postoperative insulin resistance and glucose kinetics (Soop et al., 2001, Svanfeldt et al.,
2007), protein balance and body composition (Svanfeldt et al., 2007, Yuill et al., 2005),
postprandial hormonal and metabolic responses (Awad et al., 2011a, Awad et al., 2010,
Awad et al., 2011b), immune function (Melis et al., 2006), gene and protein expression
(Awad et al., 2010, Wang et al., 2010), residual gastric volume (Awad et al., 2011a, Lobo
et al., 2009), drink-related complications (Yuill et al., 2005, Kaska et al., 2010, Mathur et
al., 2010) , patient well-being (Hausel et al., 2001, Hausel et al., 2005), and length of
hospital stay (Yuill et al., 2005),(Mathur et al., 2010, Noblett et al., 2006b). Whilst the
safety (Yuill et al., 2005, Mathur et al., 2010), and physiological benefits of preoperative
carbohydrate treatment have been demonstrated, data regarding the effects on
important clinical endpoints such as length of hospital stay are conflicting; with some
studies demonstrating a reduction (Noblett et al., 2006b) and others no reduction (Yuill
et al., 2005, Mathur et al., 2010), in length of stay. Reasons for these inconsistencies

119
include small numbers of participants and study of heterogeneous groups of patients
undergoing surgical procedures of differing magnitudes (Li et al., 2012). Meta-analysis of
studies on the effects of preoperative carbohydrate treatment on clinical endpoints has
hitherto not been performed.
The aims of the present meta-analysis were to determine the effects of preoperative
carbohydrate treatment in patients undergoing elective surgery on: 1) length of hospital
stay; 2) development of postoperative insulin resistance; 3) occurrence of drink-related
(vomiting, aspiration and pneumonia) and postoperative complications; and 4)
occurrence of postoperative nausea and vomiting.
4.2 Materials and Methods
4.2.1 Eligibility
Inclusion criteria: Prospective studies that randomised adult patients undergoing elective
surgery to either preoperative oral treatment with complex carbohydrates using ≥50 g
oral carbohydrate in the preoperative morning serving of the drink or a control arm were
included. The latter may have been either ingestion of an equivalent volume of placebo
drink (containing no nutrients) or preoperative fasting.
Exclusion criteria: Randomised controlled trials that administered intravenous
carbohydrate, utilized <50 g oral carbohydrate in the preoperative morning serving of the
drink, that did not compare preoperative carbohydrate treatment against a

120
placebo/preoperative fasting control arm, in which study outcomes were not measured,
and those that included patients with diabetes mellitus were excluded. Additionally, non-
randomised, case-control, retrospective, healthy volunteer studies, and other studies
that did not fulfill the inclusion criteria were also excluded.
Type of Intervention: Preoperative carbohydrate treatment using ≥50 g oral carbohydrate
(with or without additional additives) compared with control.
Outcomes: The primary outcome measure was the effect of preoperative carbohydrate
treatment on length of primary hospital stay, (defined as number of postoperative days
in hospital, until discharge). Secondary outcomes included the effects of preoperative
carbohydrate treatment on development of postoperative insulin resistance, occurrence
of drink-related (vomiting, aspiration or pneumonia) and postoperative complications,
and occurrence of postoperative nausea and vomiting.
Types of groups and subgroups of patients analysed:
A priori subgroup analyses were performed to examine the effects of preoperative
carbohydrate treatment on length of stay in: 1) all patients who received preoperative
carbohydrate treatment; 2) patients undergoing major abdominal surgery; 3) operative
procedures with an expected length of stay ≤2 days (e.g. laparoscopic cholecystectomy,
hernia repair and thyroidectomy); and 4) orthopaedic surgery.
4.2.2 Search strategy
Studies published in all languages between January 1980 and April 2012 in Medline,
Embase, Science Citation Index and Cochrane Library databases were searched using the

121
MeSH search terms preoperative, postoperative, protein, insulin resistance, insulin
sensitivity, oral, loading, glucose, hospital stay, nausea, vomiting, pulmonary,
complication, well-being, thirst, hunger, pain and anxiety. These results were combined
with carbohydrate and surgery in combination with the Boolean operators AND, OR and
NOT. Additionally, bibliographies of published randomised controlled trials were scanned
for studies that were missed in the initial electronic search. Commercial companies that
produced preoperative carbohydrate drinks were contacted for any unpublished data.
Corresponding authors of the relevant publications were approached for additional or
missing data when necessary.
4.2.3 Data collection
The randomised controlled trials identified were examined independently by two authors
(K. Varadhan & S. Awad) and were considered as eligible for inclusion for meta-analysis if
they met predefined inclusion criteria. Data collected included age of participants, type
of surgery, presence of diabetes, American Society of Anaesthesiologists (ASA) grade,
total quantity and timing of carbohydrate ingestion preoperatively, study reported
outcomes, length of hospital stay, changes in insulin resistance, occurrence of pulmonary
and surgical complications and postoperative nausea and vomiting. Outcomes measures
were recorded either as intention to treat analysis or per protocol, as mentioned in the
included RCTs.

122
4.2.4 Assessment of quality and risk of bias of included studies
The quality of studies was assessed for patient selection, comparability of the two study
groups, and outcome measures used. Each randomised controlled trial was assessed for
method of randomisation, allocation concealment, blinding, protocol violation,
description of withdrawals/dropouts. Any disagreement was resolved by consensus
discussions with the other members of the review team. Graphic exploration with funnel
plots was also used to evaluate publication bias.
The overall quality of the evidence obtained from the included studies, for the outcome
measures used in this meta-analysis was assessed comprehensively using GRADEpro®
software, Cochrane Collaboration. Judgements of the quality of specific outcomes were
based on presence or absence of the following variables in individual randomised
controlled trials: limitations of study design and execution, inconsistency, indirectness
and imprecision of results and risk of bias. Overall quality of the evidence for each
outcome was a pooled result of the assessments in the above domains and was graded
as very low, low, moderate or high. Strength of recommendations for either preoperative
carbohydrate treatment or control was based on the combined results of the
aforementioned systematic assessments.

123
4.2.5 Statistical analysis
Two authors (KKV and SA) performed the statistical analysis using RevMan 5.1 software
(The Nordic Cochrane Center, The Cochrane Collaboration, Copenhagen, Denmark) using
standard methods recommended by the Cochrane Collaboration. Effect sizes for
dichotomous outcomes were reported as risk ratio with 95% confidence intervals and
continuous outcomes as mean differences. A random-effects model with the inverse
variance method was used for pooled analyses. Differences were considered significant
at p<0.05. Quantitative assessment of heterogeneity was calculated first using both
‘fixed’ and ‘random’ effect models for all outcomes. Test for homogeneity was then
assessed using χ2 and the I2 statistic with values of of I2 less than or equal to 25%, 50%,
and 75%, representing low, moderate, and high heterogeneity, respectively. If the I2 test
rejected the assumption of homogeneity of studies, then the random-effect analysis was
reported.
4.3 Results
4.3.1 Eligible studies
Twenty-one randomised controlled trials published between 1998 and 2012 fulfilled the
inclusion criteria, leading to a total of 1685 patients (range 14 to 252 patients per study),
733 in preoperative carbohydrate treatment group, 952 in control group (Table 4.1 and
Figure 4.1). Characteristics of included studies are shown in Tables 4.1.

124
Figure 4.1: PRISMA DIAGRAM
Figure 4.1: Selection of studies for the meta-analysis. Twenty one RCTs were
considered eligible and were included for the meta-analysis.

125
Table 4.1: Characteristics of studies of preoperative carbohydrate treatment in patients
undergoing elective surgery included in this meta-analysis.
Study Type of surgery Method of
randomisation
Allocation
concealment Blinding
Inclusion
and
exclusion
criteria
defined
Dropouts
and
withdrawals
described
Nygren et
al., 1998
Open major
colorectal surgery
Not stated Not stated Not
stated
No Yes
Hausel et
al., 2001
Laparoscopic
cholecystectomy
and open major
colorectal surgery
Not stated Not stated Double-
blind
Yes Not stated
Soop et al.,
2001
Total hip
replacement
Drinks in
random coded
lots and given
to
consecutively
enrolled
patients
Not stated Double-
blind
Yes Yes
Henriksen
et al., 2003
Open major
colorectal surgery
Block
randomisation
Sealed
envelope
method
Not
stated
Yes Yes
Bisgaard et
al., 2004
Laparoscopic
cholecystectomy
Block
randomisation
Random
coded
bottles
Double-
blind
Yes Yes
Soop et al.,
2004
Total hip
replacement
Drinks in
random coded
lots and given
to
consecutively
enrolled
Not stated Double-
blind
Yes Yes

126
patients
Hausel et
al., 2005
Laparoscopic
cholecystectomy
Computer
generated
randomisation
Not stated Double-
blind
Yes Yes
Yuill et al.,
2005
Major open
abdominal surgery
Not stated Not stated Double-
blind
Yes Yes
Melis et al.,
2006
Orthopedic
surgery
Not stated Sealed
envelope
method
Single-
blind
Yes No
Noblett et
al., 2006
Open major
colorectal surgery
Random
number
allocation
Sealed
envelope
method
Single-
blind
Yes Yes
Rapp-Kesek
et al., 2007
Cardiac surgery Not stated Not stated Not
stated
Yes No
Jarvela et
al., 2008
Cardiac surgery Not stated Sealed
envelope
method
Single-
blind
Yes No
Yagci et al.,
2008
Laparoscopic
cholecystectomy
and thyroid
surgery
Not stated Not stated Single-
blind
Yes No
Lauwick et
al., 2009
Thyroid surgery Computer
generated
randomisation
Not stated Double-
blind
Yes Yes
Awad et al.,
2010
Laparoscopic
cholecystectomy
Computer
generated
randomisation
Sequentially
numbered
bottles
Double-
blind
Yes Yes
Kaska et al.,
2010
Open major
colorectal surgery
Not stated Sealed
envelope
method
Single-
blind
Yes Not stated
Lidder et
al., 2010
Open and
laparoscopic
major colorectal
Computer
generated
Sealed
envelope
method
Double-
blind
Yes Yes

127
surgery
Mathur et
al., 2010
Open major
colorectal and
liver surgery
Block
randomisation
Sealed
envelope
method
Double-
blind
Yes Yes
Wang et
al., 2010
Open major
colorectal surgery
Not stated Not stated Double-
blind
Yes Yes
Perrone et
al., 2012
Open/laparoscopic
cholecystectomy
and unilateral
inguinal hernia
repair
Computer
generated
randomisation
Not stated Double-
blind
Yes Reasons for
exclusions
not stated
Dock-
Nascimento
et al., 2012
Elective
laparoscopic
cholecystectomy
Computer
generated
randomisation
Not stated Not
stated
Yes Yes

128
4.3.2 Characteristics of included studies
Randomisation methods used were computer random number generator (Hausel et al.,
2005, Lauwick et al., 2009, Dock-Nascimento et al., 2012, Perrone et al., 2011), coded lots
of study drinks (Soop et al., 2001, Soop et al., 2004, Lidder et al., 2010b), sealed
envelope(Melis et al., 2006, Kaska et al., 2010, Mathur et al., 2010, Noblett et al., 2006b,
Henriksen et al., 2003, Jarvela et al., 2008), and block randomisation(Mathur et al., 2010,
Henriksen et al., 2003), were reported in fifteen studies and not reported in six (Yuill et
al., 2005, Wang et al., 2010, Hausel et al., 2001, Nygren et al., 1998, Yagci et al, 2008,
Rapp-Kesek et al, 2007).
Allocation concealment was reported in nine studies (Melis et al., 2006, Kaska et al.,
2010, Mathur et al., 2010, Noblett et al., 2006b, Lidder et al., 2010a, Henriksen et al.,
2003, Jarvela et al., 2008, Bisgaard et al., 2004), using the sealed envelope method and
not stated in the remaining studies. Twelve randomised controlled trials were described
as double-blind (Soop et al., 2001, Yuill et al., 2005, Awad et al., 2010, Wang et al., 2010,
Mathur et al., 2010, Hausel et al., 2001, Hausel et al., 2005, Lauwick et al., 2009, Perrone
et al., 2011, Soop et al., 2004b, Lidder et al., 2010a, Bisgaard et al., 2004), five were
single-blind(Melis et al., 2006, Kaska et al., 2010, Noblett et al., 2006b, Jarvela et al.,
2008, Yagci et al., 2008), and blinding was not stated in four (Dock-Nascimento et al.,
2012, Henriksen et al., 2003, Nygren et al., 1998a, Rapp-Kesek et al., 2007). Only two
studies (Mathur et al., 2010, Dock-Nascimento et al., 2012), followed-up patients at one
month post-hospital discharge, the remainder followed-up patients to hospital discharge.

129
Patient withdrawal and dropouts after randomisation were reported in fourteen studies
(Soop et al., 2001, Yuill et al., 2005, Wang et al., 2010, Mathur et al., 2010, Hausel et al.,
2005, Noblett et al., 2006b, Lauwick et al., 2009, Dock-Nascimento et al., 2012, Perrone
et al., 2011, Soop et al., 2004b, Henriksen et al., 2003, Nygren et al., 1998a, Bisgaard et
al., 2004).
Standard inclusion and exclusion criteria were defined in all but one study (Nygren et al.,
1998). Of the authors who were contacted (Svanfeldt et al., 2007, Yuill et al., 2005, Melis
et al., 2006, Wang et al., 2010, Kaska et al., 2010, Mathur et al., 2010, Hausel et al., 2001,
Noblett et al., 2006b, Lauwick et al., 2009, Perrone et al., 2011, Henriksen et al., 2003,
Jarvela et al., 2008, Yagci et al., 2008, Bisgaard et al., 2004, Aronsson et al., 2009, Faria et
al., 2009, Protic et al., 2010, Breuer et al., 2006, Nygren et al., 1999, Nygren et al., 1995),
to provide additional data, all but two (Wang et al., 2010, Yagci et al., 2008), responded.
The study published by Yuill et al included data on a subgroup of patients who were part
of a larger multicentre commercial study (to date unpublished) sponsored by Numico
Research (manufacturer of one of the commercially available preoperative carbohydrate
beverages). For the purpose of this meta-analysis, data from this unpublished company-
sponsored study were combined with that from Yuill et al.
The following studies were excluded from the meta-analysis for these reasons:
observational design (Can et al., 2009, Gustafsson et al., 2008), studied healthy
volunteers (Awad et al., 2011a, Awad et al., 2011b, Svanfeldt et al., 2005, Vermeulen et
al., 2011)), included patients with diabetes mellitus (Breuer et al., 2006), utilised
intravenous (Gustafsson et al., 2008) carbohydrate treatment (Nygren et al., 1998a,
Thorell et al., 1996a) or hypocaloric nutrition (Schricker et al., 2008); reported duplicate

130
data (Nygren et al., 1999); administered <50 g of oral carbohydrate in the pre-anaesthetic
induction serving of the study drink (Aronsson et al., 2009, Faria et al., 2009, Protic et al.,
2010); administered preoperative carbohydrates for two weeks preoperatively
(Okabayashi et al., 2011, Okabayashi et al., 2010) and did not include a placebo/fasted
control group (Svanfeldt et al., 2007, Can et al., 2009).
4.3.4 Patient characteristics
The present meta-analysis included patients who underwent major open abdominal
surgery, colorectal (Yuill et al., 2005, Kaska et al., 2010, Mathur et al., 2010, Hausel et al.,
2001, Noblett et al., 2006b, Henriksen et al., 2003, Nygren et al., 1998b), liver (Yuill et al.,
2005, Mathur et al., 2010), oesophago-gastric and pancreatic surgery (Yuill et al., 2005),
laparoscopic/open cholecystectomy (Hausel et al., 2001, Hausel et al., 2005, Perrone et
al., 2011, Lauwick et al., 2009), thyroid, inguinal hernia (Perrone et al., 2011), cardiac
(Jarvela et al., 2008, Rapp-Kesek et al., 2007), and orthopaedic surgery (Soop et al., 2001,
Soop et al., 2004b, Nygren et al., 1999). ASA grade (range I-III) were reported in thirteen
studies (Awad et al., 2010, Wang et al., 2010, Kaska et al., 2010, Mathur et al., 2010,
Hausel et al., 2001, Hausel et al., 2005, Noblett et al., 2006b, Lauwick et al., 2009, Dock-
Nascimento et al., 2012, Perrone et al., 2011, Soop et al., 2004b, Henriksen et al., 2003,
Yagci et al., 2008). The age of participants within each group, were reported as mean ±
standard deviation/standard error in fifteen studies (Soop et al., 2001, Awad et al., 2010,
Melis et al., 2006, Kaska et al., 2010, Hausel et al., 2005, Noblett et al., 2006b, Soop et al.,
2004b, Henriksen et al., 2003, Jarvela et al., 2008, Nygren et al., 1998a, Yagci et al., 2008,
Rapp-Kesek et al., 2007) and median (range) in the remaining six studies (Yuill et al.,

131
2005, Wang et al., 2010, Mathur et al., 2010, Hausel et al., 2001, Bisgaard et al., 2004).
The calculated overall mean ± standard deviation age from the former group of studies
was 55.1 ± 11.2 and 54.0 ± 10.0 years for preoperative carbohydrate treatment and
placebo/fasted groups, respectively. Amongst studies included in this meta-analysis,
study groups were well-matched with no differences in baseline body mass index
between study groups at randomisation. The quality assessment for each outcome
(Tables 4.2 and 4.3) showed some risk of bias and imprecision for both outcomes when
all the studies were included for analysis. Confounding variables such as selection of
patients based on body mass index, ASA grade, inclusion of patients undergoing
laparoscopic cholecystectomy and major open colorectal resections within the same
study, variations in doses and timing of administration of preoperative carbohydrate
treatment, administration of other nutrients preoperatively in addition to carbohydrates
and type of surgery performed may have contributed to the heterogeneity of results. The
subgroup analyses eliminated some of these confounders and improved the quality of
evidence within individual subgroups. Therefore, the quality of evidence across all
outcomes ranged from low to moderate (Tables 4.2 and 4.3).

132
Table 4.2: Quality of evidence of included RCTs
Study
Risk of bias
Inco
nsi
ste
ncy
Ind
irec
tne
ss
Imp
reci
sio
n
Other considerations
Nygren et al.,
1998 No No No Yes
Wide confidence interval for length of stay; excluded patients who
developed post-operative complications. Hyperinsulinaemic-
euglycaemic clamp performed on postoperative day 1.
Hausel et al., 2001 Selection bias* No No Yes
*Combination of laparoscopic cholecystectomy and open major
colorectal surgery in same study. Low event rates.
Hyperinsulinaemic-euglycaemic clamp performed on postoperative
day 1.
Soop et al., 2001 Selection bias* No No Yes *Included patients with body mass index 18-28 kg/m2, not
intention to treat analysis. Low event rates.
Henriksen et al.,
2003 No No No No Not intention to treat analysis.
Bisgaard et al.,
2004 Selection bias* No No No
*Excluded patients ASA grade ≥III and those who developed
surgical complications. Not intention to treat analysis.

133
Soop et al., 2004 Selection bias* No No Yes
*Included patients with body mass index 18-28 kg/m2, not
intention to treat analysis. Hyperinsulinaemic-euglycaemic clamp
performed on postoperative day 3. Low event rates.
Hausel et al., 2005 No No No Yes Not intention to treat analysis, planned discharge at 24 hours
postoperatively. Low event rates.
Yuill et al., 2005 Reporting
bias* No No No
*Study did not report outcomes of patients enrolled at other
centers that were participating in a multicenter commercial trial.
Melis et al., 2006 Selection bias* No Yes No
*Excluded patients with body mass index >30 kg/m2.
Assessed surgery induced immunosuppression as the primary
outcome.
Noblett et al.,
2006 No No No Yes
Groups who were randomised to preoperative fasting or water
ingestion were combined in the analyses.
Rapp-Kesek et al.,
2007 Selection bias* No Yes No
*Only studied patients aged >65 years. Both study groups received
intraoperative glucose infusions. Used Homeostasis Model
Assessment-Insulin Resistance to determine perioperative changes
in insulin sensitivity.
Jarvela et al., 2008 No No No No Both study groups received postoperative insulin infusions to

134
maintain glycemic control.
Yagci et al., 2008 Selection bias* No No No * Excluded patients ASA grade ≥III.
Lauwick et al.,
2009 Selection bias* Yes** Yes Yes
*Women aged 19-70 years with a body mass index ≤35 kg/m2 were
enrolled. Excluded patients with history of motion sickness or
postoperative nausea and vomiting. **Study drink administered to
control group drink was not iso-volumetric with active comparator.
Not intention to treat analysis. Did not utilise visual analogue scale
questionnaires to measure postoperative nausea and vomiting.
Awad et al., 2010 Selection bias* No No No *Only studied patients undergoing inpatient laparoscopic
cholecystectomy for uncomplicated gallstone disease.
Kaska et al., 2010 Selection bias* No Yes No
*Age between 35-75 years and body mass index 20-30 kg/m2 were
included. Used the Qualitative Insulin Sensitivity Check Index to
determine perioperative changes in insulin sensitivity.
Lidder et al., 2010 No No No No
Studied groups included patients undergoing both open and
laparoscopic surgery. Used Homeostasis Model Assessment-Insulin
Resistance and insulin tolerance tests, to determine perioperative
changes in insulin sensitivity.

135
Mathur et al.,
2010 No No No Yes
Used Homeostasis Model Assessment-Insulin Resistance to
determine perioperative changes in insulin sensitivity.
Wang et al., 2010
Selection bias* No No No
*Excluded patients aged <25 or >75 years and those with >10%
weight loss in past 6 months. Used Homeostasis Model
Assessment-Insulin Resistance to determine perioperative changes
in insulin sensitivity.
Perrone et al.,
2012
Selection bias* No No No
*Excluded patients ASA grade ≥III, body mass index >35, patients
had intraoperative complications or surgery >3 hours. Used
Homeostasis Model Assessment-Insulin Resistance(Matthews et
al., 1985) to determine perioperative changes in insulin sensitivity.
Study groups were not well-matched for insulin resistance at
baseline.
Dock-Nascimento
et al., 2012 Selection bias* No No No
*Excluded patients of age <19 or >62 years, ASA grade ≥III, outside
body mass index range 18-30 kg/m2 and patients had surgery >2
hours. Used Homeostasis Model Assessment-Insulin Resistance to
determine perioperative changes in insulin sensitivity.

136
Table 4.3: Quality assessment Summary of Findings
Participants
(studies)
Follow up
Risk of
bias
Inconsistency Indirectness Imprecision Publication
bias
Overall quality
of evidence
Study event rates (%) Relative
effect
(95% CI)
Anticipated absolute effects
With
Control
With Preop
carbohydrates versus
standard/placebo
Risk with
Control
Risk difference with Preop
carbohydrates versus
standard/placebo (95% CI)
Complications - All studies
878
(9 studies)
serious1 no serious
inconsistency2
no serious
indirectness
serious3 undetected ⊕⊕⊝⊝
LOW1,2,3
due to risk of
bias,
imprecision
68/523
(13%)
60/355
(16.9%)
RR 0.88
(0.5 to
1.53)
Study population
130 per 1000
16 fewer per 1000 (from 65 fewer to 69 more)
Length of stay - All studies
1198
(12 studies)
serious2 no serious
inconsistency
no serious
indirectness
serious2,3
undetected ⊕⊕⊝⊝
LOW2,3
due to risk of
bias,
imprecision
689 509 The mean length of stay - all studies in the intervention groups was 0.19 lower (0.46 lower to 0.08 higher)
Length of stay - Major Abdominal Surgery
762
(7 studies)
serious1 no serious
inconsistency
no serious
indirectness
no serious
imprecision
undetected ⊕⊕⊕⊝
MODERATE1
due to risk of
bias
443 319 The mean length of stay - major abdominal surgery in the intervention groups was 1.08 lower (1.87 to 0.29 lower)
Length of stay - Operative procedures with expected LOS <3 days
406
(3 studies)
serious4 no serious
inconsistency
no serious
indirectness
no serious
imprecision
undetected ⊕⊕⊕⊝
MODERATE4
due to risk of
bias
232 174 The mean length of stay - operative procedures with expected los <3 days in the intervention groups was 0 higher (0.03 lower to 0.03 higher)
Length of stay - Orthopaedic Surgery
30
(2 studies)
serious2 no serious
inconsistency
no serious
indirectness
no serious
imprecision
undetected ⊕⊕⊕⊝
MODERATE2
due to risk of
bias
14 16 The mean length of stay - orthopaedic surgery in the intervention groups was 0.48 higher (0.23 to 0.73 higher)

137
4.3.5: Length of hospital stay
Data on length of hospital stay were available in twelve studies with a total of 1198
patients (preoperative carbohydrate treatment: 509 and control: 689 patients). Length of
stay data were reported as actual length of hospital stay in eight studies (Soop et al.,
2001),(Yuill et al., 2005),(Kaska et al., 2010, Mathur et al., 2010),(Hausel et al.,
2005),(Dock-Nascimento et al., 2012, Perrone et al., 2011, Soop et al., 2004b), as time to
‘fitness to discharge’ in two studies (Mathur et al., 2010, Noblett et al., 2006b) and were
not reported in the original publications of three studies (Hausel et al., 2001),(Henriksen
et al., 2003, Nygren et al., 1998a). Five studies (Yuill et al., 2005, Kaska et al., 2010,
Mathur et al., 2010, Noblett et al., 2006b, Perrone et al., 2011) reported median
(interquartile range or range) length of stay, and the original authors were contacted to
provide data as mean ± standard deviation.
To enable comparison between study groups, data from the placebo and fasted groups
were combined and a new mean ± standard deviation calculated. Amongst all studies (Fig
4.2) that utilised preoperative carbohydrate treatment, there were no differences in
length of stay between preoperative carbohydrate treatment and control patients [mean
difference, inverse variance, random effects model, 95% confidence interval [-0.19 days,
(-0.46 to -0.08), I2 = 83%, p=0.16] (Fig 4.2).

138
However, subgroup analysis of studies (N=7, Figure 2) that included patients who
received preoperative carbohydrate treatment prior to major open abdominal surgery,
with 319 preoperative carbohydrate treatment and 443 control, demonstrated significant
reduction in length of stay for the preoperative carbohydrate treatment group [mean
difference, inverse variance, random effects model, 95% confidence interval [-1.08 days,
(-1.87 to -0.29), I2 = 60%, p=0.007]. No differences were demonstrated in studies (N=4,
Figure 4.2) that included patients undergoing surgical procedures with expected length of
stay ≤2 days [mean difference, inverse variance, random effects model, 95% confidence
interval [0.00, (- 0.03 to 0.03), I2 = 0%, p=0.970]. Conversely, in two small studies of 30
patients undergoing orthopaedic surgery, there was a significant reduction in length of
stay for the control group [mean difference, inverse variance, random effects model, 95%
confidence interval [-0.48, (-0.23 to -0.73), I2 = 0%, p<0.0002].

139
Figure 4.2: Length of Hospital Stay
Figure 4.2: Forest plot of the effect of preoperative oral carbohydrate treatment on
length of hospital stay in patients undergoing elective surgery. Abbreviations: CI –
confidence interval; IV – inverse variance.

140
4.3.6 Insulin resistance
The effects of preoperative carbohydrate treatment on the development of
postoperative insulin resistance are shown in Table 4. Three studies utilised the
hyperinsulinaemic-euglycaemic clamp technique to measure relative changes in insulin
sensitivity(Soop et al., 2001),(Soop et al., 2004b, Nygren et al., 1998a) and demonstrated
significant reduction in development of postoperative insulin resistance in preoperative
carbohydrate treatment patients when compared with control.
Three further studies (Mathur et al., 2010, Dock-Nascimento et al., 2012, Perrone et al.,
2011) utilised Homeostasis Model Assessment-Insulin Resistance [HOMA-IR] calculations
to determine changes in perioperative insulin resistance; with two demonstrating a
reduction in postoperative HOMA-IR values between preoperative carbohydrate treated
and control patients (Table 4.4). Finally, a study (Lidder et al., 2010) which utilised the
Qualitative Insulin Sensitivity Check Index [QUICKI], to derive a crude estimate of changes
in perioperative insulin sensitivity, demonstrated significant reduction in the
postoperative insulin resistance index in the preoperative carbohydrate treatment group.

141
Table 4.4: Effect of preoperative carbohydrate treatment on development of postoperative insulin resistance.
For studies that utilized the ‘gold-standard’ technique for measuring insulin sensitivity [hyperinsulinaemic-euglycaemic clamp], data presented are
mean ± standard deviation. A greater reduction in insulin sensitivity implies greater development of insulin resistance.
Study
Method to determine insulin
sensitivity
Mean ± standard deviation
% relative change in insulin
sensitivity measured by
glucose infusion rate
Mean ± standard deviation
% relative change in insulin
sensitivity measured by
glucose disposal rate
p-value
Nygren et al.,
1999
Hyperinsulinaemic-euglycaemic
clamp Not available
Preoperative carbohydrate
treatment: -26 ± 8%
Control: -49 ± 6%
p<0.05
Soop et al., 2001 Hyperinsulinaemic-euglycaemic
clamp
Preoperative carbohydrate
treatment: -18 ± 6%
Control: -43 ± 9%
Preoperative carbohydrate
treatment: -19 ± 6%
Control: -37 ± 9%
p<0.05
Soop et al., 2004 Hyperinsulinaemic-euglycaemic
clamp
Preoperative carbohydrate
treatment: -36 ± 10%
Control: -49 ± 7%
Not available p>0.05
Rapp-Kesek et al.,
2007
Homeostasis Model
Assessment-Insulin Resistance
There were no significant differences in the ratios of
homeostasis model assessment-insulin resistance at baseline Not stated

142
and postoperative days 1, 2 and 6
Lidder et al., 2010 Homeostasis Model
Assessment-Insulin Resistance
homeostasis model assessment-insulin resistance was lower
in group receiving pre- and post-operative supplement than
in group receiving pre and post-operative placebo
p=0.011
Mathur et al.,
2010
Homeostasis Model
Assessment-Insulin Resistance
No significant differences in homeostasis model assessment-
insulin resistance between groups at baseline. Homeostasis
model assessment-insulin resistance significantly higher than
baseline in placebo group on days 1, 5 and 7 but not
significantly different in preoperative carbohydrate
treatment patients postoperatively
p>0.05
Wang et al., 2010 Homeostasis Model
Assessment-Insulin Resistance
Median levels of homeostasis model assessment-insulin
resistance increased significantly by the end of surgery in all
three study groups (oral carbohydrate treatment, placebo,
fasting) but they were significantly lower in the oral
carbohydrate treated group
p<0·001
Perrone et al.,
2012
Homeostasis Model
Assessment-Insulin Resistance
The insulin resistance alterations before and after surgery
were found to be significantly higher in the control group
then the group that received the carbohydrate/whey protein
study drink
p<0.05
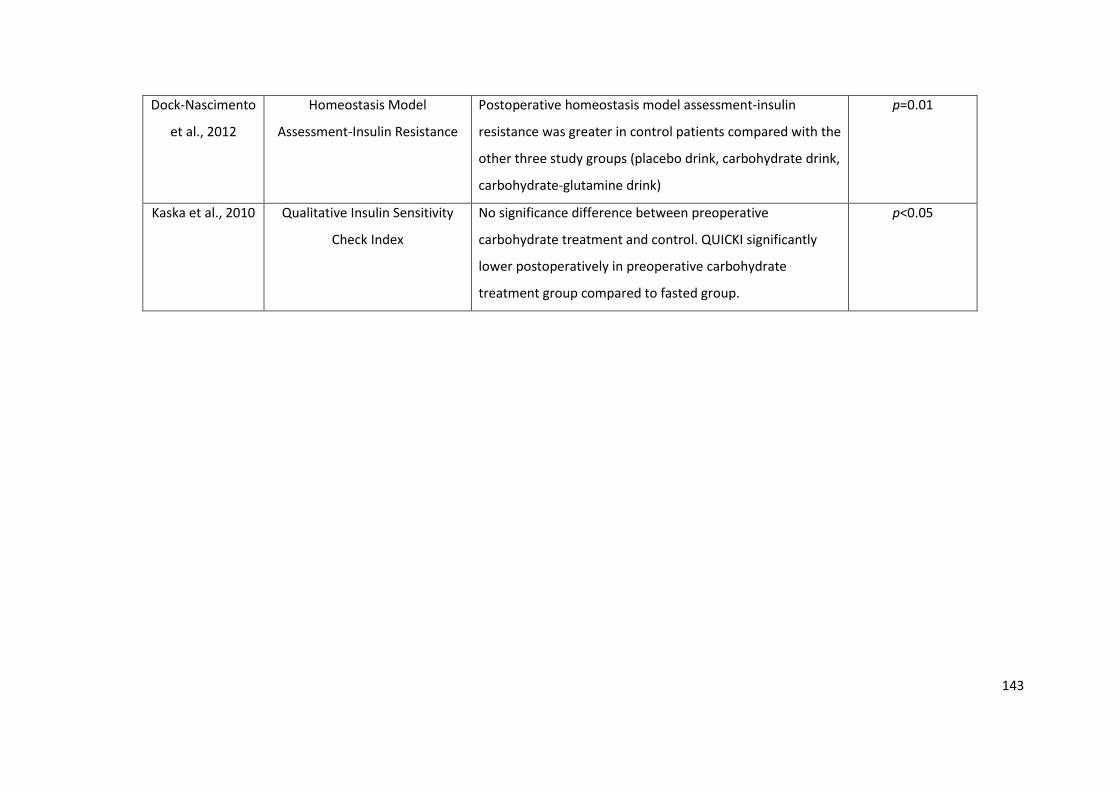
143
Dock-Nascimento
et al., 2012
Homeostasis Model
Assessment-Insulin Resistance
Postoperative homeostasis model assessment-insulin
resistance was greater in control patients compared with the
other three study groups (placebo drink, carbohydrate drink,
carbohydrate-glutamine drink)
p=0.01
Kaska et al., 2010 Qualitative Insulin Sensitivity
Check Index
No significance difference between preoperative
carbohydrate treatment and control. QUICKI significantly
lower postoperatively in preoperative carbohydrate
treatment group compared to fasted group.
p<0.05

144
4.3.7 Pulmonary and surgical complications
No studies reported occurrence of drink-related pulmonary complications in
preoperative carbohydrate treatment patients or those who received placebo. Nine
studies that fulfilled the inclusion criteria provided data on the occurrence of
postoperative complications (Figure 4.3). With 355 preoperative carbohydrate and
523 control patients, no differences were noted between the groups (Figure 3) in the
occurrence of postoperative complications [risk ratio, Mantel-Haenszel, random
effects model, 95% confidence interval (0.88, [0.50 to 1.53], I2 = 41%, p=0.64).
However, few of the included studies reported occurrence of complications after
hospital discharge (i.e. prolonged follow-up) and therefore the presented data
reflects the effects of PCT on the occurrence of in-hospital complications.
Figure 4.3: Forest plot of the effect of preoperative oral carbohydrate treatment on
development of surgical complications in patients undergoing elective surgery.
Abbreviations: CI- confidence interval; IV- inverse variance. No differences in complications
were noted between CHO and control.

145
4.3.7 Postoperative nausea and vomiting
Data on postoperative nausea and vomiting were reported in five studies (Yuill et al.,
2005),(Hausel et al., 2005, Lauwick et al., 2009),(Henriksen et al., 2003, Jarvela et al.,
2008). Nausea was determined by means of visual analogue scale questionnaires.
Three studies demonstrated no differences in the occurrence of postoperative
nausea and vomiting between preoperative carbohydrate treatment and control
groups (Yuill et al., 2005),(Lauwick et al., 2009, Henriksen et al., 2003), one study
reported fewer(Hausel et al., 2005) and one study reported more (Jarvela et al.,
2008)25 instances of postoperative nausea and vomiting in preoperative
carbohydrate treated patients. However, only two studies (Hausel et al.,
2005),(Lauwick et al., 2009) reported data on the use of anti-emetics.

146
4.4 Discussion
Principal findings
This meta-analysis of 21 randomised controlled trials evaluating the effects of
preoperative carbohydrate treatment on patients undergoing elective surgery
demonstrated a significant reduction in length of stay amongst patients undergoing
major open abdominal surgery. Preoperative carbohydrate treatment was safe (no
occurrence of drink-related complications), associated with reduced development of
postoperative insulin resistance but the latter was not associated with any effect on
surgical complications.
Strengths of the meta-analysis
This is the first meta-analysis to examine the effects of preoperative carbohydrate
treatment on clinical outcomes in 1685 patients undergoing elective surgery. The
only subgroup of studies that included sufficient numbers of patients (N=762) to
demonstrate a potential difference in length of hospital stay were those of patients
undergoing major abdominal surgery. Therefore, for the primary outcome of the
effect of preoperative carbohydrate treatment on length of stay, data from this
subgroup of patients were of clinical importance and comprised the largest grouping
of patients presently available in the literature. To maintain homogeneity of
interventions, the studies that prescribed <50 g of carbohydrates were excluded
from the analysis. A separate subgroup analysis based on the surgical procedures,
identified the true effect of preoperative carbohydrate drinks on length of stay,
especially those undergoing major abdominal surgery that would otherwise be

147
confounded by other surgical procedures of lesser magnitude. Assessment of the
quality of individual studies and the reported outcomes using Cochrane methodology
and grading the evidence presented using GRADEpro®, further strengthens the
methodology.
Limitations of the meta-analysis
The main limitation of this meta-analysis was the relatively weak design of many of
the included studies whose quality, as assessed by GRADEpro®, was rated as low to
moderate. There were small numbers and significant heterogeneity in the design and
magnitude of surgery in many studies of preoperative carbohydrate treatment that
precluded their inclusion in this meta-analysis. The definitions of outcomes such as
complications and reporting of events varied between studies. Similarly, insulin
resistance were measured using different methods in the included studies, making it
difficult to arrive at a common consensus, though most studies reported attenuation
of postoperative insulin resistance in carbohydrate treated patients. Moreover, not
all outcomes were reported by the included studies. Therefore this meta-analysis
included studies that used preoperative carbohydrates and reported at least one
outcome of interest. The aforementioned weaknesses limited the numbers of studies
eligible for inclusion in the assessment of the primary outcome of length of hospital
stay.

148
Meaning of the study/Health policy implications
For the primary outcome, difference in length of hospital stay, the studies of major
open abdominal surgery demonstrated a reduction in length of hospital stay by one
day. This is likely due, in part, to improved recovery after surgery since no differences
in complication rates were demonstrated between the carbohydrate treated and
control groups. This improved recovery could be explained by the metabolic effects
of preoperative carbohydrate treatment, namely, an attenuated postoperative
insulin resistance response leading to marked effects on several key aspects of
metabolism. For glucose metabolism, development of insulin resistance reduces
glucose uptake in peripheral insulin-sensitive cells such as skeletal muscle, this
occurring secondary to decreased activation of specific glucose transporting proteins
such as glucose transporter-4 (GLUT-4)(Thorell et al., 1999a). The latter was recently
shown due to a defect in a key intracellular signalling pathway involving
phosphatidyl-inositol-3-kinase in muscle (Wang et al., 2010). Simultaneously with the
effects on glucose metabolism, preoperative carbohydrate treatment results in
decreased protein catabolism in the body (Svanfeldt et al., 2007) and improved
activation of anabolic signals (tyrosine kinase) in muscle (Wang et al., 2010). The
aforementioned changes may be responsible, in part, for observed reduced loss of
lean body mass postoperatively (Yuill et al., 2005). The combination of reduced
substrate supply and loss of muscle mass may explain the finding of substantial
reductions in muscle force that persist for weeks following elective surgery in
preoperative fasted patients compared to patient given preoperative carbohydrate
treatment (Henriksen et al., 2003). The two small orthopaedic studies included a

149
total of 30 patients and were underpowered to inform an effect of preoperative
carbohydrate treatment on length of hospital stay. Similarly, three further studies
(Dock-Nascimento et al., 2012, Perrone et al., 2011, Hausel et al., 2005) that included
patients undergoing day surgery and procedures with an expected length of hospital
stay of one day, would not have been expected to demonstrate measurable
differences in length of stay between preoperative carbohydrate treated and control
patients. Furthermore, the main mechanisms underlying any differences in length of
stay between preoperative carbohydrate treatment and control groups are thought
related to either improved recovery and/or reduction in complications, both
associated with changes in insulin resistance. However, laparoscopic and minor
surgery are associated with minimal development of insulin resistance and low
complication rates, therefore, an intervention such as preoperative carbohydrate
treatment would not be expected to improve clinical outcomes in this group of
patients. Any beneficial effects of preoperative carbohydrate treatment in such
patient groups would primarily be related to improving preoperative well-being
(Hausel et al., 2001, Bisgaard et al., 2004).
Preoperative carbohydrate treatment reduced development of postoperative insulin
resistance when the gold-standard hyperinsulinaemic-euglycaemic clamp was
utilised to measure insulin sensitivity. These findings were akin to previous data from
studies that utilised intravenous glucose treatment to effect a similar degree of
insulin release (Nygren et al., 1998) and strongly support the notion that
preoperative carbohydrate treatment does reduce the development of early
postoperative insulin resistance (Awad et al., 2009). Studies that measure changes in

150
perioperative insulin resistance utilising methods that use basal insulin and glucose
concentrations (i.e. HOMA-IR and QUICKI) yielded conflicting data which should be
interpreted with caution. HOMA-IR and QUICKI values are derived from formulae of
basal concentrations of insulin and glucose, a situation that arises when insulin is not
active. Indeed, measurement of insulin sensitivity relies on quantifying insulin
stimulated glucose uptake in peripheral tissues; the latter only seen with higher
concentrations of insulin (seen post-prandially and in the hyperinsulinaemic-
euglycaemic clamp). Utilising HOMA as a surrogate marker for the
hyperinsulinaemic-euglycaemic clamp would not be appropriate, therefore, since the
two modalities measure different parameters that are not comparable. Furthermore,
the clinical effects of insulin resistance have traditionally been demonstrated utilising
the hyperinsulinaemic-euglycaemic clamp (Sato et al., 2010, Soop et al., 2001,
Svanfeldt et al., 2005, Nygren et al., 1998a). Whilst there exists evidence that a
reduction in insulin resistance may lead to reduced postoperative complications(Sato
et al., 2010), this was not confirmed by the present meta-analysis, which
demonstrated no differences in the occurrence of postoperative complications
following preoperative carbohydrate treatment, despite the reduction in
postoperative insulin resistance.
The data on well-being presented in this meta-analysis were conflicting. Two studies
of patients undergoing laparoscopic cholecystectomy (Hausel et al., 2001, Bisgaard et
al., 2004) demonstrated improved preoperative well-being compared to placebo,
whilst this was not confirmed a third in patients undergoing thyroid surgery (Lauwick
et al., 2009). The reasons underlying these conflicting data remain unknown but may

151
include the use of differing methods to measure changes in well-being and differing
magnitudes of surgical procedures.
The traditional practice of overnight fasting has definitively been shown to be
unnecessary and numerous anaesthesia societies have now changed their guidelines
to permit more liberal fluid intakes (Maltby, 2006) up to 2 h prior to induction of
anaesthesia. Findings from the present meta-analysis indicated preoperative
carbohydrate treatment was not associated with an increase in drink-related
complications; confirming the safety of utilising oral complex carbohydrate drinks of
appropriate osmolality preoperatively. Numerous countries have already updated
their preoperative guidelines to recommended preoperative carbohydrate treatment
due to its perceived beneficial effects on insulin resistance and well-being (Smith et
al., 2011b). This meta-analysis also suggests that, in addition to the aforementioned
benefits, faster recovery (decreased length of hospital stay) in patients undergoing
open major abdominal surgery may also be expected. Preoperative carbohydrate
treatment, as part of a multimodal enhanced recovery protocol, is recommended by
the Enhanced Recovery After Surgery (ERAS®) group. When employing several
components of the Enhanced Recovery After Surgery recommendations, a recent
meta-analysis demonstrated a reduction in length of stay of 2.5 days (Varadhan et
al., 2010), in keeping with recent data that suggest the beneficial effects on reduced
recovery time and complication rates accrued in an almost stepwise fashion with
increased compliance and utilisation of Enhanced Recovery After Surgery
components (Gustafsson et al., 2011). Interestingly, in the latter study (Gustafsson et

152
al., 2011) the components that affected outcomes were preoperative carbohydrate
treatment and fluid overload.
Future research
As the quality of evidence presented in this meta-analysis was weak, further well-
designed randomised studies are required to specifically examine the effects of
preoperative carbohydrate treatment on postoperative recovery and determine
which patient groups are likely to benefit most. Such studies should be conducted in
patient groups where expected postoperative length of stay is of sufficient length to
enable differences in the effects of preoperative carbohydrate treatment on
metabolism and subsequent function to be detected. In addition, such studies should
be performed whilst controlling for other aspects of perioperative care known to
influence length of stay (Gustafsson et al., 2011). On the other hand, future studies
of patients undergoing ‘minor’ surgery should focus on any potential effects of
preoperative carbohydrate treatment on perioperative well-being. This would be of
interest given recent data on the central regulatory effects of glucose and insulin on
the serotonin system(Orosco and Gerozissis, 2001). There presently exists limited
data on the effects of preoperative carbohydrate treatment in patients who are
obese (body mass index >30 kg/m2), ASA grade ≥III, have diabetes, or are undergoing
emergency surgery. However, further randomised trials of preoperative
carbohydrate treatment as the only intervention may be difficult to undertake, as
this intervention is now incorporated into enhanced recovery after surgery protocols.
Any beneficial effects of preoperative carbohydrate treatment demonstrated in

153
these trials may be difficult to isolate from those caused by other interventions
within the enhanced recovery protocols (such as use of neuroaxial blockade).
In summary, this meta-analysis suggests that use of preoperative carbohydrate
treatment in patients undergoing major abdominal surgery may be associated with
shortened length of hospital stay and attenuation of insulin resistance. However, the
quality of evidence was low to moderate necessitating further well-designed
randomised trials.

154
Chapter 5
The mechanistic basis of metabolic response to surgery and the development of
postoperative insulin resistance in patients having major abdominal surgery

155
5.1 Background & Aims
Postoperative insulin resistance (POIR) is a hallmark feature in patients having major
abdominal surgery (Thorell et al., 1999b). Surgical stress may induce changes in
metabolic pathways that perturb glucose homeostasis in the perioperative period,
resulting in stress hyperglycaemia which contributes to increased postoperative
morbidity, length of stay and prolonged recovery (Thorell et al., 1999b, van den
Berghe et al., 2001, Jackson et al., 2012). Similarly, studies in burns injury (Gore et
al., 2001), trauma (Laird et al., 2004, Sung et al., 2005, Jeschke et al., 2004), and
critically ill patients (Bochicchio et al., 2005, Pittas et al., 2004) also show a causal
relationship between hyperglycaemia and increased morbidity and mortality.
Conversely, maintenance of glycaemia with insulin therapy is associated with
reduction of length of stay and decreased risk of complications in this group of
patients (Van den Berghe et al., 2006, Finfer et al., 2009). However, the molecular
mechanisms underlying these postoperative changes in carbohydrate oxidation and
insulin resistance is less clear.
POIR develops within hours of surgery and into the first postoperative day (Thorell et
al., 1999a). The effects of metabolic response to surgery has been shown to peak in
the first 24-48 hours following surgery and last for several days postoperatively
before returning to basal conditions (Thorell et al., 1999b).
Skeletal muscle becomes refractory to insulin action during stress and contributes to
peripheral insulin resistance. Skeletal muscle constitutes a primary site for insulin
dependent glucose uptake (Zurlo et al., 1990) and along with liver, plays an
important role in the development of POIR during stress states.

156
In previous studies using a rodent-endotoxaemia model of clinical endotoxaemia, it
was noted that inhibition of PI3K/Akt1 signaling, and activation of the Forkhead Box
O (FOXO) family of transcription factors that lie downstream of PI3K/Akt1, occurred
concomitantly with induction of muscle atrophy programme and the impairment of
muscle carbohydrate oxidation (Crossland et al., 2008). Importantly, these events
were accompanied by marked upregulation of FOXO gene targets muscle atrophy F-
box (MAFbx), RING finger 1 (MuRF1) and pyruvate dehydrogenase kinase-4 (PDK4),
which strongly suggests a role for Akt/FOXO signaling in the simultaneous induction
of muscle atrophy and impairment of muscle carbohydrate oxidation during
endotoxaemia. Impaired Akt/FOXO signaling has also been implicated in muscle
insulin resistance, through FOXO-mediated upregulation of isoform PDK4. PDK4
phosphorylates and inactivates pyruvate dehydrogenase complex (PDC), the rate-
limiting step in carbohydrate oxidation. Thus, increased PDK4 expression may lead to
the development of POIR in patients having major abdominal surgery.
Furthermore, a study investigating the changes in anabolic and catabolic pathways in
skeletal muscle of critically ill patients has demonstrated a key role of muscle pro-
inflammatory cytokines, changes in PI3K/Akt signalling pathway, cathepsin, PDK4 and
muscle ubiquitin ligases, MAFBx and MURF1 in the molecular regulation of muscle
mass and carbohydrate metabolism (Constantin et al., 2011). Both, IL-6 and TNF-α
mRNA expression were higher in patients than controls (6.5 fold & 2 fold,
respectively). Also, the magnitude of phosphorylation of signalling proteins thought
to control translation initiation of protein synthesis such as Akt, GSK3 and
mTOR/p70s6k, was reduced with the simultaneous up-regulation of muscle protein

157
breakdown pathways (Ubiquitin proteasome complex and Cathepsin-L) compared to
controls. Both, PDK4 mRNA and protein expression were raised (2-fold and 2.7 fold
respectively), indicating inhibition of muscle carbohydrate oxidation occurs
concomitantly with protein breakdown in these patients.
As detailed in Chapter 1 of this thesis, evidence from studies involving surgical
patients suggests a possible role of inflammation in the development of
postoperative insulin resistance. For example, Witasp et al demonstrated a
significantly increased expression of IL-6, IL-6 receptor and TNF, in skeletal muscle of
patients having surgery postoperatively (Witasp et al., 2009b). The inflammation
induced by surgical stress may be associated with impairment of the gut epithelial
barrier due to disruption of tight junctions and increased para-cellular penetration of
luminal macromolecules, including of bacterial antigens, thereby resulting in an
exaggerated inflammatory response (Hollander., 1999; Clayburgh et al., 2004).
Therefore, we contend whether inflammation associated with surgical trauma is
responsible for the concomitant activation of muscle insulin resistance and protein
breakdown, and whether this can be linked to impaired Akt signalling and FOXO
mediated up-regulation of its downstream targets, namely PDK4 and MafBx.
Gastrointestinal surgery mediated increases in gut permeability and expression of IL-
6 and PDK4 mRNAs in quadriceps muscle may underpin the post-operative increase
in whole-body insulin resistance in humans. An improved understanding of the
mechanisms involved in the development of POIR and surgical stress induced
changes in carbohydrate metabolism are of substantial interest, to determine future
therapeutic interventional targets to attenuate the surgical stress response and POIR.

158
Thus, the aim of this study was to investigate the mechanistic basis of metabolic
response to surgery and the development of postoperative insulin resistance in
patients having major abdominal surgery.
5.2 Methods
5.2.1 Experimental design and sample collection
Fifteen patients undergoing major elective open gastrointestinal surgery were
included prospectively, after obtaining a written informed consent and ethics
approval. Patients who were undergoing emergency surgery, suffering from chronic
illness, (e.g. diabetes), disseminated malignant disease, on medications known to
affect glucose metabolism, on statins, on long term antibiotics or anti-inflammatory
drugs (e.g. NSAIDS, Steroids), immunosuppressive agents, on full therapeutic dose of
anticoagulants, or anti-platelet therapy, suffering from bleeding diathesis were
excluded from the study.
Fig 5.1: Time course of sample collection from patients undergoing major surgery
D7-14 Days Start of surgery End of surgery 2nd
postoperative
day
GTT & 51
Cr-EDTA tests (Preop) GTT & 51Cr-EDTA tests (2nd POD)
- Blood samples; - Muscle Biopsy; GTT – Glucose Tolerance Test;
51Cr-EDTA – Chromium EDTA test for gut permeability

159
The following investigations were performed in patients having major abdominal
surgery (Fig. 5.1):
(1) Arterialised-venous blood samples were obtained at three time-points; pre-
assessment visit, during surgery and on the second postoperative day and were
analysed for plasma concentrations of insulin, cortisol, lactate and free fatty acids
(2) An Oral Glucose Tolerance Test (GTT) was performed at the pre-assessment visit
and on the 2nd postoperative day (Chapter 1). Glucose was measured using
(HemoCue glucose analyser; HemoCue Ltd, Ängelholm, Sweden).
(3) A 51Cr-EDTA gut permeability test using an oral preparation containing 1.8 MBq of
51 chromium labelled ethylene-diamine-tetra-acetate (51Cr-EDTA), (Department of
Medical Physics, University of Nottingham, U.K.) in 100 mL of water was performed
during the screening visit and on the 2nd postoperative day. A 24 hour urine sample
was collected and a small sample of urine was counted for radioactivity by a γ -
scintillation counter in triplicate (IGE Millennium VG camera with Hawkeye CT and
Wallac Wizard 3 automatic gamma counter). Results were expressed as the
percentage urinary excretion of the orally administered dose of 51Cr-EDTA.
(4) Muscle biopsies of approximately 100 mg, were taken from rectus abdominis and
vastus lateralis muscles at the beginning and at the end of surgery. The samples were
immediately snap-frozen in liquid nitrogen. The specimens obtained at the end of
surgery were taken from the contralateral side to avoid false measurements due to
local tissue injury. The samples were analysed for the following:
Muscle mRNA expression: Interleukin-6 (IL-6), Tumour Necrosis Factor- α (TNF-α),
Protein Kinase-B (Akt1), Insulin Receptor Substrate-1 (IRS-1), Forkheadbox-0 (FOXO),
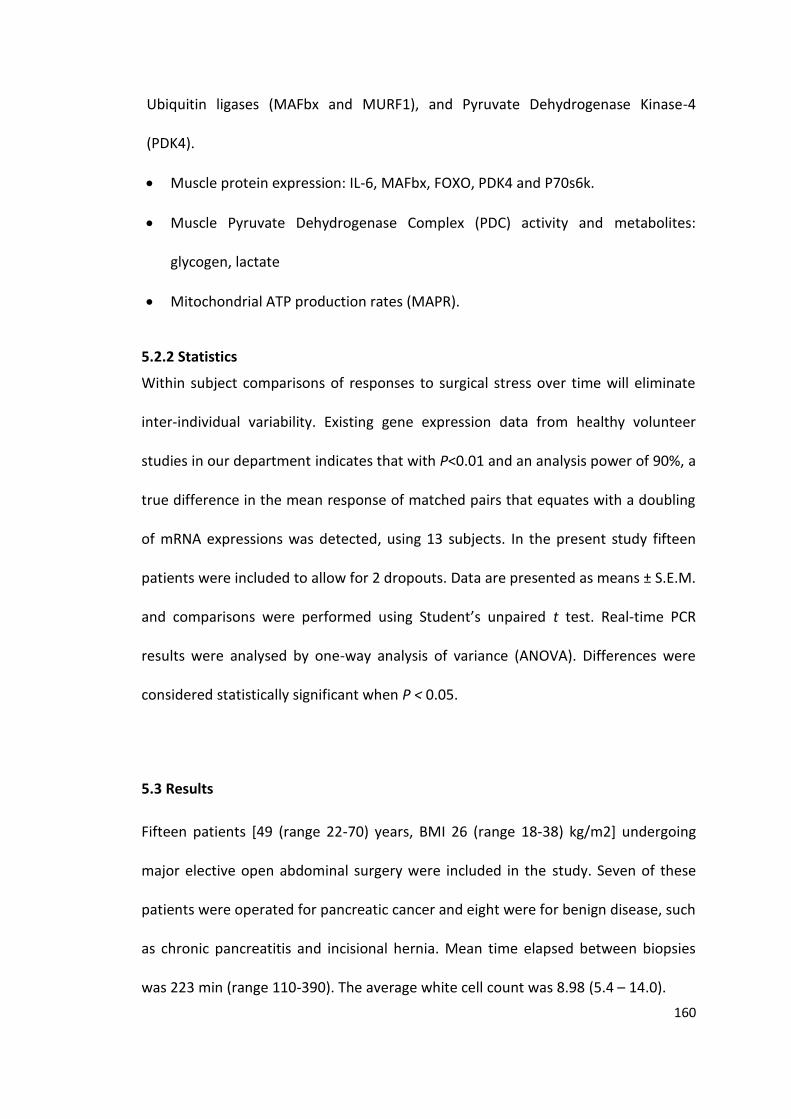
160
Ubiquitin ligases (MAFbx and MURF1), and Pyruvate Dehydrogenase Kinase-4
(PDK4).
Muscle protein expression: IL-6, MAFbx, FOXO, PDK4 and P70s6k.
Muscle Pyruvate Dehydrogenase Complex (PDC) activity and metabolites:
glycogen, lactate
Mitochondrial ATP production rates (MAPR).
5.2.2 Statistics
Within subject comparisons of responses to surgical stress over time will eliminate
inter-individual variability. Existing gene expression data from healthy volunteer
studies in our department indicates that with P<0.01 and an analysis power of 90%, a
true difference in the mean response of matched pairs that equates with a doubling
of mRNA expressions was detected, using 13 subjects. In the present study fifteen
patients were included to allow for 2 dropouts. Data are presented as means ± S.E.M.
and comparisons were performed using Student’s unpaired t test. Real-time PCR
results were analysed by one-way analysis of variance (ANOVA). Differences were
considered statistically significant when P < 0.05.
5.3 Results
Fifteen patients [49 (range 22-70) years, BMI 26 (range 18-38) kg/m2] undergoing
major elective open abdominal surgery were included in the study. Seven of these
patients were operated for pancreatic cancer and eight were for benign disease, such
as chronic pancreatitis and incisional hernia. Mean time elapsed between biopsies
was 223 min (range 110-390). The average white cell count was 8.98 (5.4 – 14.0).

161
5.2: mRNA expression in Rectus Abdominis and Vastus Lateralis Muscle, in patients
having major abdominal surgery
mRNA expression changes in both rectus and vastus muscle is shown as fold-change
from muscle biopsies taken at the start of surgery (pre-surgery) to those taken at the
end of surgery, where the pre-surgery results were set as one. The values in the
legend represent the statistical difference of gene expression between the two
muscle groups. (*represents significance from pre-surgery (p<0.05).
Biopsies from rectus muscle at the start and end of surgery, showed a significant
fold-change in gene expression changes for TNF-α (16.5-fold), FOXO1 (10.5-fold),
MafBx (11.5-fold), Cathepsin (7.5-fold) and PDK4 (7.8-fold) (Figure 2). Whereas, in
the vastus muscle, the fold change for mRNAs were significant for TNF-α (6-fold),
FOXO1 (2.3 fold), MafBx (6.4-fold), and PDK4 (3.5-fold) (Fig. 2).

162
5.3 Ratio of gene expression (Rectus Abdominis / Vastus Lateralis Muscle) in patients
having major abdominal surgery
The data from the present study showed marked alterations in gene expression in
skeletal muscle during major abdominal surgery. The ratio of mRNA expression
changes in both rectus and vastus muscle is shown as fold-change from muscle
biopsies taken at the start of surgery (pre-surgery) to those taken at the end of
surgery. The magnitude of response in the rectus muscle (being the site of the
maximal injury due to abdominal surgery) was greater for most genes studied, when
compared with gene expression from the vastus muscle. However, the pattern of
gene expression was similar across all genes in both groups of muscles. Cathepsin-L,
FOXO1, and IL-6 mRNA expressions were significantly higher in the rectus when
compared with vastus muscle (Fig. 5.2). (*represents significance from pre-surgery;
P<0.05). Muscle mRNA expressions of the two pro-inflammatory cytokines, IL-6 and
TNF-α, was greater at the end of surgery compared with pre-surgery. Specifically, in
the rectus, IL-6 mRNA expression was about 3000-fold higher.

163
Figure 5.4: IL-6 mRNA expression in vastus muscle in patients having major abdominal
surgery
The IL-6 mRNA expression in vastus, showed a highly significant fold change in IL-6
mRNA post-surgery (**P<0.01).
Thus, the gene expression data in patients undergoing major abdominal surgery,
shows that there was increased expression of mRNA involved in inflammation (IL-6,
TNF-α); muscle carbohydrate oxidation (PDK4) and protein breakdown (FOXO1,
MafBx, Cathepsin-L) postoperatively.

164
Figure 5.5: Protein expression in Rectus Abdominis muscle in patients having major
abdominal surgery
Figure 5.5 shows, fold-change in the relative optical density of IL-6, MafBx and PDK4,
ratio of phosphorylated p70s6k to total p70s6k, ratio of phosphorylated to total
FOXO1 proteins in patients undergoing major abdominal surgery, quantified by
Western blotting. Blank staple represents protein expression at start of surgery and
filled staple represents protein expression at end of surgery. (*, **, *** refers to
significance level of P<0.05, P<0.01, P< 0.001).
Major abdominal surgery resulted in a significant fold-change in protein expression
for IL-6 (5.9±2.23), PDK4 (4.49±1.85), P70s6k (14.9±3.8), phosphorylated P70s6k
(15.7±6.7), FOXO1 (11.21±4.08), and phosphorylated FOXO1 (7.82±3.28).
The corresponding western blots for MAFbx, phosphorylated FOXO1, FOXO1,
phosphorylated p70s6k, p70S6k, PDK4 and IL-6 in rectus muscle biopsies obtained at
the beginning (Pre) and end of surgery (Post) from patients undergoing major
abdominal surgery.

165
Figure 5.6: Protein expression in Vastus Lateralis muscle in patients having major
abdominal surgery
No significant fold-change were noted in the relative optical density in vastus muscle
for IL-6, MAFbx and PDK4, phosphorylated 70s6k, total p70s6k, phosphorylated and
total FOXO1 proteins in patients undergoing major abdominal surgery quantified by
Western blotting. Pre-surgery represents protein expression at start of surgery and
post-surgery represents protein expression at end of surgery.
Figure 5.7, also shows typical Western blots for MAFbx, pFOXO1, FOXO1, Pp70s6k,
p70S6k, PDK4 and IL-6 in vastus muscle biopsies. The values at the beginning (Pre)
and end of surgery (Post) from patients undergoing major abdominal surgery was not
significant (n = 15).

166
Figure 5.7: Gut permeability in patients having major abdominal surgery
Gut permeability test was performed using the 51Cr-EDTA method at the time of
screening and 24 hours postoperatively in patients undergoing major abdominal
surgery. The figure shows a significant increase in gut permeability following surgery.
Gut permeability (% urinary excretion of 51Cr-EDTA): Pre surgery: 4.79 ± 0.82; Post-
surgery: 7.30 ± 1.03; (* refers to significance level of P<0.05).
*

167
Figure 5.8: Plasma Cytokines in patients having major abdominal surgery
Figure 5.8 shows the concentration of plasma IL-6 and TNF-α during the volunteer
screening visit, pre-operatively (pre-op), at end of surgery (post op) and 24 hours
after surgery (24 hr). There was a significant increase in both plasma IL-6 and TNF-α
postoperatively, which remained elevated after 24 hours post-surgery, secondary to
the surgical stress response. (*, **, *** refers to significance level of P<0.05, P<0.01,
P< 0.001).

168
Figure 5.9: Plasma Insulin levels in patients having major abdominal surgery
Plasma insulin concentration was significantly lower at the end of surgery
compared with preoperative levels (screening: 14.2±2.2 versus post-surgery:
10.6±2.1, P<0.05). No significant differences for serum concentration of insulin
were noted between measurements taken at the start of surgery, end of surgery
and 24 hours postoperatively. (* refers significance value of P< 0.05).

169
Figure 5.10: Plasma Cortisol in patients having major abdominal surgery
Plasma cortisol concentrations were significantly increased at the end of surgery
compared with preoperative levels (mean difference ± standard error: 5.617±1.2;
*p<0.05). This suggests that following surgery, the counter-regulatory hormonal
response is induced secondary to the trauma of surgery, leading to an increase in
cortisol levels. However, cortisol concentrations seem to decrease to near- baseline
levels (pre-surgery levels) at 24 hours, suggesting that the degree of inflammation is
seem to subside with time, postoperatively and is considerably less when compared
with levels seen at the end of surgery.

170
Figure 5.11: Plasma Lactate in patients having major abdominal surgery
Plasma lactate concentration increased from 1.26±0.13 mmol/l at the start of surgery
to 1.82±0.22 mmol/l at the end of surgery, *P<0.05.
Figure 5.12: Free fatty acids in patients having major abdominal surgery
Following surgery, plasma FFA levels increased from pre-surgery (0.56 ± 0.11) versus
post-surgery (0.72±0.09) P<0.01. FFA levels declined from post-surgery to 24 hours
post-surgery (0.39±0.45) P<0.05).

171
Figure 5.13: Muscle Glycogen in patients having major abdominal surgery
Patients having major abdominal surgery showed a significant decrease in rectus
muscle glycogen concentration post-surgery [mean ± S.E.M): (306.93 ± 20.5 versus
213.64 ± 20.8); p<0.003].
Figure 5.14: Vastus- Pyruvate Dehydrogenase Activity in patients having major
abdominal surgery
The activation status of pyruvate dehydrogenase is shown in figure 5.14, as
measured by the assay of the rate of acetyl CoA production from pyruvate in muscle
homogenates. The results show a significant decrease in pyruvate dehydrogenase
complex activity, post-surgery, (PDC activity measured in mmol/acetylCoA min/kg
wet muscle @ 37°C; p<0.036).

172
Figure 5.15: Mitochondrial ATP production rate in patients having major abdominal
surgery
In patients having major abdominal surgery, a significant decline of mitochondrial
ATP production rates of approximately 50% was observed when Glutamate,
Glutamate+Malate, Palmitoyl-carnitine +Malate, Pyruvate+ Malate were used as
substrates.
Mitochondrial ATP production rates were suppressed post-surgery for the substrate
combinations of glutamate/succinate (19.21 ± 3.99nM/min/ml pre-operatively vs.
10.55 ± 2.33nM/min/ml post-operatively, p<0.05), palmitoyl carnitine/malate (9.76 ±
2.51nM/min/ml vs. 4.81 ± 1.03nM/min/ml, p<0.05), succinate (3.08 ±
0.76nM/min/ml vs. 2.28 ± 0.91nM/min/ml, p<0.05) and glutamate/malate (12.74 ±
2.88nM/min/ml vs. 6.75 ± 2.22nM/min/ml, p<0.05).

173
Figure 5.16: Glucose Tolerance Test in patients having major abdominal surgery
A glucose tolerance test was performed in all patients at the time of screening
(preoperative) and at 24 hours after surgery (postoperative). The test showed an
increase in both fasting and postprandial glucose levels postoperatively. When
compared with the preoperative levels, these results were highly significant,
confirming the development of postoperative insulin resistance after major
abdominal surgery.

174
5.4 Discussion
Postoperative muscle insulin resistance is a hallmark feature of patients having major
abdominal surgery. The results from the study in patients having major abdominal
surgery, suggest that surgical stress induced inflammatory response, was associated
with inhibition of Pyruvate Dehydrogenase Complex (PDC) controlled carbohydrate
oxidation secondary to raised PDK4 and may be an important causative factor in the
development of POIR. Furthermore, surgical stress induced up-regulation of protein
breakdown pathways by FOXO mediated up-regulation of ubiquitin ligase, MAFbx
mRNA and MAFbx protein, as well as Cathepsin-L mRNA. The present data suggest a
common signalling pathway involving Akt/FOXO and PDK4, which may be involved in
the impairment of carbohydrate oxidation and muscle protein breakdown, in patients
undergoing major abdominal surgery (Fig 5.17).
Fig 5.17: Mechanistic basis of postoperative muscle insulin resistance

175
Surgery induces a systemic inflammatory response which attracts macrophages,
neutrophils at the site of injury and generates important mediators including
cytokines such as IL-6 and TNF-α, which can act locally on the wound and also target
distant organs such as gut, liver and skeletal muscle (Hill and Hill, 1998). In keeping
with activation of inflammatory response following surgery, both the cytokines IL-6
and TNF-α mRNA were found to be up-regulated in our study (p<0.05). There was
also a significant increase in plasma IL-6 and TNF-α, postoperatively compared with
pre-operative concentrations. It has been reported that cytokines and counter-
regulatory hormones work synergistically to mediate the metabolic response to
trauma or sepsis (Watters et al., 1986). The inflammatory response induced by
cytokines is reported to affect IRS-1 binding (Rui et al., 2001) and decrease Akt1
signalling (Medina et al., 2005, Latres et al., 2005). These events could lead to
decreased phosphorylation of FOXO family of transcription factors and up-regulation
of FOXO gene targets such as MAFbx and PDK4 (Sandri et al., 2004, Crossland et al.,
2008).
The present study in patients undergoing major abdominal surgery showed a
significant increase in gut permeability following surgery (% urinary excretion of 51Cr-
EDTA): Pre surgery: 4.79 ± 0.82; Post-surgery: 7.30 ± 1.03; p<0.02. The amino acid,
glutamine is a main fuel for the enterocytes and is important to maintain the gut-
barrier function. In acute stress states, glutamine deficiency causes gut mucosal
atrophy and breakdown of the gut mucosal barrier. It has also been reported that
disruption of intestinal tight junctions or increased para-cellular permeability can
occur due to an intestinal disease, an initial injury or an inflammatory mediated

176
insult, allowing entry of luminal antigens, thereby triggering an exaggerated immune
response (Clayburgh et al., 2004, Hollander, 1999). The translocated bacteria or their
products in the portal or systemic circulation may induce a cytokine response via
activation of macrophages in either the liver or mesenteric lymph nodes and may
influence the ongoing metabolic processes (Deitch et al., 1994, Meakins, 1990). In
keeping with this, an increased risk of septic complications possibly due to changes in
the intestinal mucosal barrier, intestinal permeability and bacterial translocation
have been demonstrated in patients secondary to major abdominal surgery, severe
acute pancreatitis, burns, critical illness and major trauma (Chin et al., 2007,
Costantini et al., 2009, Qiao et al., 2009, Qiao et al., 2006, Takesue et al., 2002, Zhang
and Jiang, 2009).
Impaired PI3K/Akt1/FOXO signalling and the resultant up-regulation of PDK4 are
considered to be the key regulators of induction of insulin resistance. The protein
kinase-B, Akt1 is central to the insulin signalling mechanism in which its activation
regulates protein synthesis and its inactivation allows the expression of atrogin-1
(MAFbx), via up-regulation of FOXO. Stimulation of skeletal muscle with insulin-like
growth factor (IGF-1) leads to up-regulation of Akt1 and activation of protein
synthesis via mTOR/p70S6k, while inactivating the repressors of protein synthesis 4E-
BP1 and GSK3 (Nader, 2005).
The mRNA expression data shows Akt1 was not significantly up-regulated at the end
of surgery (Figure 5.2). Therefore, it is possible that following surgery, Akt1 was in a
predominantly dephosphorylated/inactive state, and the likely factor to cause Akt1
dysregulation and thereby FOXO signalling is TNF-α (Medina et al., 2005), which

177
enables FOXO1 to up-regulate PDK4. In the present study, major abdominal surgery
resulted in both, FOXO1 and PDK4 mRNA up-regulation postoperatively (10.5-fold
and 7.8fold respectively; p<0.05). This was also associated with a significant fold-
change (p<0.05), in protein expression for FOXO1 (11.21±4.08), PFOXO1 (7.82±3.28)
and PDK4 (4.49±1.85).
An increased expression of FOXO mRNA was likely to be responsible for the up-
regulation of the ubiquitin ligase, MAFbx (11.5-fold in rectus, 6.5–fold in vastus),
which is involved in atrophy signalling. It has also been reported that TNF-α
stimulates MAFbx expression via a p38 MAPK dependent mechanism in skeletal
muscle (Li et al., 2005). FoxO1, in addition to activation of the ubiquitin ligases, could
also enhance muscle atrophy through inhibition of myogenesis resulting from
enhanced myostatin expression (Allen and Unterman, 2007). In our study, there was
no significant upregulation of Myostatin in both rectus and vastus muscle,
postoperatively (Figure 5.2). However, there was a significant increase in protein
expression for phosphorylated p70S6k and total p70S6k (P70s6k: 14.9±3.8),
phosphorylated P70s6k: 15.7±6.7; p<0.05). However, the ratio of phosphorylated to
total p70s6k was not found to be significant, suggesting that there was no effect on
protein synthesis in the immediate postoperative period (Figure 5.6).
A likely factor causing inhibition of the pyruvate dehydrogenase complex (PDC) is the
FOXO1 mediated up-regulation of PDK4. PDC activity determines the glucose flux in
the mitochondria and thus controls the rate-limiting step in carbohydrate oxidation,
the oxidative decarboxylation of pyruvate to acetyl-CoA to be used in the tri-
carboxylic acid (TCA) cycle in the mitochondria subsequently, where reducing

178
equivalents are produced for use in the electron transport chain to generate ATP.
Inhibiting the activity of PDC by phosphorylation of the complex prevents the
conversion of carbohydrate-derived pyruvate into acetyl-CoA (Harris et al., 2001).
The study showed a reduced muscle PDC activity at the end of surgery compared
with pre-surgery levels (p<0.05), confirming that surgical stress induced increase in
PDK4 decreased PDC activity (5.15) and resulted in decreased mitochondrial ATP
production (Figure 5.16).
Evidence from other studies also shows that inflammation plays an important role in
muscle carbohydrate metabolism in surgical patients. A study in patients undergoing
major gastrointestinal surgery highlighted the involvement of local inflammatory
mediators in surgical stress (Witasp et al., 2009a). The study showed an increased
expression of genes encoding inflammation such as IL-6 and TNF-α, whilst the
changes in expression of genes encoding molecules involved in insulin signalling and
glucose transport such as insulin receptor substrate 1 (IRS1), phosphoinositide-3-
kinase (PI3K) and GLUT4 were less marked. Similar gene expression changes for IL-6
were noted in epicardial and subcutaneous adipose tissue in patients undergoing
cardiac surgery (Kremen et al., 2006) and in skeletal muscle of patients undergoing
open cholecystectomy and hernia repair (Thorell et al., 1996b), which also reported a
significant linear relationship between the reduction in relative insulin sensitivity and
the concomitant plasma levels of IL-6, with only minor increments in the levels of
stress hormones postoperatively. Other studies have also reported that cytokines
also influence skeletal muscle catabolism both directly by modulating protein
synthesis and degradation and indirectly, through inhibition of the regulatory action
179
of anabolic hormones (Vary, 1998) and activation of hypothalamic-pituitary-adrenal
axis (Navarra et al., 1991). Thus it was established from the present study and the
evidence from the aforementioned studies that the transcriptional regulation of
MAFbx and PDK4 via FOXO1 is intrinsically linked to the inflammatory state and
cellular metabolic status via a co-ordinated pathway of signalling events.
Evidence from this present study highlighted important cellular events in
carbohydrate metabolism that may lead to postoperative muscle insulin resistance
and hyperglycaemia. Patients having major abdominal surgery had increased plasma
concentrations of free fatty acids, lactate and cortisol, postoperatively, possibly as a
consequence of the metabolic response to surgery and increased catecholamine
activity, which results in an increased turnover of free fatty acid and glycerol from
adipose tissue. Cortisol, along with other counter-regulatory hormones such as
catecholamines, glucagon and growth hormone, can raise blood glucose by enhanced
glycogenolysis and gluconeogenesis (Rizza et al., 1982, Nosadini et al., 1983). In
keeping with this finding, there was also a significant decrease in rectus muscle
glycogen concentration post-surgery [mean ± SD): (306.9 ± 79.6 versus 213.6 ± 80.5;
p<0.003] and an increased lactate production which was significantly raised
postoperatively (1.26±0.13 mmol at the start of surgery to 1.82±0.22 mmol at the
end of surgery, P<0.05), possibly from muscle glycogenolysis and increased
metabolism in the hypoxic injured tissues. Evidence show that increased lactate
production in the acute inflammatory state is subsequently utilized by the liver for
gluconeogenesis in the ‘Cori cycle’, for maintaining the energy supply in the trauma
(Shaw and Wolfe, 1989), in patients with burns (Wilmore et al., 1980, Frayn, 1985).

180
Evidence from studies in patients undergoing surgery, shows a significantly higher
plasma concentrations of glucose (Brandi et al., 1990, Crowe et al., 1984),
noradrenaline and glucagon whilst the levels for insulin, growth hormone, cortisol
and adrenaline were unaltered (Thorell et al., 1994). Postoperative hyperglycaemia
was associated with increased insulin requirements to maintain euglycaemia (Brandi
et al., 1990) and a raise in counter-regulatory hormones, whole body protein
oxidation and energy expenditure (Brandi et al., 1990). It was noted that glucose
utilisation was significantly depressed during and after surgery along with
suppression of insulin secretion during operation, increased plasma cortisol levels
and an increased urinary catecholamine excretion (Wright et al., 1974). Other studies
investigating serum insulin changes in surgical patients, have reported a lower insulin
levels at the start of surgery compared with intraoperative and postoperative periods
(Crowe et al., 1984, Nygren et al., 1998b, Aarimaa et al., 1974), and impaired insulin
response both intra-operatively (Wright et al., 1974, Barton, 1985) and soon after
surgery (Stenberg et al., 1984, Aarimaa et al., 1974). Brandi et al, also reported an
impaired whole-body glucose disposal by 33-60%, in patients 6 -8 hours after
undergoing major abdominal surgery whilst the hepatic glucose production at
baseline was less suppressed by insulin, which was associated with increased cortisol,
lactate and total lipolysis (plasma free fatty acid and glycerol levels) (Brandi et al.,
1993).
Thus it is clear that the antagonistic actions of counter-regulatory hormones such as
glucagon, cortisol and catecholamines, impair the metabolic actions of insulin and
may contribute to the development of insulin resistance in the immediate

181
postoperative period (Krentz, 1996). The evidence from the aforementioned studies
shows that a failure of cellular glucose utilisation along with the changes in insulin
response, is an important event in the metabolic response to injury that may lead to
the stress induced hyperglycaemia, noticed in patients undergoing major abdominal
surgery.
In conclusion, the results of the present study in surgical patients showed an
increased plasma IL-6, as well as a marked up-regulation of muscle IL-6, PDK4 mRNA
expression and a decrease in PDC activity. This was associated with impaired glucose
tolerance and increased gut permeability postoperatively. Furthermore, plasma
concentrations of free fatty acids, cortisol and lactate were increased along with a
decrease in muscle glycogen concentration postoperatively. However, no significant
changes in insulin concentration were observed during surgery. Interestingly, the
aforementioned changes in the carbohydrate oxidation were also associated with a
decrease in pyruvate mediated mitochondrial ATP production in the immediate
postoperative period. This is the first study that has shown the changes in molecular
mechanisms underlying the development of postoperative insulin resistance in
patients having major abdominal surgery. The findings also support the intrinsic link
between the metabolic response to surgery and inflammation that leads to inhibition
of carbohydrate oxidation in patients having major abdominal surgery.

182
Chapter 6
Randomised control trial of Preoperative carbohydrate and Dichloroacetate on
skeletal muscle insulin resistance following major abdominal surgery

183
6.1 Introduction
The study in patients undergoing major abdominal surgery described in the previous
chapter, demonstrated that surgical stress and inflammation contribute to the
development of POIR. Surgical stress resulted in a marked up-regulation of muscle
interleukin-6 and pyruvate dehydrogenase kinase isoform-4 (PDK4) mRNA and
protein expression which occurred concomitantly with a decreased muscle pyruvate
dehydrogenase complex activity. Furthermore, we have also shown that increased
muscle PDK4 expression inhibits the activity of pyruvate dehydrogenase complex
(PDC), which represents the rate-limiting step for muscle carbohydrate (CHO)
oxidation. Importantly, these alterations in molecular signalling secondary to surgical
stress were associated with impaired glucose tolerance, decreased mitochondrial ATP
production, increased gut permeability, increased free circulating fatty acids, and
decreased muscle glycogen levels postoperatively. Impaired PI3K/Akt1/FOXO
signaling and the resultant up-regulation of PDK4 are considered to be the key
regulators of insulin resistance (Murton et al., 2008, Kim et al., 2006, Stitt et al.,
2004).
6.1.1 Preoperative carbohydrate treatment (CHO)
Elective surgical procedures have been traditionally performed after an overnight
fast. This period of fasting extends beyond 12 hours, whilst awaiting surgery.
Provision of CHO has been shown to improve patient comfort before surgery, reduce
anxiety and thirst before surgery (Hausel et al., 2001). Perioperative interventions
such reduced preoperative fasting times, preoperative oral carbohydrate (CHO),
minimally invasive incisions and early enteral feeding postoperatively, may help

184
minimise the surgical stress response and attenuate the development of POIR, in
surgical patients (Lassen et al., 2009a). A study in patients having open
cholecystectomy reported that pre-operative carbohydrate (CHO) feeding with an
infusion of 300 g glucose instead of an overnight fast, reduces POIR by 50%, similar to
a level seen in patients having a relatively minor surgery such as a hernia repair
(Ljungqvist et al., 1994). This was supported by the findings that there is an up-
regulation of skeletal muscle PDK4 mRNA expression after 48 hours of starvation,
associated with a 42% reduction in insulin sensitivity and provision of carbohydrate
derived pyruvate down-regulates PDK4 (Nygren et al., 1998a). This suggests that
muscle PDK4 would be a prime target in carbohydrate oxidation and that CHO
favours oxidative glucose disposal in skeletal muscle by its effect on PDK4.
Wang et al investigated whether altered insulin dependent activation of the PI3K/PKB
signalling pathway would contribute to the development of POIR, in surgical patients
(Wang et al., 2010). POIR and subjective wellbeing was significantly better in the CHO
group than in the fasting/placebo group. At the end of surgery, muscle protein-
tyrosine kinase activities, as well as PI3K and PKB levels were significantly increased in
the CHO group. Even in diabetic patients, CHO was shown to reduce preoperative
thirst, anxiety, postoperative nausea and vomiting and to also improve insulin
sensitivity (Hendry et al., 2008, Ramos et al., 2008). It has also been reported that
CHO is safe, alters immune and catabolic response to surgery and it did not alter
gastric pH, content or gastric emptying, and there was no increased risk of aspiration
during anaesthesia in surgical patients (Ljungqvist and Soreide, 2003).
These findings are supported by the results from the systematic review and meta-

185
analysis of RCTs of the effect of CHO in patients undergoing major abdominal surgery
presented in chapter 4, which showed a reduced length of stay [mean difference,
95% confidence interval: 1.08 (1.87 to 0.29); I2 < 60%, p < 0.007]. CHO reduced
postoperative insulin resistance with no effect on in-hospital complications over
control (risk ratio, 95% confidence interval, 0.88 (0.50 - 1.53), I2 = 41%; p <0.640).
Therefore, attenuating POIR with CHO and increasing coupling of glycolysis to glucose
oxidation seems a promising strategy in elective surgical patients.
6.1.2 Dichloroacetate
Dichloroacetate, a halogenated carboxylic acid has been shown to increase PDC
activity by inhibiting PDK4 in animals (Whitehouse and Randle, 1973) as well as
humans (Timmons et al., 1998a, Constantin-Teodosiu et al., 2012, Constantin-
Teodosiu et al., 1999). DCA is reported to promote muscle (Constantin-Teodosiu et
al., 1999) and liver oxidative glucose disposal (Shangraw et al., 1998) and leads to
decreased blood glucose (Stacpoole et al., 1978). Inhibition of PDK4 and activation of
PDC, shifts the metabolism of pyruvate from glycolysis towards the oxidative
pathway in the mitochondria, resulting in increased carbohydrate oxidation and
mitochondrial ATP production. DCA has been shown to be a more potent
pharmacological inhibitor of PDK4 than pyruvate (Bowker-Kinley et al., 1998,
Stacpoole and Greene, 1992). Previous human studies utilizing DCA in patients with
lactic acidosis (Stacpoole et al., 1983) and healthy volunteers during exercise (Carraro
et al., 1989) have shown reduced blood lactate accumulations, reduced reliance on
non-oxidative production of ATP in muscle by decreased glycogen breakdown,

186
following exercise and a better match between pyruvate production and oxidation
(Timmons et al., 1998a).
6.2 Hypothesis and aims
The study in patients undergoing major abdominal surgery showed that surgical
stress and inflammation contributes to the development of POIR secondary to
changes in insulin signalling, with a marked up-regulation of PDK4. The decrease in
PDC activity resulted in impaired carbohydrate oxidation and decreased
mitochondrial ATP production, making PDK4 an important metabolic target to
attenuate the development of POIR. Moreover, the evidence from the
aforementioned studies shows that both CHO and DCA given to patients
preoperatively could lead to improvements in POIR and reduction in surgical stress
induced hyperglycaemia in the postoperative period, possibly by inhibiting PDK4.
Therefore, maximising the contribution from oxidative ATP regeneration by
activation of PDC using DCA or by enhancing glucose uptake using preoperative
strategies such as oral carbohydrate drinks, may potentially attenuate the
development of postoperative muscle insulin resistance.
Specifically, by addressing the alterations in FOXO gene targets namely PDK4 and
PDC, that is primarily responsible for development of POIR, the aim was to
investigate whether, increasing preoperative PDC activity and flux using DCA infusion
improved POIR over and above that seen with CHO ingestion alone.

187
Whilst the impact of CHO on attenuating the development of POIR has been studied
in surgical patients, the effect of DCA on POIR in patients having surgery has not been
investigated previously. Moreover, it would be interesting to study whether DCA
could act synergistically with CHO in improving oxidative glucose disposal and
mitochondrial ATP production in patients having major abdominal surgery previously.
6.3. Methods
6.3.1 Study design and ethics
Twenty adult patients undergoing major open elective gastrointestinal surgery were
randomised using a computer-generated central randomisation in this open-labelled
study into 2 groups of 10 each, to receive one of the following preoperative
interventions, Group (1): CHO and Group (2): CHO and DCA. The approval for this
randomised controlled, open-labelled trial was obtained from the Cambridgeshire
Research Ethics Committee and NHS Ethics Committee and was performed in
accordance with the Declaration of Helsinki.
Patients who expressed an interest to take part in the study were invited to a
subsequent screening visit and an informed consent was obtained. Data regarding
the participants’ demographics, general health, clinical diagnosis and the type of
surgical procedure were collected. About 15mls of blood were taken for plasma
glucose, insulin and cortisol. Patients were then provided with a glucose drink and
further blood tests were done at regular intervals for 3 hours following the drink to
check for glucose and insulin levels during the Glucose Tolerance Test (GTT).
188
6.3.2 Inclusion criteria & Exclusion criteria
All patients over 18 years of age who were undergoing major elective open
abdominal surgery and provide a written informed consent to participate in the study
were included. Patients who were undergoing emergency surgery, suffering from
chronic illness, (e.g. diabetes) or other debilitating diseases, on long term anti-
inflammatory drugs, (e.g. NSAIDS, Steroids, immunosuppressant), on long term
antibiotics, on statins, on full therapeutic dose of anticoagulants, or aspirin >325
mg/day, clopidrogel >75 mg/day, suffering from bleeding diathesis, pregnant or
breastfeeding and who were unable to give consent were excluded.
6.3.3 Preoperative Interventions
Preoperative carbohydrate drinks (CHO) group: Patients who were randomised to
CHO group CHO (n=10) ingested 800ml PreOp (Nutricia Clinical Care, 12.5 g CHO/100
ml) the night before and 400ml in the morning of surgery, about 3 hours before the
induction of anaesthesia.’ Nutricia preOp’ is a food for special medical purposes for
the preoperative dietary management of surgical patients, produced by N.V.Nutricia,
in The Netherlands. It is a 0.5kcal/ml, clear, non-carbonated, lemon flavoured iso-
osmolar carbohydrate drink, containing sweeteners. There are no special risks
associated with the drink being ingested 4 hours before surgery, as studies indicate a
mean gastric emptying time of CHO within this range and is now part of standard
care in patients having major surgery in some centres.

189
Dichloroacetate group (DCA): The patients in the DCA with CHO group received the
CHO drinks as well as an intravenous infusion of DCA (50mg/kg body weight) over 45
min, one- two hours before the induction of anaesthesia. Dichloroacetate was
manufactured by ‘Alfa Aesar’, UK, with the active compound as ‘Sodium
dichloroacetate’ (CAS Number 2156-56-1), which has been identified to be used for
research and development purposes (ref: SU24). This product is commercially
available in the EU, (EINECS number: 218-461-3). This is an open-labelled study and
therefore, no attempts were made to blind the product from the users.
Dichloroacetate was dispensed on the day of surgery from the sterile production unit,
Nottingham University Hospitals, Queen’s Medical Centre Campus, after passing the
quality control measures, and infused intravenously based on individual patient’s
body weight.
The description of interventions used in this study is presented in fig. 6.1.
Figure 6.1: Time course of sample collection from patients undergoing major
surgery
Screening Preoperative During the operation 2nd
post operative
day
D7-14 Days Night before 2 hr before surgery Start of surgery End of surgery Day 2
Postop.
GTT GTT
- Blood samples - Preoperative carbohydrates - Muscle Biopsy - Surgery
GTT – Glucose Tolerance Test, at screening visit and on 2nd
post operative day
190
6.3.4 Blood tests
Following an overnight fast, patients had an oral glucose tolerance test (GTT) at the
screening visit (about 1-2 weeks before surgery) and on the second postoperative day
as described in chapter 2. Insulin resistance was quantified using homeostatic model
assessment of insulin resistance (HOMA-IR) using plasma glucose and insulin levels.
Analysis of plasma insulin, glucose and cortisol were performed at screening, during
surgery and on the 2nd postoperative day.
6.3.5 Muscle biopsy
A total of four small samples of muscle tissue was taken according to a standard
protocol, at the start and the end of the operation as follows: one sample was taken
from rectus abdominus muscle in the abdomen and one sample from a single incision
(about 1cm) placed on outer part of thigh (vastus lateralis muscle) at the beginning
and also at the end of operation under general anaesthesia. Another muscle biopsy
from the thigh was taken under local anaesthesia on the second postoperative day
for analysis of mRNA and proteins involved in the insulin signaling pathway, as
described in chapter 2. It was ensured that the collection of samples did not alter the
course of the operation or compromise patients’ safety whilst undergoing surgery.
The patients had the standard postoperative care, including diet and physiotherapy,
as any other patient having elective major abdominal surgery. The study was
conducted at the Division of Gastrointestinal Surgery, Queen’s Medical Centre and
the School of Biomedical Sciences, University of Nottingham.

191
6.3.6 Primary endpoint
The relative change in insulin sensitivity calculated using the HOMA-IR method,
between preoperative and postoperative levels, in patients undergoing major
abdominal surgery.
6.3.7 Secondary endpoints
1. The relative change in mRNA expressions for genes involved in muscle insulin
signaling namely, Akt1, FOXO1, PDK4, and muscle cytokines, IL-6, and TNF-α in vastus
and rectus muscles of patients, before and after undergoing major abdominal surgery
following the preoperative interventions. 2. Mitochondrial ATP production rates in
patients undergoing major abdominal surgery.
6.3.8 Sample size justification
Sample size was estimated from a two-sample means test with a 95% degree of
confidence for two groups with comparable standard deviations and a 2-fold mean
difference and with the α and β values fixed at 0.05 and 0.2 (power 0.8), respectively.
Within each group the preoperative level of expression was given a value of 1, and
fold changes in mRNA and protein expression after surgery and postoperative were
calculated, relative to pre-surgery. Comparison of gene and protein data between
and within groups was carried out by Mann-Whitney U and Wilcoxon t-tests,
respectively. Insulin sensitivity data were analysed by Student's independent t-test.
Data are presented as mean ± SEM. Differences were considered significant at P <
0.05.

192
6.4 Results
Twenty patients participated in the trial. However, two patients, one patient from
each group discontinued participation and accounted for two drop-outs following
recruitment. The mean (SE) age and body mass index of the patients in the CHO
group were 59 (4.6) years and 27.2 (1.5) kg/m2 respectively. The corresponding
values for the DCA group were 58 (4.5) and 29 (3.5) kg/m2 respectively. These
differences were not statistically significant. All patients complied with the protocol
for ingestion of CHO drinks, and no patient had any drink related complications.
Similarly the DCA group had DCA infusion about 2.8 ± 0.6 hours before
commencement of surgery. The mean time between the muscle biopsies taken at the
beginning and end of surgery were 269 (range: 130 – 380) minutes in the CHO group
and in the DCA 284 (range: 143 – 352) minutes.
6.4.1 Gene expression in Rectus Abdominis and Vastus Lateralis Muscle
In this section, the changes in gene expression results for both groups are presented
across all time points. The gene expression level from vastus muscle taken before
start of surgery for the CHO group was taken as the baseline-value, which was set as
one. For both groups (CHO & DCA), the columns in the graphs represent fold-change
in gene expression for individual time-points, from the base-line value.
The muscle biopsies were taken from rectus and vastus, at the start of surgery (pre-
op), at the end of surgery (post op) and also on the second postoperative day (48
hours postop).

193
Figure 6.2: CHO group - Gene expression in Rectus Abdominis in patients having
major abdominal surgery
Figure 6.3: CHO group - Gene expression in Vastus Lateralis in patients having
major abdominal surgery
Figures 6.2 and 6.3 show the gene expression changes before and after surgery in
patients undergoing major abdominal surgery for the CHO group, in the rectus and
vastus muscle groups respectively.
The gene expression changes in the vastus muscle before the start of surgery in the
CHO group was considered as the baseline value. The figures shows that mean fold-
change for all the genes measured before and after surgery. CHO treatment did not
significantly alter the gene expressions of PDK4, FOXO1, MYOSTATIN, TRIM63
(Ubiquitin ligase – up-regulation causes protein breakdown) and TNF, in both rectus
and vastus muscles when compared to pre-surgery levels, in patients undergoing
major abdominal surgery.
Fold
ch
ange
fro
m V
LCH
O p
re-s
urg
ery

194
Figure 6.4: DCA group - Gene expression in Rectus abdominis in patients having
major abdominal surgery
Figure 6.5: DCA group - Gene expression in Vastus Lateralis in patients having major
abdominal surgery
Figures 6.4 and 6.5 show the fold-changes in gene expression in rectus and vastus
muscle for the DCA group respectively, at the start of surgery, end of surgery and 48
hours after surgery. The gene expression changes in the vastus muscle before the
start of surgery in the CHO group was considered as the baseline value. The gene
expressions in the DCA group are represented as fold changes from this baseline
value. Mean fold-change for all the genes measured were not significant across all
time-points for the DCA group, in both rectus and vastus. The results suggest that
DCA treatment did not significantly alter the gene expression of PDK4, FOXO1,
MYOSTATIN, TRIM63 (Ubiquitin ligase – up-regulation causes protein breakdown)
and TNF, when compared with pre-surgery levels in patients having major abdominal
surgery.

195
Figure 6.6: DCA vs CHO group - Gene expression in Rectus Abdominis in patients
having major abdominal surgery
Figure 6.7: DCA vs CHO group - Gene expression in Vastus Lateralis in patients
having major abdominal surgery
Figures 6.6 and 6.7: Gene expression changes for the both the CHO and DCA groups
in the rectus and vastus muscle groups respectively, in patients undergoing major
abdominal surgery. The gene expression changes in the vastus muscle before the
start of surgery in the CHO group was considered as the baseline value.
The results show that mean fold-change for all the genes measured were not
significant across all time-points measured, for both CHO and DCA groups. The
results suggest that both CHO and DCA treatments resulted in no significant changes
in gene expressions of those involved in the development of muscle insulin
resistance and protein breakdown such as PDK4, FOXO1, MYOSTATIN, TRIM63
(Ubiquitin ligase - upregulation causes protein breakdown) and TNF, postoperatively,
when compared with the levels at the start of surgery in the CHO group.

196
6.4.2 Metabolic assays
Figure 6.8: Plasma Insulin levels in CHO and DCA group in patients having major
abdominal surgery
The above figure shows plasma insulin concentrations (mU/L) for CHO and DCA
groups at screening, during surgery and 48 hours post-surgery. Insulin
concentrations between both groups were not significant at screening visit and
during surgery. However, The CHO group had a significantly higher insulin
concentrations in the postoperative period (48 hours after surgery) compared
with DCA (p<0.05), suggesting higher insulin concentrations were needed in the
CHO group compared with the DCA group to maintain euglycaemia.

197
Figure 6.9: Plasma Glucose levels in CHO and DCA group in patients having major
abdominal surgery
Figure 6.9 shows plasma glucose concentrations (mmol/L) for CHO and DCA
groups groups at screening, during surgery and 48 hours post-surgery. Plasma
glucose concentrations were not significant between both groups at any given
time-point. However, the glucose concentrations were significantly higher during
surgery than preoperative or postoperative levels in both CHO and DCA groups
(p<0.05).

198
Figure 6.10: Plasma Cortisol levels in CHO and DCA group in patients having major
abdominal surgery
Figure 6.10 shows plasma cortisol concentrations (ng/ml) for CHO and DCA
groups. Plasma cortisol concentrations were not significant between both groups
at any given time-point. There were no significant changes in either group
following surgery compared with preoperative levels, suggesting that provision of
both CHO and DCA did not have a significant effect on cortisol levels, despite
changes in insulin and glucose concentrations at the same time points.

199
Figure 6.11: HOMA-IR values in CHO and DCA group in patients having major
abdominal surgery
Figure 6.11: The Homeostatic Model Assessment (Homa-IR) was used to quantify
insulin resistance in patients undergoing major abdominal surgery. It is reported
to correlate with the hyperinsulinaemic-euglycaemic clamp method
(r=0.88)(Matthews et al., 1985).
The formula for HOMA-IR: (Glucose X Insulin) divided by 22.5. Normal: <3;
Moderate insulin resistance: 3-5; Severe insulin resistance: > 5.
HOMA-IR quantified using fasting values of plasma glucose and insulin at the
following time points: screening, at the start of surgery, post-surgery and 48 hours
after surgery. The results show that no significant differences were noted
between the CHO and DCA groups. The HOMA-IR values (ranging from 1.5 – 4), for
both groups reflect that both groups maintained preoperative insulin sensitivity in
the postoperative period, after CHO and DCA.

200
Figure 6.12 Glucose Tolerance Test group in patients having major abdominal
surgery
Figure 6.12 shows the glucose tolerance test (GTT), performed preoperatively at
screening visit and 48 hours postoperatively in both CHO and DCA groups. The
values in x-axis represented as pre-fast indicates values before the glucose drink
and pre-120 indicates 2 hours after glucose drink, during the GTT. No significant
differences for fasting or post-prandial glucose concentrations were noted
between CHO and DCA groups. This suggests that surgical stress did not
contribute to a significant increase in postoperative plasma glucose
concentrations, following either CHO or DCA.

201
Figure 6.13 Mitochondrial ATP Production Rate group in patients having major
abdominal surgery
Mitochondrial ATP production rates, in patients undergoing major abdominal
surgery, measured at the start of surgery and at the end of surgery from the
vastus muscle for both CHO and DCA groups. MAPR were quantified using
pyruvate as a substrate and data normalised for mitochondrial content using
citrate synthase activity. Differences between groups * p=0.05, ***p<0.001.
DCA increased mitochondrial CHO oxidation above that achieved by CHO alone,
which waned by 48hr post-surgery. MAPR (µmol ATP/min/mmol acetyl-CoA); CHO
vs DCA: Using pyruvate as substrate [pre-surgery 6663 ± 1015 vs 10516 ± 1488];
[post-surgery 7415 ± 2804 vs 5031 ± 556]. Nevertheless, this was associated with a
trend for improved POIR 48 hours post-surgery relative to CHO. The values for
DCA were significantly raised compared with CHO for Glutamate+Succinate and
Glutamate+Malate.

202
6.5 Discussion
The present randomised study in patients undergoing major abdominal surgery,
has demonstrated that both preoperative CHO and DCA attenuated the
development of POIR. The results show that preoperative administration of CHO
and DCA was not associated with an increased expression of genes involved in the
development of POIR, in contrast to our earlier study in surgical patients, which
showed that surgical patients was associated a marked degree of POIR, with
increased PDK4 mRNA expression and decreased PDC activity (chapter 5).
In this present study, the important molecular targets responsible for POIR, such
as FOXO and PDK4, did not show marked increase in fold-change in mRNA
expression between preoperative and postoperative levels for both CHO and DCA
(fig 6.7). This suggests that factors responsible for increase in POIR such as the
surgical stress and inflammation were modulated as a result of treatment with
CHO and DCA, resulting in a better maintenance of insulin sensitivity
postoperatively. However, no significant differences were noted between the two
treatment groups, in causing attenuation of POIR in surgical patients.
Serum insulin and blood glucose concentrations were not significantly different
between groups at any point, but a strong trend for blood glucose to be lower in
DCA 48 hours post-surgery was noted (fig 6.8 and fig 6.9). Interestingly the insulin
requirements in the CHO group were significantly higher to suppress the plasma
glucose concentrations to that of DCA group, 48 hours after surgery. However,
plasma cortisol concentrations were not different between the two groups at the

203
same time points (6.9), suggesting attenuation of the surgical stress response to a
certain degree, in contrast to our earlier study showing increased plasma cortisol
concentrations postoperatively (chapter 5). This was reflected in the finding that
there was better maintenance of insulin sensitivity in the HOMA-IR values, ranging
from 1.5 – 4 (fig 6.10). Similarly, expression of pro-inflammatory cytokine, TNF-α
mRNA and genes involved in protein breakdown, Cathepsin and Trim63, were not
up-regulated following surgery (fig 6.7), suggesting a trend towards increased
anabolism with the use of CHO and DCA.
The results are in line with a study which investigated the effects of CHO on
metabolic stress response in patients having elective abdominal surgery, showed
CHO resulted in lower fasting glucose, HOMA-IR index, cortisol and IL-6 in the
immediate postoperative period. These reductions were independent of age, sex,
body mass index and major abdominal surgery (Vigano et al., 2012).
The effect of starvation and the protective effects of preoperative feeding have
been investigated in many studies (Awad et al., 2009b, Svanfeldt et al., 2005, Faria
et al., 2009). A study in patients having cholecystectomy showed that
preoperative CHO compared with placebo drink, showed muscle PDK4 mRNA and
protein expression was 4-fold lower in the carbohydrate group. Moreover, the
study also showed improved activities of mitochondrial membrane complexes (I, II
and IV), 4 h after ingestion of CHO (Awad et al., 2010). Faria et al, reported that
plasma glucose, lactate, insulin, lactate/pyruvate ratio to be significantly higher in
patients who had placebo drink than those who had CHO, preoperatively (Faria et
al., 2009). A study in healthy volunteers on the effects of starvation and refeeding

204
showed increased mRNA expression of PDK4 by 4-fold and 42% decrease in insulin
sensitivity, independent of the phosphorylation status of FOXO1 during fasting
(Tsintzas et al., 2006). Studies have also shown that CHO treatment results in less
postoperative losses of nitrogen and protein (Svanfeldt et al., 2007, Crowe et al.,
1984), a better-maintained lean mass (Yuill et al., 2005), muscle strength
(Henriksen et al., 2003, Noblett et al., 2006b) and accelerated recovery (Nygren et
al., 2001).
There have been no studies to date that investigated DCA infusion in surgical
patients and had shown improvements in carbohydrate oxidation and attenuation
in POIR. The present study, whilst demonstrating better maintenance of insulin
sensitivity in the postoperative period using CHO, has also shown that CHO
ingestion preoperatively results in improved pyruvate flux into the mitochondria
during the intraoperative period. This is probably because the effect of DCA is
more pronounced during the first few hours after infusion, where CHO entry is
facilitated into tissues, including mitochondria, reflected by lower insulin levels at
the end of operation and during the immediate postoperative period. Studies in
animals and human volunteers using contracting ischemic human muscle and in
subjects performing leg extensor exercises have shown that DCA infusion
improved substrate availability for aerobic ATP production and resulted in
increased resting PDH activation, less phosphocreatine utilisation and decreased
glycogen breakdown (Timmons et al., 1998b, Timmons et al., 1996, Timmons et
al., 1998a, Timmons et al., 1998c).

205
Muscle mitochondrial function was quantified by assaying ATP production during
the utilization of a number of different substrates. Both CHO and DCA groups
demonstrated better maintenance of mitochondrial ATP production. Importantly,
comparison between the groups showed that DCA increased preoperative
pyruvate mediated mitochondrial ATP production rates (MAPR) above CHO alone,
which was not evident 48 hours post-surgery. MAPR was higher in the DCA group,
when Glutamate+Malate and Glutamate+Succinate were used as substrates for
mitochondrial oxidation (Fig 6.13). Though, based on a relatively heterogenous
group of patients, using gene expression data and changes in plasma insulin,
glucose and cortisol levels we have comprehensively demonstrated increased
glucose oxidation towards a glycolytic pathway and increased mitochondrial ATP
production, which has not been studied in surgical patients previously.
In summary, the present study in patients having major abdominal surgery
supports our hypothesis that administration of either CHO or CHO with DCA,
attenuates the impairment of CHO oxidation and the development of POIR,
induced by surgical stress. Furthermore, DCA increased mitochondrial CHO
oxidation above that achieved by CHO alone, which waned by 48hours post-
surgery.

206
Chapter 7
General discussion

207
7.1 Research objectives & Aims
Patients undergoing major abdominal surgery respond to surgical trauma
postoperatively with a series of cellular and molecular events which contributes to
the development of POIR. The nature of the underlying disease, type of surgery, the
magnitude of the surgical procedure and the metabolic response to surgery could
have a negative impact on patient recovery. The resultant stress-induced
hyperglycaemia is reported to be associated with increased postoperative
morbidity and delayed recovery (Thorell et al., 1999b, van den Berghe et al., 2001,
Jackson et al., 2012). ERAS protocols attempt to attenuate the surgical stress
through a series of perioperative interventions, including reduced preoperative
fasting and ingestion of oral carbohydrate drinks preoperatively. However, the
underlying molecular mechanisms contributing to the development of
postoperative insulin resistance in patients having major abdominal surgery and the
mechanisms by which the preoperative interventions attenuate surgical stress are
not well defined.
The present thesis examined the molecular mechanisms of the metabolic response
to surgical trauma which contributes to the development of POIR. Thus the overall
aims were as follows:
(1) To examine the evidence behind the principles of the ERAS pathway and the
effect of preoperative carbohydrate loading on postoperative outcomes, in patients
undergoing major abdominal surgery using a systematic and meta-analytical
approach

208
(2) To study the molecular basis of the metabolic response to surgery underlying
the development of postoperative muscle insulin resistance with particular
emphasis on changes in insulin signalling and mitochondrial function. Specifically, to
investigate whether alterations in the insulin mediated, Akt/FOXO and PDK4
signalling pathway underlies the development of insulin resistance following
surgical stress and whether these changes in the signalling mechanisms were
associated with increased inflammatory gene expression in skeletal muscle and
(3) To study the effect of interventional strategies such as preoperative
carbohydrate loading, in attenuating the development of POIR in patients
undergoing major abdominal surgery.
7.2 Study outcomes
ERAS pathway was reported to attenuate the stress response to surgery and enable
patient recovery. The objective of the meta-analysis presented in chapter 3, was to
study the differences in outcomes in patients undergoing major elective open
colorectal surgery within an ERAS pathway and those treated with conventional
perioperative care. The randomized controlled trials comparing ERAS with
conventional perioperative care were selected and assessed for methodology quality
using standard methods recommended by the Cochrane Collaboration. The outcome
measures studied were length of hospital stay, complication rates, readmission rates
and mortality. Six randomized controlled trials with 452 patients that satisfied the
eligibility criteria were included for the meta-analysis. The number of individual ERAS

209
interventions used in the studies ranged from 4-12, with a mean of 9. The length of
hospital stay [weighted mean difference (95% confidence interval): -2.55 (-3.24, -1.85)]
was significantly reduced by 2.5 days and complication rates were reduced by 47%
[relative risk (95% confidence interval): 0.53 (0.44, 0.64)] were significantly reduced in
the enhanced recovery group. There was no statistically significant difference in
readmission and mortality rates. Implementing ERAS protocols in patients having
major elective colorectal surgery resulted in reduced length of hospital stay and
complication rates after major elective open colorectal surgery without compromising
patient safety. The common perioperative interventions used in the studies were
preoperative carbohydrates, avoidance of bowel preparation, epidural analgesia, early
postoperative mobilisation, early postoperative feeding and avoidance of opiate
analgesia. The beneficial effects of these interventions were well reported previously
and might have contributed to the reduced risk of complications postoperatively.
Differences in implementation of interventions and reduced compliance contributed
to the heterogeneity of the results in individual studies. For example, not all patients
used epidural analgesia in some studies (Anderson et al., 2003, Serclova, 2009).
However, the beneficial effects of reduced complications and length of stay in this
group of patients was probably, a result of the cumulative effect of interventions such
as preoperative feeding and early enteral nutrition which might have resulted in
patients having surgery in a metabolically fed state and consequent attenuation of the
stress response.
This view was confirmed in the meta-analysis of RCTs on preoperative oral
carbohydrate treatment in elective surgery (chapter 4). This study included twenty-

210
one RCTs, consisting of 1685 patients (733 in CHO group and 952 in control group).
The studies were categorised according to the type of surgery as those having major
abdominal surgery, studies in which operative procedures with expected length of stay
less than or equal to 2 days, and those having orthopaedic surgery and a subgroup
analysis was performed. The outcome measures were length of stay, development of
POIR, complications, nausea and vomiting. No overall difference in length of stay was
noted for analysis of all studies or subgroups of patients undergoing surgery with an
expected hospital stay ≤2 days or orthopaedic procedures. However, patients
undergoing major abdominal surgery following CHO had reduced length of stay [mean
difference, 95% confidence interval: -1.08 (-1.87 to -0.29); I2=60%, p=0.007]. CHO
reduced postoperative insulin resistance with no effects on in-hospital complications
over control (risk ratio, 95% confidence interval, 0.88 (0.50-1.53), I2=41%; p=0.640).
There was significant heterogeneity amongst studies and therefore quality of evidence
was low to moderate. Three studies included utilised the hyperinsulinaemic-
euglycaemic clamp technique to measure relative changes in insulin sensitivity and
demonstrated significant reduction in development of POIR in CHO group compared
with control (Soop et al., 2001, Soop et al., 2004a, Nygren et al., 1998a). Others used
the HOMA-IR method and showed a reduction in postoperative HOMA-IR values
between CHO and control.(Mathur et al., 2010, Dock-Nascimento et al., 2012, Perrone
et al., 2011). However, the quality of evidence for these outcomes ranged from low to
moderate.
In general, the results from both the studies on ERAS protocols and preoperative CHO
in surgical patients showed beneficial postoperative outcomes. The quality of studies

211
reflected the variations in clinical practices in different centres and differences in
implementation of strict quality control measures when conducting randomised
studies involving surgical patients. However, they show in common that surgical stress
can be attenuated by simple preoperative interventions and that reduction of POIR in
surgical patients leads to better postoperative clinical outcomes. Hence, it seemed
important to understand the molecular mechanisms underlying the beneficial effects
of these interventions to validate and optimise perioperative care in patients having
surgery. Therefore, prospective studies were undertaken in patients having major
abdominal surgery to investigate the mechanistic basis of metabolic response to
surgery and the mechanisms underlying the development of POIR in surgical patients
(Chapters 5 and 6).
The study in patients undergoing major abdominal surgery, described in chapter 5,
suggested that surgical stress induced inflammatory response, was associated with
inhibition of Pyruvate Dehydrogenase Complex (PDC) controlled carbohydrate
oxidation through the Akt/FOXO mediated upregulation of PDK4 and may be an
important mechanism in the development of POIR. PDC activity determines the
pyruvate flux in to the mitochondria for ATP production and thus, controls the rate-
limiting step in carbohydrate oxidation, the oxidative decarboxylation of pyruvate to
acetyl-CoA to be used in the tri-carboxylic acid (TCA) cycle. The mRNA expression data
showed significant up-regulation of genes, FOXO1 and PDK4 mRNA up-regulation
postoperatively. This was also associated with a significant fold-change (p<0.05), in
protein expression for FOXO1 (11.21±4.08), PFOXO1 (7.82±3.28) and PDK4
(4.49±1.85). An increased expression of FOXO mRNA was likely to be responsible for

212
the up-regulation of the ubiquitin ligase, MAFbx (11.5-fold in rectus, 6.5–fold in
vastus), which is involved in atrophy signalling.
Akt is an important mediator of the protein synthesis pathway via GSKβ inhibition and
regulation of 43S pre-initiation complex and by mTOR activation. However, in the
present study (chapter 5), Akt was not significantly upregulated. The FOXO family of
transcription factors are phosphorylated by Akt, which renders them inactive.
However, the study showed that surgical stress induced significant up-regulation of
mRNA expressions of FOXO, which is a transcriptional activator of its downstream
target, MAFbx, the ubiquitin ligase, involved in the ubiquitin-proteosome mediated
protein degradation pathways. Since FOXO transcription factors are known to regulate
PDK4 by transcriptional activation, it is probable that a common signalling pathway
involving Akt/FOXO and PDK4, may be involved in the impairment of carbohydrate
oxidation and muscle protein breakdown, in patients undergoing major abdominal
surgery.
The principal trigger which induces the aforementioned changes in Akt/FOXO
signalling, could be the surgical stress induced inflammatory response, mediated by
cytokines which is reported to affect IRS-1 binding (Rui et al., 2001) and inhibit Akt1
signalling (Medina et al., 2005, Latres et al., 2005), and in turn leads to decreased
phosphorylation of FOXO family of transcription factors and up-regulation of FOXO
gene targets such as MAFbx and PDK4 (Sandri et al., 2004, Crossland et al., 2008). In
keeping with this, after the initiation of inflammatory response following surgery, both
the cytokines IL-6 and TNF-α mRNA were found to be up-regulated (p<0.05). Plasma
concentrations of IL-6 and TNF-α were also found to be significantly increased

213
postoperatively. Moreover, another important finding of this study, which might have
contributed to the inflammatory response, is the significant increase in gut
permeability following surgery (% urinary excretion of 51Cr-EDTA): Pre surgery: 4.79 ±
0.82; Post-surgery: 7.30 ± 1.03; p<0.02. Increased gut permeability may enable
bacterial translocation, which may exaggerate the inflammatory process, especially in
patients having major abdominal surgery. Evidence shows that disruption of intestinal
tight junctions or increased para-cellular permeability due to an intestinal disease,
injury or an inflammatory mediated insult, may allow entry of luminal antigens,
thereby triggering an exaggerated immune response (Clayburgh et al., 2004,
Hollander, 1999). The translocated bacteria or their products in the portal or systemic
circulation may induce a cytokine response via activation of macrophages in either the
liver or mesenteric lymph nodes and may influence the ongoing metabolic processes
(Deitch et al., 1994, Meakins, 1990). However, the presence of bacteremia was not
tested in the study and therefore, whether surgical stress resulted in bacterial
translocation could not be ascertained, despite the study confirming increased gut
permeability following surgery. In summary, the studies have demonstrated that PDK4
plays a significant role in causing POIR (Chapter 5). Thus it can be inferred that
impaired PI3K/Akt1/FOXO signalling and the resultant up-regulation of PDK4 leads to
the inhibition of PDC activity and impaired carbohydrate oxidation that may contribute
to POIR in patients having major abdominal surgery.
From the meta-analysis of RCTs comparing CHO with placebo drinks or control
(Chapter 4), we showed that preoperative carbohydrate drinks in patients undergoing
major surgery was associated with improved postoperative outcomes of length of stay

214
and reduction in POIR. Therefore, a logical approach would be to study the effect of
CHO on the aforementioned changes in metabolic signalling pathways and POIR. It was
hypothesised that CHO and the drug, DCA which is known to increase PDC activity by
inhibiting PDK4, will attenuate the impairment of carbohydrate oxidation secondary to
surgical stress. The aim of the study described in Chapter 6, was to establish whether
preoperative oral carbohydrate treatment (CHO) combined with an intravenous
infusion of dichloroacetate (DCA), will maintain the substrate-specific, postoperative
MAPR and attenuate the surgical stress response and whether by increasing
preoperative PDC activity and flux using DCA infusion will improve POIR over and
above that seen with CHO ingestion alone. The results showed that administration of
either CHO or CHO with DCA, attenuates the impairment of CHO oxidation and the
increased expression of mRNA of important molecular targets responsible for POIR,
such as FOXO and PDK4, was not evident following either CHO or DCA treatment
preoperatively. The results showed no significant differences in mRNA expression
between preoperative and postoperative levels for both CHO and DCA. However, a
major limitation of this study is that comparisons with a control group with no CHO or
DCA could not be performed due to issues with recruitment and analysis. Therefore,
the results were presented for the CHO and DCA group only, limiting the validity of any
conclusions about effects of CHO alone on the metabolic responses.
The study also showed plasma concentrations of glucose were found to be lower in
DCA group 48 hours post-surgery. Interestingly the insulin requirements in the CHO
group were significantly higher to suppress the plasma glucose concentrations to that
of DCA group, 48 hours after surgery. However, this finding did not correlate with
215
increased cortisol as would be expected following surgical stress. The concentrations
of the counter-regulatory hormone were not different between the two groups, at
these time points. There was also a better maintenance of insulin sensitivity as noted
with the measurements of HOMA-IR in both CHO and DCA.
Both CHO and DCA group showed maintenance of muscle mitochondrial function,
when quantified by assaying ATP production during the utilization of a number of
different substrates for mitochondrial oxidation. Importantly, comparison between the
groups showed that DCA increased preoperative pyruvate mediated mitochondrial
ATP production rates above CHO alone, which was not evident 48 hours post-surgery.

216
7.3 Future work and limitations
The current thesis examined the mechanistic basis of metabolic response to surgery
and the development of postoperative insulin resistance in patients having major
abdominal surgery. The studies highlight that surgical stress contributes to POIR,
secondary to decreased carbohydrate oxidation and also resulted in impaired
mitochondrial function. The results from the observational study in patients having
major abdominal surgery (Chapter 5) have shown both, flux through PDC, and
mitochondrial ATP production were significantly reduced postoperatively. Although,
the results proved the hypothesis that surgical stress induced increase in PDK4 and
inhibition of PDC activity contributes to the development of POIR, certain important
mechanisms that link surgical stress with POIR remains to be ascertained.
Mitochondrial ATP production (MAPR) is a marker of mitochondrial function, whereby
mitochondria generates energy in the form of ATP, through oxidation of three
different energy sources namely carbohydrates, fats and proteins. In the setting of
surgical stress a decrease in PDC activity secondary to increased PDK4 may contribute
to reduced pyruvate flux into the tri-carboxylic acid cycle. However, the results
showed that MAPR was significantly depressed for all the substrates used for ATP
synthesis. This suggests an overall impairment in mitochondrial function, and not only
when pyruvate was used as a substrate. Therefore it is difficult to establish whether
increased PDK4 and decreased PDC contributed to the overall impairment in
mitochondrial function or whether other mechanisms may be involved, for example,
oxidative stress which contributes to mitochondrial dysfunction.

217
It was shown that pro-inflammatory cytokines in plasma as well as muscle (mRNA and
proteins) was increased following surgery. The origin of the cytokines that mediates
the inflammatory response in surgical patients is not clear. Biopsies were taken from
both the abdominal rectus and the vastus muscles in the thigh, which showed similar
response in mRNA expression of IL-6 and TNF-α, albeit to a lesser degree in the vastus.
The surgical trauma to the abdomen wall in itself could be a significant trigger in
initiating the inflammatory response and release of cytokines. In addition, bowel
handling during the surgical procedure could also result in translocation of gut bacteria
into the circulation. Nevertheless, it can be reasonably assumed that the surgical
trauma would result in a greater inflammatory response than increased gut
permeability and triggered the stress response.
Finally, a glucose tolerance test and HOMA-IR, were used as a surrogate marker of
POIR. Performing a hyperinsulinaemic-euglycaemic clamp study, to assess POIR in
surgical patients was considered to be difficult due to clinical constraints involved in
the postoperative period, for example, intensive care, pain, patient compliance etc.
However, since the commencement of this research work, other studies that followed
have shown that it is feasible in most patients. Therefore future work should use the
clamp technique as a gold-standard for confirming insulin resistance in clinical settings.
Future work could also focus on including patients who may be insulin-resistant,
preoperatively in whom there is an increased risk of postoperative morbidity (for
example, in diabetics) and study the effects of CHO and DCA on POIR in this group.
Providing there are significant benefits associated with DCA, future studies using CHO
and DCA can include specific subsets of patients in different clinical settings, including

218
sepsis, obesity and cancer. It would also be interesting to study the effects of DCA in
the emergency surgical setting, where provision of CHO would not be feasible and DCA
infusion can be administered preoperatively.

219
References
2011. Practice guidelines for preoperative fasting and the use of pharmacologic agents to
reduce the risk of pulmonary aspiration: application to healthy patients undergoing elective
procedures: an updated report by the American Society of Anesthesiologists Committee on
Standards and Practice Parameters. Anesthesiology, 114, 495-511.
AARIMAA, M., SLATIS, P., HAAPANIEMI, L. & JEGLINSKY, B. 1974. Glucose tolerance and insulin
response during and after elective skeletal surgery. Ann Surg, 179, 926-9.
ALLEN, D. L. & UNTERMAN, T. G. 2007. Regulation of myostatin expression and myoblast
differentiation by FoxO and SMAD transcription factors. Am J Physiol Cell Physiol, 292, C188-99.
ALLISON, S. P., HINTON, P. & CHAMBERLAIN, M. J. 1968. Intravenous glucose-tolerance, insulin,
and free-fatty-acid levels in burned patients. Lancet, 2, 1113-6.
ANDERSEN, J., HJORT-JAKOBSEN, D., CHRISTIANSEN, P. S. & KEHLET, H. 2007. Readmission rates
after a planned hospital stay of 2 versus 3 days in fast-track colonic surgery. Br J Surg, 94, 890-3.
ANDERSON, A. D., MCNAUGHT, C. E., MACFIE, J., TRING, I., BARKER, P. & MITCHELL, C. J. 2003.
Randomized clinical trial of multimodal optimization and standard perioperative surgical care. Br
J Surg, 90, 1497-504.
ANITHA, M., GONDHA, C., SUTLIFF, R., PARSADANIAN, A., MWANGI, S., SITARAMAN, S. V. &
SRINIVASAN, S. 2006. GDNF rescues hyperglycemia-induced diabetic enteric neuropathy
through activation of the PI3K/Akt pathway. J Clin Invest, 116, 344-56.
ARONSSON, A., AL-ANI, N. A., BRISMAR, K. & HEDSTROM, M. 2009. A carbohydrate-rich drink
shortly before surgery affected IGF-I bioavailability after a total hip replacement. A double-blind
placebo controlled study on 29 patients. Aging Clin Exp Res, 21, 97-101.
ARORA, N. S. & ROCHESTER, D. F. 1982. Respiratory muscle strength and maximal voluntary
ventilation in undernourished patients. Am Rev Respir Dis, 126, 5-8.
AWAD, S., BLACKSHAW, P. E., WRIGHT, J. W., MACDONALD, I. A., PERKINS, A. C. & LOBO, D. N.
2011a. A randomized crossover study of the effects of glutamine and lipid on the gastric
emptying time of a preoperative carbohydrate drink. Clin Nutr, 30, 165-71.
AWAD, S., CONSTANTIN-TEODOSIU, D., CONSTANTIN, D., ROWLANDS, B. J., FEARON, K. C.,
MACDONALD, I. A. & LOBO, D. N. 2010. Cellular mechanisms underlying the protective effects of
preoperative feeding: a randomized study investigating muscle and liver glycogen content,
mitochondrial function, gene and protein expression. Ann Surg, 252, 247-53.
AWAD, S., CONSTANTIN-TEODOSIU, D., MACDONALD, I. A. & LOBO, D. N. 2009b. Short-term
starvation and mitochondrial dysfunction - a possible mechanism leading to postoperative
insulin resistance. Clin Nutr, 28, 497-509.

220
AWAD, S., FEARON, K. C., MACDONALD, I. A. & LOBO, D. N. 2011b. A randomized cross-over
study of the metabolic and hormonal responses following two preoperative conditioning drinks.
Nutrition, 27, 938-42.
BACH, E., NIELSEN, R. R., VENDELBO, M. H., MOLLER, A. B., JESSEN, N., BUHL, M., T, K. H., HOLM,
L., PEDERSEN, S. B., PILEGAARD, H., BIENSO, R. S., JORGENSEN, J. O. & MOLLER, N. 1997. Direct
effects of TNF-alpha on local fuel metabolism and cytokine levels in the placebo-controlled,
bilaterally infused human leg: increased insulin sensitivity, increased net protein breakdown,
and increased IL-6 release. Diabetes, 62, 4023-9.
BAIGRIE, R. J., LAMONT, P. M., KWIATKOWSKI, D., DALLMAN, M. J. & MORRIS, P. J. 1992.
Systemic cytokine response after major surgery. Br J Surg, 79, 757-60.
BALDEWEG, S. E., GOLAY, A., NATALI, A., BALKAU, B., DEL PRATO, S. & COPPACK, S. W. 2000.
Insulin resistance, lipid and fatty acid concentrations in 867 healthy Europeans. European Group
for the Study of Insulin Resistance (EGIR). Eur J Clin Invest, 30, 45-52.
BARON, A. D., BRECHTEL, G., WALLACE, P. & EDELMAN, S. V. 1988. Rates and tissue sites of non-
insulin- and insulin-mediated glucose uptake in humans. Am J Physiol, 255, E769-74.
BARTON, R. N. 1985. Neuroendocrine mobilization of body fuels after injury. Br Med Bull, 41,
218-25.
BASSE, L., HJORT JAKOBSEN, D., BILLESBOLLE, P., WERNER, M. & KEHLET, H. 2000a. A clinical
pathway to accelerate recovery after colonic resection. Ann Surg, 232, 51-7.
BASSE, L., MADSEN, J. L. & KEHLET, H. 2001. Normal gastrointestinal transit after colonic
resection using epidural analgesia, enforced oral nutrition and laxative. Br J Surg, 88, 1498-500.
BASSE, L., WERNER, M. & KEHLET, H. 2000b. Is urinary drainage necessary during continuous
epidural analgesia after colonic resection? Reg Anesth Pain Med, 25, 498-501.
BASTIE, C. C., NAHLE, Z., MCLOUGHLIN, T., ESSER, K., ZHANG, W., UNTERMAN, T. & ABUMRAD,
N. A. 2005. FoxO1 stimulates fatty acid uptake and oxidation in muscle cells through CD36-
dependent and -independent mechanisms. J Biol Chem, 280, 14222-9.
BELFORT, R., MANDARINO, L., KASHYAP, S., WIRFEL, K., PRATIPANAWATR, T., BERRIA, R.,
DEFRONZO, R. A. & CUSI, K. 2005. Dose-response effect of elevated plasma free fatty acid on
insulin signaling. Diabetes, 54, 1640-8.
BESSEY, P. Q., WATTERS, J. M., AOKI, T. T. & WILMORE, D. W. 1984. Combined hormonal
infusion simulates the metabolic response to injury. Ann Surg, 200, 264-81.
BISGAARD, T. & KEHLET, H. 2002. Early oral feeding after elective abdominal surgery--what are
the issues? Nutrition, 18, 944-8.

221
BISGAARD, T., KRISTIANSEN, V. B., HJORTSO, N. C., JACOBSEN, L. S., ROSENBERG, J. & KEHLET, H.
2004. Randomized clinical trial comparing an oral carbohydrate beverage with placebo before
laparoscopic cholecystectomy. Br J Surg, 91, 151-8.
BLAZEBY, J. M., SOULSBY, M., WINSTONE, K., KING, P. M., BULLEY, S. & KENNEDY, R. H. 2009. A
qualitative evaluation of patients' experiences of an enhanced recovery programme for
colorectal cancer. Colorectal Dis.
BLOCK, B. M., LIU, S. S., ROWLINGSON, A. J., COWAN, A. R., COWAN, J. A., JR. & WU, C. L. 2003.
Efficacy of postoperative epidural analgesia: a meta-analysis. JAMA, 290, 2455-63.
BOCHICCHIO, G. V., SALZANO, L., JOSHI, M., BOCHICCHIO, K. & SCALEA, T. M. 2005. Admission
preoperative glucose is predictive of morbidity and mortality in trauma patients who require
immediate operative intervention. Am Surg, 71, 171-4.
BODINE, S. C., LATRES, E., BAUMHUETER, S., LAI, V. K., NUNEZ, L., CLARKE, B. A., POUEYMIROU,
W. T., PANARO, F. J., NA, E., DHARMARAJAN, K., PAN, Z. Q., VALENZUELA, D. M., DECHIARA, T.
M., STITT, T. N., YANCOPOULOS, G. D. & GLASS, D. J. 2001a. Identification of ubiquitin ligases
required for skeletal muscle atrophy. Science, 294, 1704-8.
BODINE, S. C., STITT, T. N., GONZALEZ, M., KLINE, W. O., STOVER, G. L., BAUERLEIN, R.,
ZLOTCHENKO, E., SCRIMGEOUR, A., LAWRENCE, J. C., GLASS, D. J. & YANCOPOULOS, G. D.
2001b. Akt/mTOR pathway is a crucial regulator of skeletal muscle hypertrophy and can prevent
muscle atrophy in vivo. Nat Cell Biol, 3, 1014-9.
BOKEY, E. L., CHAPUIS, P. H., FUNG, C., HUGHES, W. J., KOOREY, S. G., BREWER, D. & NEWLAND,
R. C. 1995. Postoperative morbidity and mortality following resection of the colon and rectum
for cancer. Dis Colon Rectum, 38, 480-6; discussion 486-7.
BONE, R. C., SPRUNG, C. L. & SIBBALD, W. J. 1992. Definitions for sepsis and organ failure. Crit
Care Med, 20, 724-6.
BOWKER-KINLEY, M. M., DAVIS, W. I., WU, P., HARRIS, R. A. & POPOV, K. M. 1998. Evidence for
existence of tissue-specific regulation of the mammalian pyruvate dehydrogenase complex.
Biochem J, 329 ( Pt 1), 191-6.
BRADY, M., KINN, S. & STUART, P. 2003. Preoperative fasting for adults to prevent perioperative
complications. Cochrane Database Syst Rev, CD004423.
BRANDI, L. S., FREDIANI, M., OLEGGINI, M., MOSCA, F., CERRI, M., BONI, C., PECORI, N.,
BUZZIGOLI, G. & FERRANNINI, E. 1990. Insulin resistance after surgery: normalization by insulin
treatment. Clin Sci (Lond), 79, 443-50.
BRANDI, L. S., SANTORO, D., NATALI, A., ALTOMONTE, F., BALDI, S., FRASCERRA, S. &
FERRANNINI, E. 1993. Insulin resistance of stress: sites and mechanisms. Clin Sci (Lond), 85, 525-
35.
222
BRANDT, M. R., FERNADES, A., MORDHORST, R. & KEHLET, H. 1978. Epidural analgesia improves
postoperative nitrogen balance. Br Med J, 1, 1106-8.
BREUER, J. P., VON DOSSOW, V., VON HEYMANN, C., GRIESBACH, M., VON SCHICKFUS, M.,
MACKH, E., HACKER, C., ELGETI, U., KONERTZ, W., WERNECKE, K. D. & SPIES, C. D. 2006.
Preoperative oral carbohydrate administration to ASA III-IV patients undergoing elective cardiac
surgery. Anesth Analg, 103, 1099-108.
BULKLEY, G. B. 1993. Free radicals and other reactive oxygen metabolites: clinical relevance and
the therapeutic efficacy of antioxidant therapy. Surgery, 113, 479-83.
CAN, M. F., YAGCI, G., DAG, B., OZTURK, E., GORGULU, S., SIMSEK, A. & TUFAN, T. 2009.
Preoperative administration of oral carbohydrate-rich solutions: Comparison of glucometabolic
responses and tolerability between patients with and without insulin resistance. Nutrition, 25,
72-7.
CARLISLE, J. B. & STEVENSON, C. A. 2006. Drugs for preventing postoperative nausea and
vomiting. Cochrane Database Syst Rev, 3, CD004125.
CARLSON, C. J., BOOTH, F. W. & GORDON, S. E. 1999. Skeletal muscle myostatin mRNA
expression is fiber-type specific and increases during hindlimb unloading. Am J Physiol, 277,
R601-6.
CARRARO, F., KLEIN, S., ROSENBLATT, J. I. & WOLFE, R. R. 1989. Effect of dichloroacetate on
lactate concentration in exercising humans. J Appl Physiol (1985), 66, 591-7.
CASTRILLON, D. H., MIAO, L., KOLLIPARA, R., HORNER, J. W. & DEPINHO, R. A. 2003. Suppression
of ovarian follicle activation in mice by the transcription factor Foxo3a. Science, 301, 215-8.
CERRA, F. B. 1987. Hypermetabolism, organ failure, and metabolic support. Surgery, 101, 1-14.
CHIASSON, J. L., SHIKAMA, H., CHU, D. T. & EXTON, J. H. 1981. Inhibitory effect of epinephrine
on insulin-stimulated glucose uptake by rat skeletal muscle. J Clin Invest, 68, 706-13.
CHIN, K. F., KALLAM, R., O'BOYLE, C. & MACFIE, J. 2007. Bacterial translocation may influence
the long-term survival in colorectal cancer patients. Dis Colon Rectum, 50, 323-30.
CHONG, Z. Z., KANG, J. Q. & MAIESE, K. 2003. Erythropoietin fosters both intrinsic and extrinsic
neuronal protection through modulation of microglia, Akt1, Bad, and caspase-mediated
pathways. Br J Pharmacol, 138, 1107-18.
CHONG, Z. Z., LI, F. & MAIESE, K. 2005. Oxidative stress in the brain: novel cellular targets that
govern survival during neurodegenerative disease. Prog Neurobiol, 75, 207-46.
CHOO, H. J., KIM, J. H., KWON, O. B., LEE, C. S., MUN, J. Y., HAN, S. S., YOON, Y. S., YOON, G.,
CHOI, K. M. & KO, Y. G. 2006. Mitochondria are impaired in the adipocytes of type 2 diabetic
mice. Diabetologia, 49, 784-91.

223
CHOW, L., FROM, A. & SEAQUIST, E. 2010. Skeletal muscle insulin resistance: the interplay of
local lipid excess and mitochondrial dysfunction. Metabolism, 59, 70-85.
CHRISTENSEN, T., BENDIX, T. & KEHLET, H. 1982. Fatigue and cardiorespiratory function
following abdominal surgery. Br J Surg, 69, 417-9.
CLAYBURGH, D. R., SHEN, L. & TURNER, J. R. 2004. A porous defense: the leaky epithelial barrier
in intestinal disease. Lab Invest, 84, 282-91.
CLEMENT, S., BRAITHWAITE, S. S., MAGEE, M. F., AHMANN, A., SMITH, E. P., SCHAFER, R. G. &
HIRSCH, I. B. 2004. Management of diabetes and hyperglycemia in hospitals. Diabetes Care, 27,
553-91.
COLEMAN, M. E., DEMAYO, F., YIN, K. C., LEE, H. M., GESKE, R., MONTGOMERY, C. & SCHWARTZ,
R. J. 1995. Myogenic vector expression of insulin-like growth factor I stimulates muscle cell
differentiation and myofiber hypertrophy in transgenic mice. J Biol Chem, 270, 12109-16.
CONSTANTIN-TEODOSIU, D., CEDERBLAD, G. & HULTMAN, E. 1991. A sensitive radioisotopic
assay of pyruvate dehydrogenase complex in human muscle tissue. Anal Biochem, 198, 347-51.
CONSTANTIN-TEODOSIU, D., CONSTANTIN, D., STEPHENS, F., LAITHWAITE, D. & GREENHAFF, P.
L. 2012. The role of FOXO and PPAR transcription factors in diet-mediated inhibition of PDC
activation and carbohydrate oxidation during exercise in humans and the role of
pharmacological activation of PDC in overriding these changes. Diabetes, 61, 1017-24.
CONSTANTIN-TEODOSIU, D., SIMPSON, E. J. & GREENHAFF, P. L. 1999. The importance of
pyruvate availability to PDC activation and anaplerosis in human skeletal muscle. Am J Physiol,
276, E472-8.
CONSTANTIN, D., MCCULLOUGH, J., MAHAJAN, R. P. & GREENHAFF, P. L. 2011. Novel events in
the molecular regulation of muscle mass in critically ill patients. J Physiol, 589, 3883-95.
COSTANTINI, T. W., LOOMIS, W. H., PUTNAM, J. G., DRUSINSKY, D., DEREE, J., CHOI, S., WOLF, P.,
BAIRD, A., ELICEIRI, B., BANSAL, V. & COIMBRA, R. 2009. Burn-induced gut barrier injury is
attenuated by phosphodiesterase inhibition: effects on tight junction structural proteins. Shock,
31, 416-22.
CROSSLAND, H., CONSTANTIN-TEODOSIU, D., GARDINER, S. M., CONSTANTIN, D. & GREENHAFF,
P. L. 2008. A potential role for Akt/FOXO signalling in both protein loss and the impairment of
muscle carbohydrate oxidation during sepsis in rodent skeletal muscle. J Physiol, 586, 5589-600.
CROSSLAND, H., CONSTANTIN-TEODOSIU, D., GREENHAFF, P. L. & GARDINER, S. M. 2010. Low-
dose dexamethasone prevents endotoxaemia-induced muscle protein loss and impairment of
carbohydrate oxidation in rat skeletal muscle. J Physiol, 588, 1333-47.
CROWE, P. J., DENNISON, A. & ROYLE, G. T. 1984. The effect of pre-operative glucose loading on
postoperative nitrogen metabolism. Br J Surg, 71, 635-7.

224
CUTHBERTSON, D. 1932. Observations on disturbance of metabolism produced by injury of the
limbs. Q J Med, 25, 233-6.
CUTHBERTSON, D. P. 1929. The influence of prolonged muscular rest on metabolism. Biochem J,
23, 1328-45.
CUTHBERTSON, D. P. 1930. The disturbance of metabolism produced by bony and non-bony
injury, with notes on certain abnormal conditions of bone. Biochem J, 24, 1244-63.
DE LANGE, P., MORENO, M., SILVESTRI, E., LOMBARDI, A., GOGLIA, F. & LANNI, A. 2007. Fuel
economy in food-deprived skeletal muscle: signaling pathways and regulatory mechanisms.
FASEB J, 21, 3431-41.
DEFRONZO, R. A., JACOT, E., JEQUIER, E., MAEDER, E., WAHREN, J. & FELBER, J. P. 1981. The
effect of insulin on the disposal of intravenous glucose. Results from indirect calorimetry and
hepatic and femoral venous catheterization. Diabetes, 30, 1000-7.
DEITCH, E. A., XU, D., FRANKO, L., AYALA, A. & CHAUDRY, I. H. 1994. Evidence favoring the role
of the gut as a cytokine-generating organ in rats subjected to hemorrhagic shock. Shock, 1, 141-
5.
DELANEY, C. P., ZUTSHI, M., SENAGORE, A. J., REMZI, F. H., HAMMEL, J. & FAZIO, V. W. 2003.
Prospective, randomized, controlled trial between a pathway of controlled rehabilitation with
early ambulation and diet and traditional postoperative care after laparotomy and intestinal
resection. Dis Colon Rectum, 46, 851-9.
DEVARAJ, S., ROSENSON, R. S. & JIALAL, I. 2004. Metabolic syndrome: an appraisal of the pro-
inflammatory and procoagulant status. Endocrinol Metab Clin North Am, 33, 431-53, table of
contents.
DIMITRIADIS, G., LEIGHTON, B., PARRY-BILLINGS, M., SASSON, S., YOUNG, M., KRAUSE, U.,
BEVAN, S., PIVA, T., WEGENER, G. & NEWSHOLME, E. A. 1997. Effects of glucocorticoid excess
on the sensitivity of glucose transport and metabolism to insulin in rat skeletal muscle. Biochem
J, 321 ( Pt 3), 707-12.
DISBROW, E. A., BENNETT, H. L. & OWINGS, J. T. 1993. Effect of preoperative suggestion on
postoperative gastrointestinal motility. West J Med, 158, 488-92.
DOBBINS, R. L., CHESTER, M. W., DANIELS, M. B., MCGARRY, J. D. & STEIN, D. T. 1998. Circulating
fatty acids are essential for efficient glucose-stimulated insulin secretion after prolonged fasting
in humans. Diabetes, 47, 1613-8.
DOCK-NASCIMENTO, D. B., DE AGUILAR-NASCIMENTO, J. E., MAGALHAES FARIA, M. S.,
CAPOROSSI, C., SLHESSARENKO, N. & WAITZBERG, D. L. 2012. Evaluation of the effects of a
preoperative 2-hour fast with maltodextrine and glutamine on insulin resistance, acute-phase
response, nitrogen balance, and serum glutathione after laparoscopic cholecystectomy: a
controlled randomized trial. JPEN J Parenter Enteral Nutr, 36, 43-52.

225
EGBERT, L. D., BATTIT, G. E., WELCH, C. E. & BARTLETT, M. K. 1964. Reduction of Postoperative
Pain by Encouragement and Instruction of Patients. A Study of Doctor-Patient Rapport. N Engl J
Med, 270, 825-7.
EGDAHL, R. H. 1959. Pituitary-adrenal response following trauma to the isolated leg. Surgery,
46, 9-21.
ESKICIOGLU, C., FORBES, S. S., AARTS, M. A., OKRAINEC, A. & MCLEOD, R. S. 2009a. Enhanced
Recovery after Surgery (ERAS) Programs for Patients Having Colorectal Surgery: A Meta-analysis
of Randomized Trials. J Gastrointest Surg.
ESKICIOGLU, C., FORBES, S. S., AARTS, M. A., OKRAINEC, A. & MCLEOD, R. S. 2009b. Enhanced
recovery after surgery (ERAS) programs for patients having colorectal surgery: a meta-analysis
of randomized trials. J Gastrointest Surg, 13, 2321-9.
FARIA, M. S., DE AGUILAR-NASCIMENTO, J. E., PIMENTA, O. S., ALVARENGA, L. C., JR., DOCK-
NASCIMENTO, D. B. & SLHESSARENKO, N. 2009. Preoperative fasting of 2 hours minimizes
insulin resistance and organic response to trauma after video-cholecystectomy: a randomized,
controlled, clinical trial. World J Surg, 33, 1158-64.
FEARON, K. C., LJUNGQVIST, O., VON MEYENFELDT, M., REVHAUG, A., DEJONG, C. H., LASSEN,
K., NYGREN, J., HAUSEL, J., SOOP, M., ANDERSEN, J. & KEHLET, H. 2005. Enhanced recovery after
surgery: a consensus review of clinical care for patients undergoing colonic resection. Clin Nutr,
24, 466-77.
FINFER, S., CHITTOCK, D. R., SU, S. Y., BLAIR, D., FOSTER, D., DHINGRA, V., BELLOMO, R., COOK,
D., DODEK, P., HENDERSON, W. R., HEBERT, P. C., HERITIER, S., HEYLAND, D. K., MCARTHUR, C.,
MCDONALD, E., MITCHELL, I., MYBURGH, J. A., NORTON, R., POTTER, J., ROBINSON, B. G. &
RONCO, J. J. 2009. Intensive versus conventional glucose control in critically ill patients. N Engl J
Med, 360, 1283-97.
FLORES, E. A., BISTRIAN, B. R., POMPOSELLI, J. J., DINARELLO, C. A., BLACKBURN, G. L. & ISTFAN,
N. W. 1989. Infusion of tumor necrosis factor/cachectin promotes muscle catabolism in the rat.
A synergistic effect with interleukin 1. J Clin Invest, 83, 1614-22.
FRANK, S. M., FLEISHER, L. A., BRESLOW, M. J., HIGGINS, M. S., OLSON, K. F., KELLY, S. &
BEATTIE, C. 1997. Perioperative maintenance of normothermia reduces the incidence of morbid
cardiac events. A randomized clinical trial. JAMA, 277, 1127-34.
FRAYN, K. N. 1985. Substrate turnover after injury. Br Med Bull, 41, 232-9.
FRAYN, K. N. 1986. Hormonal control of metabolism in trauma and sepsis. Clin Endocrinol (Oxf),
24, 577-99.
FRAYN, K. N., LITTLE, R. A., MAYCOCK, P. F. & STONER, H. B. 1985. The relationship of plasma
catecholamines to acute metabolic and hormonal responses to injury in man. Circ Shock, 16,
229-40.

226
FURUYAMA, T., KITAYAMA, K., YAMASHITA, H. & MORI, N. 2003. Forkhead transcription factor
FOXO1 (FKHR)-dependent induction of PDK4 gene expression in skeletal muscle during energy
deprivation. Biochem J, 375, 365-71.
FURUYAMA, T., NAKAZAWA, T., NAKANO, I. & MORI, N. 2000. Identification of the differential
distribution patterns of mRNAs and consensus binding sequences for mouse DAF-16
homologues. Biochem J, 349, 629-34.
FURUYAMA, T., YAMASHITA, H., KITAYAMA, K., HIGAMI, Y., SHIMOKAWA, I. & MORI, N. 2002.
Effects of aging and caloric restriction on the gene expression of Foxo1, 3, and 4 (FKHR, FKHRL1,
and AFX) in the rat skeletal muscles. Microsc Res Tech, 59, 331-4.
GALLEN, I. W. & MACDONALD, I. A. 1990. Effect of two methods of hand heating on body
temperature, forearm blood flow, and deep venous oxygen saturation. Am J Physiol, 259, E639-
43.
GATT, M., ANDERSON, A. D., REDDY, B. S., HAYWARD-SAMPSON, P., TRING, I. C. & MACFIE, J.
2005. Randomized clinical trial of multimodal optimization of surgical care in patients
undergoing major colonic resection. Br J Surg, 92, 1354-62.
GINER, M., LAVIANO, A., MEGUID, M. M. & GLEASON, J. R. 1996. In 1995 a correlation between
malnutrition and poor outcome in critically ill patients still exists. Nutrition, 12, 23-9.
GOLDBERG, I. J. 1996. Lipoprotein lipase and lipolysis: central roles in lipoprotein metabolism
and atherogenesis. J Lipid Res, 37, 693-707.
GONZALEZ-CADAVID, N. F., TAYLOR, W. E., YARASHESKI, K., SINHA-HIKIM, I., MA, K., EZZAT, S.,
SHEN, R., LALANI, R., ASA, S., MAMITA, M., NAIR, G., ARVER, S. & BHASIN, S. 1998. Organization
of the human myostatin gene and expression in healthy men and HIV-infected men with muscle
wasting. Proc Natl Acad Sci U S A, 95, 14938-43.
GOODALL, M., STONE, C. & HAYNES, B. W., JR. 1957. Urinary output of adrenaline and
noradrenaline in severe thermal burns. Ann Surg, 145, 479-87.
GORE, D. C., CHINKES, D., HEGGERS, J., HERNDON, D. N., WOLF, S. E. & DESAI, M. 2001.
Association of hyperglycemia with increased mortality after severe burn injury. J Trauma, 51,
540-4.
GOUVAS, N., TAN, E., WINDSOR, A., XYNOS, E. & TEKKIS, P. P. 2009b. Fast-track vs standard care
in colorectal surgery: a meta-analysis update. Int J Colorectal Dis, 24, 1119-31.
GREIWE, J. S., HOLLOSZY, J. O. & SEMENKOVICH, C. F. 2000. Exercise induces lipoprotein lipase
and GLUT-4 protein in muscle independent of adrenergic-receptor signaling. J Appl Physiol, 89,
176-81.
GUENAGA, K. 2005. Mechanical bowel preparation for elective colorectal surgery. Cochrane
Database Syst Rev.

227
GUENAGA, K. K., MATOS, D. & WILLE-JORGENSEN, P. 2009. Mechanical bowel preparation for
elective colorectal surgery. Cochrane Database Syst Rev, CD001544.
GUO, S., RENA, G., CICHY, S., HE, X., COHEN, P. & UNTERMAN, T. 1999. Phosphorylation of
serine 256 by protein kinase B disrupts transactivation by FKHR and mediates effects of insulin
on insulin-like growth factor-binding protein-1 promoter activity through a conserved insulin
response sequence. J Biol Chem, 274, 17184-92.
GUSTAFSSON, U. O., HAUSEL, J., THORELL, A., LJUNGQVIST, O., SOOP, M., NYGREN, J. &
ENHANCED RECOVERY AFTER SURGERY STUDY, G. 2011. Adherence to the enhanced recovery
after surgery protocol and outcomes after colorectal cancer surgery. Arch Surg, 146, 571-7.
GUSTAFSSON, U. O., NYGREN, J., THORELL, A., SOOP, M., HELLSTROM, P. M., LJUNGQVIST, O. &
HAGSTROM-TOFT, E. 2008. Pre-operative carbohydrate loading may be used in type 2 diabetes
patients. Acta Anaesthesiol Scand, 52, 946-51.
HALTER, J. B., BEARD, J. C. & PORTE, D., JR. 1984. Islet function and stress hyperglycemia:
plasma glucose and epinephrine interaction. Am J Physiol, 247, E47-52.
HARRIS, R. A., HUANG, B. & WU, P. 2001. Control of pyruvate dehydrogenase kinase gene
expression. Adv Enzyme Regul, 41, 269-88.
HARRIS, R. C., HULTMAN, E. & NORDESJO, L. O. 1974. Glycogen, glycolytic intermediates and
high-energy phosphates determined in biopsy samples of musculus quadriceps femoris of man
at rest. Methods and variance of values. Scand J Clin Lab Invest, 33, 109-20.
HAUSEL, J., NYGREN, J., LAGERKRANSER, M., HELLSTROM, P. M., HAMMARQVIST, F.,
ALMSTROM, C., LINDH, A., THORELL, A. & LJUNGQVIST, O. 2001. A carbohydrate-rich drink
reduces preoperative discomfort in elective surgery patients. Anesth Analg, 93, 1344-50.
HAUSEL, J., NYGREN, J., THORELL, A., LAGERKRANSER, M. & LJUNGQVIST, O. 2005. Randomized
clinical trial of the effects of oral preoperative carbohydrates on postoperative nausea and
vomiting after laparoscopic cholecystectomy. Br J Surg, 92, 415-21.
HEBERT, J. C., O'REILLY, M. & BEDNAR, M. M. 1995. Modifying the host response to injury. The
future of trauma care. Surg Clin North Am, 75, 335-49.
HENDRY, P. O., BALFOUR, A., POTTER, M. A., MANDER, B. J., BARTOLO, D. C., ANDERSON, D. N.
& FEARON, K. C. 2008. Preoperative conditioning with oral carbohydrate loading and oral
nutritional supplements can be combined with mechanical bowel preparation prior to elective
colorectal resection. Colorectal Dis, 10, 907-10.
HENRIKSEN, M. G., HESSOV, I., DELA, F., HANSEN, H. V., HARALDSTED, V. & RODT, S. A. 2003.
Effects of preoperative oral carbohydrates and peptides on postoperative endocrine response,
mobilization, nutrition and muscle function in abdominal surgery. Acta Anaesthesiol Scand, 47,
191-9.

228
HIGGINS, J. P. T. & GREEN, S. 2008. Cochrane Handbook for Systematic Reviews of Interventions
The Cochrane Collaboration, Version 5.0.1.
HIGUCHI, R., FOCKLER, C., DOLLINGER, G. & WATSON, R. 1993. Kinetic PCR analysis: real-time
monitoring of DNA amplification reactions. Biotechnology (N Y), 11, 1026-30.
HILL, A. G. & HILL, G. L. 1998. Metabolic response to severe injury. Br J Surg, 85, 884-90.
HILL, G. L. 1988. Body composition research at the University of Auckland--some implications for
modern surgical practice. Aust N Z J Surg, 58, 13-21.
HOEKMAN, M. F., JACOBS, F. M., SMIDT, M. P. & BURBACH, J. P. 2006. Spatial and temporal
expression of FoxO transcription factors in the developing and adult murine brain. Gene Expr
Patterns, 6, 134-40.
HOLLANDER, D. 1999. Intestinal permeability, leaky gut, and intestinal disorders. Curr
Gastroenterol Rep, 1, 410-6.
HOLNESS, M. J., BULMER, K., SMITH, N. D. & SUGDEN, M. C. 2003. Investigation of potential
mechanisms regulating protein expression of hepatic pyruvate dehydrogenase kinase isoforms 2
and 4 by fatty acids and thyroid hormone. Biochem J, 369, 687-95.
HOLNESS, M. J. & SUGDEN, M. C. 1999. The impact of increased dietary lipid on the regulation of
glucose uptake and oxidation by insulin in brown- and a range of white-adipose-tissue depots in
vivo. Int J Obes Relat Metab Disord, 23, 629-38.
HOLTE, K., NIELSEN, K. G., MADSEN, J. L. & KEHLET, H. 2004. Physiologic effects of bowel
preparation. Dis Colon Rectum, 47, 1397-402.
HORNBERGER, T. A., HUNTER, R. B., KANDARIAN, S. C. & ESSER, K. A. 2001. Regulation of
translation factors during hindlimb unloading and denervation of skeletal muscle in rats. Am J
Physiol Cell Physiol, 281, C179-87.
HUANG, H., REGAN, K. M., WANG, F., WANG, D., SMITH, D. I., VAN DEURSEN, J. M. & TINDALL,
D. J. 2005. Skp2 inhibits FOXO1 in tumor suppression through ubiquitin-mediated degradation.
Proc Natl Acad Sci U S A, 102, 1649-54.
HUME, D. M. 1953. The neuro-endocrine response to injury: present status of the problem. Ann
Surg, 138, 548-57.
IAPICHINO, G., SOLCA, M., RADRIZZANI, D., ZUCCHETTI, M. & DAMIA, G. 1981. Net protein
utilization during total parenteral nutrition of injured critically ill patients: an original approach.
JPEN J Parenter Enteral Nutr, 5, 317-21.
JACKSON, R. S., AMDUR, R. L., WHITE, J. C. & MACSATA, R. A. 2012. Hyperglycemia is associated
with increased risk of morbidity and mortality after colectomy for cancer. J Am Coll Surg, 214,
68-80.

229
JADAD, A. R., MOORE, R. A., CARROLL, D., JENKINSON, C., REYNOLDS, D. J., GAVAGHAN, D. J. &
MCQUAY, H. J. 1996. Assessing the quality of reports of randomized clinical trials: is blinding
necessary? Control Clin Trials, 17, 1-12.
JAHOOR, F., HERNDON, D. N. & WOLFE, R. R. 1986. Role of insulin and glucagon in the response
of glucose and alanine kinetics in burn-injured patients. J Clin Invest, 78, 807-14.
JARVELA, K., MAARANEN, P. & SISTO, T. 2008. Pre-operative oral carbohydrate treatment before
coronary artery bypass surgery. Acta Anaesthesiol Scand, 52, 793-7.
JESCHKE, M. G., KLEIN, D. & HERNDON, D. N. 2004. Insulin treatment improves the systemic
inflammatory reaction to severe trauma. Ann Surg, 239, 553-60.
JESUS, E. C., KARLICZEK, A., MATOS, D., CASTRO, A. A. & ATALLAH, A. N. 2004. Prophylactic
anastomotic drainage for colorectal surgery. Cochrane Database Syst Rev, CD002100.
JOHANNSEN, D. L. & RAVUSSIN, E. 2009. The role of mitochondria in health and disease. Curr
Opin Pharmacol, 9, 780-6.
JUNG, B., PAHLMAN, L., NYSTROM, P. O. & NILSSON, E. 2007. Multicentre randomized clinical
trial of mechanical bowel preparation in elective colonic resection. Br J Surg, 94, 689-95.
KAMEI, Y., MIZUKAMI, J., MIURA, S., SUZUKI, M., TAKAHASHI, N., KAWADA, T., TANIGUCHI, T. &
EZAKI, O. 2003. A forkhead transcription factor FKHR up-regulates lipoprotein lipase expression
in skeletal muscle. FEBS Lett, 536, 232-6.
KANG, J. Q., CHONG, Z. Z. & MAIESE, K. 2003a. Akt1 protects against inflammatory microglial
activation through maintenance of membrane asymmetry and modulation of cysteine protease
activity. J Neurosci Res, 74, 37-51.
KANG, J. Q., CHONG, Z. Z. & MAIESE, K. 2003b. Critical role for Akt1 in the modulation of
apoptotic phosphatidylserine exposure and microglial activation. Mol Pharmacol, 64, 557-69.
KARIV, Y., DELANEY, C. P., SENAGORE, A. J., MANILICH, E. A., HAMMEL, J. P., CHURCH, J. M.,
RAVAS, J. & FAZIO, V. W. 2007. Clinical outcomes and cost analysis of a "fast track"
postoperative care pathway for ileal pouch-anal anastomosis: a case control study. Dis Colon
Rectum, 50, 137-46.
KASKA, M., GROSMANOVA, T., HAVEL, E. & HYSPLER, R. 2006. [Preparation of patients for
operation with per-oral intake on the day of the planned surgery]. Rozhl Chir, 85, 554-9.
KASKA, M., GROSMANOVA, T., HAVEL, E., HYSPLER, R., PETROVA, Z., BRTKO, M., BARES, P.,
BARES, D., SCHUSTEROVA, B., PYSZKOVA, L., TOSNEROVA, V. & SLUKA, M. 2010. The impact and
safety of preoperative oral or intravenous carbohydrate administration versus fasting in
colorectal surgery--a randomized controlled trial. Wien Klin Wochenschr, 122, 23-30.
KEHLET, H. 1997. Multimodal approach to control postoperative pathophysiology and
rehabilitation. Br J Anaesth, 78, 606-17.

230
KEHLET, H. 2005. Fast-track colonic surgery: status and perspectives. Recent Results Cancer Res,
165, 8-13.
KEHLET, H. 2009. Multimodal approach to postoperative recovery. Curr Opin Crit Care, 15, 355-
8.
KEHLET, H. & WILMORE, D. W. 2002. Multimodal strategies to improve surgical outcome. Am J
Surg, 183, 630-41.
KELLEY, D. E., HE, J., MENSHIKOVA, E. V. & RITOV, V. B. 2002. Dysfunction of mitochondria in
human skeletal muscle in type 2 diabetes. Diabetes, 51, 2944-50.
KHOO, C. K., VICKERY, C. J., FORSYTH, N., VINALL, N. S. & EYRE-BROOK, I. A. 2007. A prospective
randomized controlled trial of multimodal perioperative management protocol in patients
undergoing elective colorectal resection for cancer. Ann Surg, 245, 867-72.
KIM, Y. I., LEE, F. N., CHOI, W. S., LEE, S. & YOUN, J. H. 2006. Insulin regulation of skeletal muscle
PDK4 mRNA expression is impaired in acute insulin-resistant states. Diabetes, 55, 2311-7.
KLAFTA, J. M. & ROIZEN, M. F. 1996. Current understanding of patients' attitudes toward and
preparation for anesthesia: a review. Anesth Analg, 83, 1314-21.
KREMEN, J., DOLINKOVA, M., KRAJICKOVA, J., BLAHA, J., ANDERLOVA, K., LACINOVA, Z.,
HALUZIKOVA, D., BOSANSKA, L., VOKURKA, M., SVACINA, S. & HALUZIK, M. 2006. Increased
subcutaneous and epicardial adipose tissue production of proinflammatory cytokines in cardiac
surgery patients: possible role in postoperative insulin resistance. J Clin Endocrinol Metab, 91,
4620-7.
KRENTZ, A. J. 1996. Insulin resistance. BMJ, 313, 1385-9.
KURZ, A., SESSLER, D. I. & LENHARDT, R. 1996. Perioperative normothermia to reduce the
incidence of surgical-wound infection and shorten hospitalization. Study of Wound Infection and
Temperature Group. N Engl J Med, 334, 1209-15.
LAIRD, A. M., MILLER, P. R., KILGO, P. D., MEREDITH, J. W. & CHANG, M. C. 2004. Relationship of
early hyperglycemia to mortality in trauma patients. J Trauma, 56, 1058-62.
LASSEN, K., KJAEVE, J., FETVEIT, T., TRANO, G., SIGURDSSON, H. K., HORN, A. & REVHAUG, A.
2008. Allowing normal food at will after major upper gastrointestinal surgery does not increase
morbidity: a randomized multicenter trial. Ann Surg, 247, 721-9.
LASSEN, K., SOOP, M., NYGREN, J., COX, P. B., HENDRY, P. O., SPIES, C., VON MEYENFELDT, M. F.,
FEARON, K. C., REVHAUG, A., NORDERVAL, S., LJUNGQVIST, O., LOBO, D. N. & DEJONG, C. H.
2009a. Consensus review of optimal perioperative care in colorectal surgery: Enhanced
Recovery After Surgery (ERAS) Group recommendations. Arch Surg, 144, 961-9.
LASSEN, K., SOOP, M., NYGREN, J., COX, P. B., HENDRY, P. O., SPIES, C., VON MEYENFELDT, M. F.,
FEARON, K. C., REVHAUG, A., NORDERVAL, S., LJUNGQVIST, O., LOBO, D. N. & DEJONG, C. H.

231
2009b. Enhanced recovery after surgery: a consensus review of optimal perioperative care in
colorectal surgery. The ERAS®-group recommendations. Arch Surg, In press.
LATRES, E., AMINI, A. R., AMINI, A. A., GRIFFITHS, J., MARTIN, F. J., WEI, Y., LIN, H. C.,
YANCOPOULOS, G. D. & GLASS, D. J. 2005. Insulin-like growth factor-1 (IGF-1) inversely regulates
atrophy-induced genes via the phosphatidylinositol 3-kinase/Akt/mammalian target of
rapamycin (PI3K/Akt/mTOR) pathway. J Biol Chem, 280, 2737-44.
LAUWICK, S. M., KABA, A., MAWEJA, S., HAMOIR, E. E. & JORIS, J. L. 2009. Effects of oral
preoperative carbohydrate on early postoperative outcome after thyroidectomy. Acta
Anaesthesiol Belg, 60, 67-73.
LEHRKE, M., BROEDL, U. C., BILLER-FRIEDMANN, I. M., VOGESER, M., HENSCHEL, V., NASSAU, K.,
GOKE, B., KILGER, E. & PARHOFER, K. G. 2008. Serum concentrations of cortisol, interleukin 6,
leptin and adiponectin predict stress induced insulin resistance in acute inflammatory reactions.
Crit Care, 12, R157.
LEWIS, S. J., ANDERSEN, H. K. & THOMAS, S. 2009. Early enteral nutrition within 24 h of
intestinal surgery versus later commencement of feeding: a systematic review and meta-
analysis. J Gastrointest Surg, 13, 569-75.
LI, L., WANG, Z., YING, X., TIAN, J., SUN, T., YI, K., ZHANG, P., JING, Z. & YANG, K. 2012.
Preoperative carbohydrate loading for elective surgery: a systematic review and meta-analysis.
Surg Today, 42, 613-24.
LI, Y. P., CHEN, Y., JOHN, J., MOYLAN, J., JIN, B., MANN, D. L. & REID, M. B. 2005. TNF-alpha acts
via p38 MAPK to stimulate expression of the ubiquitin ligase atrogin1/MAFbx in skeletal muscle.
FASEB J, 19, 362-70.
LIDDER, P., FLANAGAN, D., FLEMING, S., RUSSELL, M., MORGAN, N., WHEATLEY, T., RAHAMIN,
J., SHAW, S. & LEWIS, S. 2010a. Combining enteral with parenteral nutrition to improve
postoperative glucose control. Br J Nutr, 103, 1635-41.
LIDDER, P. G., BUCKLEY, D. & PULLAN, R. D. 2010b. The Bowel Cancer Screening Programme: an
unusual cause of positive faecal occult bloods. Gut, 59, 480, 512.
LIN, J. H., WHELAN, R. L., SAKELLARIOS, N. E., CEKIC, V., FORDE, K. A., BANK, J. & FEINGOLD, D. L.
2009. Prospective study of ambulation after open and laparoscopic colorectal resection. Surg
Innov, 16, 16-20.
LIU, J. P., BAKER, J., PERKINS, A. S., ROBERTSON, E. J. & EFSTRATIADIS, A. 1993. Mice carrying
null mutations of the genes encoding insulin-like growth factor I (Igf-1) and type 1 IGF receptor
(Igf1r). Cell, 75, 59-72.
LJUNGQVIST, O. Insulin resistance and outcomes in surgery. J Clin Endocrinol Metab, 95, 4217-9.
LJUNGQVIST, O. 2009. Modulating postoperative insulin resistance by preoperative
carbohydrate loading. Best Pract Res Clin Anaesthesiol, 23, 401-9.
232
LJUNGQVIST, O., NYGREN, J., SOOP, M. & THORELL, A. 2005. Metabolic perioperative
management: novel concepts. Curr Opin Crit Care, 11, 295-9.
LJUNGQVIST, O. & SOREIDE, E. 2003. Preoperative fasting. Br J Surg, 90, 400-6.
LJUNGQVIST, O., THORELL, A., GUTNIAK, M., HAGGMARK, T. & EFENDIC, S. 1994. Glucose
infusion instead of preoperative fasting reduces postoperative insulin resistance. J Am Coll Surg,
178, 329-36.
LOBO, D. N., BOSTOCK, K. A., NEAL, K. R., PERKINS, A. C., ROWLANDS, B. J. & ALLISON, S. P.
2002a. Effect of salt and water balance on recovery of gastrointestinal function after elective
colonic resection: a randomised controlled trial. Lancet, 359, 1812-8.
LOBO, D. N., DUBE, M. G., NEAL, K. R., ALLISON, S. P. & ROWLANDS, B. J. 2002b. Peri-operative
fluid and electrolyte management: a survey of consultant surgeons in the UK. Ann R Coll Surg
Engl, 84, 156-60.
LOBO, D. N., HENDRY, P. O., RODRIGUES, G., MARCIANI, L., TOTMAN, J. J., WRIGHT, J. W.,
PRESTON, T., GOWLAND, P., SPILLER, R. C. & FEARON, K. C. 2009. Gastric emptying of three
liquid oral preoperative metabolic preconditioning regimens measured by magnetic resonance
imaging in healthy adult volunteers: a randomised double-blind, crossover study. Clin Nutr, 28,
636-41.
MAESSEN, J., DEJONG, C. H., HAUSEL, J., NYGREN, J., LASSEN, K., ANDERSEN, J., KESSELS, A. G.,
REVHAUG, A., KEHLET, H., LJUNGQVIST, O., FEARON, K. C. & VON MEYENFELDT, M. F. 2007. A
protocol is not enough to implement an enhanced recovery programme for colorectal resection.
Br J Surg, 94, 224-31.
MAESSEN, J. M., HOFF, C., JOTTARD, K., KESSELS, A. G., BREMERS, A. J., HAVENGA, K.,
OOSTENBROEK, R. J., VON MEYENFELDT, M. F. & DEJONG, C. H. 2009. To eat or not to eat:
facilitating early oral intake after elective colonic surgery in the Netherlands. Clin Nutr, 28, 29-
33.
MAGNUSSON, K., WAHREN, J. & EKMAN, L. 1990. Protein synthesis in skeletal muscle during
starvation and refeeding: comparison of data from intact muscle and muscle biopsy material.
Metabolism, 39, 1113-7.
MAHOMED, N. N., LIANG, M. H., COOK, E. F., DALTROY, L. H., FORTIN, P. R., FOSSEL, A. H. &
KATZ, J. N. 2002. The importance of patient expectations in predicting functional outcomes after
total joint arthroplasty. J Rheumatol, 29, 1273-9.
MAIESE, K., CHONG, Z. Z. & SHANG, Y. C. 2008. OutFOXOing disease and disability: the
therapeutic potential of targeting FoxO proteins. Trends Mol Med, 14, 219-27.
MALTBY, J. R. 2006. Fasting from midnight--the history behind the dogma. Best Pract Res Clin
Anaesthesiol, 20, 363-78.

233
MARRET, E., REMY, C. & BONNET, F. 2007. Meta-analysis of epidural analgesia versus parenteral
opioid analgesia after colorectal surgery. Br J Surg, 94, 665-73.
MARTIN, C., BOISSON, C., HACCOUN, M., THOMACHOT, L. & MEGE, J. L. 1997. Patterns of
cytokine evolution (tumor necrosis factor-alpha and interleukin-6) after septic shock,
hemorrhagic shock, and severe trauma. Crit Care Med, 25, 1813-9.
MATHUR, S., PLANK, L. D., MCCALL, J. L., SHAPKOV, P., MCILROY, K., GILLANDERS, L. K., MERRIE,
A. E., TORRIE, J. J., PUGH, F., KOEA, J. B., BISSETT, I. P. & PARRY, B. R. 2010. Randomized
controlled trial of preoperative oral carbohydrate treatment in major abdominal surgery. Br J
Surg, 97, 485-94.
MATSUZAKI, H., TAMATANI, M., MITSUDA, N., NAMIKAWA, K., KIYAMA, H., MIYAKE, S. &
TOHYAMA, M. 1999. Activation of Akt kinase inhibits apoptosis and changes in Bcl-2 and Bax
expression induced by nitric oxide in primary hippocampal neurons. J Neurochem, 73, 2037-46.
MATTHEWS, D. R., HOSKER, J. P., RUDENSKI, A. S., NAYLOR, B. A., TREACHER, D. F. & TURNER, R.
C. 1985. Homeostasis model assessment: insulin resistance and beta-cell function from fasting
plasma glucose and insulin concentrations in man. Diabetologia, 28, 412-9.
MCLEOD, R. S., GEERTS, W. H., SNIDERMAN, K. W., GREENWOOD, C., GREGOIRE, R. C., TAYLOR,
B. M., SILVERMAN, R. E., ATKINSON, K. G., BURNSTEIN, M., MARSHALL, J. C., BURUL, C. J.,
ANDERSON, D. R., ROSS, T., WILSON, S. R. & BARTON, P. 2001. Subcutaneous heparin versus
low-molecular-weight heparin as thromboprophylaxis in patients undergoing colorectal surgery:
results of the canadian colorectal DVT prophylaxis trial: a randomized, double-blind trial. Ann
Surg, 233, 438-44.
MCPHERRON, A. C. & LEE, S. J. 2002. Suppression of body fat accumulation in myostatin-
deficient mice. J Clin Invest, 109, 595-601.
MEAKINS, J. L. 1990. Etiology of multiple organ failure. J Trauma, 30, S165-8.
MEALY, K., VAN LANSCHOT, J. J., ROBINSON, B. G., ROUNDS, J. & WILMORE, D. W. 1990. Are the
catabolic effects of tumor necrosis factor mediated by glucocorticoids? Arch Surg, 125, 42-7;
discussion 47-8.
MEDINA, E. A., AFSARI, R. R., RAVID, T., CASTILLO, S. S., ERICKSON, K. L. & GOLDKORN, T. 2005.
Tumor necrosis factor-{alpha} decreases Akt protein levels in 3T3-L1 adipocytes via the caspase-
dependent ubiquitination of Akt. Endocrinology, 146, 2726-35.
MEDURI, G. U., MARIK, P. E. & ANNANE, D. 2009. Prolonged glucocorticoid treatment in acute
respiratory distress syndrome: Evidence supporting effectiveness and safety. Crit Care Med, 37,
1800-3.
MELIS, G. C., VAN LEEUWEN, P. A., VON BLOMBERG-VAN DER FLIER, B. M., GOEDHART-
HIDDINGA, A. C., UITDEHAAG, B. M., STRACK VAN SCHIJNDEL, R. J., WUISMAN, P. I. & VAN
BOKHORST-DE VAN DER SCHUEREN, M. A. 2006. A carbohydrate-rich beverage prior to surgery

234
prevents surgery-induced immunodepression: a randomized, controlled, clinical trial. JPEN J
Parenter Enteral Nutr, 30, 21-6.
MIEDEMA, B. W. & JOHNSON, J. O. 2003. Methods for decreasing postoperative gut dysmotility.
Lancet Oncol, 4, 365-72.
MIZOCK, B. A. 2001. Alterations in fuel metabolism in critical illness: hyperglycaemia. Best Pract
Res Clin Endocrinol Metab, 15, 533-51.
MODUR, V., NAGARAJAN, R., EVERS, B. M. & MILBRANDT, J. 2002. FOXO proteins regulate
tumor necrosis factor-related apoptosis inducing ligand expression. Implications for PTEN
mutation in prostate cancer. J Biol Chem, 277, 47928-37.
MOINICHE, S., KEHLET, H. & DAHL, J. B. 2002. A qualitative and quantitative systematic review of
preemptive analgesia for postoperative pain relief: the role of timing of analgesia.
Anesthesiology, 96, 725-41.
MONK, D. N., PLANK, L. D., FRANCH-ARCAS, G., FINN, P. J., STREAT, S. J. & HILL, G. L. 1996.
Sequential changes in the metabolic response in critically injured patients during the first 25
days after blunt trauma. Ann Surg, 223, 395-405.
MULLER, S., ZALUNARDO, M. P., HUBNER, M., CLAVIEN, P. A., DEMARTINES, N. & ZURICH FAST
TRACK STUDY, G. 2009. A fast-track program reduces complications and length of hospital stay
after open colonic surgery. Gastroenterology, 136, 842-7.
MURTON, A. J., CONSTANTIN, D. & GREENHAFF, P. L. 2008. The involvement of the ubiquitin
proteasome system in human skeletal muscle remodelling and atrophy. Biochim Biophys Acta,
1782, 730-43.
NABER, T. H., SCHERMER, T., DE BREE, A., NUSTELING, K., EGGINK, L., KRUIMEL, J. W.,
BAKKEREN, J., VAN HEEREVELD, H. & KATAN, M. B. 1997. Prevalence of malnutrition in
nonsurgical hospitalized patients and its association with disease complications. Am J Clin Nutr,
66, 1232-9.
NADER, G. A. 2005. Molecular determinants of skeletal muscle mass: getting the "AKT" together.
Int J Biochem Cell Biol, 37, 1985-96.
NAKAE, J., PARK, B. C. & ACCILI, D. 1999. Insulin stimulates phosphorylation of the forkhead
transcription factor FKHR on serine 253 through a Wortmannin-sensitive pathway. J Biol Chem,
274, 15982-5.
NAVARRA, P., TSAGARAKIS, S., FARIA, M. S., REES, L. H., BESSER, G. M. & GROSSMAN, A. B. 1991.
Interleukins-1 and -6 stimulate the release of corticotropin-releasing hormone-41 from rat
hypothalamus in vitro via the eicosanoid cyclooxygenase pathway. Endocrinology, 128, 37-44.
NELSON, R., EDWARDS, S. & TSE, B. 2007. Prophylactic nasogastric decompression after
abdominal surgery. Cochrane Database Syst Rev, CD004929.
235
NESHER, N., ZISMAN, E., WOLF, T., SHARONY, R., BOLOTIN, G., DAVID, M., URETZKY, G. & PIZOV,
R. 2003. Strict thermoregulation attenuates myocardial injury during coronary artery bypass
graft surgery as reflected by reduced levels of cardiac-specific troponin I. Anesth Analg, 96, 328-
35, table of contents.
NISANEVICH, V., FELSENSTEIN, I., ALMOGY, G., WEISSMAN, C., EINAV, S. & MATOT, I. 2005.
Effect of intraoperative fluid management on outcome after intraabdominal surgery.
Anesthesiology, 103, 25-32.
NOBLETT, S. E., SNOWDEN, C. P., SHENTON, B. K. & HORGAN, A. F. 2006a. Randomized clinical
trial assessing the effect of Doppler-optimized fluid management on outcome after elective
colorectal resection. Br J Surg, 93, 1069-76.
NOBLETT, S. E., WATSON, D. S., HUONG, H., DAVISON, B., HAINSWORTH, P. J. & HORGAN, A. F.
2006b. Pre-operative oral carbohydrate loading in colorectal surgery: a randomized controlled
trial. Colorectal Dis, 8, 563-9.
NOSADINI, R., DEL PRATO, S., TIENGO, A., VALERIO, A., MUGGEO, M., OPOCHER, G., MANTERO,
F., DUNER, E., MARESCOTTI, C., MOLLO, F. & BELLONI, F. 1983. Insulin resistance in Cushing's
syndrome. J Clin Endocrinol Metab, 57, 529-36.
NYGREN, J. 2006. The metabolic effects of fasting and surgery. Best Pract Res Clin Anaesthesiol,
20, 429-38.
NYGREN, J., SOOP, M., THORELL, A., EFENDIC, S., NAIR, K. S. & LJUNGQVIST, O. 1998a.
Preoperative oral carbohydrate administration reduces postoperative insulin resistance. Clin
Nutr, 17, 65-71.
NYGREN, J., SOOP, M., THORELL, A., SREE NAIR, K. & LJUNGQVIST, O. 1999. Preoperative oral
carbohydrates and postoperative insulin resistance. Clin Nutr, 18, 117-20.
NYGREN, J., THORELL, A., BRISMAR, K., KARPE, F. & LJUNGQVIST, O. 1997a. Short-term
hypocaloric nutrition but not bed rest decrease insulin sensitivity and IGF-I bioavailability in
healthy subjects: the importance of glucagon. Nutrition, 13, 945-51.
NYGREN, J., THORELL, A., EFENDIC, S., NAIR, K. S. & LJUNGQVIST, O. 1997b. Site of insulin
resistance after surgery: the contribution of hypocaloric nutrition and bed rest. Clin Sci (Lond),
93, 137-46.
NYGREN, J., THORELL, A., JACOBSSON, H., LARSSON, S., SCHNELL, P. O., HYLEN, L. &
LJUNGQVIST, O. 1995. Preoperative gastric emptying. Effects of anxiety and oral carbohydrate
administration. Ann Surg, 222, 728-34.
NYGREN, J., THORELL, A. & LJUNGQVIST, O. 2001. Preoperative oral carbohydrate nutrition: an
update. Curr Opin Clin Nutr Metab Care, 4, 255-9.
236
NYGREN, J. O., THORELL, A., SOOP, M., EFENDIC, S., BRISMAR, K., KARPE, F., NAIR, K. S. &
LJUNGQVIST, O. 1998b. Perioperative insulin and glucose infusion maintains normal insulin
sensitivity after surgery. Am J Physiol, 275, E140-8.
O'KEEFE, S. J., SENDER, P. M. & JAMES, W. P. 1974. "Catabolic" loss of body nitrogen in response
to surgery. Lancet, 2, 1035-8.
OKABAYASHI, T., IYOKI, M., SUGIMOTO, T., KOBAYASHI, M. & HANAZAKI, K. 2011. Oral
supplementation with carbohydrate- and branched-chain amino acid-enriched nutrients
improves postoperative quality of life in patients undergoing hepatic resection. Amino Acids, 40,
1213-20.
OKABAYASHI, T., NISHIMORI, I., YAMASHITA, K., SUGIMOTO, T., NAMIKAWA, T., MAEDA, H.,
YATABE, T. & HANAZAKI, K. 2010. Preoperative oral supplementation with carbohydrate and
branched-chain amino acid-enriched nutrient improves insulin resistance in patients undergoing
a hepatectomy: a randomized clinical trial using an artificial pancreas. Amino Acids, 38, 901-7.
OROSCO, M. & GEROZISSIS, K. 2001. Macronutrient-induced cascade of events leading to
parallel changes in hypothalamic serotonin and insulin. Neurosci Biobehav Rev, 25, 167-74.
PAL, M., FEBBRAIO, M. A. & WHITHAM, M. 2014. From cytokine to myokine: the emerging role
of interleukin-6 in metabolic regulation. Immunol Cell Biol, 92, 331-9.
PERRONE, F., DA-SILVA-FILHO, A. C., ADORNO, I. F., ANABUKI, N. T., LEAL, F. S., COLOMBO, T.,
DA SILVA, B. D., DOCK-NASCIMENTO, D. B., DAMIAO, A. & DE AGUILAR-NASCIMENTO, J. E. 2011.
Effects of preoperative feeding with a whey protein plus carbohydrate drink on the acute phase
response and insulin resistance. A randomized trial. Nutr J, 10, 66.
PESSIN, J. E. & BELL, G. I. 1992. Mammalian facilitative glucose transporter family: structure and
molecular regulation. Annu Rev Physiol, 54, 911-30.
PESSIN, J. E. & SALTIEL, A. R. 2000. Signaling pathways in insulin action: molecular targets of
insulin resistance. J Clin Invest, 106, 165-9.
PETERSEN, K. F., BEFROY, D., DUFOUR, S., DZIURA, J., ARIYAN, C., ROTHMAN, D. L., DIPIETRO, L.,
CLINE, G. W. & SHULMAN, G. I. 2003. Mitochondrial dysfunction in the elderly: possible role in
insulin resistance. Science, 300, 1140-2.
PETERSSON, B., WERNERMAN, J., WALLER, S. O., VON DER DECKEN, A. & VINNARS, E. 1990.
Elective abdominal surgery depresses muscle protein synthesis and increases subjective fatigue:
effects lasting more than 30 days. Br J Surg, 77, 796-800.
PILEGAARD, H. & NEUFER, P. D. 2004. Transcriptional regulation of pyruvate dehydrogenase
kinase 4 in skeletal muscle during and after exercise. Proc Nutr Soc, 63, 221-6.
PITTAS, A. G., SIEGEL, R. D. & LAU, J. 2004. Insulin therapy for critically ill hospitalized patients: a
meta-analysis of randomized controlled trials. Arch Intern Med, 164, 2005-11.

237
PLATELL, C., BARWOOD, N. & MAKIN, G. 2006. Randomized clinical trial of bowel preparation
with a single phosphate enema or polyethylene glycol before elective colorectal surgery. Br J
Surg, 93, 427-33.
PLATELL, C. & HALL, J. 1998. What is the role of mechanical bowel preparation in patients
undergoing colorectal surgery? Dis Colon Rectum, 41, 875-82; discussion 882-3.
POSPISILIK, J. A., KNAUF, C., JOZA, N., BENIT, P., ORTHOFER, M., CANI, P. D., EBERSBERGER, I.,
NAKASHIMA, T., SARAO, R., NEELY, G., ESTERBAUER, H., KOZLOV, A., KAHN, C. R., KROEMER, G.,
RUSTIN, P., BURCELIN, R. & PENNINGER, J. M. 2007. Targeted deletion of AIF decreases
mitochondrial oxidative phosphorylation and protects from obesity and diabetes. Cell, 131, 476-
91.
PROTIC, A., TURINA, D., MATANIC, D., SPANJOL, J., ZUVIC-BUTORAC, M. & SUSTIC, A. 2010.
Effect of preoperative feeding on gastric emptying following spinal anesthesia: a randomized
controlled trial. Wien Klin Wochenschr, 122, 50-3.
QIAO, Z., LI, Z., LI, J., LU, L. & LV, Y. 2009. Bacterial translocation and change in intestinal
permeability in patients after abdominal surgery. J Huazhong Univ Sci Technolog Med Sci, 29,
486-91.
QIAO, Z., LI, Z. L., LI, J. Y., LIN, H. Y., DENG, Q., LU, L. R. & LU, Y. 2006. [Clinical study on bacterial
translocation in severe multiple trauma patients]. Zhongguo Wei Zhong Bing Ji Jiu Yi Xue, 18, 13-
5.
RACHEK, L. I., THORNLEY, N. P., GRISHKO, V. I., LEDOUX, S. P. & WILSON, G. L. 2006. Protection
of INS-1 cells from free fatty acid-induced apoptosis by targeting hOGG1 to mitochondria.
Diabetes, 55, 1022-8.
RAHBARI, N. N., ZIMMERMANN, J. B., SCHMIDT, T., KOCH, M., WEIGAND, M. A. & WEITZ, J.
2009. Meta-analysis of standard, restrictive and supplemental fluid administration in colorectal
surgery. Br J Surg, 96, 331-41.
RAM, E., SHERMAN, Y., WEIL, R., VISHNE, T., KRAVARUSIC, D. & DREZNIK, Z. 2005. Is mechanical
bowel preparation mandatory for elective colon surgery? A prospective randomized study. Arch
Surg, 140, 285-8.
RAMOS, M., KHALPEY, Z., LIPSITZ, S., STEINBERG, J., PANIZALES, M. T., ZINNER, M. & ROGERS, S.
O. 2008. Relationship of perioperative hyperglycemia and postoperative infections in patients
who undergo general and vascular surgery. Ann Surg, 248, 585-91.
RAPP-KESEK, D., STRIDSBERG, M., ANDERSSON, L. G., BERNE, C. & KARLSSON, T. 2007. Insulin
resistance after cardiopulmonary bypass in the elderly patient. Scand Cardiovasc J, 41, 102-8.
RAURAMAA, R., KUUSELA, P. & HIETANEN, E. 1980. Adipose, muscle and lung tissue lipoprotein
lipase activities in young streptozotocin treated rats. Horm Metab Res, 12, 591-5.

238
REARDON, K. A., DAVIS, J., KAPSA, R. M., CHOONG, P. & BYRNE, E. 2001. Myostatin, insulin-like
growth factor-1, and leukemia inhibitory factor mRNAs are upregulated in chronic human disuse
muscle atrophy. Muscle Nerve, 24, 893-9.
REAVEN, G. M., HOLLENBECK, C., JENG, C. Y., WU, M. S. & CHEN, Y. D. 1988. Measurement of
plasma glucose, free fatty acid, lactate, and insulin for 24 h in patients with NIDDM. Diabetes,
37, 1020-4.
RENNIE, M. J., BENNEGARD, K., EDEN, E., EMERY, P. W. & LUNDHOLM, K. 1984. Urinary
excretion and efflux from the leg of 3-methylhistidine before and after major surgical operation.
Metabolism, 33, 250-6.
RIZZA, R. A., MANDARINO, L. J. & GERICH, J. E. 1982. Cortisol-induced insulin resistance in man:
impaired suppression of glucose production and stimulation of glucose utilization due to a
postreceptor detect of insulin action. J Clin Endocrinol Metab, 54, 131-8.
ROMMEL, C., BODINE, S. C., CLARKE, B. A., ROSSMAN, R., NUNEZ, L., STITT, T. N.,
YANCOPOULOS, G. D. & GLASS, D. J. 2001. Mediation of IGF-1-induced skeletal myotube
hypertrophy by PI(3)K/Akt/mTOR and PI(3)K/Akt/GSK3 pathways. Nat Cell Biol, 3, 1009-13.
RUI, L., AGUIRRE, V., KIM, J. K., SHULMAN, G. I., LEE, A., CORBOULD, A., DUNAIF, A. & WHITE, M.
F. 2001. Insulin/IGF-1 and TNF-alpha stimulate phosphorylation of IRS-1 at inhibitory Ser307 via
distinct pathways. J Clin Invest, 107, 181-9.
RYAN, N. T. 1976. Metabolic adaptations for energy production during trauma and sepsis. Surg
Clin North Am, 56, 1073-90.
SANDRI, M., SANDRI, C., GILBERT, A., SKURK, C., CALABRIA, E., PICARD, A., WALSH, K.,
SCHIAFFINO, S., LECKER, S. H. & GOLDBERG, A. L. 2004. Foxo transcription factors induce the
atrophy-related ubiquitin ligase atrogin-1 and cause skeletal muscle atrophy. Cell, 117, 399-412.
SATO, H., CARVALHO, G., SATO, T., LATTERMANN, R., MATSUKAWA, T. & SCHRICKER, T. The
association of preoperative glycemic control, intraoperative insulin sensitivity, and outcomes
after cardiac surgery. J Clin Endocrinol Metab, 95, 4338-44.
SATO, H., CARVALHO, G., SATO, T., LATTERMANN, R., MATSUKAWA, T. & SCHRICKER, T. 2010.
The association of preoperative glycemic control, intraoperative insulin sensitivity, and
outcomes after cardiac surgery. J Clin Endocrinol Metab, 95, 4338-44.
SCHMIED, H., KURZ, A., SESSLER, D. I., KOZEK, S. & REITER, A. 1996. Mild hypothermia increases
blood loss and transfusion requirements during total hip arthroplasty. Lancet, 347, 289-92.
SCHRICKER, T., METERISSIAN, S., LATTERMANN, R., ADEGOKE, O. A., MARLISS, E. B., MAZZA, L.,
EBERHART, L., CARLI, F., NITSCHMAN, E. & WYKES, L. 2008. Anticatabolic effects of avoiding
preoperative fasting by intravenous hypocaloric nutrition: a randomized clinical trial. Ann Surg,
248, 1051-9.

239
SCHUTZ, T. & PIRLICH, M. 2006. ["Malnutrition in the hospital": age as a special risk factor].
Pflege Z, 59, 778-9.
SCOTT, E. M. & BUCKLAND, R. 2006. A systematic review of intraoperative warming to prevent
postoperative complications. AORN J, 83, 1090-104, 1107-13.
SERCLOVA, Z. 2009. Fast-track in open intestinal surgery: Prospective randomized study. Clin
Nutr.
SERCLOVA, Z., DYTRYCH, P., MARVAN, J., NOVA, K., HANKEOVA, Z., RYSKA, O., SLEGROVA, Z.,
BURESOVA, L., TRAVNIKOVA, L. & ANTOS, F. 2009. Fast-track in open intestinal surgery:
prospective randomized study (Clinical Trials Gov Identifier no. NCT00123456). Clin Nutr, 28,
618-24.
SHANGRAW, R. E., RABKIN, J. M. & LOPASCHUK, G. D. 1998. Hepatic pyruvate dehydrogenase
activity in humans: effect of cirrhosis, transplantation, and dichloroacetate. Am J Physiol, 274,
G569-77.
SHAW, J. H., KLEIN, S. & WOLFE, R. R. 1985. Assessment of alanine, urea, and glucose
interrelationships in normal subjects and in patients with sepsis with stable isotopic tracers.
Surgery, 97, 557-68.
SHAW, J. H. & WOLFE, R. R. 1985. Response to glucose and lipid infusions in sepsis: a kinetic
analysis. Metabolism, 34, 442-9.
SHAW, J. H. & WOLFE, R. R. 1989. An integrated analysis of glucose, fat, and protein metabolism
in severely traumatized patients. Studies in the basal state and the response to total parenteral
nutrition. Ann Surg, 209, 63-72.
SHENKIN, A., FRASER, W. D., SERIES, J., WINSTANLEY, F. P., MCCARTNEY, A. C., BURNS, H. J. &
VAN DAMME, J. 1989. The serum interleukin 6 response to elective surgery. Lymphokine Res, 8,
123-7.
SHEPHERD, P. R. & KAHN, B. B. 1999. Glucose transporters and insulin action--implications for
insulin resistance and diabetes mellitus. N Engl J Med, 341, 248-57.
SLIM, K., VICAUT, E., PANIS, Y. & CHIPPONI, J. 2004. Meta-analysis of randomized clinical trials of
colorectal surgery with or without mechanical bowel preparation. Br J Surg, 91, 1125-30.
SMITH, A. F. & PITTAWAY, A. J. 2000. Premedication for anxiety in adult day surgery. Cochrane
Database Syst Rev, CD002192.
SMITH, A. F. & PITTAWAY, A. J. 2003. Premedication for anxiety in adult day surgery. Cochrane
Database Syst Rev, CD002192.
SMITH, I., KRANKE, P., MURAT, I., SMITH, A., O'SULLIVAN, G., SOREIDE, E., SPIES, C., IN'T VELD, B.
& EUROPEAN SOCIETY OF, A. 2011b. Perioperative fasting in adults and children: guidelines
from the European Society of Anaesthesiology. Eur J Anaesthesiol, 28, 556-69.

240
SONG, F. & GLENNY, A. M. 1998. Antimicrobial prophylaxis in colorectal surgery: a systematic
review of randomized controlled trials. Br J Surg, 85, 1232-41.
SOOP, M., CARLSON, G. L., HOPKINSON, J., CLARKE, S., THORELL, A., NYGREN, J. & LJUNGQVIST,
O. 2004a. Randomized clinical trial of the effects of immediate enteral nutrition on metabolic
responses to major colorectal surgery in an enhanced recovery protocol. Br J Surg, 91, 1138-45.
SOOP, M., NYGREN, J., MYRENFORS, P., THORELL, A. & LJUNGQVIST, O. 2001. Preoperative oral
carbohydrate treatment attenuates immediate postoperative insulin resistance. Am J Physiol
Endocrinol Metab, 280, E576-83.
SOOP, M., NYGREN, J., THORELL, A., WEIDENHIELM, L., LUNDBERG, M., HAMMARQVIST, F. &
LJUNGQVIST, O. 2004b. Preoperative oral carbohydrate treatment attenuates endogenous
glucose release 3 days after surgery. Clin Nutr, 23, 733-41.
SOREIDE, E., FASTING, S. & RAEDER, J. 1997. New preoperative fasting guidelines in Norway.
Acta Anaesthesiol Scand, 41, 799.
SPRIET, L. L., TUNSTALL, R. J., WATT, M. J., MEHAN, K. A., HARGREAVES, M. & CAMERON-SMITH,
D. 2004. Pyruvate dehydrogenase activation and kinase expression in human skeletal muscle
during fasting. J Appl Physiol (1985), 96, 2082-7.
STACPOOLE, P. W. & GREENE, Y. J. 1992. Dichloroacetate. Diabetes Care, 15, 785-91.
STACPOOLE, P. W., HARMAN, E. M., CURRY, S. H., BAUMGARTNER, T. G. & MISBIN, R. I. 1983.
Treatment of lactic acidosis with dichloroacetate. N Engl J Med, 309, 390-6.
STACPOOLE, P. W., MOORE, G. W. & KORNHAUSER, D. M. 1978. Metabolic effects of
dichloroacetate in patients with diabetes mellitus and hyperlipoproteinemia. N Engl J Med, 298,
526-30.
STENBERG, A., GUSTAVSSON, S., LUNDQVIST, G. & THOREN, L. 1984. Effect of surgical trauma on
plasma insulin and somatostatin in response to glucose. Acta Chir Scand, 150, 119-22.
STITT, T. N., DRUJAN, D., CLARKE, B. A., PANARO, F., TIMOFEYVA, Y., KLINE, W. O., GONZALEZ,
M., YANCOPOULOS, G. D. & GLASS, D. J. 2004. The IGF-1/PI3K/Akt pathway prevents expression
of muscle atrophy-induced ubiquitin ligases by inhibiting FOXO transcription factors. Mol Cell,
14, 395-403.
STONER, H. B., FRAYN, K. N., BARTON, R. N., THRELFALL, C. J. & LITTLE, R. A. 1979. The
relationships between plasma substrates and hormones and the severity of injury in 277
recently injured patients. Clin Sci (Lond), 56, 563-73.
SUNG, J., BOCHICCHIO, G. V., JOSHI, M., BOCHICCHIO, K., TRACY, K. & SCALEA, T. M. 2005.
Admission hyperglycemia is predictive of outcome in critically ill trauma patients. J Trauma, 59,
80-3.

241
SVANFELDT, M., THORELL, A., BRISMAR, K., NYGREN, J. & LJUNGQVIST, O. 2003. Effects of 3 days
of "postoperative" low caloric feeding with or without bed rest on insulin sensitivity in healthy
subjects. Clin Nutr, 22, 31-8.
SVANFELDT, M., THORELL, A., HAUSEL, J., SOOP, M., NYGREN, J. & LJUNGQVIST, O. 2005. Effect
of "preoperative" oral carbohydrate treatment on insulin action--a randomised cross-over
unblinded study in healthy subjects. Clin Nutr, 24, 815-21.
SVANFELDT, M., THORELL, A., HAUSEL, J., SOOP, M., ROOYACKERS, O., NYGREN, J. &
LJUNGQVIST, O. 2007. Randomized clinical trial of the effect of preoperative oral carbohydrate
treatment on postoperative whole-body protein and glucose kinetics. Br J Surg, 94, 1342-50.
SVOBODA, P., KANTOROVA, I. & OCHMANN, J. 1994. Dynamics of interleukin 1, 2, and 6 and
tumor necrosis factor alpha in multiple trauma patients. J Trauma, 36, 336-40.
TAKESUE, Y., OHGE, H., UEMURA, K., IMAMURA, Y., MURAKAMI, Y., YOKOYAMA, T., KAKEHASHI,
M. & SUEDA, T. 2002. Bacterial translocation in patients with Crohn's disease undergoing
surgery. Dis Colon Rectum, 45, 1665-71.
TANG, G. J. 1996. [Similarity and synergy of trauma and sepsis: role of tumor necrosis factor-
alpha and interleukin-6]. Acta Anaesthesiol Sin, 34, 141-9.
TAQI, A., HONG, X., MISTRALETTI, G., STEIN, B., CHARLEBOIS, P. & CARLI, F. 2007. Thoracic
epidural analgesia facilitates the restoration of bowel function and dietary intake in patients
undergoing laparoscopic colon resection using a traditional, nonaccelerated, perioperative care
program. Surg Endosc, 21, 247-52.
THORELL, A., ALSTON-SMITH, J. & LJUNGQVIST, O. 1996a. The effect of preoperative
carbohydrate loading on hormonal changes, hepatic glycogen, and glucoregulatory enzymes
during abdominal surgery. Nutrition, 12, 690-5.
THORELL, A., EFENDIC, S., GUTNIAK, M., HAGGMARK, T. & LJUNGQVIST, O. 1993. Development
of postoperative insulin resistance is associated with the magnitude of operation. Eur J Surg,
159, 593-9.
THORELL, A., EFENDIC, S., GUTNIAK, M., HAGGMARK, T. & LJUNGQVIST, O. 1994. Insulin
resistance after abdominal surgery. Br J Surg, 81, 59-63.
THORELL, A., LOFTENIUS, A., ANDERSSON, B. & LJUNGQVIST, O. 1996b. Postoperative insulin
resistance and circulating concentrations of stress hormones and cytokines. Clin Nutr, 15, 75-9.
THORELL, A., NYGREN, J., ESSEN, P., GUTNIAK, M., LOFTENIUS, A., ANDERSSON, B. &
LJUNGQVIST, O. 1996c. The metabolic response to cholecystectomy: insulin resistance after
open compared with laparoscopic operation. Eur J Surg, 162, 187-91.
THORELL, A., NYGREN, J., HIRSHMAN, M. F., HAYASHI, T., NAIR, K. S., HORTON, E. S., GOODYEAR,
L. J. & LJUNGQVIST, O. 1999a. Surgery-induced insulin resistance in human patients: relation to
glucose transport and utilization. Am J Physiol, 276, E754-61.

242
THORELL, A., NYGREN, J. & LJUNGQVIST, O. 1999b. Insulin resistance: a marker of surgical stress.
Curr Opin Clin Nutr Metab Care, 2, 69-78.
TIMMONS, J. A., GUSTAFSSON, T., SUNDBERG, C. J., JANSSON, E. & GREENHAFF, P. L. 1998a.
Muscle acetyl group availability is a major determinant of oxygen deficit in humans during
submaximal exercise. Am J Physiol, 274, E377-80.
TIMMONS, J. A., GUSTAFSSON, T., SUNDBERG, C. J., JANSSON, E., HULTMAN, E., KAIJSER, L.,
CHWALBINSKA-MONETA, J., CONSTANTIN-TEODOSIU, D., MACDONALD, I. A. & GREENHAFF, P. L.
1998b. Substrate availability limits human skeletal muscle oxidative ATP regeneration at the
onset of ischemic exercise. J Clin Invest, 101, 79-85.
TIMMONS, J. A., POUCHER, S. M., CONSTANTIN-TEODOSIU, D., MACDONALD, I. A. &
GREENHAFF, P. L. 1998c. Regulation of skeletal muscle carbohydrate oxidation during steady-
state contraction. Am J Physiol, 274, R1384-9.
TIMMONS, J. A., POUCHER, S. M., CONSTANTIN-TEODOSIU, D., WORRALL, V., MACDONALD, I. A.
& GREENHAFF, P. L. 1996. Increased acetyl group availability enhances contractile function of
canine skeletal muscle during ischemia. J Clin Invest, 97, 879-83.
TOMPKINS, R. G. 1997. The role of proinflammatory cytokines in inflammatory and metabolic
responses. Ann Surg, 225, 243-5.
TOWBIN, H., STAEHELIN, T. & GORDON, J. 1979. Electrophoretic transfer of proteins from
polyacrylamide gels to nitrocellulose sheets: procedure and some applications. Proc Natl Acad
Sci U S A, 76, 4350-4.
TRENDELENBURG, A. U., MEYER, A., ROHNER, D., BOYLE, J., HATAKEYAMA, S. & GLASS, D. J.
2009. Myostatin reduces Akt/TORC1/p70S6K signaling, inhibiting myoblast differentiation and
myotube size. Am J Physiol Cell Physiol, 296, C1258-70.
TSINTZAS, K., JEWELL, K., KAMRAN, M., LAITHWAITE, D., BOONSONG, T., LITTLEWOOD, J.,
MACDONALD, I. & BENNETT, A. 2006. Differential regulation of metabolic genes in skeletal
muscle during starvation and refeeding in humans. J Physiol, 575, 291-303.
TURECKOVA, J., WILSON, E. M., CAPPALONGA, J. L. & ROTWEIN, P. 2001. Insulin-like growth
factor-mediated muscle differentiation: collaboration between phosphatidylinositol 3-kinase-
Akt-signaling pathways and myogenin. J Biol Chem, 276, 39264-70.
TURUNEN, P., CARPELAN-HOLMSTROM, M., KAIRALUOMA, P., WIKSTROM, H., KRUUNA, O.,
PERE, P., BACHMANN, M., SARNA, S. & SCHEININ, T. 2009. Epidural analgesia diminished pain
but did not otherwise improve enhanced recovery after laparoscopic sigmoidectomy: a
prospective randomized study. Surg Endosc, 23, 31-7.
UCHIDA, I., ASOH, T., SHIRASAKA, C. & TSUJI, H. 1988. Effect of epidural analgesia on
postoperative insulin resistance as evaluated by insulin clamp technique. Br J Surg, 75, 557-62.

243
URBACH, D. R., KENNEDY, E. D. & COHEN, M. M. 1999. Colon and rectal anastomoses do not
require routine drainage: a systematic review and meta-analysis. Ann Surg, 229, 174-80.
VAN DEN BERGHE, G., WILMER, A., HERMANS, G., MEERSSEMAN, W., WOUTERS, P. J., MILANTS,
I., VAN WIJNGAERDEN, E., BOBBAERS, H. & BOUILLON, R. 2006. Intensive insulin therapy in the
medical ICU. N Engl J Med, 354, 449-61.
VAN DEN BERGHE, G., WOUTERS, P., WEEKERS, F., VERWAEST, C., BRUYNINCKX, F., SCHETZ, M.,
VLASSELAERS, D., FERDINANDE, P., LAUWERS, P. & BOUILLON, R. 2001. Intensive insulin therapy
in critically ill patients. N Engl J Med, 345, 1359-67.
VAN DEN BERGHE, G., WOUTERS, P. J., BOUILLON, R., WEEKERS, F., VERWAEST, C., SCHETZ, M.,
VLASSELAERS, D., FERDINANDE, P. & LAUWERS, P. 2003. Outcome benefit of intensive insulin
therapy in the critically ill: Insulin dose versus glycemic control. Crit Care Med, 31, 359-66.
VAN DER HEIDE, L. P., HOEKMAN, M. F. & SMIDT, M. P. 2004. The ins and outs of FoxO shuttling:
mechanisms of FoxO translocation and transcriptional regulation. Biochem J, 380, 297-309.
VARADHAN, K. K., NEAL, K. R., DEJONG, C. H., FEARON, K. C., LJUNGQVIST, O. & LOBO, D. N.
2010. The enhanced recovery after surgery (ERAS) pathway for patients undergoing major
elective open colorectal surgery: a meta-analysis of randomized controlled trials. Clin Nutr, 29,
434-40.
VARY, T. C. 1996. Sepsis-induced alterations in pyruvate dehydrogenase complex activity in rat
skeletal muscle: effects on plasma lactate. Shock, 6, 89-94.
VARY, T. C. 1998. Regulation of skeletal muscle protein turnover during sepsis. Curr Opin Clin
Nutr Metab Care, 1, 217-24.
VERMEULEN, M. A., RICHIR, M. C., GARRETSEN, M. K., VAN SCHIE, A., GHATEI, M. A., HOLST, J. J.,
HEIJBOER, A. C., UITDEHAAG, B. M., DIAMANT, M., EEKHOFF, E. M., VAN LEEUWEN, P. A. &
LIGTHART-MELIS, G. C. 2011. Gastric emptying, glucose metabolism and gut hormones:
evaluation of a common preoperative carbohydrate beverage. Nutrition, 27, 897-903.
VIGANO, J., CEREDA, E., CACCIALANZA, R., CARINI, R., CAMELETTI, B., SPAMPINATO, M. &
DIONIGI, P. 2012. Effects of preoperative oral carbohydrate supplementation on postoperative
metabolic stress response of patients undergoing elective abdominal surgery. World J Surg, 36,
1738-43.
VLUG, M. S., WIND, J., VAN DER ZAAG, E., UBBINK, D. T., CENSE, H. A. & BEMELMAN, W. A. 2009.
Systematic review of laparoscopic vs open colonic surgery within an enhanced recovery
programme. Colorectal Dis, 11, 335-43.
WALD, H. L., MA, A., BRATZLER, D. W. & KRAMER, A. M. 2008. Indwelling urinary catheter use in
the postoperative period: analysis of the national surgical infection prevention project data.
Arch Surg, 143, 551-7.

244
WALLENBORN, J., GELBRICH, G., BULST, D., BEHRENDS, K., WALLENBORN, H., ROHRBACH, A.,
KRAUSE, U., KUHNAST, T., WIEGEL, M. & OLTHOFF, D. 2006. Prevention of postoperative nausea
and vomiting by metoclopramide combined with dexamethasone: randomised double blind
multicentre trial. BMJ, 333, 324.
WALTER, C. J., COLLIN, J., DUMVILLE, J. C., DREW, P. J. & MONSON, J. R. 2009. Enhanced
recovery in colorectal resections: a systematic review and meta-analysis. Colorectal Dis, 11, 344-
53.
WANG, Z. G., WANG, Q., WANG, W. J. & QIN, H. L. 2010. Randomized clinical trial to compare
the effects of preoperative oral carbohydrate versus placebo on insulin resistance after
colorectal surgery. Br J Surg, 97, 317-27.
WARNER, M. A., WARNER, M. E. & WEBER, J. G. 1993. Clinical significance of pulmonary
aspiration during the perioperative period. Anesthesiology, 78, 56-62.
WATTERS, J. M., BESSEY, P. Q., DINARELLO, C. A., WOLFF, S. M. & WILMORE, D. W. 1986. Both
inflammatory and endocrine mediators stimulate host responses to sepsis. Arch Surg, 121, 179-
90.
WERNERMAN, J., VON DER DECKEN, A. & VINNARS, E. 1986. Protein synthesis in skeletal muscle
in relation to nitrogen balance after abdominal surgery: the effect of total parenteral nutrition.
JPEN J Parenter Enteral Nutr, 10, 578-82.
WHITEHOUSE, S. & RANDLE, P. J. 1973. Activation of pyruvate dehydrogenase in perfused rat
heart by dichloroacetate (Short Communication). Biochem J, 134, 651-3.
WIELAND, O. H. 1983. The mammalian pyruvate dehydrogenase complex: structure and
regulation. Rev Physiol Biochem Pharmacol, 96, 123-70.
WILLE-JORGENSEN, P., RASMUSSEN, M. S., ANDERSEN, B. R. & BORLY, L. 2001. Heparins and
mechanical methods for thromboprophylaxis in colorectal surgery. Cochrane Database Syst Rev,
CD001217.
WILMORE, D. W., GOODWIN, C. W., AULICK, L. H., POWANDA, M. C., MASON, A. D., JR. &
PRUITT, B. A., JR. 1980. Effect of injury and infection on visceral metabolism and circulation. Ann
Surg, 192, 491-504.
WILMORE, D. W., LONG, J. M., MASON, A. D., JR., SKREEN, R. W. & PRUITT, B. A., JR. 1974.
Catecholamines: mediator of the hypermetabolic response to thermal injury. Ann Surg, 180,
653-69.
WIND, J., POLLE, S. W., FUNG KON JIN, P. H., DEJONG, C. H., VON MEYENFELDT, M. F., UBBINK,
D. T., GOUMA, D. J., BEMELMAN, W. A., LAPAROSCOPY AND/OR FAST TRACK MULTIMODAL
MANAGEMENT VERSUS STANDARD CARE STUDY, G. & ENHANCED RECOVERY AFTER SURGERY,
G. 2006. Systematic review of enhanced recovery programmes in colonic surgery. Br J Surg, 93,
800-9.

245
WINDSOR, J. A. & HILL, G. L. 1988a. Protein depletion and surgical risk. Aust N Z J Surg, 58, 711-
5.
WINDSOR, J. A. & HILL, G. L. 1988b. Risk factors for postoperative pneumonia. The importance
of protein depletion. Ann Surg, 208, 209-14.
WITASP, A., NORDFORS, L., SCHALLING, M., NYGREN, J., LJUNGQVIST, O. & THORELL, A. 2009a.
Expression of inflammatory and insulin signaling genes in adipose tissue in response to elective
surgery. J Clin Endocrinol Metab, 95, 3460-9.
WITASP, A., NORDFORS, L., SCHALLING, M., NYGREN, J., LJUNGQVIST, O. & THORELL, A. 2009b.
Increased expression of inflammatory pathway genes in skeletal muscle during surgery. Clin
Nutr, 28, 291-8.
WOLFE, R. R., GOODENOUGH, R. D., BURKE, J. F. & WOLFE, M. H. 1983. Response of protein and
urea kinetics in burn patients to different levels of protein intake. Ann Surg, 197, 163-71.
WOLFE, R. R., JAHOOR, F. & HARTL, W. H. 1989. Protein and amino acid metabolism after injury.
Diabetes Metab Rev, 5, 149-64.
WOLFE, R. R., MILLER, H. I. & SPITZER, J. J. 1977. Glucose and lactate kinetics in burn shock. Am J
Physiol, 232, E415-8.
WOLFE, R. R. & PETERS, E. J. 1987. Lipolytic response to glucose infusion in human subjects. Am
J Physiol, 252, E218-23.
WOLFE, R. R., PETERS, E. J., KLEIN, S., HOLLAND, O. B., ROSENBLATT, J. & GARY, H., JR. 1987.
Effect of short-term fasting on lipolytic responsiveness in normal and obese human subjects. Am
J Physiol, 252, E189-96.
WRIGHT, P. D., HENDERSON, K. & JOHNSTON, I. D. 1974. Glucose utilization and insulin
secretion during surgery in man. Br J Surg, 61, 5-8.
YAGCI, G., CAN, M. F., OZTURK, E., DAG, B., OZGURTAS, T., COSAR, A. & TUFAN, T. 2008. Effects
of preoperative carbohydrate loading on glucose metabolism and gastric contents in patients
undergoing moderate surgery: a randomized, controlled trial. Nutrition, 24, 212-6.
YANG, Z., ZHENG, Q. & WANG, Z. 2008. Meta-analysis of the need for nasogastric or nasojejunal
decompression after gastrectomy for gastric cancer. Br J Surg, 95, 809-16.
YUI, R. & MATSUURA, E. T. 2006. Detection of deletions flanked by short direct repeats in
mitochondrial DNA of aging Drosophila. Mutat Res, 594, 155-61.
YUILL, K. A., RICHARDSON, R. A., DAVIDSON, H. I., GARDEN, O. J. & PARKS, R. W. 2005. The
administration of an oral carbohydrate-containing fluid prior to major elective upper-
gastrointestinal surgery preserves skeletal muscle mass postoperatively--a randomised clinical
trial. Clin Nutr, 24, 32-7.

246
ZEREY, M., BURNS, J. M., KERCHER, K. W., KUWADA, T. S. & HENIFORD, B. T. 2006. Minimally
invasive management of colon cancer. Surg Innov, 13, 5-15.
ZHANG, W. B. & JIANG, H. P. 2009. [Intestinal mucosal barrier dysfunction after abdominal
operation and its clinical significance]. Nan Fang Yi Ke Da Xue Xue Bao, 29, 246-9.
ZURLO, F., LARSON, K., BOGARDUS, C. & RAVUSSIN, E. 1990. Skeletal muscle metabolism is a
major determinant of resting energy expenditure. J Clin Invest, 86, 1423-7.

247
Chapter 8
Appendix

248
8.1 MAPR analysis (Mitochondrial ATP Production Rate)
This test allows the analysis mitochondrial ability to utilise different substrates in its
production of ATP.
Principle
The monitoring reagent contains firefly luciferase which emits light at a magnitude
proportional to the amount of ATP present. Measuring values over time allows data
to be generated for the respiration rates of mitochondria utilising different
substrates.
After a period of time ATP is dispensed into the cuvettes, as a result the
luminescence should show a marked jump in magnitude. This jump is due solely to
the known amount of ATP (in picomoles) dispensed. This result can be used as a
calibrator in order to work out the change in ATP/min from the change in mV/min.
(mV are the units of the machine).
Having worked out the rates of ATP production in each cuvette, this data can be
interpreted further by using citrate synthase activity (for example) as a marker for
mitochondrial quantity. (x picomoles ATP produced / x units of citrate synthase
activity, for example).
Preparation of mitochondria from muscle tissue – Differential Centrifugation
Using a minimum of 30mgs of tissue (100mgs max, 60-80 optimum).
All of the following should be performed on ice/ in a pre-cooled centrifuge (~4oC)
• Cut away any visible connective tissue with a clean, sharp blade and proceed to
finely dice the sample to make homogenisation easier. Weigh the sample and make a
note.
• Transfer the sample to a cooled glass homogenisation vessel and add (20 x
weight (mgs))µl of homogenisation buffer. (KCl 100mM, KH2PO4¬ 50mM, Tris 50mM,
MgCl2 5mM, EDTA 1mM, ATP 1.8mM)
• Homogenise with pestle homogeniser for 3 minutes on ice, and transfer crude
homogenate to a 2ml ‘muscle extraction tube’ (or equivalent).
• In a correctly balanced centrifuge, spin the homogenate for 3mins, 650G (RCF)
• Transfer supernatant to a clean tube and discard the cell debris.
• Spin the supernatant for 3mins @ 15000G

249
• A small brownish pellet should form which contains the desired mitochondria.
Remove and discard the supernatant and pipette half of the original buffer volume
(homogenisation buffer), and re-suspend the pellet via gentle agitation with the
pipette.
• Spin for 3mins @ 15000G. This is to wash the pellet.
• The pellet will reform. After discarding the supernatant, pipette 1/10th of the
original buffer volume (though no less than 100µl) of resuspension buffer (pH 7.2,
Human Serum Albumin (essentially FFA free) 0.5mg/ml, sucrose 240mM,
monopotassium phosphate 15mM, magenesium acetate tetrahydrate 2mM, EDTA
0.5mM)
The resulting mitochondrial suspension must NOT be frozen if MAPR analysis is
required – this must be performed immediately after the preparation. It can be
frozen at -20oC for later enzyme complex analysis.
Method
Having isolated mitochondria from tissue extracts the following cuvette compositions
should be made. Each cuvette tests a different substrate (or blank) and should be
made in duplicate for accuracy.
On the BioOrbit Luminometer, each cuvette:
800µl ATP monitoring reagent. (Lyophilized ATP monitoring reagent, (containing
firefly luciferase, D-luciferine 0.1g/L, L-luciferine 4mg/L, bovine serum albumin 1g/L,
and Na2P2O7 1µM) dissolved in pH 7, sucrose 0.19M, monopotassium phosphate
19mM, magnesium acetate tetrahydrate 2.5mM, EDTA 0.7mM)
140µl substrate (test each of the combinations below)
Glutamate 16.4mM/ Succinate 15mM
1. Palmitoyl-L-Carnitine 5µM/ Malate 1.5mM (with Human Serum Albumin 0.14mg/ml) 2. Pyruvate 50mM/ Malate 22mM 3. Succinate 2.5mM 4. Glutamate 32.75mM/ Malate 22mM
50µl of 12mM ADP; 10µl diluted (in resuspension solution) mitochondrial
suspension. (diluted 300X – overall dilution in cuvette: 30000X), Read the cuvettes in
the luminometer.

250
8.2 Muscle Acetyl CoA Analysis
Following PDC extraction protocol
GOT
[14C] aspartate + ketoglutarate [14C] oxaloacetate + glutamate
Citrate Synthase
[14C] oxaloacetate + acetyl coA [14C] citrate + coA
CoA is cleared by NEM, leaving detectable [14C] citrate
1. Prepare [14C]oxaloacetate – quantities here give 600µl (30 samples) Prepare Master Mix
20µl HEPES/KOH 0.5M pH 7.4 30µl EDTA 11mM pH 7.4 20µl α-ketoglutarate (FRESH – 4.5mg/ml) – on D52 shelf 100µl [14C] aspartate 40µM 10µl GOT 1:15 - 10µl stock/ 190µl H2O Gently vortex master mix, incubate at room temperature for 10 minutes Add 20µl PCA 1M, (stop transamination), vortex gently Incubate for 5 minutes at room temperature, and then leave on ice Add 40µl ice cold KOH 0.6M, vortex, leave on ice for 5 minutes Add 360µl EDTA 11mM pH 7.4, vortex gently

251
2. Formation of [14C]citrate Add 20µl of sample to each tube (for rat studies) Add 30µl NEM Add 20µl of [14C] oxaloacetate solution to each tube Add 10µl CS 1:10 (2mgs/ml) to each tube to start the reaction. Do this every ten seconds with a vortex in between Incubate for 20 minutes at room temperature
Make Transamination Mix – this removes un-reacted [14C] oxaloacetate by converting it back to [14C] aspartate
100µl GOT (6.5mg/ml)
900µl potassium glutamate 178mM
200µl H2O
Add 30µl transamination mix, to the tubes every ten seconds
Incubate for 20 minutes at room temperature
Make ion exchange resin (1 part resin H+/ 2.5 parts H2O) – this will be used to separate [14C] aspartate from [14C] citrate
Add 1ml of resin to each tube, whilst the resin is continuously vortexing
Vortex twice and leave to sediment
Remove 500µl of liquid into scintillation vial
Add 5ml of scintillation fluid and vortex
Measure β-radioactivity in scintillation counter

252
8.3 Glycogen Assay
A. Chemicals:
-Triethanolamine
-KOH
-Mg(CH3COO)2 x 4H2O
-EDTA Na2 x 2H2O
-HK (Bakers yeast) Sigma H-4502 200 U (lyophilized)
-Amyloglucosidase Boehringer 208 469 2 g
-Glu-6-P dehydrogenase Sigma G-5885 200 U (lyophilized)
B. Muscle solubilisation and glycogen hydrolysis:
-G5 0.1 M NaOH
-G6 0.1 M HCl
Check that 1 vol of G5 neutralises 1 vol of G6. If not, write down the neutralisation
ratio.
-G7 -0.2 M citric acid form 8.40 g
-0.2 M Na2HPO4 5.68 g
Up to 200 ml solution, pH 5.0 with NaOH 5M
-Amyloglucosidase 200 mg/ml G7
Mix G7 and G6 in a ratio of 1:3 if G6 neutralises G5 in a 1:1 ratio. If not, adjust the
ratio between G7 and G6 such as 4 volume of mix G7+G6 neutralises 1 volume of G5.
-Solubilise 0.5-2.0 mg powder in 100 l G5
2.01-3.0 mg powder in 120 l G5
3.01-4.0 mg powder in 160 l G5
and so on, by heating at 80 C for 10 min.

253
NB Make sure that the muscle is well solubilised in NaOH before heating at 80 C.
You do that by hard mixing. Muscle will become a greenish clear solution after
incubation.
-Spin briefly (2-3 s) the samples to condense down.
-Cool the samples to the room temperature.
-For every 80 l G5 add 320 l of neutralisation mix (80 l G6 and 240 l G7) and 10
l amyloglucosidase.
-Incubate at room temperature for 60 min.
-After 60 min incubation you can either, spin the samples and transfer the
supernatant to new test tubes. Equally, you can freeze the samples and spin them at
a later date.
C. Glucosyl units assay:
(2) Glu 6-P + NAD P-gluconolactone + NADH Glu-6-PDH
(1) Glu + ATP Glu 6-P + ADP HK
The increase in NADH is measures at 366 nm where =3.4 mol/cm2
G1 Reagent buffer:
Triethanolamine 100 mM 7 g/100 ml
KOH 40 mM 0.8 g/100 ml
Mg(CH3COO)2 x 4H2O 30 mM 2.4 g/100 ml
EDTA Na2 x 2H2O 1 mM 0.14 g/100 ml
Adjust to pH 8.2 with further KOH.
-Add 200 l water to each of HK and Glu 6 PDH vials. Mix 1:1. Keep the mix on ice.
-To 80 l G1 add 5 l ATP 45 mM (27.72 mg/ml), 5 l DTT 60 mM (9.36mg/ml), 10 l
NAD 30 mM (19.92 mg/ml) and 150 l H2O. Add 25-50 l sample. Mix.

254
Measure absorbance at 344 nm for 3-4 min (blank). Start the reaction by adding 2 l
of a mixture of Glu 6PDH and HK. Record the absorbance for 10 min.
Calculations:
mmol glucosyl units/kg dry muscle=( abs * extraction factor (L/Kg)*variation in
volume during the glucosyl units assay*dilution factor)/(sample volume*extinction
coefficient).

255
8.4 Lactate assay
I. Preparing the solution:
PCA – 0.5 MOL
EDTA 1 mMol
300 µl of this mixture in each eppendorf’s ( one for each sample)
Add 100µL of whole blood and shake vigorously. Put it on ice-bath as soon as possible
for 5 minutes.
Spin for 2 minutes (22000G)
Take 300µl of supernatant and transfer to new test tubes (on ice).
Add 50µl of 2.2 mol Bicarbonate
Gently Vortex and leave on ice for 5 minutes
Centrifuge again after 5 minutes (1 minute on high speed – 22000G)
Take supernatant and transfer to new eppendorf test tubes and store @ -80®C.
II. ANALYSIS
Have a minimum of 600µl final volume in the cuvette.
The assay is carried out at pH 10; at this pH beef heart LDH is more stable than the
skeletal enzyme (See Beohringer notes). 2-Amino-2methyl-1-propanol buffer with a pKa
of 9.9 is suitable buffer.
1. 2-Amino-2-methyl-1-propanol buffer 1M pH 10.0 = 8.9 g ( if liquid 9.5ml)/100 ml
solution. Set pH 10.0 with HCL 6M. Make aliquots (10mls). Store at : -20®C
2. Tris 20 mM pH 8.0 = 0.24 g/100 ml. Set pH with HCL 1M. Store at @ -20®C
3. Hydrazine 1M. Mix 5 ml of the 20 M stock solution to 100 ml solution. Store @ room
temperature.
4. NAD+ 100mM = 70mg/ml water. Make aliquots (50 µl). Store at @ -20®C

256
5. Lactate Dehydrogenase (LDH) stock (beef heart) Boehringer 106984 (50 mg/10ml or 5
mg/ml or 250 U/mg or 1250 U/ml). Dilute stock to 550 U/ml with Tris 20 mM containing
0.02% albumin = @2.3 times dilution. Store @ 4®C.
6. L-Lactate standard 500µM:
Disolve 6 mg Na lactate in deionised water then makeup to 100ml solution.
Make 100µl aliquots. Store at @ -20®C.
Lactate 500 µM stock 1 3 5 8 10 15 20
Lactate concentration (cuvette) µM
Reagent buffer 600 600 600 600 600 600 600
DI Water 19 17 15 12 10 5 0
7. Reagent buffer:
2-Amino-2,methyl-1-propanol buffer 1M pH 10.0 10.00 ml
Hydrazine 1M 5.00 ml
NAD+ 100 mM 0.05 ml
Add deionised water up to 100 ml solution.
To 600 µl reagent buffer add 10µl DI water and 10µl samples.
Mix well and after 5 minutes read the initial fluorescence (F1) @ Ex-340 nm/Em-460 nm
of each cuvette @ 30 second intervals.
Add 5µl of LDH beef heart 550 U/ml to each cuvette @ 30 second intervals.
Wait for @ 30 minutes. Keep the cuvettes at dark. Read F2 @ 30 second intervals.