vapor space characterization of waste tank 241 -c-104 .../67531/metadc... · pnl-10499 uc-606 r ec...
TRANSCRIPT
PNL-10499 UC-606
R EC E 1 v E D NOV b I995 O S T I
Vapor Space Characterization of Waste Tank 241 -C-104: Results from Samples Collected on 2/17/94 and 3/3/94 R. B. Lucke B. D. McVeety T. W. Clauss K. H. Pool J. S. Young
M. McCulloch M. W. Ligotke J. S. Fruchter S. C. Goheen
October 1995
Prepared for Westinghouse Hanford Company under a Related Services Agreement with the U.S. Department of Energy under Contract DE-AC06-76RLO 1830
Pacific Northwest Laboratory Operated for the U.S. Department of Energy by Battelle Memorial Institute

DISCLAIMER
Thls report was prepared as an account of work sponsored by an agency of the United States Government Neither the United States Government nor any agency thereof, nor Battclle Memorial Institute, nor any of their employees, makes m y warranty, erpreu or implied, or w u m e s any legal liability or rerporuibili~ for the accuracy. completeness. or urefulneu of my information, apparatus, product, or procem dhdosd, or npnment. that ita uae would not idkhge privately owned rights. Rtfertnce herein to any specific commercial product, pmcess. or service by trade name, trademark manufacturer, or otherwise does not necessarily constttute or imply its endorsement, recommendation, or favorfng by the United Statta Government or any agency thereof, or Battelle Memorial Institute. The views and opinions of authors qrcssed herein do not necessarily state or reflect those of the United States Gavemment or any agency thenof.
Printed 3x1 the United Stater of America Available to DOE m d DOE contractors from the
OBBce of SdenWc md Technical Information. PIO. Box 62.O.L Ridge, Tn 91831;
price8 avdlabk from (615) 576-8101.
Available to the public from the National Technical Information &Ria, US. Department of Commerce, 5285 Port Royal Rd., SprkrQfield. VA 22161
@ This document wae printed on ncq.cled paper.

Vapor Space Characterization of Waste Tank 241-C-104: Results from Samples Collected on 2/17/94 and 3/3/94
R. B. Lucke B. D. McVeety T. W. Clauss K. H. Pool J. S . Young M. McCulloch M. W. Ligotke J. S. Fruchter S. C. Goheen
October 1995
Prepared for Westinghouse Hanford Company under a Related Services Agreement with the U.S. Department of Energy Contract DE-AC06-76RLO 1830
PNL-10499 UC-606
Pacific Northwest Laboratory Richland, Washington 99352

DISCLAIMER
Portions of this document may be illegible electronic image products. images are produced from the best available original document.

Summary
This report describes inorganic and organic analyses results from samples obtained from the headspace of the Hanford waste storage Tank 241-C-104 (referred to as Tank C-104). The results described here were obtained to support safety and toxicological evaluations. A summary of the results for inorganic and organic analytes is listed in Summary Table 1. Detailed descriptions of the results appear in the text.
Quantitative results were obtained for the inorganic compounds ammonia (NH,), nitrogen oxide (NOJ, nitric oxide (NO), sulfur oxide (SOJ, and water (H,O). Organic compounds were also quantitatively determined. Occupational Safety and Health Administration (OSHA) versatile sampler (OVS) tubes were analyzed for tributyl phosphate. Twenty-four organic tentatively identified compounds (TICS) were observed above the detection limit of (ca.) 10 ppbv, but standards for most of these were not available at the time of analysis, and the reported concentrations are semiquantitative estimates. In addition, we looked for the 40 standard TO-14 analytes. Of these, two were observed above the 2-ppbv calibrated instrument detection limit. The 10 organic analytes with the highest estimated concentrations are listed in Summary Table 1. These 10 analytes account for approximately 88% of the total organic components in Tank C-104.
Summary Table 1. Summary Results of Inorganic and Organic Samples Collected from the Headspace of Tank C-104 on 2/7/94 and 3/3/94
Category
Inorganic
Organic
Analvte
Dodecane Tridecane Undecane
Tetradecane Decane Butane Butanal Propane 3-Heptanone
l-ButanOl
Vapor" Concentration
4 4 f O I 0.02
0.37 f 0.05 0.4 f 0.2 15 f 1
6.47 6.22 4.88 2.45 0.96 0.95 0.59 0.47 0.46 0.41
- units
mg/m3 mg/m3 mg/m3 mg/m3 mg/m3 mg/m3 mg/m3 mg/m3 mg/m3 mg/m3
(a) Vapor concentrations were determined using sample-volume data provided by Westinghouse Hanford Company and are based on averaged data. The inorganic samples were obtained and analyzed using procedures that were subsequently improved. The SO, values, in particular, may have been biased by unknown sampling or analytical errors.
iii

.

Acknowledgments
The authors gratefully acknowledge the support of other project staff at Pacific Northwest Laboratory who contributed to the successful completion of this sampling and analysis activity. Jeff Edwards served as the PNL single-point-of-contact and coordinated sample handling and communications with Westinghouse Hanford Company. Khris Olsen assisted in preparing the organic portion of this report. Bruce Lerner performed method development and validation work that supported the inorganic vapor sampling. Sally Slate and May-Lin Thomas analyzed inorganic samples, and Annalisa Krupsha and Gary Dennis prepared the solid-sorbent sample trains. Bonnie Lehrman, Rose Nipper, and Trina Burruss provided word processing support.
V


Abbreviations
CAS COC c v DIW emf EPA GCMS HP IC IL IS MDL NIST NPH OGI OSHA ovs PFA PNL PPbV PPmv PVF QA REL SCIC SIE STP TBP TEA TIC vss WHC
Chemical Abstracts Service chain of custody concentration by volume deionized water electromotive force U.S. Environmental Protection Agency gas chromatography/mass spectrometry Hewlett Packard ion chromatography impact level internal standard minimum detection limit National Institute for Standards and Technology normal paraffin hydrocarbon Oregon Graduate Institute Occupational Safety and Health Administration OSHA versatile sampler perfluoroalkox y Pacific Northwest Laboratory part per billion by volume part per million by volume polyurethane foam quality assurance recommended exposure limit suppressed-conductivity ion chromatography selective ion electrode standard temperature and pressure tributyl phosphate triethanolamine tentatively identified compound vapor sampling system Westinghouse Hanford Company
vii


Contents
Summary . . . . . . . . . . . . . . . . . . . . . . . . . . . . . . . . . . . . . . . . . . . . . . . . . . . . . . . . iii
Acknowledgments . . . . . . . . . . . . . . . . . . . . . . . . . . . . . . . . . . . . . . . . . . . . . . . . . . . . v
Abbreviations . . . . . . . . . . . . . . . . . . . . . . . . . . . . . . . . . . . . . . . . . . . . . . . . . . . . . vii
1 . 0 Introduction . . . . . . . . . . . . . . . . . . . . . . . . . . . . . . . . . . . . . . . . . . . . . . . . . . . . . 1
2.0InorganicTask . . . . . . . . . . . . . . . . . . . . . . . . . . . . . . . . . . . . . . . . . . . . . . . . . . . 9
2.2 Analytical Procedures . . . . . . . . . . . . . . . . . . . . . . . . . . . . . . . . . . . . . . . . . 10 11
2.4 Inorganic Sample Results . . . . . . . . . . . . . . . . . . . . . . . . . . . . . . . . . . . . . . . 12
2.1 Standard Sampling Methodology . . . . . . . . . . . . . . . . . . . . . . . . . . . . . . . . . . . 9
2.3 Quality Assurance/Quality Control . . . . . . . . . . . . . . . . . . . . . . . . . . . . . . . . .
3.0 Organic Task . . . . . . . . . . . . . . . . . . . . . . . . . . . . . . . . . . . . . . . . . . . . . . . . . . . 17 3.1 SUMMA" Canister Preparation . . . . . . . . . . . . . . . . . . . . . . . . . . . . . . . . . 17 3.2 Sample Analysis Method . . . . . . . . . . . . . . . . . . . . . . . . . . . . . . . . . . . . . 17 3.3 Quality Assurance/Quality Control . . . . . . . . . . . . . . . . . . . . . . . . . . . . . . . 17 3.4 Analysis Results . . . . . . . . . . . . . . . . . . . . . . . . . . . . . . . . . . . . . . . . . . . 19
4.0 Conclusions . . . . . . . . . . . . . . . . . . . . . . . . . . . . . . . . . . . . . . . . . . . . . . . . . . . . 27
5.0 References . . . . . . . . . . . . . . . . . . . . . . . . . . . . . . . . . . . . . . . . . . . . . . . . . . . . . . 27
6.0 Further Reading . . . . : . . . . . . . . . . . . . . . . . . . . . . . . . . . . . . . . . . . . . . . . . . . . 27
Distribution . . . . . . . . . . . . . . . . . . . . . . . . . . . . . . . . . . . . . . . . . . . . . . . . . . . . Dist . 1
ix

2.1 Analysis Procedures and Typical Detection Limits of Target Inorganic Analytes . . . . , . . 12
2.2 List of PNL Inorganic Samples, obtained from a Heated Tube Inserted into the Headspace of Tank C-104 ON 3/3/94 . . . . . . . . . . . . . . . . . . . . . . . . . . . . . . . . . 13
2.3 Inorganic Vapor Sample Results obtained from a Heated Tube Inserted into the Headspace of Tank C-104 on 3/3/94 . . . . . . . . . . . . . . . . . . . . . . . . . . . . . . . . . . 14
3.1 TO-14 Analysis Results for Samples Collected from the Headspace of Tank C-104 in SUMMA" Canisters on 3/3/94 . . . . . . . . . . . . . . . . . . . 21
3.2 Tentatively Identified Compounds in SUMMA" Canister Samples Collected from Hanford Waste Tank C-104 on 3/3/94 . . . . . . . . . . . . . . . . . . . . . . . 23
3.3
1.1
3.1
Waste Tank C-104 OVS Sample Analyte Results (pg/sample) . . . . . . . . . . . . . . . . . . 24
Figures
Chain-of-Custody for Tank C-104 . . . . . . . . . . . . . . . . . . . . . . . . . . . . . . . . . . . . . . 3
Total Ion Chromatogram of Hanford Waste Tank C-104 SUMMA" Canister Sample S4004-06-C03 Collected on 3/3/94 . . . . . . . . . . . . . . . . . . . . . . . . 25
X
1 .O Introduction
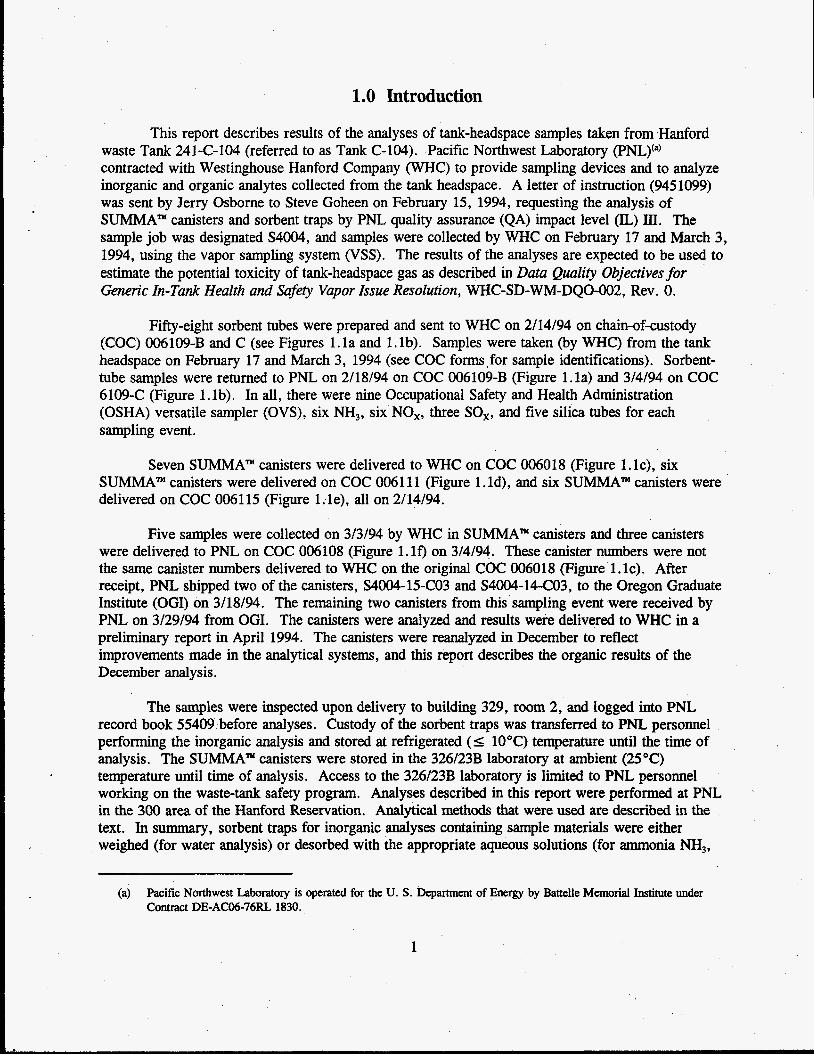
This report describes results of the analyses of tank-headspace samples taken from Hanford waste Tank 241-C-104 (referred to as Tank C-104). Pacific Northwest Laboratory (PNL)‘” contracted with Westinghouse Hanford Company (WHC) to provide sampling devices and to analyze inorganic and organic analytes collected from the tank headspace. A letter of instruction (9451099) was sent by Jerry Osborne to Steve Goheen on February 15, 1994, requesting the analysis of SUMMA” canisters and sorbent traps by PNL quality assurance (QA) impact level (IL) III. The sample job was designated S4004, and samples were collected by WHC on February 17 and March 3, 1994, using the vapor sampling system (VSS) . The results of the analyses are expected to be used to estimate the potential toxicity of tank-headspace gas as described in Data Quality Objectives for Generic In-Tank Health and Safety Vapor Issue Resolution, WHC-SD-WM-DQO-002, Rev. 0.
Fifty-eight sorbent tubes were prepared and sent to WHC on 2/14/94 on chain-of-custody (COC) 006109-B and C (see Figures l . l a and 1.lb). Samples were taken (by WHC) from the tank headspace on February 17 and March 3, 1994 (see COC forms,for sample identifications). Sorbent- tube samples were returned to PNL on 2/18/94 on COC 006109-B (Figure 1.la) and 3/4/94 on COC 6109-C (Figure 1.lb). In all, there were nine Occupational Safety and Health Administration (OSHA) versatile sampler (OVS), six NH,, six NO,, three SO,, and five silica tubes for each sampling event.
Seven SUMMA” canisters were delivered to WHC on COC 006018 (Figure l.lc), six SUMMA” canisters were delivered on COC 006111 (Figure l.ld), and six SUMMA” canisters were delivered on COC 006115 (Figure l.le), all on 2/14/94.
Five samples were collected on 3/3/94 by WHC in SUMMA” canisters and three canisters were delivered to PNL on COC 006108 (Figure 1. If) on 3/4/94. These canister numbers were not the same canister numbers delivered to WHC on the original COC 006018 (Figure 1.1~). After receipt, PNL shipped two of the canisters, S4004-15-C03 and S4004-14-C03, to the Oregon Graduate Institute (OGI) on 3/18/94. The remaining two canisters from this sampling event were received by PNL on 3/29/94 from OGI. The canisters were analyzed and results were delivered to WHC in a preliminary report in April 1994. The canisters were reanalyzed in December to reflect improvements made in the analytical systems, and this report describes the organic results of the December analysis.
The samples were inspected upon delivery to building 329, room 2, and logged into PNL, record book 55409 before analyses. Custody of the sorbent traps was transferred to PNL personnel performing the inorganic analysis and stored at refrigerated (I 10°C) temperature until the time of analysis. The SUMMA” canisters were stored in the 326/23B laboratory at ambient (25°C) temperature until time of analysis. Access to the 326/23B laboratory is limited to PNL personnel working on the waste-tank safety program. Analyses described in this report were performed at PNL in the 300 area of the Hanford Reservation. Analytical methods that were used are described in the text. In summary, sorbent traps for inorganic analyses containing sample materials were either weighed (for water analysis) or desorbed with the appropriate aqueous solutions (for ammonia NH,,
(a) Pacific Northwest Laboratory is operated for the U. S. Department of Energy by Battelle Memorial Institute under Contract DE-ACO6-76RL 1830.
1

nitrogen dioxide (NO,), or sulfur oxide (SO3 analyses. The aqueous extracts were analyzed either by selective electrode or by ion chromatography (IC). Organic analyses were performed using either cryogenic preconcentration (for SUMMA?, or desorption in CS2 (for OW) followed by gas chromatography/mass spectrometry (GUMS).
2

Westinghouse Hanford Company CHAIN OF CUSTODY PNL 006109 -8
custody FORII Initiator C.M. Jones / J.E. Darling C-W contact J. L. Huckaby Telephone (509) 373-3443 Project Desfgnstion/Sarrpling Locations 200 East Tank Farm: Collection Date
k c Chest No. Field Logbook lo. WHC-N-647-4 Bill of Lading/Airbilt No.
Tank C-104 Vapor Sample. SAF S4004, 241-C-104
Offsite Property No.
Method of Shipnent Government Truck S h i e to PffL Possible sample Hatards/Rrmarks No hazards detected a t time o f sampling.
Sanplc Identification S4004-19.817 SAP Reference 2 PNL NO, #1 PNL ID# S4004-20. B17 SAP Reference 2 PNL NO iYl PNL ID# d4004-21.817 SAP Reference 3 PNL OVS iY1 PNL ID# 44004-22.817 SAP Reference 3 PNL OVS #2 PNL ID# S4004-23.817 SAP Reference 4 PNL SO, 4 1 PNL ID4 S4004-24.817 SAP Reference 4 PNL SO, 41 PNL ID% S4004-25.817 SAP Reference 5A Sil ica Gel Sl S4004-27.817 ' S A P Reference 6 PNL NH, t1 PNL ID# S4004-28.817 SAP Reference 6 PNL NH, 41 PNL ID# S4004-29.817 SAP Reference 7A Sil ica Gel tY2 S4004-30. 817 SAP Reference 7B Sil ica Gel $3 S4004-39.817 SAP Reference 12 PNL NO, 32 PNL ID# S4004-40.817 SAP Reference 12 PNL NO, 42 PNL ID4 54004-41.817 SAP Reference 13 PNL NH, nY2 PNL ID# S4004-42.817 SAP Reference 13 PNL NH 82 PNL ID#
- 2 * / / ~ / 4 ~ 0S4004-43. 817 SAP Reference 14 PNL OV!i 93 PNL IDiY 3 w L S4004-44.617 SAP Reference 14 PNL SO, 42 PNL IDiY
54004-45.817 SAP Reference 15 Sil ica Gel iY4 S4004-46. B17 SAP Reference 15 Sil ica Gel S 5 44004-51 .817 SAP Reference -- PNL OVS Blank 11 PNL ID# *.S4004-52.817 SAP Reference -- PNL OVS Blank #2 PNL ID#
' ~ ' ~ / ~ ~ 44004-53. 817 SAP Reference -- PNL OVS Blank #3 PNL ID# lS4004-54.817 SAP Reference -- PNL OVS Surrogate #1 PNL ID# S4004-55.Bl7 SAP Reference -- PNL OVS Surrogate #2 PNL ID4 44004-56.817 SAP Reference -- PNL OVS Surrogate i43 PNL IO# S4004-57.817 SAP Reference -- PNL NH, iY3 PNL ID#
lw, [ 5ymy- yo 81 7 NH3 rvilav-5?.&/7 d Q A PJ I L/33 v- 4.d. 8 f 7 n / n J *2
[XI Field Transfer of Custody Chain of Possession ( S i g n and Prtnt Names)
Carmcnts:
Figure l.la Chain-of-Custody for Inorganic Samples and OVS Tubes
3

Westinghouse Hanford Company CHAIN OF CUSTODY PNL 006109 -C
~~~ ~
Cwtw Form Initiator con pa^ contact J. L. Huckaby Telephone (509) 373-3443 Project Designation/Salrpling Locations 200 East Tank Farm: Coliection Date 03-03-94
Ice Chest Mo. Field Logbook Mo. WHC-N-647-4
R.D. Mahon / J.E. Darling
Tank C-104 Vapor Sample. SAF S4004, 241-C-104
8111 of Leding/Airbill No.
Method of Shipnent Government Truck offsite Property No.
shipped to PNL Possible Samte Hazards/Remarks No hazards detected a t time Of SamDl i n g .
S c d e ldentificstion
S4004-19 .C03 54004-2O.CO3 S4004-21.CO3 S4004-22.CO3 S4004-23.CO3 S4004-24.CO3 54004-25.CO3 54004-27.CO3 S4004-28.CO3 S4004-29.CO3 54004-3O.CO3 S4004-39.CO3 54004-4O.CO3 S4004-41.CO3 S4004-42. C03 S4004-43.CO3 S4004-44.CO3 S4004-45.CO3 S4004-46.CO3 S4004-51.CO3 S4004-52.CO3 54004-53.CO3 S4004-54.CO3 S4004-55.CO3 54004-56.CO3 544 . 7 C03
54004 -WCO3 s4 &&c 03
)a 3-3-7.f
SAP Reference 2 SAP Reference 2 SAP Reference 3 SAP Reference 3 SAP Reference 4 SAP Reference 4 SAP Reference 5A SAP Reference 6 SAP Reference 6 SAP Reference 7A SAP Reference 78 SAP Reference 12 SAP Reference 12 SAP Reference 13 SAP Reference 13 SAP Reference 14 SAP Reference 14 SAP Reference 15 SAP Reference 15 SAP Reference -- SAP Reference - - SAP Reference -- SAP Reference - - SAP Reference - - SAP Reference i ~ . r ~ - l . ~ ~ SAP Reference k 3 0 SAP Reference 19 SAP Reference 19
PNL NO, nY1 PNL NO $1
PNL OVS #2
PNL SO, f l Si l ica Gel 41 PNL NH, $1 PNL FIH, t l Si l ica Gel f 2 Si l ica Gel 13
PNL NO, F2 PNL NO, t 2 PNL NHj 12
PNL SO, #2 Sil ica Gel 14 Sil ica Gel n"5 PNL OVS Blank 4 1 PNL OVS Blank #2 PNL OVS Blank %3 PNL OVS Surrogate 41 PNL OVS Surrogate 1 2 PNL OVS Surrogate iy3 PiYL NH, $3 PNL NO, n"3 PNL NO, t3
PNL ov5 f l
PNL so, t l
PNL PNL N? OV %
PNL ID# PNL ID# PNL ID# PNL ID# PNL ID# PNL ID4
PNL ID# PNL ID4 PNL ID4 PNL ID# PNL ID# PNL ID# PNL ID4 PNL ID# PNL ID#
PNL ID4 PNL ID% PNL ID: PNL ID# PNL ID% PNL I D #
PNL ID# PNL ID;
Y f
Figure l . lb Chain-of-Custody for Inorganic Samples and OVS Tubes
4
i I I - 7

West i nghouse Hanford Company CHAIN OF CUSTODY PNL 006108
~~ ~
custody Form Initiator C. M. Jones/ 3. E. Darling ccqmny Contact J. L. Huckaby Telephone (509) 373-3443
e. 3 Uroject DeS~gMtfon/SaI@iog Locations 200 East Tank Farm: Tank collection Date 02- - 9 4
241-C-104 vapor sample SAF S4004, 241-C-104 Ice Chest lo. Field logbook No. WHC-N-647-4 Bit1 of Ladlng/Airbi11 No. N/A Offsite Property NO. N/A nethod of ShIpwnt
shtpped to PNL Possible sslrpte Hnzards/Rnnsrks Unknown at t i n e o f sampl inq
Sample Identification S4004- 04 ,817 SAP Ref 11A PNL summa PNLB 07y
S4004- 05 .B17 SAP Ref 11B PNL summa PNlrY 056
S4004- 06 .B17 SAP Ref 22 PEIL summa PNL~Y 360 S4004- 07 .B17 SAP Ref - - - PNL surrogate PNL# 0 7 A
S4004- 0 8 .817 SAP Ref - - - PNL surrogate PNLIY 070 S4004- 09 .B17 SAP Ref - - - PNL surrogate PNLIY 067 S4004- 49 .a17 SAP R e f 18A PNL surrogate PNLiY $3-7
[ I Field Transfer of Custody Chain of Possession (51- and Print Names) e ,
Rellrrqufshed By I D A t 4 f Ime Received By Date Tim0
A L - c 5 L - I zl/y/cI y 16:30 i
I I I I I FiML Sanple Disposition
De tell I-: Disposal nethod: oisposcd by:
Figure l . lc Chain-of-Custody for
5
Organic Samples

Westinghouse Hartford Campany cut+ Form Initiator C. M. Jones/ J . E . Darling capsnycontect - J. t. Huckaby Project Designation/Samplfng Locations 200 East Tank Farm: Tank
ice Chest No. Field Logbook No. WHC-N-647-4 Bflt of LadIng/AIrblll NO. N/A offsite Property NO. N/A
Telephone! (509) 373-3443 Collection Date 02-16-94
‘ 241-C-105 vapor sample SAF S4005, 241-C-105
CHAIN OF CUSTODY PNL 006111
Method of Shipnent
s h i m to PNL Posrible S q t e Hatards/Remarks Unknown a t t i n e of sampl inq
Serrple Identification 5400.5- 04 .M6 SAP Ref 9 A PNL summa P N L f 073
S4005- 05 .316
S4005- 06 -316
S4005- 07 .316
S4005- 08 .816
54005- 09 .B16
SAP Ref
SAP Ref
SAP Ref
SAP Ref
SAP Ref
98 P N L summa
19 P N L summa
15A PNL surrogate PNL% OXY
- - - PNL surrogate PNLiY 3d-A - - - PNL siirrogate PFILIY oh$
r l Field Transfer of Custody Chain of Possession (Sign end Print Names)
Figure l.1d Chain-of-Custody for Organic Samples A-6000407 (12192) MF061
6

Westi nghouse Hanford Company C H A M OF CUSTODY PNL 006115
custody form Inftiator C. M. Jones/ J . E. Darling
rroiect DerignatiM/Seapting tocarions 200 East Tank Farm: Tank 241-C-106 vapor sample SAF S4006, 241-C-106 lco Chert no. Fietd Logbook No. WHC-ti-647-4 8111 o f Lsding/Airbill lo. N/A . offsite Property NO. N/A Wethod of Shlpoent
. ccqany Contacr J. L. Huckaby ~ e t c ~ o n s (509) 373-3443 Cottecrfon D a t a 02 -15 -94
shipped to PNL Possible S-te HazardslRmurrts Unknown a t t i n e o f samol ina
Sano[e Idenrif ication S4006- 04 .B15 SAP Ref 9A PNL suruna P H L i o&,C S1006- OS .E15 SAP Ref 93 PNL summa P H L ~
S3006- 06 -815 SAP Rei 19 PNL summa P N L l aSB
S1006- 07 .BlS SAP Ref 1SA PNL surrogate PNLf Odd
S I C O 6 - 08 .815 SP.P R e f - - - PEIL surrocztr PW 07f 54006- 09 .El15 SAP ReF - - - PEL surrogate PNL.? 03-9
f 1 F i e l d Trsrufcr of Custdy Chain of Possession (Sign and Print Wwr)
I I I I I FfnaL Sarrote Diswritlcn
Dlswss l Hechod: Dismscd by: Dsce/l ime:
Figure l.le Chain-of-Custody for Organic Samples
7

Westinghouse Hanf ord Company CHAIN OF CUSTODY PNL 006108
custody Form Initiator R.D. Mahon / J. E. Darling company contact J. L. Huckaby Telephone (509) 373-3443 Project DeSigMtfOWSacrpling Locations 200 East Tank Farm: Tank 241-C-104 vapor sample SAF S4004, 241-C-104 Ice Chest No. Field Logbook No. WHC-N-647-4 S i l t of Lading/AirbiLl KO. N/A Offsite Property NO. N/A Hcthod of Shipaenr Government Truck Shipped to PNL Possible Sample Hazatds/Remerks Unknown at time of sampling
collection Date 03-03-94
S m L e Identification
~~~ ~~ ~ ~~ _ _ _ _ ~ ~ ~~
[ X I Field Transfer of Custody Chain of Possession (Sign and Print Names)
I I I I I
Finat S-le Disposition
Disposal Hethod: Disposed by: Datc/T iar: Cunntnts:
A-6000-407 Figure 1.l.f Chain-of-Custody for Organic Samples
8

2.0 Inorganic Task
Solid sorbent traps were supplied to WHC for sampling the tank headspace using the VSS. Samples were returned to PNL for analysis. Analyses were performed to provide information on the tank-headspace concentration of the following analytes: NH,, NO,, nitric oxide (NO), SO,, and water (H20). It is important to note that both sampling and analytical procedures were developmental as Tank C-104 was one of the first four trial sample jobs. Differences in sample preparation, sampling, and sample handling, compared with subsequent jobs, varied from those used after April 1994 (Ligotke et al. 1994). Analytical accuracy was estimated based on procedures used. Sample preparation and analyses were performed following PNL QA IL III requirements.
2.1 Standard Sampling Methodology
Standard glass tubes containing sorbent materials to trap vapors of selected analytes of NH,, NO,, SO,, and H20 (SKC Inc., Eighty Four, Pennsylvania) were obtained, prepared, and submitted for use by WHC. The sorbent traps were selected based on their use by the OSHA to perform workplace monitoring and because of available procedures and verification results associated with that particular application. The typical sorbent traps used consisted of a glass tube containing a sorbent material specific to the compound of interest. In general, the tubes provided an indication of breakthrough. In the tubes, sorbent layers are generally held in packed layers separated by glass wool. The sorbent types, having glass-sealed ends, were received from the vendor.
The type and nominal quantity of sorbent material varied by application. Sorbent traps were selected for the tank sample job and included the following products. The NH, sorbent traps contained carbon beads impregnated with sulfuric acid; nominally, 500 mg were contained in the primary and 250 mg in the breakthrough sections. The NH, was chemisorbed as ammonium sulfate {(NHJ2S04). The NO2 traps contained a zeolite impregnated with triethanolamine (TEA), with 200 mg in the primary and 100 mg in the breakthrough sections. The NO2 was adsorbed and disproportionated to qui-molar quantities of nitrite ions (NO;) and nitrate ions (NOi). The SO, traps consisted of a proprietary mix of metal hydroxides coated on carbon beads, with 100 mg in the primary and 50 mg in the breakthrough sorbent sections.
Samples provided by PNL to trap inorganic compounds included samples and single-trap blanks. The samples of each type were prepared from same-lot batches, with the NO, sorbent traps having been stored previously in a freezer. After receipt of exposed and radiologically cleared samples from WHC and disassembly of the sorbent trains, samples were provided to the analytical laboratory at ambient temperature.
2.1.1 Concentration Calculations. The concentration of target compounds in the tank headspace was determined from sample results, assuming effective sample transport to the sorbent traps. Concentration, in parts per million by volume (ppmv), was determined by dividing the mass of the compound, in pmol, by the volume of the dried tank air sampled, in mol. The micromolar sample mass was determined by dividing the compound mass, in pg, by the molecular weight of the compound, in g/mol. The molar sample volume was determined, excluding water vapor, by dividing
9

the standard sample volume (at 0°C and 760 torr), in L, by 22.4 L/mol. For example, the concentration (C,) of a 3.00-L sample containing 75.0 pg of ammonia equals
= 32.9 ppmv 75.0 p/g ( 3.00 L )-I
17 g/mol 22.4 L/mol C, =
The calculational method produces concentration results that are slightly conservative (greater that actual) because the volume of water vapor in the sample stream is neglected. The volume of water vapor is not included in the measured sampled volume because of its removal in desiccant traps upstream of the mass flowmeters. However, the bias is generally expected to be small. For a tank- headspace temperature of 35"C, the magnitude of the bias would be about 1 to 6%, assuming tank- headspace relative humidities of 20 to loo%, respectively. The concentration of mass (determined gravimetrically) was also per dry-gas volume at standard conditions.
2.2 Analytical Procedures
The compounds of interest were trapped using solid sorbents and chemisorption adsorption of water vapor. Analytical results were based on extraction and analysis of selected ions. Analytical procedures used are specified in the text. All were compiled in PNL-MA-599.
2.2.1 placed into labeled 20-mL glass scintillation vials. Vials containing front, or primary, section sorbent material were treated with 10.0 mL of deionized water (DIW), and vials containing back-up-section sorbent material were treated with 5.0 mL of DIW. After extraction, the NH3 sorbent traps were analyzed using the selective ion electrode (SIE) procedure PNL-ALO-226 (Ammonia (Nitrogen) in Aqueous Samples}. Briefly, this method includes 1) preparing a lOOO-pg/mL (ppm) NH3 stock standard solution from dried reagent-grade NH,Cl and DIW on the day analyses are performed; 2) preparing 0.1, 0.5, 1.0, 10, and 100-ppm NH, working calibration standards by serial dilution of the freshly made stock standard; 3) generating an initial calibration curve from the measured emf signal versus NH, concentration data obtained for the set of working standards; 4) performing a calibration-verification check, using one of the midrange standards, after analyzing every four or five samples; 5 ) continuing this sequence until all samples of the batch have been measured, including duplicates and spiked samples; and 6) remeasuring the complete set of calibration standards (at the end of the session). Emf signal measurements obtained for samples are compared to those for . standards, either graphically or algebraically (using linear regression), to determine ammonia concentration in the samples.
Ammonia Analysis. The sorbent material from the ammonia-selective sorbent traps was
2.2.2 Nitrite Analysis. The sorbent traps for NO, and NO were desorbed in an aqueous TEA and n-butanol solution and analyzed by suppressed-conductivity ion chromatography (SCIC) for nitrite according to PNL-ALO-212, Rev. 1 (Determination of Znorganic Anions by Ion Chromutography) and modified to obviate interferences by concentrations of non-target analytes. Specifically, the modifications used were 1) eluent 1.44 mM Na.$03 + 1.8 mM NaHCO, at 2.0 ml/min; 2) one guard column (AG4A) and two separator columns (AS4A) in series instead of just one separator column; and 3) all standards, samples, and blanks injected into the IC sample loop through 0.45-pm syringe filters.
10

For the analysis, the sorbent materials were placed into labeled 20-mL glass scintillation vials. To each vial, 3.0 mL of desorbing solution (15 g TEA + 1 mL n-butanol in 1.0 L DIW) was added. Primary sorbent-tube sample materials and back-up (breakthrough) sorbent-tube materials were analyzed separately using identical procedures. Each analytical session was conducted as follows. Working nitrite standards (0, 0.1, 0.25, and 0.5 ppm) were prepared by diluting a stock nitrite standard with desorbing solution. An initial calibration curve was prepared from the instrument response (chromatographic peak height) versus nitrite standard concentration data for the set of working standards. A calibration verification check using one of the midrange standards was performed after the analysis of every six samples. If the instrument response indicated that sample nitrite concentration was outside the calibration range (20.5 ppm nitrite), the sample was diluted with desorbing solution and reanalyzed. After all samples of a batch were analyzed, the complete set of calibration standards was remeasured to verify consistent instrument response, and the analytical session was terminated.
Instrument responses (peak height) observed for samples were compared to those for standards to determine the nitrite concentration of the samples. Because NO, and NO converted to NO, were collected on the sorbent as equal quantities of nitrite and nitrate, and the analysis was specific for nitrite, the molar masses of NO, and NO were determined by doubling the analytically determined molar mass of nitrite.
2.2.3 1 % hydrogen peroxide and analyzed by SCIC for sulfale ion following the modified PNL-ALO-212 procedure (see Section 2.2.2).
Sulfur Oxide Analysis. The SO, samples were desorbed in 0.015 N sodium hydroxide plus
2.2.4 semi-micro mass balance after labeling and breaking the glass tube ends without plastic end caps. After receipt of exposed samples, the sorbent traps were again weighed to determine the change in mass. Records of the measurements were documented on sample-preparation data sheets. The mass concentration, generally roughly equal to the concentration of water, was determined by dividing in the combined change in mass from all traps in a sorbent train by the actual volume of gas sampled. Blanks and spiked blanks were included to provide information on uncertainty.
Mass (Water) Analysis. Sorbent traps used to make each sample train were weighed using a
2.3 Quality Assurance/ Quality Control
Analytical work was performed according to quality levels identified in the project QA plan and several PNL documents. The samples were analyzed following PNL QA IL m. The PNL documents include some or all of the following: PNL-MA-70 (Part 2), PNL-MA-599, PNL-ALO-212, PNL-ALO-226, PNL-ALO-271, and MCS-033. A summary of the analysis procedures and limits for the target inorganic compounds is provided in Table 2.1. From the table, it can be seen that the minimum detection limit (MDL) required to resolve the analyte at one-tenth of the recommended exposure limit (EL) for each of the target analytes is achieved using current procedures and with a vapor-sample volume of 3 L and a desorption-solution volume of 3 mL (10 mL for ammonia).
11
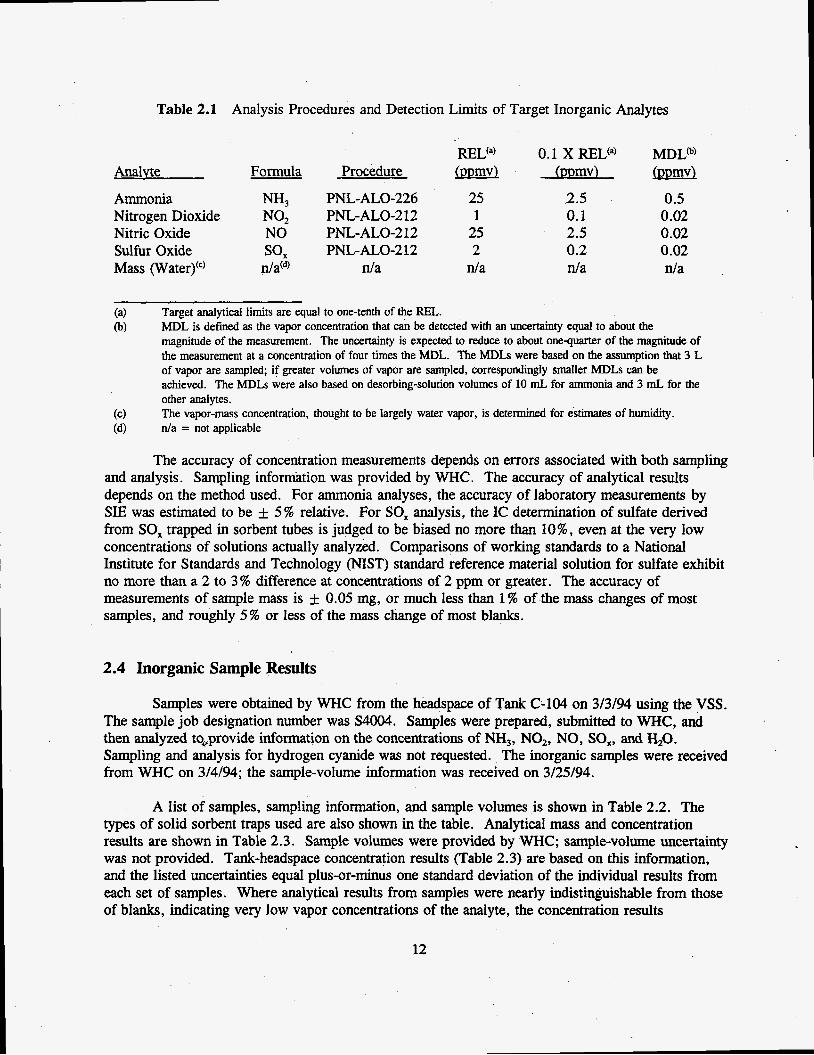
Table 2.1 Analysis Procedures and Detection Limits of Target Inorganic Analytes
Analvte Formula Procedure
Ammonia NH, PNL-ALO-226 25
Nitric Oxide NO PNL-ALO-2 12 25
Mass (Water)(‘) n/a(@ nla n/a
Nitrogen Dioxide NO, PNL-ALO-2 12 1
Sulfur Oxide SOX PNL-ALO-212 2
2.5 0.1 2.5 0.2 n/a
0.5 0.02 0.02 0.02 n/a
(a) (b)
Target analytical limits are equal to one-tenth of the REL. MDL is defined as the vapor concentration that can be detected with an uncertainty equal to about the magnitude of the measurement. The uncertainty is expected to reduce to about onequarter of the magnitude of the measurement at a concentration of four times the MDL. The MDLs were based on the assumption that 3 L of vapor are sampled; if greater volumes of vapor are sampled, correspondingly smaller MDLs can be- achieved. The MDLs were also based on desorbing-solution volumes of 10 mL for ammonia and 3 mL for the other analytes. The vapor-mass concentration, thought to be largely water vapor, is determined for estimates of humidity. ( 4
(4 n/a = not applicable
The accuracy of concentration measurements depends on errors associated with both sampling and analysis. Sampling information was provided by WHC. The accuracy of analytical results depends on the method used. For ammonia analyses, the accuracy of laboratory measurements by SIE was estimated to be & 5% relative. For SOx analysis, the IC determination of sulfate derived from SO, trapped in sorbent tubes is judged to be biased no more than lo%, even at the very low concentrations of solutions actually analyzed. Comparisons of working standards to a National Institute for Standards and Technology (NIST) standard reference material solution for sulfate exhibit no more than a 2 to 3% difference at concentrations of 2 ppm or greater. The accuracy of measurements of sample mass is rt 0.05 mg, or much less than 1% of the mass changes of most samples, and roughly 5% or less of the mass change of most blanks.
2.4 Inorganic Sample Results
Samples were obtained by WHC from the headspace of Tank C-104 on 3/3/94 using the VSS. The sample job designation number was S4004. Samples were prepared, submitted to WHC, and then analyzed to,provide information on the concentrations of NH,, NO,, NO, SO,, and H,O. Sampling and analysis for hydrogen cyanide was not requested. The inorganic samples were received from WHC on 3/4/94; the sample-volume information was received on 3/25/94.
A list of samples, sampling information, and sample volumes is shown in Table 2.2. The types of solid sorbent traps used are also shown in the table. Analytical mass and concentration results are shown in Table 2.3. Sample volumes were provided by WHC; sample-volume uncertainty was not provided. Tank-headspace concentration results (Table 2.3) are based on this information, and the listed uncertainties equal plus-or-minus one standard deviation of the individual results from each set of samples. Where analytical results from samples were nearly indistinguishable from those of blanks, indicating very low vapor concentrations of the analyte, the concentration results
12

Table 2.2
h p l e Number
Samples:
s4004- 27-C03 s4004- 28-C03 s4004- 414203 sQoo4- 42-C03 S4004- 57-C03 S4004- 584203
s4004- 19-C03 s4004- 20-C03 s4004- 39-CO3 s4004- -03 S4004- 59-C03 S4004- 6O-CO3
S4004- 23-C03 s4004- 25-C03 S4004- 44-C03
S4004- 25-C03 S4004- 29-C03 S4004- 30-C03. S4004- 45-CO3 s4004- 46-CO3
Controls:
s4004- 50x03 W 5 - 52-B16 W 5 - 53-B16
List of PNL Inorganic Samples, Controls, and Gravimetric Results Obtained From a Heated Tube Inserted into the Headspace of Tank C-104 on 3/3/94
Sorbent Tvpe
NO, Trap NO, Trap NO, Trap NO, Trap NO, Trap NO, Trap
SO, Trap SOx Trap SO, Trap
H,O Trap H,O Trap H,O Trap H,O Trap H20 Trap
NH, Blank/Spare NO, Blank (C-105) HZO Blank (C-105)
Sample Port and Volume Information(a)
Sample Port -
1 10 3 10 3 10
1 10 1 10 1 10
3 10 10
3 3 10 3 10
dam) d a d a
Flow Rate fmMnin)
200 200 200 200 200 200
200 200 200 200 200 200
200 200 200
200 200 200 200 200
d a d a d a
Duration (mid
15.0 15.0 15.0 15.0 15.0 15.0
15.0 15.0 15.0 15.0 15.0 15.0
15.0 15.0 15.0
15.0 15.0 15.0 15.0 15.0
d a d a d a
Volume a
3.00 3.00 3 .00 3 .00 3 .00 3 .00
3.00 3.00 3.00 3.00 3.00 3 .00
3.00 3.00 3.00
3 .oo 3.00 3.00 3 .00 3 .OO
d a d a d a
(a)
(b) d a = not applicable.
Sampling information and dry-gas sample volumes, corrected to 0°C and 760 torr, were provided by WHC. Uncertainty values were not provided with sample-volume results.
(Table 2.3) are listed as “less than or equal to,” a probable maximum value determined by subtracting the blank result from the sample result. Sample results were not corrected for the percentage recoveries of spiked samples.
2.4.1 Ammonia Results. The concentration of NH, was 44 f 0 ppmv, based on all six samples. The NH3 quantity found in each exposed sorbent trap was 5.9 pmol in the front sorbent section and 10.1 pmol in the back section (indicating no breakthrough). Blank corrections, S 0.06 -01 in front and 10.03 pmol in back sorbent sections, were less than 1% of collected quantities and were neglected. Although spiked blanks were not tested, the percentage recoveries of three sets of blanks spiked with 12.2, 22.3, and 46.4 pmol of NH, were 101 f 4%, 109 f 2%, and 104 f 1 % , respectively, during related sample jobs (Clauss et al. 1994; Ligotke et al. 1994). No sample
13
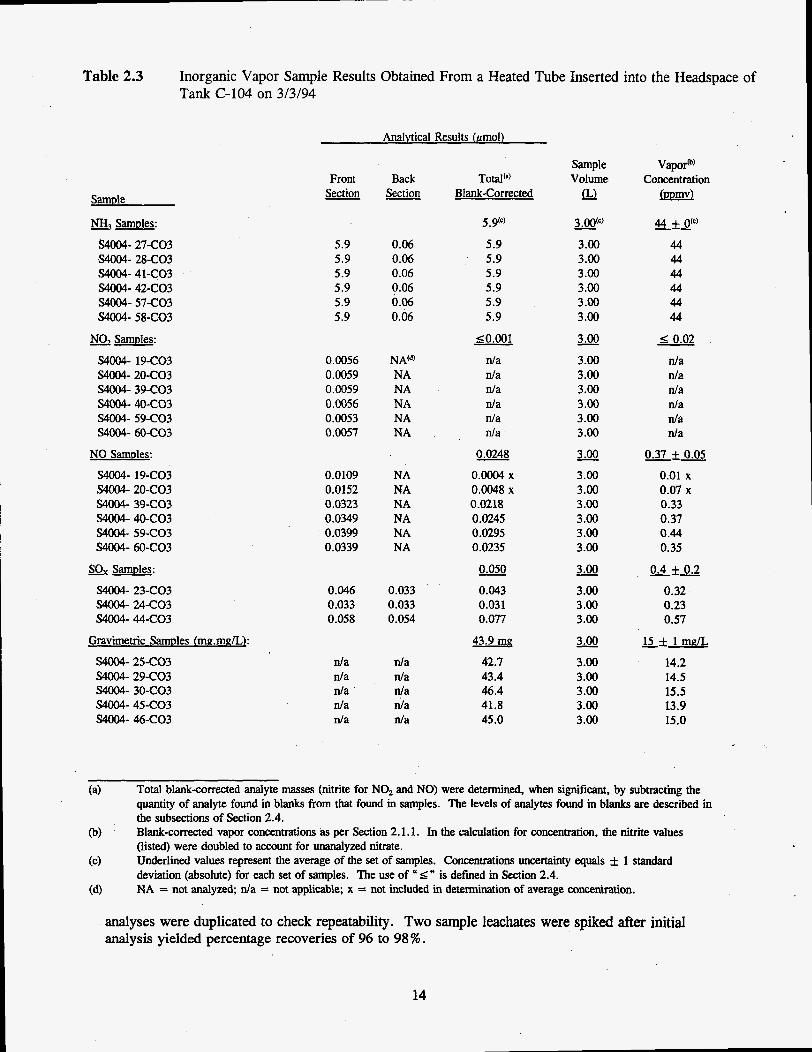
Table 2.3 Inorganic Vapor Sample Results Obtained From a Heated Tube Inserted into the Headspace of Tank C-104 on 3/3/94
Analvtical Results hmol)
Sample
NH, SamDles:
S4004- 27-C03 S4004- 28-C03 S4004- 41-C03 S4004- 42-C03 s4004- 57-C03 S4004- 58-C03
NO, SamDles:
S4004- 19-C03 S4004- 204203 s4004- 39-C03 s4004- 40-C03 S4004- 59-C03 s4004- 60-C03
NO SamDles:
S4004- 19-C03 S4004- 20-C03 S4004- 39-C03 s4004- 4O-CO3 S4NM- 59-C03 S4004- 60-C03
SO, Samples:
S4004- 23-CO3 S4004- 24-C03 S4004- 44-C03
Gravimetric Samples (mg.mg/L):
54004- 25-C03 s4004- 29-C03 S4004- 30-C03 s4004- 45-C03 S4004- 46-C03
Front Back Section Section
5.9 0.06 5.9 0.06 5.9 0.06 5.9 0.06 5.9 0.06 5.9 0.06
0.0056 0.0059 0.0059 0.0056 0.0053 0.0057
Total(a) Blank-Corrected
5.9(C)
5.9 5.9 5.9 5.9 5.9 5.9
10.001
NA") n/a NA n/a NA n/a NA n/a NA n/a NA n/a
0.0109 NA 0.0152 NA 0.0323 NA 0.0349 NA 0.0399 NA 0.0339 NA
0.046 0.033 0.058
0.033 0.033 0.054
d a nla d a n/a d a n/a n/a d a n/a n/a
0.0248
o.Oo04 x 0.0048 x 0.0218 0.0245 0.0295 0.0235
__. 0.050
0.043 0.031 0.077
43.9 mg
42.7 43.4 46.4 41.8 45.0
Sample Volume
- 3.00"'
3.00 3.00 3 .00 3.00 3 .00 3 .oo - 3.00
3.00 3.00 3.00 3.00 3.00 3 .00
- 3 .OO
3.00 3.00 3.00 3.00 3 .00 3.00
- 3.00
3 .00 3 .OO 3.00
- 3.00
3.00 3 .00 3 .oo 3.00 3.00
Vapor@) Concentration
fmE9
44 + 0"' 44 44 44 44 44 44
I: 0.02
d a n/a n/a n/a n/a n/a
0.37i0.05 0.01 x 0.07 x 0.33 0.37 0.44 0.35
- 0.4 f0.2 0.32 0.23 0.57
- 15 f 1 mgK
14.2 14.5 15.5 13.9 15.0
(a) Total blankarrected analyte masses (nitrite for NO2 and NO) were determined, when significant, by subtracting the quantity of analyte found in blanks from that found in samples. The levels of analytes found in blanks are described in the subsections of Section 2.4. Blankarrected vapor concentrations as per Section 2.1.1. In the calculation for concentration, the nitrite values (listed) were doubled to account for unanalyzed nitrate. Underlined values represent the average of the set of samples. Concentrations uncertainty equals f 1 standard deviation (absolute) for each set of samples. The use of <'' is defined in Section 2.4. NA = not analyzed; d a = not applicable; x = not included in determination of average concentration.
@)
(4
(d)
analyses were duplicated to check repeatability. Two sample leachates were spiked after initial analysis yielded percentage recoveries of 96 to 98%.
14

2.4.2 Nitrogen Oxide Results. Measurements of NO, and NO were made using six NO, sorbent- trap trains (the NO, trains consisted of NO, trap, oxidizer, NO, trap).
The concentrations of NO, and NO were I 0.02 and 0.37 f 0.05 ppmv, respectively. Blank-corrected NO; quantities in the sorbent traps averaged I 0.001 pmol (NO, samples) and 0.023 pmol (NO samples). One nitre blank was analyzed and used to correct data: 0.0053 pmol for NO, and 0.0104 pmol for NO. Although spiked blanks were not tested, blanks spiked with 0.0064, 0.047, 0.11, and 0.74 pmol NO, during related sample jobs yielded percentage recoveries of 153 f 14%, 103 f 4%, 106 f 8%, and 111 f 7%, respectively (Clauss et al. 1994; Ligotke et al. 1994). No samples were reanalyzed to check repeatability. No sample leachates were spiked after initial analysis with quantities of NO, to test analytical percentage recoveries.
2.4.3 Sulfur orrides Results. The result of three sorbent traps for SO, indicated a concentration of 0.4 f 0.2 ppmv. This result was based on an average blank-corrected level of 0.050 pmol SO, in the samples. Because the quantity of SO, present in both front and back sections was similar, it is possible that an unresolved sampling or analytical problem affected these results. Such an effect would likely bias the results high (indicating a greater concentration than actually exists in the headspace).
2.4.4 Gravimetric Results. The mass concentration of material collected in the sorbent-trap trains, believed to be primarily water vapor, was 15 f 1 mg/L. The result was based on an average mass gain of 44 mg from all five silica-gel sorbent traps.
15

3.0 Organic Task
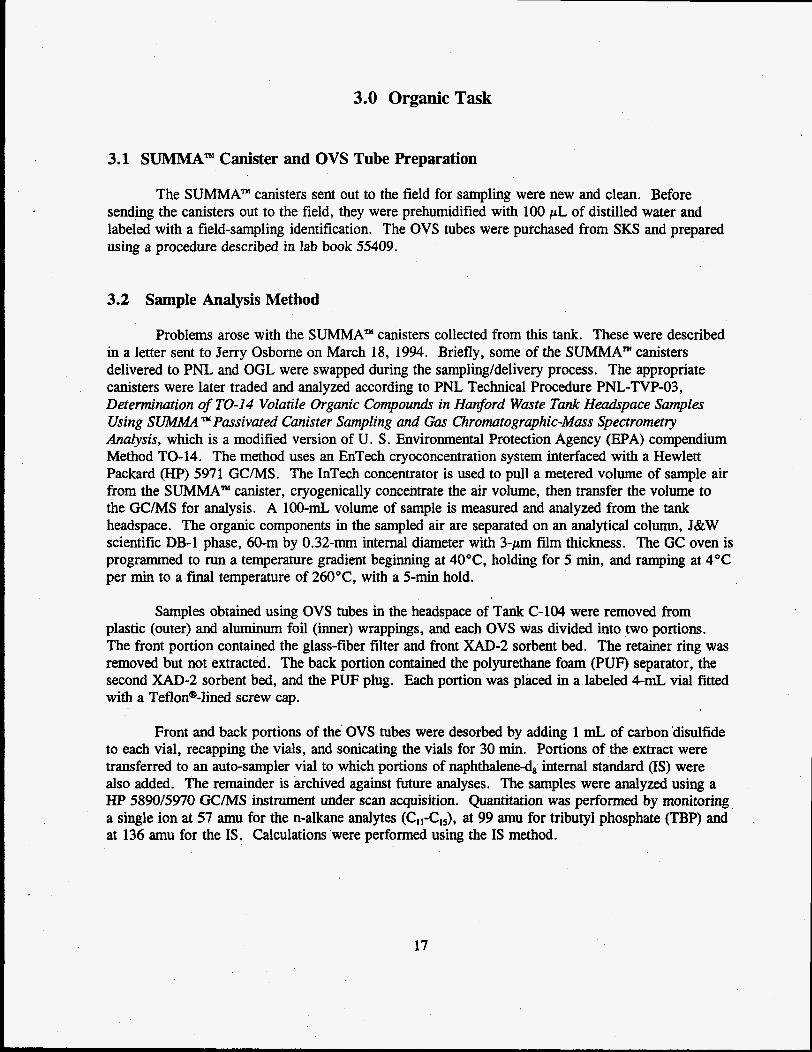
3.1 SUMMA" Canister and OVS Tube Preparation
The SUMMA" canisters sent out to the field for sampling were new and clean. Before sending the canisters out to the field, they were prehumidified with 100 pL of distilled water and labeled with a field-sampling identification. The OVS tubes were purchased from SKS and prepared using a procedure described in lab book 55409.
3.2 Sample Analysis Method
Problems arose with the SUMMA" canisters collected from this tank. These were described in a letter sent to Jerry Osborne on March 18, 1994. Briefly, some of the SUMMA" canisters delivered to PNL and OGL were swapped during the sampling/delivery process. The appropriate canisters were later traded and analyzed according to PNL Technical Procedure PNL-TVP-03, Determination of TO-14 Volatile Organic Compounds in Hanfod Waste Tank Heaakpace Samples Using SUMMA Passivated Canister Sampling and Gas Chromutographic-Mass Spectrometry Analysis, which is a modified version of U. S. Environmental Protection Agency (EPA) compendium Method TO-14. The method uses an EnTech cryoconcentration system interfaced with a Hewlett Packard (HP) 5971 GC/MS. The InTech concentrator is used to pull a metered volume of sample air from the SUMMA" canister, cryogenically concentrate the air volume, then transfer the volume to the G C N S for analysis. A 100-mL volume of sample is measured and analyzed from the tank headspace. The organic components in the sampled air are separated on an analytical column, J&W scientific DB-1 phase, 60-m by 0.32-mm internal diameter with 3-lm film thickness. The GC oven is programmed to run a temperature gradient beginning at 40"C, holding for 5 min, and ramping at 4°C per min to a final temperature of 260"C, with a 5-min hold.
Samples obtained using OVS tubes in the headspace of Tank C-104 were removed from plastic (outer) and aluminum foil (inner) wrappings, and each OVS was divided into two portions. The front portion contained the glass-fiber filter and front XAD-2 sorbent bed. The retainer ring was removed but not extracted. The back portion contained the polyurethane foam (PUF) separator, the second XAD-2 sorbent bed, and the PUF plug. Each portion was placed in a labeled 4-mL vial fitted with a TeflonWned screw cap.
Front and back portions of the OVS tubes were desorbed by adding 1 mL of carbon disulfide to each vial, recapping the vials, and sonicating the vials for 30 min. Portions of the extract were transferred to an auto-sampler vial to which portions of naphthalened, internal standard (IS) were also added. The remainder is archived against future analyses. The samples were analyzed using a HP 5890/5970 G C N S instrument under scan acquisition. Quantitation was performed by monitoring a single ion at 57 amu for the n-alkane analytes (C,1-C15), at 99 amu for tributyl phosphate (TBP) and at 136 amu for the IS. Calculations were performed using the IS method.
17

3.3 Quality Assurance/Quality Control
Before the SUMMA” tank samples were analyzed, a diagnostic check was performed on the GUMS instrument by running an instrument “quick tune,” as described in PNL-TVP-03. Upon satisfactory completion of the instrument diagnostic check, a blank volume of purified nitrogen was analyzed to check the cleanliness of the system. The instrument was then calibrated over six data points ranging from 2 ppbv to 100 ppbv, using a standard gas mixture containing 40 volatile organic compounds listed in EPA compendium Method TO-14. A gas mixture containing bromochloromethane, 1,4-diflurobenzene, and chlorobenzene-d, was used as an IS for all blank, calibration standard, and sample analyses. Analyte response from sample components, ISs, and standards were obtained from the extracted ion plot from their selected mass ion. The calibration curve was generated by calculating the relative response ratios of the IS to calibration standard responses and plotting the ratios against the ratio of the calibration-standard concentration (in ppbv) to the IS concentration. A least-squares linear-regression routine was applied to the data set to generate the best-fit line for each compound. The equation for that line was then used to quantify the TO-14 compounds found in the tank samples.
3.3.1 Quantitation of TO-14 Results. The quantitative-analysis results for the TO-14 volatile organic compounds were calculated directly from the calibration curve generated using the IS method described above and in PNL-TVP-03. The conversion from ppbv to mg/m3 assumes standard temperature and pressure (STP) conditions of 760 torr and 273 K and was calculated directly from the following equation:
3- @pbv/lOOO) x g mol wt of compound(a) mg/m - 22.4 L/mole
3.3.2 Identification and Quantitation of Tentatively Identifed Compounds. The tentatively identified compounds (TICS) are determined by mass-spectral interpretation and comparison of the spectra with the EPA/NIST/WILEY Library, which is a part of the HP 5971 instrument operating system. Chromatographic peaks with an area count greater than, or equal to, one half of the total area count of the chlorobenzene-d, IS peak at the 20-ppbv calibration level are tentatively identified and quantitatively estimated. This standard was chosen to determine the integration cutoff as it is in the middle of the chromatographic range and not in a region typically affected by coelution of other compounds. The quality of the mass-spectral searches was then reviewed by the principal investigators before the identification was assigned to each chromatographic peak.
The concentration of each TIC was estimated using a relative response factor calculated using a corrected total peak area for the IS chlorobenzene-&. Specifically, the total integrated area for the chlorobenzened, peak had to be corrected for possible coeluting compounds before calculating the response factor. The corrected total peak area for the IS was calculated by multiplying the IS quantitation ion by a correction factor based on the ratio of the total
18

integrated peak area to the quantitation ion as measured in blank runs. The corrected peak area was then used to calculate a response factor using the IS concentration in mg/m3:
IS conc. (mg/m3) IS peak area
Response Factor =
The calculated response factor was then multiplied by the TIC peak area to give an estimated concentration for that compound. For butane, the total peak area was multiplied by the response factor for chlorobenzened, to give an estimated concentration of 0.59 mg/m3. ISs bromochloromethane and difluorobenzene were not used to quantitate the TICs because coeluting compounds appeared to have greatly altered the signal of the quantitation ions €or those two ISs.
The ppbv concentrations are calculated from mg/m3 and the molecular weight of the analyte.
TIC (mg/m3) x 22.4 L/mole x lo00 TIC g mol wt(9
TIC in ppbv = (3.3)
The IS level added to all blank, standard, and sample injections was 18.3 ppbv for bromochloromethane, 20.3 ppbv for 1,4-difluorobenzene, and 18.2 ppbv for chlorobenzene-&. The IS concentrations were converted from ppbv to mg/m3 at STP using a molecular weight of 129.39 (g/mol) for bromochloromethane, 114.09 for 1,4-fifluorobenzene, and 117.6 for chlorobenzene+
3.4 Analysis Results
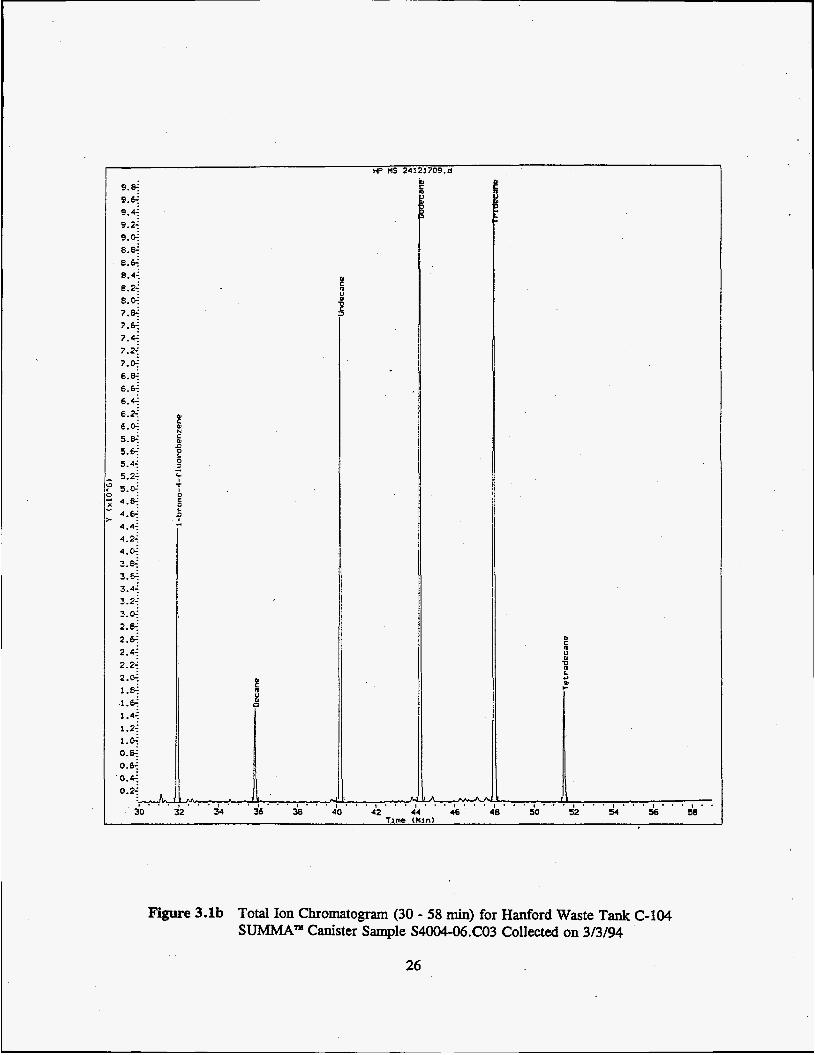
The results from the SUMMA" GCMS analysis of the tank-headspace samples are presented in Tables 3.1 and 3.2. A representative total ion chromatogram showing the identity of major constituents is given in Figure 3.1.
Table 3.1 lists the quantitative results for compounds listed in Method TO-14. The levels of TO-14 analytes observed in the sample collected from Tank C-104 were significantly low, close to the quantitation limit (2 ppb).
Table 3.2 lists the semi-quantitative results for the TICs observed in the samples. Twenty- four compounds were observed above the instrumental detection limit, a total averageconcentration of 26.93 mg/m3. The normal paraffin hydrocarbons (NPHs), defined as n-alkanes from C,, to Cis, present were undecane, dodecane, tridecane, and tetradecane, which accounted for 69% of the TIC compounds. A high concentration of l-butanol was also present.
Table 3.3 lists OVS sample analyte results for all OVS samples collected. The results are expressed as micrograms of analyte per liter of tank headspace. These results have been corrected for experimentally determined adsorption of the OVS for IWH. All of the mass reported for the samples was observed in the front portions of the OVS. Analysis of the back portions of the OVS indicated that no breakthrough occurred during sampling. Results of all trip blanks, field, and laboratory surrogates are also included. A comparison of OVS field and laboratory surrogate-analysis results
(a) Nominal molecular weight.
19

show no appreciable variations between analytical and expected (spiked) values.
No measurable tributyl phosphate (TBP) was seen on the collected OVS samples. The detection limit for these 4 min samples is estimated to be less than 50 pg per collected sample. Tributyl phosphate was not spiked on to the field surrogates. No other compounds were evaluated from the OVS tubes.
20

Table 3.1 TO-14 Analysis for Samples fromlhe Headspace of Tank C-104 from SUMMATM Canister Samples Collected on 3/3/94.
TO-14 Analvte Dichlordffluoromethane (FREON-12) Methyl Chloride (Chloromethane) 1,2-Dichloro-l,1,2,2,-Tetrafluoroethane (FREON-1 14) Chloraethene (Vinyl Chloride) Methyl Bromide promomethane) Ethyl Chloride Trichlorofluoromethane W O N - 1 1) 1,l-Dichloroethene (1,l-Dichloroethylene) Dichloromethane (Methylene Chloride) 1,1,2-Trichloro-1,2,2-Trifluoroethane W O N - 1 13) 1,l-Dichloroethane cis- 1,2-Dichloroethene (cis-l,2-Dichloroethylene) Trichloromethane (Chloroform) cis 1,2-Dichloroethane E 1, 1,l-Trichloraethane Benzene Carbon Tetrachloride 1,2-Dichloropropane Trichloroethylene cis 1,3-Dichloropropene trans 1,3-Dichloropropene 1,l ,2-Trichloraethane Methyl Benzene (Toluene) 1,2-Dibromoethane Tetrachlomthene- (Perchloroethylene) Chlorobenzene Ethylbenzene m-Xylene (1,3-Dimethylben~ene)(~
Styrene 1,1,2,2-Tetrachloroethane +Xylene (1,2-Dimethylbemne) 1,3 ,J-Trirnethylben~ene 1,2,4-Trirnethylbemne Chloromethylbenzene, alpha (Benzyl Chloride) m-Dichlorobenzene (1,3-Dichlorobenzene)
p-Xylene (l,4-Dimethylbeme)(4
CAS No. 75-7 1-8 74-87-3 76-14-2
74-83-9 75-00-3 75-69-4 75-35-4 75-09-2 76-13-1 75-34-3
156-59-2 67-66-3
107-06-2 71-55-6 71-43-2 56-23-5 78-87-5 79-01-6 61-01-5 61-02-6 79-00-5
108-88-3 106-93-4 127-18-4 108-90-7 100-41-4 108-38-3 106-42-3 100-42-5 79-34-5 95-47-6
108-67-8 95-63-6
100-44-7 541-73-1
75-01-4
Mol Wt 120 50 170 64 94 62 136 96 84 186 98 96 118 98 132 78 152 112 130 110 110 132 92 186 164 112 106 106 106 104 166 106 120 120 126 146
S4004-04.CO3'") PNL, 071" Concentration Q.?.Xb3)
0.009 e 0.01 e 0.02
0.01 e 0.01 e 0.01
0.08 e 0.01 e 0.01 e 0.02 e 0.01 e 0.01 < 0.01 < 0.01 e 0;01 e 0.01 e 0.01 e 0.01
0.01 e 0.01 e 0.01 e 0.01
0.03 e 0.02 < 0.02 < 0.01 e 0.01 e 0.01
e 0.01 e 0.02 e 0.01 < 0.01 e 0.01 < 0.01 < 0.01
0 1.61 2.21 e 2 e 2 e2 < 2
12.65 e 2 e 2 e2 e2 e2 e2 e2 e 2 e2 e 2 e 2 e 2 e 2 e 2 e 2 6.37 e 2 e .2 e2 e 2 e 2
e 2 e2 e2 e 2 e2 e 2 e 2
S4004-05 C03'" PNL 065" Concentration cmp;/m3)
0.008 0.006 < 0.02 e 0.01 e 0.01 e 0.01
0.08 e 0.01
0.01 e 0.02
0.01 e 0.01 e 0.01
0.01 e 0.01 e 0.01
0.01 0.01
e 0.01 e 0.01 < 0.01 e 0.01 e 0.01 < 0.02 < 0.02 e 0.01
0.01 < 0.01
e 0.01 < 0.02 e 0.01 < 0.01 < 0.01 < 0.01 e 0.01
0 1.54 2.55 e 2 e 2 e2 e2
12.68 e2 e2 e 2 < 2 e2 e 2 < 2 e2 e 2 e 2 e 2 e 2 e 2 e 2 < 2 e 2 e 2 e 2 e 2 e 2 e 2
e 2 e 2 e 2 e 2 < 2 e 2 < 2
S4004-06.CO3'") PNL 066@' Concentration @E!!B3)
0.008 0.005 e 0.02
0.01 e 0.01 e 0.01
0.05 0.01 0.01 0.02
e 0.01 e 0.01 e 0.01
0.01 e 0.01 e 0.01 e 0.01
0.01 e 0.01 e 0.01
0.01 e 0.01 e 0.01 e 0.02 e 0.02 e 0.01 e 0.01 e 0.01
e 0.01 e 0.02 < 0.01 e 0.01 e 0.01 < 0.01 e 0.01
0 1.58 2.35 < 2 < 2 < 2 e 2 8.91 e2 < 2 e2 e2 e2 e 2 e2 < 2 e 2 < 2 e 2 < 2 < 2 < 2 < 2 < 2 < 2 e 2 e 2 < 2 e 2
< 2 < 2 e 2 < 2 < 2 < 2 e 2
Meribs and Standard Deviations

Table 3.1 TO-14 Analysis for Samples from the Headspace of Tank C-104 from SUh4MAm Canister Samples Collected on 3/3/94 (continued).
TO-14 Analvte p-Dichlorobenzene (1,4-Dichlorobenzene) o-Dichlorobenzene ( 1,2-Dichlorobenzene) I ,2,4-Trichlorobenzene Hexachloro-1,3-Butadiene
S4004-04.C03(a) PNL 071@' Concentration
CASNo. MolWt (mdm3) 106-46-7 . 146 <0.01 C 2 95-50-1 146 KO.01 C 2
120-82-1 180 <0.02 C 2 87-68-3 258 <O.O2 C 2
(a) W C sample identification number. (b) PNL canister number. (c) Average and standard deviation data is not meaninsful for this analyte. (d) m-Xylene and p-Xylene ooelute; the reported concentration is the sum of these two compounds.
N N
S4004-05CO3'") PNL 065@) Concentration (mg/m3)
co.01 e2 co.01 < 2 <0.02 < 2 c0.02 < 2
S4004-06.CO3'"' PNL 066@' Concentration (mg/m3)
co.01 < 2 co.01 e2 c0.02 c2 c0.02 < 2

Table 3.2 Tentavtively Identified Compounds and Estimated Concentrations(') in Headspace of Tank C-104 from SUMMAm Canister Samples Collected on 3/3/94.
Tentatively Identified Comwund'd' Propene Propane Cyclopropane Acetaldehyde 2-Methyl -1-Propene Butane Acetonitrile Acetone Pentane Butanal 2-Butanone 1-Hexene Tetrahydrofixan
E Pentanal Heptane Octane 3-Heptanone Nonane Decane Undecane Dodecane Unknown C11 Ketone Unknown Alkane Tridecane Tetradecane
1 -Butanol
PNL 071") PNL 065") PNL 066'" CAS No>& Mol. Wt. Ret Time (mdm3) 0
115-07-1 74-98-6 75-19-4 75-07-0
115-1 1-7 106-97-8 75-05-8 67-64-1
123-72-8 78-93-3
109-99-9 71-36-3
110-62-3 142-82-5 11 1-65-9 106-35-4 1 1 1-84-2 124-18-5
1120-21-4 11240-3
109-66-0
592-41-6
629-50-5 629-59-4
42 3.896 44 3.989 42 4.763 44 5.227 56 5.701 58 5.97 41 7,847 58 8.436 72 9.643 72 13.336 72 13.543 84 14.193 72 15.833 74 17.567 86 19.176 100 20.517 114 26.016 114 29.514 128 31.124 142 35.839 156 40.203 170 44.247 170 46.538 170 47.136 184 48.013 198 51.531
0.48 254.59 0.34 174.48 0.11 60.99 0.31 160.3 0.30 121.42 0.61 235.76 0.13 68.96 0.34 131.12 0.27 85.37 0.45 139.27 0.32 99.54 0.14 37.4 0.15 46.58 2.70 816.56 0.15 38.49 0.34 75.43 0.22 43.12 0.45 88.68 0.10 16.64 1.00 157.85 5.04 723.62 6.57 865.36 0.10 12.8 0.10 12.66 6.32 769.65 1.00 112.59
(rnrr/m)) 0.47 252.92 0.35 175.8 0.12 62.19 0.33 167.79 0.32 128.32 0.64 246.03 0.12 67.14 0.32 125.32 0.28 85.9 0.46 lb1.74 0.33 102.96 0.13 35.94 0.15 46.68 2.52 763.4 0.16 40.42 0.32 71.12 0.21 41.63 0.43 85.31
<0.06 < 0.01 0.98 154.86 4.99 715.87 6.52 859.61
<0.08 <0.01 0.11 14.82 6.07 738.46 0.87 98.63
(mdm3) 0.42 222.98 0.3 151.41
q0.02 KO.01 0.13 68.16 0.26 104.38 0.53 205.87 0.11 61.21 0.3 116.72 0.24 75.77 0.51 157.87 0.31 97.97 0.12 32.52 0.14 42.83 2.13 645.36 0.12 30.22 0.27 61.37 0.2 38.44 0.35 68.38
< 0.06 < 0.01 0.88 138.75 4.62 663.48 6.31 831.21
<0.08 CO.01 <0.08 KO.01
6.26 762.14 1.02 114.9
Means and Standard Deviations
(mrrlm3) 0.46 0.33 0.12 0.26 0.29 0.59 0.12 0.32 0.26 0.47 0.32 0.13 0.15 2.45 0.14 0.3 1 0.21 0.4 1 (e)
0.95 4.88 6.47 (e)
0.1 1 6.22 0.96
St Dev 0.03 0.03
0.11 0.03 0.06 0.01 0.02 0.02 0.03 0.0 1 0.0 1 0.01 0.29 0.02 0.04 0.01 0.05
0.06 0.23 0.14
0.01 0.13 0.08
(a) (b) WHC sample identification number. (c) PNL SUMMA^ canister number. (d) (e)
Semiquantitative estimate calculated using concentration of closest eluting internal standard.
Obtained by mass spectral interpretation amd comparison with the EPAINISTIWILEY Library. Calculation is not significant with fewer than two values for mean value and fewer than three values for standard deviation value.
: o 243.5 167.23 61.59
132.08 118.04 229.22 65.77
124.39 82.35
146.29 100.16 35.29 45.36
741.77 36.38 69.3 1 4 1.06 80.79 (e)
150.49 700.99 852.06 (e) 13.74
756.75 108.71
~~ ~
St Dev 17.79 13.72
55.49 12.32 20.86 4.05 7.25 5.7
10.1 2.55 2.5 2.19
87.63 5.42 7.2 2.39
10.88
10.27 32.71 18.28
1.53 16.28 8.8

WHC Sample ID
MOO4 21.C03 S4004 22.C03 S4004 43.C03 S4004 51.C03 S4004 52.C03 S4004 53.C03 S4004 54.C03 S4004 55.C03 MOO4 56.C03 L s C C , Ls Ls
N rp
Table 3.3 Waste Tank C-104 OVS Sample Analyte Results (pg/sarnple)
Normal Paraffin Hydrocarbons
PNL LRB ID
55409-23-0 1 55409-23-02 55409-23-03 55409-2304 55409-23-05 55409-23-06 55409-23-07 55409-23-08 55409-23-09 55409-23- 10 55409-23-1 1 55409-23-12
Samde Descrbtion
ovs #1 ovs #2 ovs #3 Trip Blank #1 Trip Blank #2 Trip Blank #3 Field Surrogate # Field Surrogate #2 Field Surrogate #3 Lab Surrogate # I Lab Surrogate #2 Lab Surrogate #3
-11- C e 1 <1 1
< 1 < I < 1
2.8 5.7 4 4.3 4.3
5 (5)
-12- C 3
< 3 < 3 < 3 < 3 < 3
14.6 (15) 15.7 13.6 14 13.3 14.3
-13- C 4.3 <3 <3 < 3 <3 < 3
13.3 (15.3) 14.3 12.3 12.3 12.6 12.3
-14- C 1
< 1 < 1 <1 < 1
15 (15.3) 16.3 13 13.6 14 12.7
2 1
-15- C <1 <1 <1 <1 <1 <1
5.7 (5.3) 5.7 5 5 5 4.7
Surrogate-spike amounts are indicated in parenthesis. All surrogates were spiked with the same amount of analyte. Sample not analyzed for TBP. Samples indicated with this designation were held in the laboratory and do not have a WHC ID number.
TBP < 16.7 < 16.7 < 16.7 < 16.7 < 16.7 < 16.7
NIA NIA NIA NIA N/A
NIA(~)

9 . G 9 . c
B.+
9.4: 9.2: 9 . E
e.? 8.44 8.2: 8 . s 7.F 7.E-
7 . G
7.44 7.2f
6.+ 6.E 6.41 6.21 6.G 5 . 6 5.6 5.2i 5.4r
5.w 4 . s :
4.4:
4.24 4 . s
4.+
3 s
3.2: 3 3
2.G 2.4
2 . 6
3 . e 3.4:
2.e
2.24
1.E: 1 .e 1.43 1.2: l.? O.? 0 .F 0.42 0.2e
HP HS 24121709.d
E 1
1
5 P m
Figure 3.la Total Ion Chromatogram (2 - 30 min) for Hanford Waste Tank C-104 SUMMAN Canister Sample S4004-06.CO3 Collected on 3/3/94
25
~
9. p
9. + 9.% 9.4: 9.2<
8 . 5 8.64 8.4; 8.2:' 8.y; 7 . 5 7.% 7.42 7.2: 7.y; 6 . 5 6 . E 6.4; 6.24 6 . g 5%
' 5 . e
4.0:
5 . 5 5 . 5 5.2i
' 4 . q
4.4' 4 . E 4 3 3 .G 3.g
3.f 2 . 5 2 . 5
2.G
3.4: 3.22
2.4' 2.2<
1 .e<
1.4f -1.*
1.2.: l .? 0 . 5 0.6:
'0.41
42 4 Tlme C
/k-f?++ 46 -.
F'igure 3.lb Total Ion Chromatogram (30 - 58 min) for Hanford Waste Tank C-104 S U M M A n Canister Sample S4004-06.CO3 Collected on 3/3/94
26

4.0 Conclusions
The concentrations of selected inorganic and organic compounds were determined from samples of the headspace of Tank C-104. It is important to note that the inorganic samples were obtained and analyzed using procedures that were being developed, and that final procedures were not completed until later (Ligotke et al. 1994). Consequently, it is not known whether significant sampling or analytical errors occurred, and it is recommended that the headspace of Tank C-104 be sampled again using the improved methods should less qualified results be needed. The qualified results of inorganic samples were NH, (44 f 0 ppmv), NO, (I 0.02 ppmv), NO (0.37 f 0.05 ppmv), SO, (0.4 f 0.2 ppmv), and mass concentration (15 f 1 mg/L). The mass concentration was expected to consist largely of water vapor. Listed uncertainties reflect repeatability; actual uncertainties were not determined.
Twenty-six TO-14 and TIC compounds were found above instrumental detection limits, dominated by four NPH n-alkanes, about 69% of all compounds observed, and l-butanol, which is known to be a degradation product of TBP. No measurable TBP was seen in the collected OVS samples.
5.0 References
Clauss, T. W., M. W. Ligotke, B. D. McVeety, K. H. Pool, R. B. Lucke, J. S. Fruchter, and S. C. Goheen. 1994. Vapor Space Characterization of Waste Tank 241 -BY-I 04: Results from Samples Collected on 6/24/94. PNL-10208. Pacific Northwest Laboratory, Richland, Washington.
Ligotke, M. W., K. H. Pool, and B. D. Lerner. 1994. Vapor Space Characterization of Waste Tank 241-C-103: Inorganic Resultsfrom Sample Job ZB (5/12/94 - 5/25/94). PNL-10172, Pacific Northwest Laboratory, Richland, Washington.
6.0 Further Reading
Pacific Northwest Laboratory .. Analytical Laboratory Procedure Compendium. Procedures PNL- ALO-212, -226, -271. PNL-MA-599, Richland, Washington.
Pacific Northwest Laboratory. Quality Assurance Manual, Part 2: Good Practices Standard. PNL- MA-70, Part 2, Richland, Washington.
Pacific Northwest Laboratory. Quality Assurance Plan for Activities Conducted by the Analytical Chemistry Laboratory (ACL). MCS-033, Analytical Chemistry Laboratory, Richland, Washington.
Pacific Northwest Laboratory. 1994. Detem'nation of TO-14 Volatile Organic Compounds in Hartford Waste Tank Headspace Samples Using SUMMA Passivated Ganister Sampling and Gas Chromatographic-Mass Spectrometry Analysis, PNL-TVP-03 (Rev. 0), PNL Technical Procedure, Richland, Washington.
Pacific Northwest Laboratory. 1994. Sample Shipping and Receiving Procedure - DRAFT for PAT, Waste Tank Samples. PNL-TVP-07 (Rev. 0), PNL Technical Procedure, Richland, Washington.
27

PNL- 10499 UC-606
Distribution
No. of Copies
Offsite
2 DOE/Office of Scientific and Technical Information
R. A. Jenkins Oak Ridge National Laboratory P.O. Box 2008 Building 4500-5, MS 6120 Oak Ridge, Tennessee 37831-6120
B. C. Kowalski CPAC University of Washington
Seattle, Washington 98195 MS BG-10
No. of Copies
Onsite
2 DOE Richland ODerations Office
8
20
M. F. Jarvis, S7-54 J. F. Thompson, Jr. S7-54
Corps of Engineers
T . W. Gardner-Clayson, A5- 19
Westinghouse Hanford Commny
H. Babad, R2-78 D. R. Bratzel, S7-31 (2) S. J. Eberlien, E-12 J. G. Kristofiski, K2-12 N. W. Kirch, R2-11 J. M. Garcia, R3-01 J. E. Meacham, S7-15
Pacific Northwest Laboratory
T. W. Clauss, P8-08 K. H. Pool, P8-44
B. D. McVeety, K6-84 K. B. Olsen, K6-96 J. S. Fruchter, K6-96 S. C. Goheen, P8-08 M. W. Ligotke W-59 (6)
K. L. Silvers, W-27 Technical Report Files (5)
B. L. Tho-, K9-25
J. L. Huckaby, K6-55
Dist. 1