vantage · 2019. 1. 3. · 4 vantage global investment fund annual report to 31 december 2016...
TRANSCRIPT

ANNUAL REPORT
31 December 2016
GLOBAL INVESTMENT FUND
VANTAGE

Annual report as of December 31, 2016 Contents
Executives and Other Information 3 Directors’ Report 4‐5 Manager’s Report 6‐15 Independent Auditor's Report 16‐17
Audited Financial Statements of Vantage Global Investment Fund 18‐20
Notes to the Financial Statements 21‐36
The Portfolio Movements can be obtained from the registered office of the Fund or from the Administrator.

3
Executives and Other Information Annual report as of December 31, 2016
Vantage Global Investment Fund
Directors Custodians and Prime Brokers Andrew B. Veglio di Castelletto UBS AG (London) Christopher D. Corrigan 1 Finsbury Avenue Richard Davidson London EC2M 2PP United Kingdom Investment Manager UBS AG (Zurich) Vantage Investment Management Limited Bahnhofstrasse 45 2nd Floor, Block B, Ruisseau Créole 8001 Zürich Black River, Mauritius Switzerland Independent Auditors of the Fund Administrator and Banker BDO MUFG Alternative Fund Services (Cayman) Limited P.O. Box 31118 P.O. Box 852 GT 2nd Floor – Building 3 227 Elgin Avenue Governors Square George Town 23 Lime Tree Bay Avenue Grand Cayman, KY1‐1103 Grand Cayman KY1‐1205 Cayman Islands Cayman Islands Investment Advisor Registered Office Vantage Investment Advisory Limited MUFG Alternative Fund Services (Cayman) Limited 43 Brook Street P.O. Box 852 GT London W1K 4HJ 227 Elgin Avenue United Kingdom George Town Grand Cayman KY1‐1103 Cayman Islands Legal Counsel Walkers Walker House George Town Grand Cayman KY1‐9001 Cayman Islands

4
VANTAGE GLOBAL INVESTMENT FUND
ANNUAL REPORT to 31 December 2016
DIRECTOR’S REPORT Dear Member, Your Fund’s Net Asset Value gained 1% over the year, under performing its Investment Benchmark which rose 3.2% over the period and the 8.2% return of the world’s equity markets as represented by the MSCI World Index (MSWI), all measured in US dollars. The Risk Free Rate lost 2.0% over the year measured in US dollars as the US dollar strengthened against most other major currencies. Your Fund’s under performance versus the MSWI over the final quarter was due to renewed weakness in gold and gold shares, retained as a hedge against monetary instability, and the sharp appreciation of the US equity market post the November 8 election victory of Donald Trump, where your Fund held no net exposure after hedging. Your Fund’s significant overweight in the US dollar, averaging over 70% of its net assets over the year, contributed to its out performance of the Risk Free Rate. Subsequent to year-end your Fund has recovered some of its fourth quarter underperformance, rising 3.7% in US dollars versus the 2.4% gain in its Investment Benchmark. Global equity markets have experienced a roller coaster ride over the past eighteen months. Equity markets entered 2016 on a continuing weakening trend – the MSWI lost some 18% measured in US dollars from its May 2015 peak to its February 2016 lows. This equity slump reflected concerns about the US Federal Reserve’s move to normalise monetary policy and the collapse in global commodity prices provoked by these concerns, as well as by the slowing Chinese economy. With the Fed signalling a very cautious approach to raising interest rates, and the Chinese authorities encouraging faster credit growth and hence a domestic recovery, equity markets rallied progressively from their February lows. They quickly recovered sharp initial losses from the unexpected UK Brexit vote end June and the election of Donald J Trump as President of the USA early November. Total return funds had a tough time managing this volatility with many experiencing negative returns in 2016. Global bond markets appreciated sharply to generational peaks around mid 2016, and have subsequently been selling off, as fear of global deflation gradually shifted, along with higher commodity prices and recovering global economies, to views that global reflation is likely underway. With concerns that monetary policy makers will be slow to react to rising inflationary pressures, the prices of inflation protected bonds surged. It certainly appears that an inflection point has been reached in the 35 year old bull market in developed economy government bonds. The US dollar initially weakened against a trade weighted basket of currencies after its sharp appreciation in 2015, then gathered momentum in the final quarter to end the year broadly unchanged but on a strengthening trend. The UK pound was the weakest major currency, losing some 17% against the US dollar post the British referendum vote to exit the European Union.
At time of writing global equity markets continue on a rallying trend, with US equity market indices at all time highs. The markets have taken President Trump’s promises to cut US corporate taxes and regulation and to massively increase US infrastructure spending, as well as his appointments of several financial industry insiders to his Administration, as significant positives. They have chosen to ignore the risks associated with the many inconsistencies and ‘alternative facts’ in his pronouncements, the impact of his trade unilateralism and protectionism on global and US economic growth, and the geo-political impact of his abrasive foreign policy positions and his America First myopia. We discuss at length our take on the Trump phenomena in the Manager’s report. Suffice to state that we don’t believe his tenure of this most influential of global posts bodes well for the USA’s economic and geo-political standing in an increasingly fractured global order. Your Fund ended the year with a 95% gross exposure to global equities, and a 51% net exposure after hedging. The US dollar exposure ended the year at 75%, with a 5% exposure to gold bullion and a 7% exposure to the now undervalued UK pound. We remain grateful for your support as we continue to seek to add value for your Fund.
Andrew Veglio di Castelletto 27 January 2017

5
VANTAGE GLOBAL INVESTMENT FUND
ANNUAL REPORT to 31 December 2016
VANTAGE GLOBAL AND BENCHMARKS IN US$ 5/1/17
01 02 03 04 05 06 07 08 09 10 11 12 13 14 15 1650
100
150
200
250
300
350
VANTAGE FUND
MSCI WORLD INDEX
RISK FREE BENCHMARK
VANTAGE BENCHMARK
Source: DATASTREAM
The Performance of the Vantage Global Investment Fund and its Comparative Indices since 2001 is presented below:
PERFORMANCE OF VANTAGE GLOBAL AND COMPARATIVE INDICES TO 30 DECEMBER 2016
% Returns In US$
% Returns In Currency Benchmark (3)
Returns over the Preceding: Quarter(1)
Year to Date (2)
Since Incept. (9)
Quarter
Year to Date
Since Incept.
Vantage Global (2.3) 1.0 348.5 2.1 3.2 395.1
Fund’s Benchmark (4) (1.2) 3.2 149.2 3.3 5.5 175.0
MSWI (5) 2.0 8.2 282.1 6.6 10.5 321.7
Risk Free (6) (4.2) (2.0) 40.0 0.0 0.2 54.5
Value Added Risk Free (7) 2.1 3.0 220.4 2.1 3.0 220.4
V.A. Investment Benchmark (8) (1.1) (2.2) 80.0 (1.1) (2.2) 80.0
Key to Performance Table
1. Quarterly returns are presented from the last trading NAV of the previous calendar quarter; 2. Current year returns are presented from the last NAV of the previous calendar year; 3. The Currency Benchmark is defined as 40% US dollar, 20% Euro, 10% Yen, 10% UK pound, 10% Singapore
dollar, 5% Swiss franc, 2.5% Canada dollar, 2.5% Australia dollar as from 1st Jan 2011. 4. The Fund’s Investment Benchmark is defined as the average of the returns of the MSWI and of Risk Free
securities, i.e. 50% MSWI plus 50% Risk Free. 5. MSWI is defined as the MSCI World Index including income. 6. Risk Free is defined as the return generated from investing in 6 month Government Securities, in the
weightings of the Currency Benchmark. 7. Value Added Risk Free is defined as the net return earned by the Fund over the period after deducting all
expenses and Fees including the Manager’s Performance Fee (the “Net Return”), and after deducting the return that would have been derived from investing all the Net Assets of the Fund in Risk Free securities.
8. Value Added Investment Benchmark is defined as the net return earned by the Fund after deducting the return that would have been derived from investing all the Net Assets of the Fund in the Fund’s Investment Benchmark.
9. Inception of the Fund was on 1st January 1996.

6
VANTAGE GLOBAL INVESTMENT FUND
ANNUAL REPORT to 31 December 2016
REGIONAL EQUITY INDICES IN US$ - REBASED TO 100 5/1/17
JAN FEB MAR APR MAY JUN JUL AUG SEP OCT NOV DEC80
85
90
95
100
105
110
115
120
USA
EUROPE
JAPAN
ASIA
Source: DATASTREAM
MANAGER’S REPORT
Equities and Economies Over the year to December 2016 the MSCI World Index including income (MSWI) increased by 8.2% measured in the US dollar and 9.6% in local currencies. The table below shows the regional equity market returns over the year to 30th December 2016: Equity Market Local Currency
Return US Dollar Return Weighting in
World Index World Index 9.6 8.2 100% United States 11.6 11.6 60% Europe 8.3 1.0 23% Japan -0.4 2.7 9% Asia Pacific Ex Japan 6.4 5.8 1% Others 10.6 9.4 7%
The chart below shows the evolution of the regional equity markets measured in US dollars over the course of 2016:
After falling sharply in January and early February to a low on the MSWI of down 13%YTD, the markets rallied to broadly break even by mid year, and then continued to gain into year end. The US equity market was again the best performing major market, gaining 11.6% for the year, with more than half of that gain coming after the Nov 8th election of Donald J Trump as President of the USA. Up until that stage it did look as if equity markets were tracing out a topping pattern with September 2016 highs. However subsequent equity market strength has invalidated that view, and most equity markets appear now to be in renewed bull markets. Supporting the US equity market is a gradual recovery in overall US corporate earnings as the energy and commodity related falls of 2015 wash out, as well as the still very accommodative monetary policies deployed by the US Fed.

7
VANTAGE GLOBAL INVESTMENT FUND
ANNUAL REPORT to 31 December 2016
While the fourth quarter 2016 US GDP growth numbers just announced came in softer than expected at 1.9% annualised, a resurgence in US consumer confidence and US small business optimism surveys to 15 year highs, combined with strong increases in forward looking surveys for manufacturing, for orders, and for imports and exports, all point to renewed strength in the US economy into early/mid 2017. With few signs of a US economic recession in sight, and expectations that President Trump will cut US corporate taxes, deregulate the US economy, and greatly increase fiscal spending on infrastructure, the US equity market has found renewed confidence and looks to be moving higher. We are firmly of the view that the election of Donald Trump to the Presidency of the world’s dominant military and economic power will foster neither US nor global economy prosperity, much less geopolitical stability. The post WW II global economic and political consensus has been eroding for some time (in our view the 1999 NATO bombing of Belgrade in support of the separatist KLA in Kosovo, a millennium old province of independent Serbia, without supporting UN authorisation and operating outside of NATO’s defensive charter, marked a start of a breakdown in the international order). The USA’s relative economic dominance is inevitably diminishing due to the shift in economic power to Asia, and principally to China. We believe that the Trump phenomena will accelerate rather than arrest this trend. We fully understand the frustrations of Middle America at the perceived East Coast bias towards globalisation, unfettered free trade, and monetary largesse. Major US corporations have for decades boosted their profits by relocating production and investment to low cost countries. These corporate investment decisions hollowed out many US industrial communities while contributing to the creation of significant and sustainable overseas competitors through the technology transfer requirements imposed by these low cost countries, particularly China. US industrial workers have borne the brunt of globalisation policies that have overwhelmingly benefited ‘East Coast’ elites and Wall Street mavens. President Trump’s success in connecting with this large community, who feel marginalized and ignored by Washington’s career politicians and the ‘special interests’ they represent, and whose confidence in the future has been shaken by serial redundancies, long term unemployment, mid life retraining requirements and falling real wages, has been the foundation of his success. He has also successfully plugged into the growing view that political correctness has reached absurd levels and that support for minorities, particularly of recent immigrant and refugee populations, has taken precedence over, and even been at the expense of, the interests of long term US citizens. His projection of himself as a successful self made business man, is seen by his supporters as key to him upholding basic American values of free enterprise and free choice, individual responsibility, and national pride, which they believe to have been severely eroded under two terms of President Obama’s Administration. We get all that and empathise with some of it – although we should note that under President Obama the USA had experienced the longest period of unbroken job creation for 40 years, that the current headline US unemployment rate of 4.7%is the lowest since 2000 and second lowest over those 40 years, and that the US equity market’s ratings are near their highest ever, after enjoying one of the longest bull runs on record. It is ironic that Donald Trump has been elected ‘to fix the carnage’ just as real wages for Middle America start to rise sharply, as the US economy nears fill employment, and as the US equity market reaches record levels. The problem is that in Donald Trump the US has elected a President with a history replete with failed enterprises, broken promises, unpaid creditors, and disenchanted customers.

8
VANTAGE GLOBAL INVESTMENT FUND
ANNUAL REPORT to 31 December 2016
They now have a President whose world views often seem so simplistic that he feels able and indeed impelled to convey them via 144 letter Twitter outbursts, a man who has scant regard for fact or truth, who is braggadacious beyond compare (except perhaps for a select few African potentates), whose grasp of economics appears almost non-existent, who seems disinclined to take advice or even seek input from the expert staff available in the US public administration, who doubles down on any opposition, denigrating and belittling those who offer any criticism of his often bizarre behaviour and policy pronouncements. One of the basic tenets of Vantage’s investment philosophy is that good companies tend to remain good companies over time, despite short term market or cyclical factors, and that lousy companies tend, over time to revert to type. We have over the years sometimes not followed this principle (witness the investment in gold shares when we thought the global fiat monetary system might collapse under the unparalleled abuses visited on it by Central Banks post 2008). We have always, over time, lived to regret deviations from this tenet, and are committed never to stray down that path again.
We view Mr Trump in much the same light. His track record is one of personal success at the expense of his creditors, his customers, and in the one listed company he ran, (and into the ground at that), of his shareholders. He has not created any major operating businesses, and most of the operating businesses he established have failed. He has personally prospered out of being long US real estate, and by being bailed out periodically by the US Federal Reserve’s extreme monetary largesse. His statements that he is going to ‘Make America Great Again’, ‘Win so much Americans will get tired of Winning’, ‘Put America First instead of Last’ etc. are beguiling to those who feel that the nation’s and their personal relative positions have been slipping for decades. However, beyond a potential short term fillip, none of his policies, if enacted, appear likely to create more US jobs, enhance America’s long term global standing and influence, or increase its national and domestic security. To the contrary some of his pronouncements, if carried through, will bring the US into direct economic conflict with many of its major trading partners (or adversaries as he views them), and potentially militarily too.
On the campaigning stump President Trump appeared to view most issues as a simple zero sum game. In order to win somebody else had to get screwed (we guess that may well be his leitmotif). Hopes that the responsibility of Office and access to a well informed staff would attenuate his more extreme views appear, certainly on early evidence, to be misplaced. Rather than seek outside counsel, President Trump has surrounded himself in his Administration with campaign supporters who hold similar views. Witness the worrying appointment of Stephen Brannon, Chairman of the ‘Alt-Right’ Breitbart News and CEO of Trump’s election campaign, as Chief Strategist and Senior Counsellor to the President, and to the US National Security Council (NSC), while dropping the permanent attendance of the Director of National Intelligence and or the Joint Chief of Staff of the US military! Also the appointment of his son-in-law Jared Kushner as Senior White House Advisor (he who will successfully forge a Palestinian/Israeli peace accord according the President Trump!)
Most of Trump’s trade or industrial policies appear to us profoundly short sighted. Take for example his trumpeted success in creating 700 auto jobs in Michigan by pressurising Ford to abandon a $1.6bn half way completed plant in Mexico by threatening to impose a 20% trade tariff on car imports from Mexico. Ford will now write off a major investment which would have lowered its cost of production, improved its ability to supply the Mexican domestic market, and benefited North American component suppliers as well as US consumers. Instead Ford will create a paltry number of jobs in an area with rising labour costs as full employment and a skills shortage starts to bite.

9
VANTAGE GLOBAL INVESTMENT FUND
ANNUAL REPORT to 31 December 2016
Despite the overwhelming evidence that command economies fail, and that political interference in the functioning of markets bears a heavy economic cost, Mr Trump thinks he is in a better position than the Ford directors on deciding where to allocate their capital. Let’s say he is successful in this drive, and the US auto industry abandons in some measure its lower cost overseas production facilities and returns production to the US. Will that make US cars better, more reliable or more affordable? And if the price of US cars and other imported goods goes up, what happens to interest rates? And if US interest rates go up (US consumers buy cars overwhelmingly on credit), what will happen to demand for these more costly US manufactured cars. And if demand for US manufactured cars falls (from the near record current levels of around 17 million vehicles per year), what happens to those US auto jobs and the jobs of N.A. auto component suppliers?
Economic nuances appear lost on President Trump and his Alt-Right advisors, just as the nuances of removing militarily the principal secular leader in the Middle East on bogus WMD charges, at a time of rising Islamic fundamentalism, were lost on President George W. Bush and his Neo-Con advisors. It is profoundly ironic that President Trump claims that he foresaw the problems that would arise from the US invasion of Iraq (against which millions marched in Europe and around the world), while appearing to be blundering into equally misguided attack on global trading partners, including withdrawing from the Trans Pacific Partnership (TPP) trade deal, at a time when China is moving to occupy the policy gap left by American disengagement. Unlike President Trump, we wrote in your Fund’s 2002 reports and elsewhere about the likely dysfunctional outcome of destabilizing Iraq. We are equally clear that President Trump’s campaign promises to renegotiate or scrap most multilateral trade deals between the US and its trading partners, to coerce US Industrial companies to relocate their manufacturing back home and slap tariffs on imports from countries with trade surpluses with the US, will damage the US and global economies to the extent they are enacted.
There have been attempts to liken President Trump’s election to that of President Reagan, a President initially ridiculed by much of the establishment as a Californian bumpkin with little grasp of economics and no experience of Congress, and who turned out to be one of the most successful two term US Presidents and one of the most loved to boot. We couldn’t disagree more. President Reagan was a two term serving Governor of California before election. He was a great communicator and a prodigious delegator. He was pro-free trade and pro immigration into the US. He focussed on a few major areas of policy, articulated them clearly and simply, and built alliances across party lines and internationally to help achieve his policy objectives. His message was usually inspirational and often uplifting. Donald Trump’s message is one of current US despair and carnage, even at a time of remarkable US stability and prosperity. His speeches, far from uplifting, are angry tirades against his perceived personal injustices or threats to US economic and national interests, none of which are supported by fact. Donald Trump is no Ronald Reagan - in many ways he is his antithesis!
We have written at length about President Trump because we think that his election, without a popular mandate, and after attempts to influence the election outcome by President Putin’s Russia, will prove a defining moment in US political and economic history. The most unpopular US President to take office in the modern era, President Trump’s first week in office confirms that he will likely continue to polarise US society, antagonize important geo-political allies and diminish the US’s international standing. His world view that the US has somehow come off second best in most major negotiations since the 1960’s is at odds with the general perception that the US has generally set the framework for, and prospered from, the post WW II geopolitical, trade and financial order. We could go on and on, but Members will be aware of all of the above, and more, from the general coverage of President Trump’s election and of his Administration.

10
VANTAGE GLOBAL INVESTMENT FUND
ANNUAL REPORT to 31 December 2016
After an eight year US equity bull market, one of the longest on record, and with the US equity market trading near its peak levels relative to normalised earnings of 26X (excluding to 1999/2000 bubble) we expect that the current US equity market euphoria will give way to caution and then angst moving into 2018. We understand the drivers for short term continued US equity price appreciation. However we think the US equity market’s positive initial response to President Trump’s election will, over time, give way to concern about the impact of his policy choices on US inflation and US interest rates, on global trade and US corporate earnings, on US equity risk premia and hence on US equity prices. We see little sign that the Republican controlled Congress is willing, or indeed yet feels politically able, to moderate Trump’s excesses. In summary we think that President Trump’s Administration will damage the US economy and severely challenge to the US’s pre-eminent global position over time. It does appear that European economies are finally recovering from their 2008 slump, helped by the globally competitive Euro exchange rate and by the extreme monetary accommodation of the ECB, currently adding some Euro 80bn per month (falling to E60Bn per month in April) to the Euro area monetary base. Higher long term European interest rates are lifting the cloud under which European financials have languished. One such European financial company in which your Fund has a position is the Italian insurer Generali. The chart below shows Generali’s share price (light blue) relative to its fundamentals over the past 30 years:
Shares in Assicurazioni Generali, along with many other European financials, appear significantly undervalued and offer attractive long term return potential. Recently Generali has been subject to takeover speculation, but our investment case is independent of its attractiveness as a takeover candidate in an industry ripe for consolidation. Your Fund ended the year with a 95% gross exposure and a 51% net exposure to global equities, the highest such exposures for years. Your Fund has subsequent to quarter end increased its exposure to European stocks, such that its gross equity exposure is now at it maximum 100%. We continue to find good value in Asian equity markets. We think that the move from economically defensive stocks into cyclical stocks has a way to run, and this move should benefit your Fund. After another disappointing year, wherein your Fund lagged its Investment Benchmark although at least added value relative to Risk Free, it is encouraging to note that your Fund, despite its low risk characteristics, is ahead of all of its benchmarks year to date.
Assicurazioni Generali
NAV PS
Dividends PS*20
Sales PS
EPS*10

11
VANTAGE GLOBAL INVESTMENT FUND
ANNUAL REPORT to 31 December 2016
Fixed Interest The chart below shows the evolution of the prices of long-term Government Bond futures over the past 3 years:
After falling to all time lows in September 2016, based on lingering concerns about global deflation, and on continued aggressive Central Bank bond purchasing in Europe and Japan, the yields on government bonds have started to push higher (bond prices have started to fall). US 30 year treasury bond interest rates touched a low of 2.1% back in July 2016 – they are currently close to 3.2%. UK 20 year GILT rates have nearly doubled from the absurdly low 1.1% reached in August 2016, on BOE buying post the Brexit vote to offset the deflationary impact they foresaw from Britain’s withdrawal from the EU. It seems clear to us that inflation, in both the US and the UK is heading higher, and that monetary policy in both countries will lag this push up in prices. Hence we think it appropriate that government bond prices are falling, and expect that the 30 year bull market in government bonds has peaked. European long-term interest rates are rising as signs of economic recovery take hold, European inflation starts rising, and the ECB signals it intends scaling back on monthly government bond purchases. Even Japanese long-term interest rates appear to have bottomed in July at negative 30 bps for 10 year JGB’s, on concerns of the Bank of Japan about the damage negative long term interest rates were causing to the Japanese long term insurance and the savings and pensions industries. While fixed interest is not a core focus of your Fund, we will from time to time seek to augment its returns, when interest rates appear anomalous as they do now, by investing in or selling short government bonds and/or their derivatives. We think that government bond yields reached absurdly low levels in Q3 2016. Your Fund has a 6% short position across the spectrum of long-term government bond futures

12
VANTAGE GLOBAL INVESTMENT FUND
ANNUAL REPORT to 31 December 2016
Currencies
The chart below shows the evolution of the US dollar’s exchange rate against the Euro, the UK pound, the Japanese yen and the Chinese yuan, all rebased to 100 on 1 January 2014:
Since January 2014, the US dollar has appreciated by a quarter against the Euro and the UK pound, and by close to 10% against the Japanese yen and the Chinese yuan. Over the course of 2016 the UK pound fell 17%, the Chinese yuan 6% and the Euro 4% against the US dollar, while the Japanese yen gained 3%. Against its broad trade weighted index the US dollar gained 2% over the year, more than recovering its 6% losses between January and April 2016. The chart below shows the USD per GBP exchange rate and the Vantage and OECD measures of the Purchasing Power Parity between the two currencies:
The UK pound appears some 12 to 15% undervalued against the US dollar. We think the outlook for the UK’s trading position is more favourable than the consensus post Brexit appears to be, and have recently increased your Fund’s exposure to the UK pound to the 10% neutral position in its Currency Benchmark (CB). Your Fund’s 75% exposure to the US dollar is significantly over weight relative to a 40% CB neutral position. We think that the US Fed will be more aggressive in raising interest rates this year, both to counter the impact of increased fiscal spending at a time when the US economy is nearing full employment, and because US inflation looks like accelerating, especially should President Trump impose import tariffs.
Deviation of USD/GBP from OECD PPP
Deviation of USD/GBP from Vantage PPP
Vantage PPP
USD per GBP
OECD PPP
USD per GBP and measures of their PPP

13
VANTAGE GLOBAL INVESTMENT FUND
ANNUAL REPORT to 31 December 2016
INVESTMENTS, HEDGES, AND NET ASSETS AT 30 DECEMBER 2016
Percent Portfolio Holdings Number Market Value 94.6% SHARES HELD LONG
$ 159,225,172
22.6% North America $ 38,038,995 1.8% Gentex 146,200 $ 3,023,416 1.5% Honda Motors ADR 83,300 $ 2,553,978 1.5% Corning 100,000 $ 2,446,000 1.4% Carnival 46,107 $ 2,435,372
16.4% Investments less than 1.4%
$ 27,580,229
47.4% Japan and Pacific Rim $ 79,780,900 2.6% Mitsubishi Heavy Ind 938,000 $ 4,350,644 2.3% Japan Petroleum 169,000 $ 3,871,341 2.1% Mitsubishi UFJ Finl.gp 559,600 $ 3,556,167 2.1% Mediatek 517,000 $ 3,465,384 1.3% Investments less than 2.1% 280,000 $ 2,172,534
24.6% Europe, UK and other EMEA $ 41,405,277 1.9% Brown Gp 1,305,329 $ 3,281,014 1.8% Lukoil 51,162 $ 2,951,024 1.3% Supergroup 111,509 $ 2,269,749 1.3% Tesco 894,227 $ 2,264,214
18.2% Investments less than 1.3%
$ 30,639,276
(1.0%) SHARES SOLD SHORT ($ 1,683,141)
(1.0%) Exxon Mobil (19,300) ($ 1,734,877)
EXPOSURE
(0.6%) STOCK MARKET HEDGES ($ 927,630) (42.9%)
0.1% S&P Futures (242) $ 220,845 (15.7%)
(0.1%) Hang Seng Futures (100) ($ 194,726) (8.2%)
(0.2%) Nikkei Futures (119) ($ 329,834) (5.6%)
(0.2%) Other Stock Index Futures
($ 403,070) (13.4%)
(0.0%) COMMODITY ($ 37,380) 2.0%
(0.0%) Platinum Futures 74 ($ 37,380) 2.0%
1.2% BONDS $ 1,999,000 1.2%
1.2% Anglo American Capital 2012 5/8% 27/09/2017 2.000.000 $ 1,999,000 1.2%
(0.0%) BOND FUTURES
($ 62,247) (4.9%)
(0.0%) BTP Italy Bond Futures (20) ($ 27,553) (1.6%)
(0.0%) JGB Bond Futures (14) ($ 2,395) (1.0%)
(0.0%) Other Bond Futures
($ 32,299) (2.3%)
5.8% CASH AND EQUIVALENTS $ 9,738,115 5.2% Gold Bullion 7,518 $ 8,760,791 5.1%
0.6% Cash, and Margin Deposits Net of Provisions
$ 977,324
100.0% NET ASSET VALUE $ 168,314,135.00
Net Asset Value per Share $ 448.50
Number of Shares in Issue 375,284

14
VANTAGE GLOBAL INVESTMENT FUND
ANNUAL REPORT to 31 December 2016
EXPOSURES TO INVESTMENTS AND HEDGES AT 30 DECEMBER 2016
EQUITY EXPOSURE
Investments by Country
Long Exposure (%)
Short Exposure %
Investment Hedges (%)
Net Exposure (%)
Weight in MSWI (%)
U.S.A 22 (1) (16) 5 60 Canada 1 - 0 1 4 North America 23 (1) (16) 6 64 United Kingdom 10 - (5) 5 7 Germany 3 - 0 3 3 Ireland 1 - 0 1 Other Europe 4 - 0 4 13 Europe 19 - (5) 14 23 Japan 16 - (6) 10 9 Taiwan 9 - (4) 5 Hong Kong 8 - (8) 0 1 China 6 - (4) 2 South Korea 4 - (1) 2 South Africa 4 - 0 4 Other 8 - 0 8 3 Asia Pacific and Other 38 - (17) 21 4 TOTAL EQUITIES 95 (1) (43) 51 100
CURRENCY EXPOSURE
Currencies by Country Investment Exposure %
Currency Hedges %
Net Exposure % Weight in Currency
Benchmark % Gold 5 5 - US Dollar 22 50 72 40 Hong Kong Dollar 8 (4) 4 US Dollar Block 30 45 75 Canadian Dollar 1 (1) 0 2.5 GBP 10 (3) 7 10 Euro 5 (5) 0 20 Swiss Franc 1 (1) 0 5 Other Europe 3 (2) 1 Europe 9 (8) 1 Japanese Yen 16 (12) 4 10 China Yuan 6 (3) 3 Singapore Dollar 1 0 1 10 Australian Dollar 2 (3) (1) 2.5 Other 22 (17) 5 Asia Pacific and Other 30 (22) 8 TOTAL 100 0 100 100
(Please note that numbers may not add up to totals due to rounding)

15
VANTAGE GLOBAL INVESTMENT FUND
ANNUAL REPORT to 31 December 2016
APPOINTMENTS Directors of the Fund :
Web Site :
Andrew B. Veglio di Castelletto www.vantagefunds.com Richard Davidson (to 31 Dec 2016) Christopher D. Corrigan Ian Lambert (from 1 Jan 2017)
Custodians : Investment Manager : UBS AG (London) Vantage Investment Management Ltd. 1 Finsbury Avenue, London EC2M 2PP
2nd Floor, Block B, Ruisseau Creole, Black River, 90625 Mauritius
Tel: + 44 20 7567 8000 Tel : +230 483 4767 Fax: + 44 20 7568 7024 UBS AG (Zurich) Bahnhofstrasse 45, 8001 Zurich Tel: + 41 44 234 1111 Fax: + 41 44 237 6094 Administrator and Registered Office : MUFG Alternative Fund Services (Cayman) Ltd. P.O. Box 852 GT, George Town, Grand Cayman Cayman Islands Tel: + 1 345 914 1000 Fax: + 1 345 914 4060 Legal Advisors : Walkers Walker House, George Town, Grand Cayman Cayman Islands
Fax : +230 483 8585 Investment Advisor : Vantage Investment Advisory Ltd. 43, Brook Street, London W1K 4HJ United Kingdom Tel : +44 20 7629 4224 Auditors : BDO (Cayman) P.O. Box 31118 2nd Floor, Building 3, Governors Square 23 Lime Tree Bay Avenue Grand Cayman, Cayman Islands Tel: + 1 345 943 8800 Fax: + 1 345 943 8801
Tel : +1 345 949 0100 Fax : +1 345 949 7886
Definitions The MSWI denotes the MSCI World Index including income. The Currency Benchmark denotes the Currency Benchmark mix as defined by the Directors in the Prospectus dated 6
January 2011. The Investment Benchmark denotes the Investment Benchmark as defined by the Directors in the Prospectus dated 6
January 2011. The Net Equity Exposure to a particular region is the sum of all the Fund’s equity investments in that region, less any
equity hedges including delta adjusted option positions entered into in that region. The Net Currency Exposure to a particular currency or currency block is the sum of all the Fund’s investments and cash
denominated in that currency or currency block, less any currency hedges including delta adjusted option positions entered into in that currency or currency block.
The Bid and Offer Prices and Net Asset Value of the Fund are calculated each week as of the close of business on Wednesday by the Administrator, MUFG Alternative Fund Services (Cayman) Ltd., and are available via the internet on www.vantagefunds.com.

BDO Cayman Ltd., a Cayman Islands company, is a member of BDO International Limited, a UK company limited by guarantee, and forms part of the international BDO network of independent member firms.
16
Tel: +1 (345) 943-8800 Fax: +1 (345) 943-8801 Email: [email protected] www.bdo.ky
PO Box 31118 2nd Floor – Building 3 Governors Square 23 Lime Tree Bay Avenue Grand Cayman KY1-1205 Cayman Islands
Independent Auditor’s Report
To the Board of Directors of Vantage Global Investment Fund Grand Cayman, Cayman Islands
Opinion
We have audited the financial statements of Vantage Global Investment Fund (the “Fund”), which comprise the statement of financial position as of December 31, 2016, and the statement of comprehensive income, statement of changes in net assets attributable to holders of redeemable participating shares and statement of cash flows for the year then ended, and the notes to the financial statements, including a summary of significant accounting policies.
In our opinion, the accompanying financial statements present fairly, in all material respects, the financial position of the Fund as of December 31, 2016, and its financial performance and its cash flows for the year then ended in accordance with International Financial Reporting Standards (“IFRSs”).
Basis for Opinion
We conducted our audit in accordance with International Standards on Auditing (“ISAs”). Our responsibilities under those standards are further described in the Auditor’s Responsibilities for the Audit of the Financial Statements section of our report. We are independent of the Fund in accordance with the International Ethics Standards Board for Accountants’ Code of Ethics for Professional Accountants (“IESBA Code”), and we have fulfilled our ethical responsibilities in accordance with the IESBA Code. We believe that the audit evidence we have obtained is sufficient and appropriate to provide a basis for our opinion.
Responsibilities of the Directors for the Financial Statements
The directors are responsible for the preparation and fair presentation of the financial statements in accordance with IFRSs, and for such internal control as the directors determine is necessary to enable the preparation of financial statements that are free from material misstatement, whether due to fraud or error.
In preparing the financial statements, the directors are responsible for assessing the Fund’s ability to continue as a going concern, disclosing, as applicable, matters related to going concern and using the going concern basis of accounting unless management either intends to liquidate the Fund or to cease operations, or has no realistic alternative but to do so.
Auditor’s Responsibilities for the Audit of the Financial Statements
Our objectives are to obtain reasonable assurance about whether the financial statements as a whole are free from material misstatement whether due to fraud or error, and to issue an auditor’s report that includes our opinion. Reasonable assurance is a high level assurance, but is not a guarantee that an audit conducted in accordance with ISAs will always detect a material misstatement when it exists. Misstatements can arise from fraud or error and are considered material if, individually or in the aggregate, they could reasonably be expected to influence the economic decisions of users taken on the basis of these financial statements.
As part of an audit in accordance with ISAs, we exercise professional judgment and maintain professional skepticism throughout the audit. We also:
• Identify and assess the risks of material misstatement of the financial statements, whether due to fraud or error, design and perform audit procedures responsive to those risks, and obtain audit evidence that is sufficient and appropriate to provide a basis for our opinion. The risk of not detecting a material misstatement resulting from fraud is higher than for one resulting from error, as fraud may involve collusion, forgery, intentional omissions, misrepresentations, or the override of internal control.

17
Independent Auditor’s Report (continued)
Auditor’s Responsibilities for the Audit of the Financial Statements (continued)
• Obtain an understanding of internal control relevant to the audit in order to design audit procedures that are appropriate in the circumstances, but not for the purpose of expressing an opinion on the effectiveness of the Fund’s internal control.
• Evaluate the appropriateness of accounting policies used and the reasonableness of accounting estimates and related disclosures made by management.
• Conclude on the appropriateness of management’s use of the going concern basis of accounting and, based on the audit evidence obtained, whether a material uncertainty exists related to events or conditions that may cast significant doubt on the Fund’s ability to continue as a going concern. If we conclude that a material uncertainty exists, we are required to draw attention in our auditor’s report to the related disclosures in the financial statements or, if such disclosures are inadequate, to modify our opinion. Our conclusions are based on the audit evidence obtained up to the date of our auditor’s report. However, future events or conditions may cause the Fund to cease to continue as a going concern.
• Evaluate the overall presentation, structure and content of the financial statements, including the disclosures, and whether the financial statements represent the underlying transactions and events in a manner that achieves fair presentation.
We communicate with those charged with governance regarding, among other matters, the planned scope and timing of the audit and significant audit findings, including any significant deficiencies in internal control that we identify during our audit.
Other Information
The directors are responsible for the other information presented with the financial statements. The other information comprises the information included in the directors’ report, but does not include the financial statements and our auditor’s report thereon.
Our opinion on the financial statements does not cover the other information and we do not express any form of assurance conclusion thereon.
In connection with our audit of the financial statements, our responsibility is to read the other information and, in doing so, consider whether the other information is materially inconsistent with the financial statements or our knowledge obtained in the audit or otherwise appears to be materially misstated. If, based on the work we have performed, we conclude that there is a material misstatement of this other information, we are required to report that fact. We have nothing to report in this regard.
Other Matter
This report has been prepared for and only for the Vantage Global Investment Fund and its directors in accordance with the terms of our engagement letter dated November 8, 2016 and for no other purpose. To the fullest extent permitted by law, we do not accept or assume any liability or duty of care for any other purpose or to any other person to whom this report is shown or into whose hands it may come save where expressly agreed by our prior consent in writing.
June 28, 2017

Annual report as of December 31, 2016 Vantage Global Investment Fund
The notes on pages 21 to 36 are an integral part of the financial statements.
18
Statement of Financial Position as at December 31
Note 2016 2015 $ $ Assets Current Assets Financial assets at fair value through profit or loss 150,385,885 121,492,821 (Cost: $154,976,803) (2015: $138,050,391) Loans and receivables Cash and deposit accounts 12,675,006 90,475,584 Margin accounts 7,548,380 16,637,889 Receivable on securities sales 1,132,557 247,483 Receivable on dividends 179,909 ‐ Interest receivable 13,708 ‐ Other assets and prepaid expenses 7,371 6,883 Total Assets 171,942,816 228,860,660 Equity
Founder shares 14 100 100 Total Equity 100 100 Liabilities Current Liabilities
Financial liabilities at fair value through profit or loss 3,119,936 1,495,203 (Proceeds: $1,458,056) (2015: $5,354,686) Financial liabilities measured at amortised cost Payable on securities purchased ‐ 2,302,419 Payable on redemptions 214,497 711,579 Fees payable 6 294,247 415,781 Total Liabilities 3,628,680 4,924,982
Net assets attributable to holders of Fund’s shares 168,314,036 223,935,578 Total Equity and Liabilities 171,942,816 228,860,660
Key Figures
2016 2015 Fund’s shares outstanding 375,284.88 504,178.93 Net asset value per Fund’s share in USD 448.50 444.16 Net assets attributable to holders of Fund’s shares 168,314,036 223,935,578
APPROVED ON BEHALF OF THE BOARD
Annual report as of December 31, 2016 Vantage Global Investment Fund
The notes on pages 21 to 36 are an integral part of the financial statements.
19
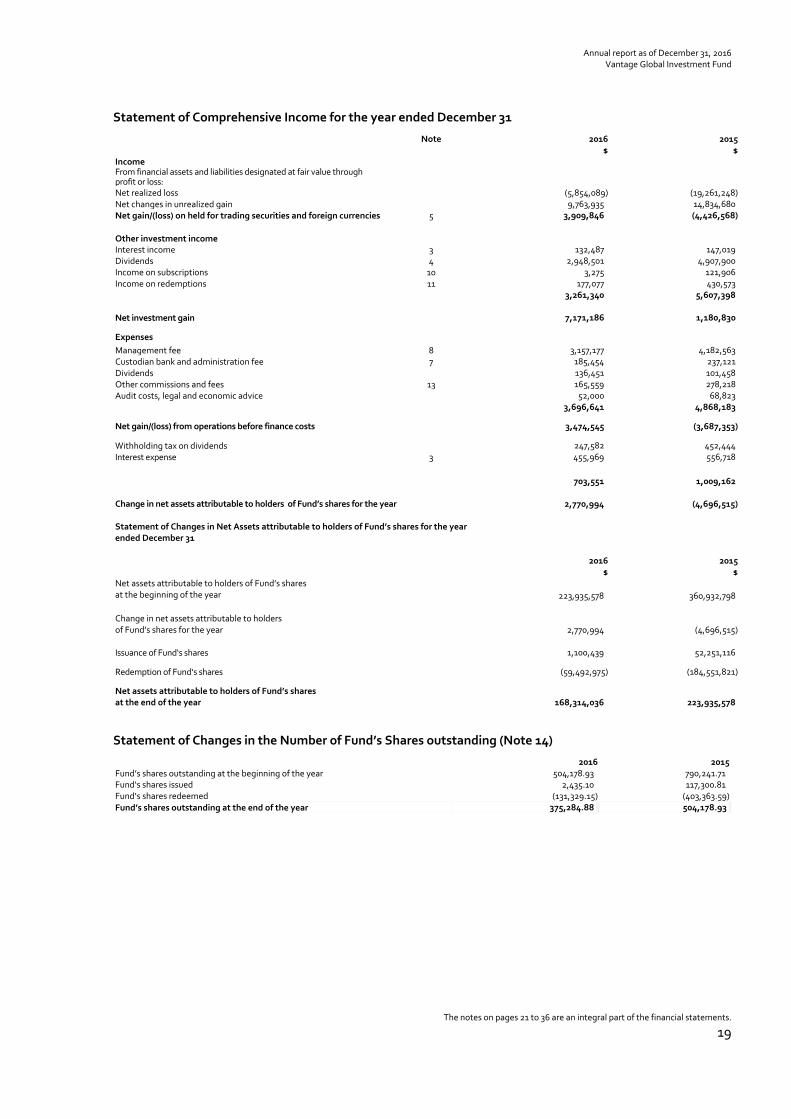
Statement of Comprehensive Income for the year ended December 31
Note 2016 2015 $ $
Income From financial assets and liabilities designated at fair value through profit or loss:
Net realized loss (5,854,089) (19,261,248) Net changes in unrealized gain 9,763,935 14,834,680 Net gain/(loss) on held for trading securities and foreign currencies 5 3,909,846 (4,426,568) Other investment income Interest income 3 132,487 147,019 Dividends 4 2,948,501 4,907,900 Income on subscriptions 10 3,275 121,906 Income on redemptions 11 177,077 430,573
3,261,340 5,607,398
Net investment gain 7,171,186 1,180,830
Expenses
Management fee 8 3,157,177 4,182,563 Custodian bank and administration fee 7 185,454 237,121 Dividends 136,451 101,458 Other commissions and fees 13 165,559 278,218 Audit costs, legal and economic advice 52,000 68,823 3,696,641 4,868,183
Net gain/(loss) from operations before finance costs 3,474,545 (3,687,353)
Withholding tax on dividends 247,582 452,444 Interest expense 3 455,969 556,718 703,551 1,009,162 Change in net assets attributable to holders of Fund’s shares for the year 2,770,994 (4,696,515) Statement of Changes in Net Assets attributable to holders of Fund’s shares for the year ended December 31 2016 2015
$ $ Net assets attributable to holders of Fund’s shares at the beginning of the year
223,935,578 360,932,798
Change in net assets attributable to holders of Fund’s shares for the year
2,770,994 (4,696,515)
Issuance of Fund‘s shares 1,100,439 52,251,116
Redemption of Fund‘s shares (59,492,975) (184,551,821)
Net assets attributable to holders of Fund’s shares at the end of the year
168,314,036 223,935,578
Statement of Changes in the Number of Fund’s Shares outstanding (Note 14)
2016 2015 Fund’s shares outstanding at the beginning of the year 504,178.93 790,241.71 Fund‘s shares issued 2,435.10 117,300.81 Fund‘s shares redeemed (131,329.15) (403,363.59) Fund’s shares outstanding at the end of the year 375,284.88 504,178.93

Annual report as of December 31, 2016 Vantage Global Investment Fund
The notes on pages 21 to 36 are an integral part of the financial statements.
20
Statement of Cash Flows for the year ended December 31
2016 2015 $ $ Cash Flows from Operating Activities Interest received 118,779 147,019 Dividends received 2,768,493 4,417,816 Interest paid (455,969) (556,718) Dividends paid (136,451) (103,522) Other income received 180,352 552,479 Payment of operating expenses (3,682,212) (5,009,038) Net payments from securities sold and purchased (20,939,372) 158,089,358 Realized gain on investments and options (4,696,830) (5,283,613) Realized loss on futures, forward foreign exchange contracts and foreign currency translation
(1,157,259) (13,977,635)
Net cash (used in)/ provided by operating activities (28,000,469) 138,276,146
Cash Flows from Financing Activities Proceeds from Fund’s shares issued 1,100,439 51,563,447 Payments for Fund’s shares redeemed (59,990,057) (184,183,112) Net cash used in financing activities (58,889,618) (132,619,665) Net (decrease)/ increase in cash and cash equivalents (86,890,087) 5,656,481 Cash and cash equivalents
Beginning of the year 107,113,473 101,456,992
End of the year 20,223,386 107,113,473

Notes to the Financial Statements
Annual report as of December 31, 2016 Vantage Global Investment Fund
21
Note 1 ‐ General
Vantage Global Investment Fund (the “Fund”) was incorporated on October 2, 1995 as an exempted company under the Companies Law (revised) of the Cayman Islands, and is regulated under The Mutual Funds Law (revised) of the Cayman Islands, as amended from time to time. The Fund’s registered office is located at MUFG Alternative Fund Services (Cayman) Ltd, P.O. Box 852 GT, 227 Elgin Avenue, George Town, Grand Cayman KY1‐1103, Cayman Islands.
The Fund is a single fund managed by Vantage Investment Management Limited (the “Manager”) which invests the assets of the Fund in a focused portfolio of shares, currencies and portfolio hedges.
MUFG Alternative Fund Services (Cayman) Limited serves as the administrator (the "Administrator") to the Fund. Note 2 ‐ Summary of significant accounting policies
The principal accounting policies applied in the preparation of these financial statements are set out below. These policies have been consistently applied to all the years presented, unless otherwise stated.
a) Basis of preparation
The Fund's financial statements have been prepared in accordance with International Financial Reporting Standards (“IFRS”) issued by International Accounting Standards Board (“IASB”). The financial statements have been prepared under the historical‐cost convention, as modified by the revaluation of the financial assets and financial liabilities held at fair value through profit or loss.
Standards, amendments and interpretations that are effective from 1 January 2016 and beyond:
(i) Standards and amendments to existing standards effective 1 January 2016 There are no standards, interpretations or amendments to existing standards that are effective for the first time for the financial year beginning 1 January 2016 that have had a material impact on the Fund. (ii) New standards, amendments and interpretations effective after 1 January 2016 and have not been early adopted At the date of authorization of the financial statements there were a number of other Standards and Interpretations which were in issue but not yet effective. Management anticipates that the adoption of these Standards and Interpretations in future periods will have no material impact on the financial statements of the Fund.
b) Accounting currency
The accounting records as well as the financial statements of the Fund are kept in the United States (“US”) dollars. US dollar (“$”) is the functional and reporting currency of the Fund as subscriptions and redemptions are performed in US dollars.
c) Use of estimates
The preparation of financial statements in accordance with IFRS requires management to make estimates and assumptions that affect the reported amounts of assets and liabilities and the disclosure of contingent assets and liabilities at the date of the financial statements and the reported amounts of income and expenses during the year. Actual results could differ from those estimates and assumptions. d) Valuation principles
The Fund’s value is calculated each week, based on the valuation of its underlying assets and liabilities pertaining as of the close of business on each Wednesday or at such other time as the Administrator with the approval of the Directors shall determine (termed the “Valuation Day”). All subscriptions and redemptions are based on the Fund’s Net Asset Value per Share, determined by the Administrator at values pertaining as of the close of business on the Valuation Day. The Fund’s value is calculated by the Administrator on the first Business Day in the Cayman Islands after the Valuation Day (termed the “Calculation Day”). The Net Asset Value per Share is expressed in US dollars and is determined by dividing the net assets of the Fund by the number of Shares in issue on the Valuation Day, excluding any subscriptions or redemptions scheduled for that Valuation Day. The net assets of the Fund comprise the principal aggregate of all the investments owned or contracted to be purchased by the Fund at their closing prices in their markets as of the Valuation day, plus any cash, bills, accrued interest, or other property of any kind as defined from time to time by the Directors, from which are deducted the management, custodial and administrative expenses, the value of any investments contracted to be sold, the aggregate amount of any borrowings, any interest or other charges, or other liabilities of any kind as defined from time to time by the Directors.
e) Financial instruments
I. Classification The Fund classifies its investments in debt and equity securities, underlying fund and derivatives as financial assets and liabilities at fair value through profit or loss. Financial assets that are classified as loans and receivables include cash and deposit accounts, margin accounts, receivable on securities sales and receivable on dividends. Financial liabilities measured at amortized cost include fees payable, payable on securities purchases, payable on redemptions and payable on dividends.
Annual report as of December 31, 2016 Vantage Global Investment Fund
22
II. Recognition, derecognition and initial measurement
The Fund recognizes financial assets or liabilities on the date it commits to purchase or sell the instrument. From this date, any gains and losses arising from changes in fair value of the assets or liabilities are recognized in the statement of comprehensive income. Financial instruments categorized at fair value through profit or losses are recognized initially at cost. For financial assets acquired, cost is the fair value of the consideration given, while for the financial liabilities, cost is the fair value of the consideration received. Transaction costs for such instruments are recognized directly in the statement of comprehensive income. Financial assets classified as loans and receivables are recognized on the day that they are transferred to the Fund at fair value plus transaction costs that are directly attributable to their acquisition or issue.
Financial assets are derecognized when the rights to receive cash flows from the investments have expired or the Fund has transferred substantially all risks and rewards of ownership.
Financial liabilities, other than those as at fair value through the profit or loss, are recognized initially at fair value plus transaction costs that are directly attributable to their acquisition or issue. Financial liabilities arising from the Fund’s shares are carried at the redemption amount representing the investors’ right to a residual interest in the Fund’s assets. Financial liabilities are not recognized unless one of the parties has performed.
A financial liability is derecognized when the obligation specified in the contract is discharged, cancelled or expired.
III. Subsequent measurement
Subsequent to initial recognition, the Fund measures all financial instruments classified at fair value through profit or loss at fair value with changes in the fair value recognized in the statement of comprehensive income. Fair value is the price that would be received to sell an asset or paid to transfer a liability in an orderly transaction between market participants at the measurement date. The fair value of financial assets and liabilities traded in active markets (such as publicly traded derivatives and trading securities) are based on quoted market prices at the close of trading on the reporting date. Prior to 1 January 2013, the quoted market price used for financial assets held by the Fund was the current bid price; the quoted market price for financial liabilities was the current asking price. The Fund adopted IFRS 13, ‘Fair value measurement’, from 1 January 2013; it changed its fair valuation input to utilise the last traded market price for both financial assets and financial liabilities where the last traded price falls within the bid‐ask spread. Financial assets classified as loans and receivables, and financial liabilities other than those as at fair value through the profit or loss, are measured at amortized cost.
IV. Unrealized gains and losses on subsequent measurement
Unrealized gains and losses arising from a change in the fair value of trading instruments during the year are recognized in the statement of comprehensive income.
In the case of any security which is listed or dealt in on more than one stock exchange, the Directors determine the stock exchange whose quotations shall be used in the determination of the value of such security.
In the case of any security for which no price quotations are available, the value thereof is determined from time to time in such manner as the Directors from time to time determine.
f) Conversion of foreign currencies
Foreign currency transactions are translated to US dollars at the foreign exchange rate ruling at the date of the transaction. Foreign currency assets and liabilities are translated to US dollars at the foreign exchange rate ruling at the statement of financial position date.
Foreign currency exchange differences arising from translation are included in the statement of comprehensive income.
Foreign currency exchange differences relating to financial assets and liabilities are included in the statement of comprehensive income within net gains from financial assets and liabilities.
g) Valuation of forward foreign exchange contracts
As part of the Fund’s investment strategy, the Fund enters into certain financial instruments including forward foreign exchange contracts. These forward foreign exchange contracts are initially recognized at fair value and subsequently re‐measured at their fair value.
The fair value of forward foreign exchange contracts is based upon the settlement prices from the recognized and regulated markets, with the resulting unrealized gain/(loss) recorded in the statement of comprehensive income.
Fair value estimates are made at a specific point in time, based on the market conditions and information about the financial instrument. These estimates are subjective in nature and involve uncertainties and matters of significant judgement. Hence, changes in assumptions could significantly affect the estimates.

Annual report as of December 31, 2016 Vantage Global Investment Fund
23
At December 31, 2016, the Fund was committed to the following amounts as a result of outstanding forward foreign exchange contracts:
Sold Currency Bought Currency Maturity
Date
Unrealized gain/(loss)
$
AUD1,830,195 USD1,361,692 03.31.2017 45,334
AUD3,900,370 USD2,886,957 03.31.2017 81,635
CAD900,000 USD687,053 03.31.2017 16,722
CHF1,633,513 EUR1,521,233 03.31.2017 (4,873)
CNH18,651,179 USD2,654,203 03.31.2017 39,196
CNH31,880,671 USD4,527,171 03.31.2017 57,311
CNY10,984,000 USD1,600,000 01,23.2017 34,056
USD3,170,728 DKK22,027,558 03.31.2017 (38,415)
DKK28,650,055 USD4,096,875 03.31.2017 22,844
EUR839,195 USD892,567 03.31.2017 5,803
EUR5,029,594 USD5,300,000 03.31.2017 (14,686)
NOK8,091,000 EUR941,741 03.31.2017 (27)
USD10,478,377 GBP8,291,141 03.31.2017 (223,521)
HKD98,899,870 USD12,740,020 03.31.2017 (14,835)
USD1,198,805 HKD9,300,000 03.31.2017 592
JPY280,000,000 USD2,542,448 03.31.2017 137,350
JPY2,093,687,162 USD18,169,305 03.31.2017 185,299
KRW4,165,619,313 USD3,562,993 03.31.2017 113,234
KRW1,322,504,061 USD1,131,181 06.30.2017 35,032
USD1,110,000 KRW1,322,504,061 06.30.2017 (13,851)
SGD1,240,549 USD863,653 03.31.2017 6,567
USD2,101,998 SGD3,008,793 03.31.2017 (23,245)
TWD476,531,289 USD15,012,062 03.31.2017 309,298
ZAR101,046,469 USD7,189,345 03.31.2017 (42,931)
ZAR26,658,183 USD1,866,200 03.31.2017 (41,826)
At December 31, 2015, the Fund was committed to the following amounts as a result of outstanding forward foreign exchange contracts:
Sold Currency Bought Currency Maturity
Date
Unrealized gain/(loss)
$
USD2,230,000 CNY14,706,119 08.18.2016 (44,994)
USD3,299,491 KRW3,903,627,750 03.30.2016 16,409
USD1,200,000 MYR5,211,840 03.30.2016 7,104
USD570,441 SEK4,948,793 03.30.2016 17,374
USD2,300,000 SGD3,256,487 03.03.2016 (9,080)
USD2,300,000 SGD3,256,904 03.03.2016 (8,787)
USD2,300,000 TWD75,508,972 03.03.2016 (14,247)
USD2,400,000 TWD78,912,000 03.30.2016 (10,981)
USD1,000,000 ZAR15,158,335 03.03.2016 (31,712)
CAD900,000 USD646,113 06.30.2016 (4,699)
CNH12,564,858 USD1,900,000 11.28.2016 45,842
CNH31,880,671 USD4,816,607 03.30.2016 24,627
CNH6,086,321 USD900,000 11.28.2016 1,860
CNY14,671,677 USD2,230,000 08.18.2016 50,111
CNY34,442 USD5,117 08.18.2016 ‐
DKK4,245,877 USD621,289 03.30.2016 1,627
EUR2,098,246 USD2,300,000 06.30.2016 8,559
EUR11,100,000 USD12,130,746 06.30.2016 8,717
GBP1,070,793 USD1,600,000 03.30.2016 21,842
JPY1,530,000,000 USD12,692,777 06.30.2016 (105,453)
JPY133,719,850 USD1,100,000 03.30.2016 (15,009)
KRW1,063,312,380 USD900,000 03.30.2016 (3,221)
KRW15,988,801,674 USD13,520,042 03.30.2016 (61,494)
KRW2,728,175,360 USD2,300,000 03.30.2016 (17,423)
MYR5,211,810 USD1,202,263 03.30.2016 (4,834)
SGD1,774,970 USD1,250,000 03.03.2016 1,319
SGD1,771,108 USD1,250,000 03.03.2016 4,036
SGD1,657,352 USD1,170,000 03.03.2016 4,063
SGD1,309,961 USD924,409 03.30.2016 3,592
TWD405,140,779 USD12,383,946 03.30.2016 118,522
TWD75,864,240 USD2,300,000 03.30.2016 3,250
TWD59,526,000 USD1,800,000 03.03.2016 (1,928)
ZAR9,274,936 USD630,665 03.30.2016 41,007
ZAR15,139,100 USD1,000,000 03.30.2016 37,525
ZAR13,693,707 USD900,000 03.30.2016 29,416
ZAR15,158,335 USD989,036 03.03.2016 20,749
ZAR47,283,045 USD3,069,414 03.30.2016 63,372
ZAR7,747,698 USD500,000 03.30.2016 7,437
h) Valuation of financial futures contracts
Derivative financial instruments including financial futures contracts are initially recognized in the statement of financial position at fair value and subsequently re‐measured at their fair value. Fair values are obtained from quoted market prices. All financial futures contracts are carried in current assets when amounts are receivable by the Fund and in current liabilities when amounts are payable by the Fund. Changes in fair values of financial futures contracts are included in the statement of comprehensive income.
Realized profits and losses are determined following the FIFO‐Method (First In First Out). i) Dividend and interest income
Dividend income from financial assets at fair value through profit or loss is recognized in the statement of comprehensive income within dividend income when the Fund’s right to receive payment is established.
Interest income is recognized in the statement of comprehensive income for all interest bearing instruments using the effective yield method. Interest income may include coupons earned on fixed income investment and trading securities and accrued discount on treasury bonds, commercial papers, floating rate notes and other discounted instruments.
j) Cash and cash equivalents
Cash comprises cash on hand and demand deposits. Cash equivalents are short term, highly liquid investments with maturities of three months or less when purchased.
For the purpose of the statement of cash flows, cash and cash equivalents includes cash and deposit accounts and margin accounts.
k) Margin accounts and receivable on securities sales
This account represents cash positions held with the broker as margin to carry its exchange traded future contracts’ transactions. These cash positions and/or securities held by the broker serve as collateral for any amounts due to broker. The Fund is subject to credit risk if the broker is unable to repay both initial and maintenance margin balances due in their custody. The cash balances and/or securities also serve as collateral for potential defaults of the Fund. l) Fees and commission expense
Fees and commission expense are recognized in the profit or loss as the related services are performed.
m) Taxation
Under current legislation in the Cayman Islands there is no income, estate, corporate, capital gain or other taxes payable by the Fund.
The Fund may be subject to foreign withholding tax on certain interest, dividends and capital gains.

Annual report as of December 31, 2016 Vantage Global Investment Fund
24
n) Offsetting financial instruments
Financial assets and liabilities are offset and the net amount reported in the statement of financial position where the Fund currently has a legally enforceable right to set‐off the recognised amounts and there is an intention to settle on a net basis or realise the asset and settle the liability simultaneously. Note 3 ‐ Interest income and expenses
Interest income and expense arises from:
2016 2015 $ $
Interest income for financial assets that are at fair value through profit or loss and at amortized cost 132,487 147,019
Total interest income 132,487 147,019
Interest expense for financial liabilities that are at fair value through profit or loss and at amortized cost 455,969 556,718
Total interest expense 455,969 556,718
Note 4 ‐ Dividend income
2016 2015 $ $ Designated at fair value through profit or loss upon initial recognition
‐ Equity securities 2,948,501 4,907,900
Total dividend income 2,948,501 4,907,900
Note 5 ‐ Net gain/(loss) on held for trading securities and foreign currencies
Net gain on held for trading securities and foreign currencies can be summarized as follows:
2016 $
2015 $
Realized loss on securities (4,696,830) (12,685,455) Realized loss on currencies (1,157,259) (6,575,793)
Net realized loss (5,854,089) (19,261,248)
Net change in unrealized gain on securities 5,977,723 9,424,947 Net change in unrealized gain on currencies 3,786,212 5,409,733
Net change in unrealized gain 9,763,935 14,834,680
Net gain (loss) on held for trading securities and foreign currencies 3,909,846 (4,426,568)
Note 6 ‐ Fees payable
The detail of fees payable is as follows:
2016 2015
$ $
Management fees 220,502 342,227 Administration fees 38,245 42,054 Audit fee 31,500 31,500 Other fees 4,000 ‐
TOTAL 294,247 415,781
Note 7 ‐ Administrator's fee
The Administrator receives their fees on the basis of eight basis points (0.08%) per annum of the weekly average net assets of the Fund.
Note 8 ‐ Manager’s and Performance fee
The Manager’s fee is designed to align the interest of the Manager and those of investors in the Fund, who seek returns exceeding those attainable from investing in risk free securities without exposing their investment to the volatility normally associated with investing in global equities. The Manager’s Fee is determined by the Administrator each week on the Calculation Day and charged to the Fund. It consists of: ‐ a base fee of 1.5% per annum of the weekly net asset value; ‐ a Performance fee of 15% of the incremental value added. The incremental value added is determined as of each valuation day as follows: The value added return is calculated for the period since the prior valuation day as the difference between the return of the Fund’s shares after deducting all expenses other than the Performance fee, and the return of the risk free securities in the currency benchmark mix. The cumulative value added return is calculated as the accumulation of the weekly value added returns since the inception of the Fund. The incremental value added return is calculated as the ratio difference between the cumulative value added return on the current valuation day and the cumulative value added return at which the last Performance Fee was charged within the previous 52‐week period. The incremental value added is calculated as the incremental value added return multiplied by the net asset value of the Fund after all subscriptions and redemptions on the prior valuation day. The incremental value added is taken as zero if the incremental value added return is negative.
Note 9 ‐ Dividend distribution policy
The Fund does not anticipate paying dividends, other than if required to do so in order to maintain the Reporting Fund Status designated by United Kingdom HM Revenue & Customs (“UK HMRC”) or a similarly advantageous tax classification in another jurisdiction important to the Fund’s shareholders. Absent such a requirement, the Fund will retain all dividends, interest and other income derived from its assets, and this will be reflected in the Net Asset Value of the Fund.
For the year ended December 31, 2016, the Fund did not declare dividends (2015: $Nil).

Annual report as of December 31, 2016 Vantage Global Investment Fund
25
Note 10 ‐ Income on subscriptions
The income from subscriptions corresponds to the difference between the issue price and the net asset value per share. The issue price is rounded up to the next monetary unit. The transaction cost which is determined with reference to the underlying investment portfolio is currently set at 0.3% of the net asset value per share.
Note 11 ‐ Income on redemptions
The income from redemptions corresponds to the difference between the redemption price and the net asset value per share. The redemption price is rounded up to the next monetary unit. The transaction cost which is determined with reference to the underlying investment portfolio is currently set at 0.3% of the net asset value per share.
Note 12 ‐ Risks associated with the investments and financial instruments held by the Fund
Associated risks: The Fund’s investment activities expose it to the various types of risk which are associated with the financial instruments and markets in which it invests. The following summary is not intended to be a comprehensive summary of all risks and investors should refer to the prospectus for a more detailed discussion of the risks inherent in investing in the Fund.
Currency and exchange risk: Currency exposures significantly influence global investment returns. Traditionally, investment managers consider the forecast combined return of an equity in its local currency, and the return of that currency relative to a Fund’s base currency, when evaluating an investment in an equity. The Manager does not follow this traditional approach, but rather selects equities with forecast real returns in their local currencies considerably in excess of the real returns generally forecast for global equities. Should the Manager believe the future value of the associated currencies to be vulnerable, they are then hedged into currencies whose future values are expected to strengthen. Very often attractive equity investment opportunities are available in countries with vulnerable currencies. Hence the Fund’s currency deployment will frequently differ significantly from its deployment of equities by country. In attempting to meet the needs of disparate global investors who have differing domestic or reference currencies, and who recognize the need to generate returns not solely in their domestic currencies, but rather in a mix of the rest of the World’s currencies, the Directors have defined a Currency Benchmark. The weightings of the constituent currencies in this Currency Benchmark approximate the proportion of global trade made up by the countries in each currency block. These weightings may be altered from time to time by the Directors to reflect large shifts in the relative sizes of each currency block’s significance in the MS World Index (MSWI) and in global trade.
The weightings of each currency block in the Currency Benchmark are as follows:
US Dollar 40%
Euro 20%
UK pound 10%
Japanese Yen 10%
Singapore dollar 10%
Swiss Franc 5%
Canadian dollar 2.5%
Australian dollar 2.5%
The Currency Benchmark represents a “neutral currency position” for the Fund. The Fund’s currency deployment will deviate from this “neutral currency position” to the extent that the Manager actively chooses to overweight or underweight certain currencies and/or currency blocks. If the Manager is neutral on the relative attractiveness of all currencies, the Fund’s currency deployment will be in‐line with the weightings in the Currency Benchmark. It follows that the Fund’s performance is most appropriately measured in terms of return and risk in Currency Benchmark units, and not in US dollars. The Manager may seek to hedge against a decline in the value of the Fund’s investments resulting from currency devaluations or fluctuations but only when suitable hedging instruments are available on a timely basis and on acceptable terms. There is no assurance that any hedging transactions engaged in by the Fund will be successful in protecting against currency devaluations or fluctuations. The Fund is valued in US dollar and fluctuates in accordance with changes in the foreign exchange rates between the US dollar and other relevant currencies. Shareholders’ investments in the Fund and cash distributions from the Fund are made in US dollars, and currency conversions are required prior to the Fund making portfolio investments and distributing any income and realization proceeds from the Fund investments. There can be no assurance that fluctuations in exchange rates do not have an adverse effect on the net asset value, on the funds available for investment after conversion of the US dollar proceeds of the Placing or on the distributions received by shareholders in US dollars after conversion of the income and realization proceeds from the Fund’s investments (which are not necessarily denominated in US dollars).
Annual report as of December 31, 2016 Vantage Global Investment Fund
26
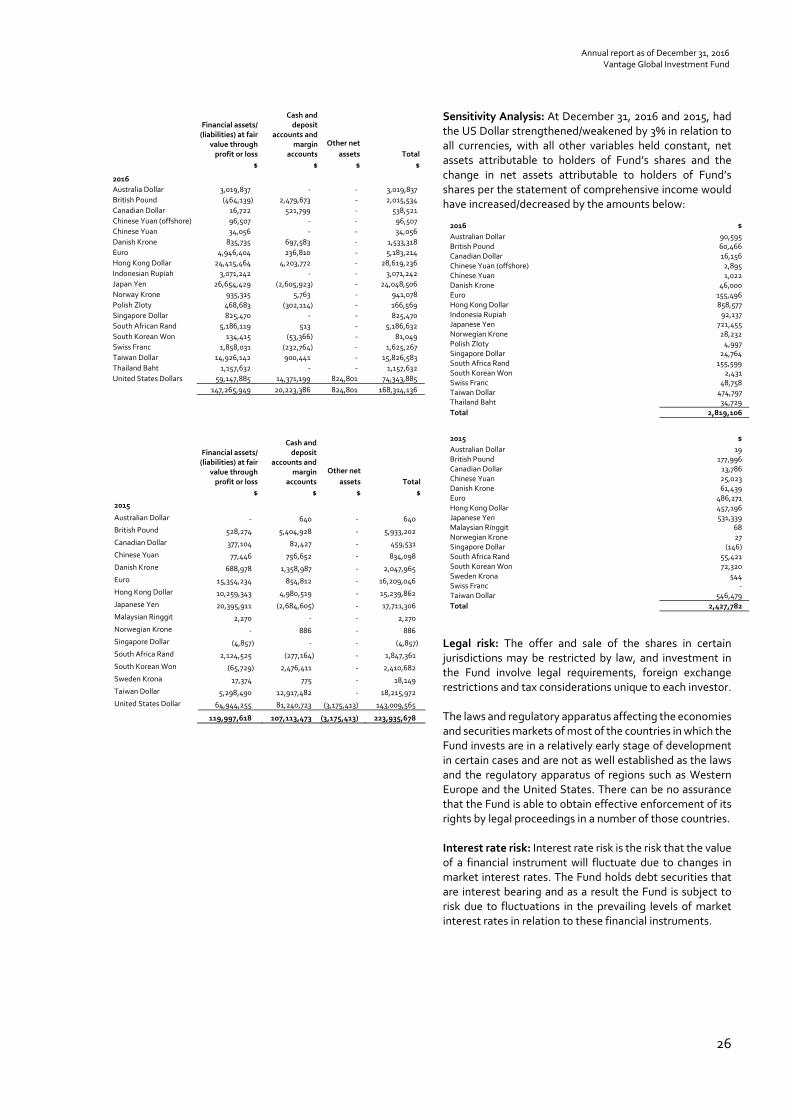
Financial assets/ (liabilities) at fair
value through profit or loss
$
Cash and deposit
accounts and margin
accounts
$
Other net
assets
$
Total
$
2016
Australia Dollar 3,019,837 ‐ ‐ 3,019,837
British Pound (464,139) 2,479,673 ‐ 2,015,534
Canadian Dollar 16,722 521,799 ‐ 538,521
Chinese Yuan (offshore) 96,507 ‐ ‐ 96,507
Chinese Yuan 34,056 ‐ ‐ 34,056
Danish Krone 835,735 697,583 ‐ 1,533,318
Euro 4,946,404 236,810 ‐ 5,183,214
Hong Kong Dollar 24,415,464 4,203,772 ‐ 28,619,236
Indonesian Rupiah 3,071,242 ‐ ‐ 3,071,242
Japan Yen 26,654,429 (2,605,923) ‐ 24,048,506
Norway Krone 935,315 5,763 ‐ 941,078
Polish Zloty 468,683 (302,114) ‐ 166,569
Singapore Dollar 825,470 ‐ ‐ 825,470
South African Rand 5,186,119 513 ‐ 5,186,632
South Korean Won 134,415 (53,366) ‐ 81,049
Swiss Franc 1,858,031 (232,764) ‐ 1,625,267
Taiwan Dollar 14,926,142 900,441 ‐ 15,826,583
Thailand Baht 1,157,632 ‐ ‐ 1,157,632
United States Dollars 59,147,885 14,371,199 824,801 74,343,885
147,265,949 20,223,386 824,801 168,314,136
Financial assets/ (liabilities) at fair
value through profit or loss
$
Cash and deposit
accounts and margin
accounts
$
Other net
assets
$
Total
$
2015
Australian Dollar ‐ 640 ‐ 640
British Pound 528,274 5,404,928 ‐ 5,933,202
Canadian Dollar 377,104 82,427 ‐ 459,531
Chinese Yuan 77,446 756,652 ‐ 834,098
Danish Krone 688,978 1,358,987 ‐ 2,047,965
Euro 15,354,234 854,812 ‐ 16,209,046
Hong Kong Dollar 10,259,343 4,980,519 ‐ 15,239,862
Japanese Yen 20,395,911 (2,684,605) ‐ 17,711,306
Malaysian Ringgit 2,270 ‐ ‐ 2,270
Norwegian Krone ‐ 886 ‐ 886
Singapore Dollar (4,857) ‐ ‐ (4,857)
South Africa Rand 2,124,525 (277,164) ‐ 1,847,361
South Korean Won (65,729) 2,476,411 ‐ 2,410,682
Sweden Krona 17,374 775 ‐ 18,149
Taiwan Dollar 5,298,490 12,917,482 ‐ 18,215,972
United States Dollar 64,944,255 81,240,723 (3,175,413) 143,009,565
119,997,618 107,113,473 (3,175,413) 223,935,678
Sensitivity Analysis: At December 31, 2016 and 2015, had the US Dollar strengthened/weakened by 3% in relation to all currencies, with all other variables held constant, net assets attributable to holders of Fund’s shares and the change in net assets attributable to holders of Fund’s shares per the statement of comprehensive income would have increased/decreased by the amounts below:
2016 $
Australian Dollar 90,595 British Pound 60,466 Canadian Dollar 16,156 Chinese Yuan (offshore) 2,895 Chinese Yuan 1,022 Danish Krone 46,000 Euro 155,496 Hong Kong Dollar 858,577 Indonesia Rupiah 92,137 Japanese Yen 721,455 Norwegian Krone 28,232 Polish Zloty 4,997 Singapore Dollar 24,764 South Africa Rand 155,599 South Korean Won 2,431 Swiss Franc 48,758 Taiwan Dollar 474,797 Thailand Baht 34,729
Total 2,819,106
2015 $
Australian Dollar 19 British Pound 177,996 Canadian Dollar 13,786 Chinese Yuan 25,023 Danish Krone 61,439 Euro 486,271 Hong Kong Dollar 457,196 Japanese Yen 531,339 Malaysian Ringgit 68 Norwegian Krone 27 Singapore Dollar (146) South Africa Rand 55,421 South Korean Won 72,320 Sweden Krona 544 Swiss Franc ‐ Taiwan Dollar 546,479
Total 2,427,782
Legal risk: The offer and sale of the shares in certain jurisdictions may be restricted by law, and investment in the Fund involve legal requirements, foreign exchange restrictions and tax considerations unique to each investor. The laws and regulatory apparatus affecting the economies and securities markets of most of the countries in which the Fund invests are in a relatively early stage of development in certain cases and are not as well established as the laws and the regulatory apparatus of regions such as Western Europe and the United States. There can be no assurance that the Fund is able to obtain effective enforcement of its rights by legal proceedings in a number of those countries. Interest rate risk: Interest rate risk is the risk that the value of a financial instrument will fluctuate due to changes in market interest rates. The Fund holds debt securities that are interest bearing and as a result the Fund is subject to risk due to fluctuations in the prevailing levels of market interest rates in relation to these financial instruments.

Annual report as of December 31, 2016 Vantage Global Investment Fund
27
The following table details the Funds exposure to interest rate risk:
2016 Less than
1 year More than
1year Non‐interest
bearing Total
$ $ $ $
Assets
Financial assets at fair value through profit or loss ‐ ‐ 150,385,885 150,385,885 Cash and deposit accounts 12,675,006 ‐ ‐ 12,675,006
Margin accounts 7,548,380 ‐ ‐ 7,548,380 Receivable on securities sales ‐ ‐ 1,132,557 1,132,557
Receivable on dividends ‐ ‐ 179,909 179,909
Interest receivable ‐ ‐ 13,708 13,708 Other assets and prepaid expenses ‐ ‐ 7,371 7,371
Total assets 20,223,386 ‐ 151,719,430 171,942,816
Liabilities
Financial liabilities at fair value through profit or loss ‐ ‐ (3,119,936) (3,119,936)
Payable on redemptions ‐ ‐ (214,497) (214,497)
Fees payable ‐ ‐ (294,247) (294,247)
Total liabilities ‐ ‐ (3,628,680) (3,628,680)
Total interest sensitivity gap 20,223,386 ‐ 148,090,750 168,314,136
2015 Less than
1 year More than
1year Non‐interest
bearing Total
$ $ $ $
Assets
Financial assets at fair value through profit or loss ‐ ‐ 121,492,821 121,492,821 Cash and deposit accounts 90,475,584 ‐ ‐ 90,475,584
Margin accounts 16,637,889 ‐ ‐ 16,637,889
Receivable on dividends ‐ ‐ 247,483 247,483 Other assets and prepaid expenses ‐ ‐ 6,883 6,883
Total assets 107,113,473 ‐ 121,747,187 228,860,660
Liabilities
Financial liabilities at fair value through profit or loss ‐ ‐ (1,495,203) (1,495,203) Payable on securites purchased ‐ ‐ (2,302,419) (2,302,419)
Payable on redemptions ‐ ‐ (711,579) (711,579)
Fees payable ‐ ‐ (415,781) (415,781)
Total liabilities ‐ ‐ (4,924,982) (4,924,982)
Total interest sensitivity gap 107,113,473 ‐ 116,822,205 223,935,678
Liquidity risk: The economies and securities markets of a number of the countries in which the Fund invests are substantially less developed in this regard than those of other geographical regions such as the United States and Western Europe, it may be considerably more difficult for the portfolio investments of the Fund to be liquidated than it would be based in more developed areas.
Less than 1
month 1‐ 6 months $ $
2016
Financial liabilities at fair value through profit or loss ‐ 3,139,169 Payable on securities purchased ‐ ‐ Payable on redemptions 214,497 ‐
Fees payable ‐ 294,247
214,497 3,433,416
Less than 1
month 1‐ 6 months $ $
2015
Financial liabilities at fair value through profit or loss ‐ 1,495,203 Payable on securities purchased 2,302,419 ‐ Payable on redemptions 711,579 ‐
Fees payable ‐ 415,781
3,013,998 1,910,984
Political and economic risk: The value of the Fund’s assets and of an investment in the Fund may be adversely affected by changes in government policies, which may include changes in economic policy and taxation, restrictions on foreign investment and on foreign currency repatriation. Investments of the Fund may also be affected by any significant change in political, social or economic policy or circumstances in these markets.
Credit risk: Financial assets which potentially expose the Fund to credit risk consist principally of cash balances and deposits with and receivables from banks. The extent of the Fund’s exposure to credit risk in respect of these financial assets approximates their carrying value as recorded in the Fund’s statement of financial position.
The Fund has prime brokerage agreements with brokerage firms to carry its accounts as a customer. The brokers have custody of the Fund’s investments and, from time to time, cash balances which may be due from the brokers.
These securities and/or cash positions serve as collateral for any amounts due to broker or as collateral for the open swap contracts, forward currency contracts, options, investments sold, not yet purchased or investments purchased on margin. The securities and/or cash positions also serve as collateral for potential defaults of the Fund.
The Fund is subject to credit risk to the extent that the broker may be unable to fulfill their obligations either to return the Fund’s securities or repay amounts owed. In the normal course of its investment activities, the Fund may be required to pledge investments as collateral, whereby the prime brokers have the right, under the terms of the prime brokerage agreements, to sell or repledge the securities if the Fund is unable to meet its margin requirements.
It is the policy of the Fund to transact the securities and contractual commitment activity with brokers‐dealers, banks and regulated exchanges that the Manager considers to be well established.
Risks associated with Futures:
In the normal course of the Fund’s trading operations, it enters into futures contracts which, by their nature, are defined to have “off‐balance sheet risk”. Generally, these financial instruments represent contractual obligations to buy or sell financial instruments on a future date at a specified price established in an organized market.
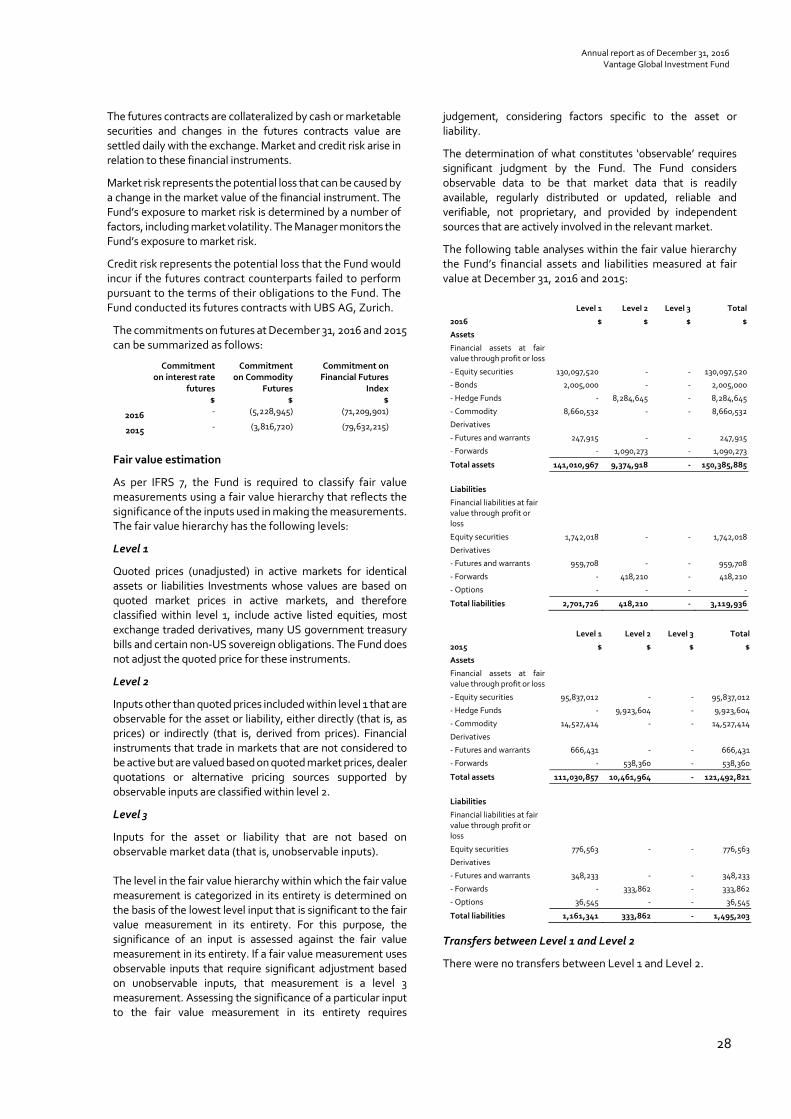
Annual report as of December 31, 2016 Vantage Global Investment Fund
28
The futures contracts are collateralized by cash or marketable securities and changes in the futures contracts value are settled daily with the exchange. Market and credit risk arise in relation to these financial instruments.
Market risk represents the potential loss that can be caused by a change in the market value of the financial instrument. The Fund’s exposure to market risk is determined by a number of factors, including market volatility. The Manager monitors the Fund’s exposure to market risk.
Credit risk represents the potential loss that the Fund would incur if the futures contract counterparts failed to perform pursuant to the terms of their obligations to the Fund. The Fund conducted its futures contracts with UBS AG, Zurich.
The commitments on futures at December 31, 2016 and 2015 can be summarized as follows:
Commitment on interest rate
futures $
Commitment on Commodity
Futures $
Commitment on Financial Futures
Index $
2016 ‐ (5,228,945) (71,209,901)
2015 ‐ (3,816,720) (79,632,215)
Fair value estimation
As per IFRS 7, the Fund is required to classify fair value measurements using a fair value hierarchy that reflects the significance of the inputs used in making the measurements. The fair value hierarchy has the following levels:
Level 1
Quoted prices (unadjusted) in active markets for identical assets or liabilities Investments whose values are based on quoted market prices in active markets, and therefore classified within level 1, include active listed equities, most exchange traded derivatives, many US government treasury bills and certain non‐US sovereign obligations. The Fund does not adjust the quoted price for these instruments.
Level 2
Inputs other than quoted prices included within level 1 that are observable for the asset or liability, either directly (that is, as prices) or indirectly (that is, derived from prices). Financial instruments that trade in markets that are not considered to be active but are valued based on quoted market prices, dealer quotations or alternative pricing sources supported by observable inputs are classified within level 2.
Level 3
Inputs for the asset or liability that are not based on observable market data (that is, unobservable inputs). The level in the fair value hierarchy within which the fair value measurement is categorized in its entirety is determined on the basis of the lowest level input that is significant to the fair value measurement in its entirety. For this purpose, the significance of an input is assessed against the fair value measurement in its entirety. If a fair value measurement uses observable inputs that require significant adjustment based on unobservable inputs, that measurement is a level 3 measurement. Assessing the significance of a particular input to the fair value measurement in its entirety requires
judgement, considering factors specific to the asset or liability.
The determination of what constitutes ‘observable’ requires significant judgment by the Fund. The Fund considers observable data to be that market data that is readily available, regularly distributed or updated, reliable and verifiable, not proprietary, and provided by independent sources that are actively involved in the relevant market.
The following table analyses within the fair value hierarchy the Fund’s financial assets and liabilities measured at fair value at December 31, 2016 and 2015:
Level 1 Level 2 Level 3 Total
2016 $ $ $ $
Assets
Financial assets at fair value through profit or loss
‐ Equity securities 130,097,520 ‐ ‐ 130,097,520
‐ Bonds 2,005,000 ‐ ‐ 2,005,000
‐ Hedge Funds ‐ 8,284,645 ‐ 8,284,645
‐ Commodity 8,660,532 ‐ ‐ 8,660,532
Derivatives
‐ Futures and warrants 247,915 ‐ ‐ 247,915
‐ Forwards ‐ 1,090,273 ‐ 1,090,273
Total assets 141,010,967 9,374,918 ‐ 150,385,885
Liabilities
Financial liabilities at fair value through profit or loss
Equity securities 1,742,018 ‐ ‐ 1,742,018
Derivatives
‐ Futures and warrants 959,708 ‐ ‐ 959,708
‐ Forwards ‐ 418,210 ‐ 418,210
‐ Options ‐ ‐ ‐ ‐
Total liabilities 2,701,726 418,210 ‐ 3,119,936
Level 1 Level 2 Level 3 Total
2015 $ $ $ $
Assets
Financial assets at fair value through profit or loss
‐ Equity securities 95,837,012 ‐ ‐ 95,837,012
‐ Hedge Funds ‐ 9,923,604 ‐ 9,923,604
‐ Commodity 14,527,414 ‐ ‐ 14,527,414
Derivatives
‐ Futures and warrants 666,431 ‐ ‐ 666,431
‐ Forwards ‐ 538,360 ‐ 538,360
Total assets 111,030,857 10,461,964 ‐ 121,492,821
Liabilities
Financial liabilities at fair value through profit or loss
Equity securities 776,563 ‐ ‐ 776,563
Derivatives
‐ Futures and warrants 348,233 ‐ ‐ 348,233
‐ Forwards ‐ 333,862 ‐ 333,862
‐ Options 36,545 ‐ ‐ 36,545
Total liabilities 1,161,341 333,862 ‐ 1,495,203
Transfers between Level 1 and Level 2
There were no transfers between Level 1 and Level 2.

Annual report as of December 31, 2016 Vantage Global Investment Fund
29
Offsetting and amounts subject to master netting arrangements and similar agreements As at 31 December 2016 and 2015 the Fund was subject to two master netting arrangements with its derivative counterparties. All of the derivative assets and liabilities of the Fund are held with these counterparties and the margin balance maintained by the Fund is for the purpose of providing collateral on derivative positions. The following tables present the Fund’s financial assets and liabilities subject to offsetting, enforceable master netting arrangements and similar agreements. The tables are presented by type of financial instrument. Financial assets subject to offsetting, enforceable master netting arrangements and similar agreements:
Description
Gross amounts
of recognized
financial assets
Gross amounts
of recognized
financial liabilities set‐off in
the statement of financial position
Net amounts
of financial assets
presented in the
statment of financial
position
Related amounts not
set‐off –financial
instruments
Related amounts not set‐
off – cash collateral Net amount
2016 derivative assets 10,017,953 ‐ 10,017,953 (1,397,151) ‐ 8,620,802
2015 derivative assets 15,732,205 ‐ 15,732,205 (718,640) ‐ 15,013,565
Description
Gross amounts
of recognized
financial liabilities
Gross amounts
of recognized
financial assets
set‐off in the
statement of financial position
Net amounts
of financial liabilities
presented in the
statment of financial
position
Related amounts not
set‐off –financial
instruments
Related amounts not set‐
off – cash collateral Net amount
2016 derivative liabilities (1,397,151) ‐ (1,397,151) 1,397,151 ‐ ‐
2015 derivative liabilities 718,640 ‐ 718,640 (718,640) ‐ ‐
Note 13 ‐ Related parties
Parties are considered to be related if one party has the ability to control the other party or exercise significant influence over the other party in making financial or operational decisions. The Fund is managed by the Manager under the terms of the Management Agreement dated January 26, 1996, under which the Manager provides management, secretarial, registrar and administrative services to the Fund. The Manager receives from the Fund in return, a fee based on the net asset value of the Fund as disclosed in note 8.
During the year, the Fund paid management fees to the Manager, as disclosed in the statement of comprehensive income.
Parties related to the Manager held shares in the Fund during the year as follows:
2016 2015 Opening balance 126,496.69 68,661.45
New shares 523.78 57,835.24
Disposals (420.88) ‐
Closing balance 126,599.59 126,496.69
As at December 31, 2016, the Fund had an investment in Vantage World Equity Fund (a related party under common directorship and manager) with fair value of $8,284,645 (2015: $9,923,604) which constitutes 4.92% (2015: 4.43%) of the Fund’s net assets. The Fund is not charged any management and performance fees in respect to this investment.
The total directors’ fees paid for the year ended December 31, 2016 was $17,172 (2015:$ 8,686). This amount has been fully settled during the year. The said fees are included in “other commissions and fees” in the statement of comprehensive income.
Note 14 ‐ Share Capital
The authorized share capital of the Fund is US$50,000 divided into two classes, namely 100 Founders Shares of US$ 1 par value each, and 4,990,000 Fund’s shares of US$ 0.01 par value each (the “Shares”).
The Manager holds the Founder Shares, which are voting shares, that do not participate in the investment gain or loss of the Fund, do not receive dividends, and may not be redeemed unless all other Shares in the Fund have been redeemed, and then only at par value.
The Fund’s shares are non voting shares and when issued are entitled to participate equally in the profit and dividends, if any, of the Fund and in the capital and assets allocable by the company to the shares upon liquidation.
Investors subscribing for Shares pay the Subscription Price. The Subscription Price is calculated by the Administrator on the Calculation Day, and corresponds to the Net Asset Value per Share on the Valuation Day plus the Transaction Cost.
Investors redeeming Shares receive the Redemption Price. The Redemption Price is calculated by the Administrator on the Calculation Day, and corresponds to the Net Asset Value per Share on the Valuation Day less the Transaction Cost. Note 15 ‐ Employees
The Fund has no employees (2015: Nil).
Note 16 ‐ Post balance sheet events
There were no material post balance sheet events which have a bearing on the understanding of the financial statements other than those mentioned in the following paragraph.
Subsequent to year end through the date of the authorization of the financial statements, the Fund had capital subscriptions and redemptions of $642,287 and $2,783,677, respectively.

Annual report as of December 31, 2016 Vantage Global Investment Fund
30
Note 17 ‐ Financial assets at fair value through profit or loss ‐ Investment in securities: Long (unaudited) Ordinary Shares
Financial assets Financial assets
at fair value at fair value as a %
through profit or loss Cost in USD as at Quantity/ through profit or loss of Net
Description 31.12.2015 31.12.2016 Nominal 31.12.2016 Assets
Australia AUD Myer Holdings Ord Shs ‐ 1,108,012 1,169,632 1,163,438 0.69% AUD Woodside Petroleum Ord Shs ‐ 1,774,490 77,000 1,729,430 1.03% ‐ 2,882,502 2,892,868 1.72%
Austria EUR OMV Ord Shs 2,332,920 ‐ ‐ ‐ ‐ 2,332,920 ‐ ‐ ‐
Bermuda USD Endurance Specialty Holdings Ord Shs 2,855,490 ‐ ‐ ‐ ‐ HKD Esprit Holdings Ord Shs ‐ 1,102,634 1,268,900 996,351 0.59% HKD Global Brands Group Holding Ord Shs 1,302,966 ‐ ‐ ‐ ‐ HKD Johnson Electric Holdings Ord Shs ‐ 834,737 294,000 777,086 0.46% HKD Li & Fung Ltd ‐ 860,603 1,800,000 791,398 0.47%
4,158,456 2,797,974 2,564,835 1.52%
Brazil USD VALE SA‐SP ADR ‐ 659,862 103,230 786,613 0.47%
‐ 659,862 786,613 0.47%
Canada USD Barrick Gold Ord Shs 1,512,708 1,532,256 98,000 1,566,040 0.93% USD Great Basin Gold Ltd ON PNK ‐ 2,689,666 2,392,178 ‐ ‐ USD IAMGOLD Ord Shs 668,110 764,305 213,400 821,590 0.49% USD Kinross Gold Corp. 735,586 ‐ ‐ ‐ ‐ USD Yamana Gold Ord Shs ‐ 753,337 181,200 509,172 0.30%
2,916,404 5,739,564 2,896,802 1.72%
Cayman Islands CAD Endeavor Minning 381,803 ‐ ‐ ‐ ‐ HKD Kingboard Chemical Holdings Ord Shs 1,181,984 1,542,336 838,500 2,540,614 1.51% HKD Longfor Properties Ord Shs ‐ 787,165 560,500 711,113 0.42% HKD Shimao Property Holdings Ord Shs ‐ 1,416,779 998,000 1,304,777 0.78%
1,563,787 3,746,280 4,556,504 2.71%
China HKD China BlueChemical Ord Shs H 1,773,274 2,701,525 8,959,800 2,483,731 1.48% HKD China Communications Services Ord Shs H 1,880,253 1,680,689 3,400,000 2,165,577 1.29% HKD Dongfeng Motor Grp Co Ltd‐H ‐ 71,196 60,000 58,562 0.03% HKD Great Wall Motor Company‐H ‐ 988,729 905,000 844,802 0.50% HKD Jiangxi Copper Co Ltd‐H ‐ 846,963 600,000 837,040 0.50% HKD Ping An Insurance Group Co‐H ‐ 2,199,595 460,000 2,301,216 1.37% HKD Zijin Mining Group Ord Shs H ‐ 1,549,278 4,500,000 1,450,509 0.86% 3,653,527 10,037,975 10,141,437 6.03%
Denmark DKK William Demant Ord Shs 687,351 909,644 49,000 851,306 0.51%
687,351 909,644 851,306 0.51%
France EUR Axa Ord Shs 3,381,043 ‐ ‐ ‐ ‐ EUR BNP Paribas Ord Shs 499,244 ‐ ‐ ‐ ‐ EUR Societe Generale 504,011 ‐ ‐ ‐ ‐ 4,384,298 ‐ ‐ ‐
Germany EUR Allianz Ord Shs 3,757,255 821,795 4,964 819,640 0.49% EUR Deutsche Bank Ord Shs 423,273 800,091 50,000 907,091 0.54% EUR E.ON N Ord Shs 1,066,890 ‐ ‐ ‐ ‐ EUR Elringklinger Ord Shs ‐ 1,643,835 85,734 1,431,392 0.84% EUR Metro Ord Shs ‐ 1,140,037 37,500 1,245,673 0.74% 5,247,418 4,405,758 4,403,796 2.61%
Hong Kong HKD SJM Hldgs Ord Shs ‐ 1,468,387 2,200,000 1,724,623 1.02% HKD Sun Hung Kai Properties 1,751,068 1,955,403 145,000 1,832,154 1.09% HKD Swire Pacific Ord Shs A 2,250,119 2,254,207 200,000 1,909,514 1.13% 4,001,187 5,677,997 5,466,291 3.24%
Indonesia IDR Perusahaan Gas Negara (Persero) Ord Shs ‐ 3,562,652 15,325,500 3,071,242 1.82%
‐ 3,562,652 3,071,242 1.82%
Israel USD Check Point Software Technologies 1,139,320 1,126,919 14,397 1,215,971 0.72%
1,139,320 1,126,919 1,215,971 0.72%
Italy EUR Assicurazioni Generali Ord Shs ‐ 600,424 40,000 594,000 0.35%
‐ 600,424 594,000 0.35%

Annual report as of December 31, 2016 Vantage Global Investment Fund
31
Note 17 ‐ Financial assets at fair value through profit or loss ‐ Investment in securities: Long (unaudited) Ordinary Shares (continued)
Financial assets Financial assets
at fair value at fair value as a %
through profit or loss Cost in USD as at Quantity/ through profit or loss of Net
Description 31.12.2015 31.12.2016 Nominal 31.12.2016 Assets
Japan JPY Asahi Glass Ord Shs 978,406 684,563 117,800 801,717 0.48% JPY Cookpad Ord Shs ‐ 896,027 90,000 827,206 0.49% JPY Fujifilm Holdings 2,155,049 ‐ ‐ ‐ ‐ USD Honda Motor ADR rep 1/2 ord shs 743,969 2,480,436 83,300 2,431,527 1.44% JPY Ibiden 861,206 ‐ ‐ ‐ ‐ JPY INPEX Ord Shs ‐ 995,256 112,000 1,121,341 0.67% JPY Japan Petroleum Exploration Ord Shs ‐ 3,792,854 169,900 3,775,394 2.24% JPY Komeri Ord Shs ‐ 1,173,803 46,200 1,042,818 0.62% JPY Mitsubishi Heavy Industries Ord Shs ‐ 4,213,901 938,000 4,271,365 2.53% JPY Mitsubishi UFJ Financial Group Ord Shs 4,590,966 3,113,641 559,600 3,445,827 2.05% JPY Mizuho Financial Group Ord Shs 3,641,765 ‐ ‐ ‐ ‐ JPY Net One Systems Ord Shs 2,707,536 1,990,981 294,000 1,880,233 1.12% JPY Nichi‐Iko Pharmaceutical Ord Shs ‐ 1,676,068 81,900 1,170,800 0.70% JPY Nintendo Ord Shs ‐ 1,959,068 9,600 2,014,227 1.20% JPY Nippon Electric Glass Ord Shs 867,337 ‐ ‐ ‐ ‐ JPY Nissin Kogyo Ord Shs ‐ 962,956 64,000 1,011,765 0.60% JPY Nomura Holdings Ord Shs 4,302,134 2,438,628 396,000 2,333,136 1.39% JPY Sony Financial Holdings Ord Shs ‐ 866,697 61,700 962,216 0.57% JPY Sumitomo Mitsui Financial Group Ord Shs ‐ 1,862,613 52,600 2,005,780 1.19%
20,848,368 29,107,492 29,095,352 17.29%
Korea USD Posco ADR representing 1/4 Ord Shs ‐ 2,027,737 40,388 2,122,389 1.26%
‐ 2,027,737 2,122,389 1.26%
Norway NOK Storebrand Ord Shs ‐ 945,155 176,000 935,342 0.56%
‐ 945,155 935,342 0.56%
Netherlands EUR Aegon 454,466 ‐ ‐ ‐ ‐ GBP Randstad Holdings 3,134,827 ‐ ‐ ‐ ‐ 3,589,293 ‐ ‐ ‐
Panama USD Carnival Ord Shs 5,252,253 1,832,426 46,107 2,400,330 1.43%
5,252,253 1,832,426 2,400,330 1.43%
Poland PLN KGHM Polska Miedz Ord Shs ‐ 440,179 21,221 468,683 0.28%
‐ 440,179 468,683 0.28%
Russian Federation USD Lukoil ADR ‐ 2,204,938 51,162 2,871,211 1.71%
‐ 2,204,938 2,871,211 1.71%
Singapore SGD Singapore Airlines Ord Shs ‐ 869,889 126,000 842,148 0.50%
‐ 869,889 842,148 0.50%
South Africa ZAR Anglo American Platinum Ord Shs ‐ 2,789,963 105,270 2,025,782 1.20% USD AngloGold Ashanti ADR Reptg 1 Ord Shs 2,405,459 3,392,760 185,443 1,949,006 1.16% USD Gold Fields ADR Representing 1 Ord Shs 1,956,731 1,102,155 250,000 752,500 0.45% ZAR Gold Fields Ord Shs ‐ 1,037,194 159,872 507,188 0.30% USD Harmony Gold Mining ADR Representing 328,572 ‐ ‐ ‐ ‐ ZAR Impala Platinum Ord Shs ‐ 2,021,295 506,858 1,576,634 0.94% USD Sibanye Gold Ltd ON NYS ‐ 1,459,417 114,300 806,958 0.48% ZAR Sasol Ord Shs ‐ 1,085,186 40,000 1,161,272 0.69%
4,690,762 12,887,970 8,779,340 5.22%
Switzerland CHF Swatch Group Ord Shs ‐ 1,852,268 5,994 1,862,905 1.11%
‐ 1,852,268 1,862,905 1.11%
Taiwan TWD Asustek Computer Ord Shs ‐ 1,742,069 200,000 1,639,547 0.97% TWD Compal Electronics Ord Shs 886,099 ‐ ‐ ‐ ‐ TWD Catcher Technology Ord Shs ‐ 1,511,005 198,000 1,372,023 0.82% TWD Everlight Electronics Ord Shs ‐ 2,124,996 1,290,000 1,839,665 1.09% TWD Flexium Interconnect Ord Shs ‐ 1,159,942 425,000 1,114,892 0.66% TWD Hon Hai Precision Industry Ord Shs 1,476,735 1,605,035 660,660 1,720,831 1.02% TWD Kinsus Interconnect Technology Ord Shs ‐ 1,090,534 470,000 1,035,204 0.62% TWD Mediatek Ord Shs ‐ 4,082,861 517,000 3,462,553 2.06% TWD Powertech Technology Ord Shs 2,313,408 496,334 263,000 707,820 0.42% TWD Simplo Technology Ord Shs ‐ 1,782,260 600,000 1,724,309 1.02% TWD Synnex Technology International Ord Shs 527,632 ‐ ‐ ‐ ‐
5,203,874 15,595,036 14,616,844 8.68%
Thailand THB PTT Exploration and Production Ord Shs ‐ 1,017,495 431,000 1,157,632 0.69%
‐ 1,017,495 1,157,632 0.69%
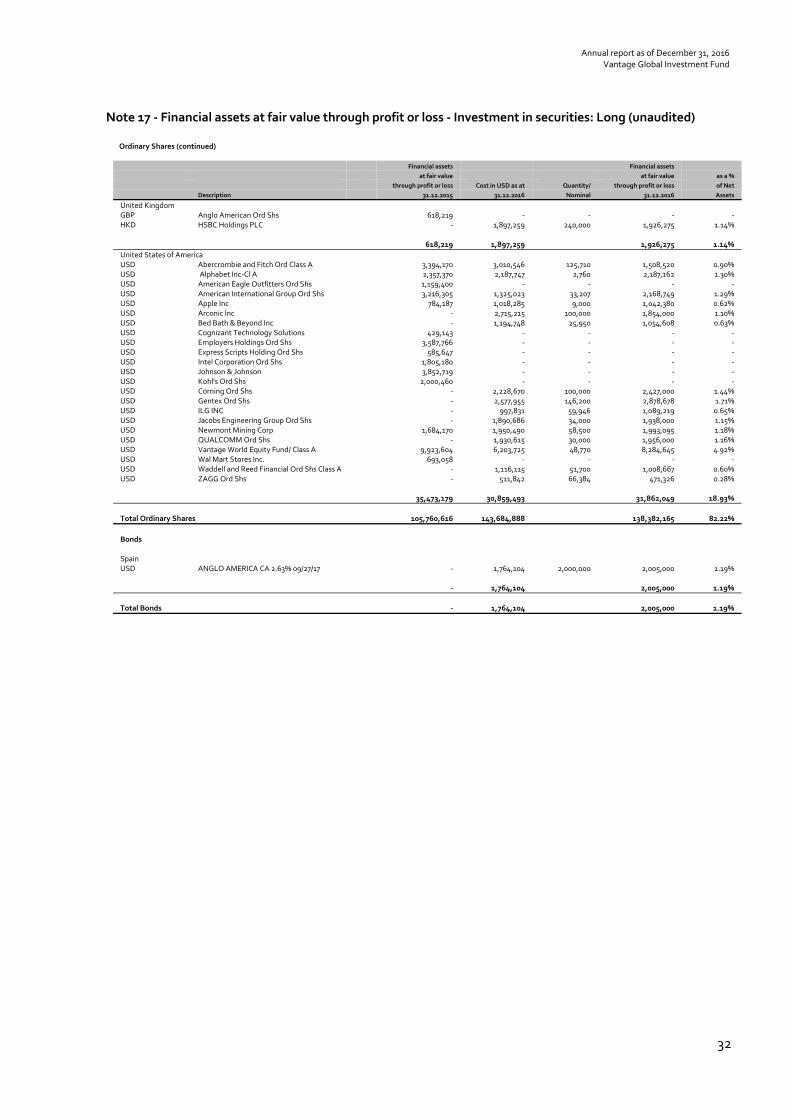
Annual report as of December 31, 2016 Vantage Global Investment Fund
32
Note 17 ‐ Financial assets at fair value through profit or loss ‐ Investment in securities: Long (unaudited) Ordinary Shares (continued)
Financial assets Financial assets
at fair value at fair value as a %
through profit or loss Cost in USD as at Quantity/ through profit or loss of Net
Description 31.12.2015 31.12.2016 Nominal 31.12.2016 Assets
United Kingdom GBP Anglo American Ord Shs 618,219 ‐ ‐ ‐ ‐ HKD HSBC Holdings PLC ‐ 1,897,259 240,000 1,926,275 1.14%
618,219 1,897,259 1,926,275 1.14%
United States of America USD Abercrombie and Fitch Ord Class A 3,394,170 3,010,546 125,710 1,508,520 0.90% USD Alphabet Inc‐Cl A 2,357,370 2,187,747 2,760 2,187,162 1.30% USD American Eagle Outfitters Ord Shs 1,159,400 ‐ ‐ ‐ ‐ USD American International Group Ord Shs 3,216,305 1,325,023 33,207 2,168,749 1.29% USD Apple Inc 784,187 1,018,285 9,000 1,042,380 0.62% USD Arconic Inc ‐ 2,715,215 100,000 1,854,000 1.10% USD Bed Bath & Beyond Inc ‐ 1,194,748 25,950 1,054,608 0.63% USD Cognizant Technology Solutions 429,143 ‐ ‐ ‐ ‐ USD Employers Holdings Ord Shs 3,587,766 ‐ ‐ ‐ ‐ USD Express Scripts Holding Ord Shs 585,647 ‐ ‐ ‐ ‐ USD Intel Corporation Ord Shs 1,805,180 ‐ ‐ ‐ ‐ USD Johnson & Johnson 3,852,719 ‐ ‐ ‐ ‐ USD Kohl's Ord Shs 2,000,460 ‐ ‐ ‐ ‐ USD Corning Ord Shs ‐ 2,228,670 100,000 2,427,000 1.44% USD Gentex Ord Shs ‐ 2,577,955 146,200 2,878,678 1.71% USD ILG INC ‐ 997,831 59,946 1,089,219 0.65% USD Jacobs Engineering Group Ord Shs ‐ 1,890,686 34,000 1,938,000 1.15% USD Newmont Mining Corp 1,684,170 1,950,490 58,500 1,993,095 1.18% USD QUALCOMM Ord Shs ‐ 1,930,615 30,000 1,956,000 1.16% USD Vantage World Equity Fund/ Class A 9,923,604 6,203,725 48,770 8,284,645 4.92% USD Wal Mart Stores Inc. 693,058 ‐ ‐ ‐ ‐ USD Waddell and Reed Financial Ord Shs Class A ‐ 1,116,115 51,700 1,008,667 0.60% USD ZAGG Ord Shs ‐ 511,842 66,384 471,326 0.28%
35,473,179 30,859,493 31,862,049 18.93%
Total Ordinary Shares 105,760,616 143,684,888 138,382,165 82.22%
Bonds Spain USD ANGLO AMERICA CA 2.63% 09/27/17 ‐ 1,764,104 2,000,000 2,005,000 1.19% ‐ 1,764,104 2,005,000 1.19%
Total Bonds ‐ 1,764,104 2,005,000 1.19%

Annual report as of December 31, 2016 Vantage Global Investment Fund
33
Note 17 ‐ Financial assets at fair value through profit or loss ‐ Investment in securities: Long (unaudited) Future Contracts
Financial assets Financial assets
at fair value at fair value as a %
through profit or loss Cost in USD as at Quantity/ through profit or loss of Net
Description 31.12.2015 31.12.2016 Nominal 31.12.2016 Assets
Future Contracts
Hong Kong HKD HANG SENG JAN6 72,103 ‐ ‐ ‐ ‐ HKD HS C E I JAN6 47,576 ‐ ‐ ‐ ‐ 119,679 ‐ ‐ ‐
Japan JPY NIKKEI 225 MAR16 411,974 ‐ ‐ ‐ ‐ 411,974 ‐ ‐ ‐
United Kingdom USD FTSE CHINA A50 Jan17 ‐ 1,230 (410) 27,675 0.02%
‐ 1,230 27,675 0.02%
United States of America USD 100 OZ GOLD FEB6 37,080 ‐ ‐ ‐ ‐ USD EMINI S&P MAR6 73,868 ‐ ‐ ‐ ‐ USD SGXMSCI TW JAN16 23,830 ‐ ‐ ‐ ‐ USD S&P500 EMINI FUT Mar17 ‐ 847 (242) 220,240 0.13%
134,778 847 220,240 0.13%
Total Future Contracts 546,752 2,077 247,915 0.15%
Commodity Others USD GOLD Bullion 14,527,414 9,525,734 7,516 8,660,532 5.15%
14,527,414 9,525,734 8,660,532 5.15%
` Total Commodity 14,527,414 9,525,734 8,660,532 5.15%

Annual report as of December 31, 2016 Vantage Global Investment Fund
34
Note 17 ‐ Financial assets at fair value through profit or loss ‐ Investment in securities: Long (unaudited) Forwards
Currency sold Unrealized gain/(loss) Currency Bought Maturity
Unrealized gain/(loss) as at% of
31.12.2015 date 31.12.2016 net assets
USD 3,299,491 16,409 KRW 3,903,627,750 03.30.2016 ‐ ‐ USD 1,200,000 7,104 MYR 5,211,840 03.30.2016 ‐ ‐ USD 570,441 17,374 SEK 4,948,793 03.30.2016 ‐ ‐ CNH (12,564,858) 45,842 USD (1,900,000) 11.28.2016 ‐ ‐ CNH (31,880,671) 24,627 USD (4,816,607) 03.30.2016 ‐ ‐ CNH (6,086,321) 1,860 USD (900,000) 11.28.2016 ‐ ‐ CNY (14,671,677) 50,111 USD (2,230,000) 08.18.2016 ‐ ‐ DKK (4,245,877) 1,627 USD (621,289) 03.30.2016 ‐ ‐ EUR (2,098,246) 8,559 USD (2,300,000) 06.30.2016 ‐ ‐ EUR (11,100,000) 8,717 USD (12,130,746) 06.30.2016 ‐ ‐ GBP (1,070,793) 21,842 USD (1,600,000) 03.30.2016 ‐ ‐ SGD (1,774,970) 1,319 USD (1,250,000) 03.03.2016 ‐ ‐ SGD (1,771,108) 4,036 USD (1,250,000) 03.03.2016 ‐ ‐ SGD (1,657,352) 4,063 USD (1,170,000) 03.03.2016 ‐ ‐ SGD (1,309,961) 3,592 USD (924,409) 03.30.2016 ‐ ‐ TWD (405,140,779) 118,522 USD (12,383,946) 03.30.2016 ‐ ‐ TWD (75,864,240) 3,250 USD (2,300,000) 03.30.2016 ‐ ‐ ZAR (9,274,936) 41,007 USD (630,665) 03.30.2016 ‐ ‐ ZAR (15,139,100) 37,525 USD (1,000,000) 03.30.2016 ‐ ‐ ZAR (13,693,707) 29,416 USD (900,000) 03.30.2016 ‐ ‐ ZAR (15,158,335) 20,749 USD (989,036) 03.03.2016 ‐ ‐ ZAR (47,283,045) 63,372 USD (3,069,414) 03.30.2016 ‐ ‐ ZAR (7,747,698) 7,437 USD (500,000) 03.30.2016 ‐ ‐ AUD (1,830,195) ‐ USD (1,361,692) 03.31.2017 45,334 0.03% AUD (3,900,370) ‐ USD (2,886,957) 03.31.2017 81,635 0.05% CAD (900,000) ‐ USD (687,053) 03.31.2017 16,722 0.01% CNH (18,651,179) ‐ USD (2,654,203) 03.31.2017 39,196 0.02% CNH (31,880,671) ‐ USD (4,527,171) 03.31.2017 57,311 0.03% CNY (10,984,000) ‐ USD (1,600,000) 03.31.2017 34,056 0.02% DKK (28,650,055) ‐ USD (4,096,875) 03.31.2017 22,844 0.01% EUR (839,195) ‐ USD (892,567) 03.31.2017 5,803 ‐ USD 1,198,805 ‐ HKD 9,300,000 03.31.2017 592 ‐ JPY (280,000,000) ‐ USD (2,542,448) 03.31.2017 137,350 0.08% JPY (2,093,687,162) ‐ USD (18,169,305) 03.31.2017 185,299 0.11%
KRW (4,165,619,313) ‐ USD (3,562,993) 03.31.2017 113,234 0.07% KRW (1,322,504,061) ‐ USD (1,131,181) 06.30.2017 35,032 0.02% SGD (1,240,549) ‐ USD (863,653) 03.31.2017 6,567 ‐ TWD (476,531,289) ‐ USD (15,012,062) 03.31.2017 309,298 0.19%
538,360 1,090,273 0.64%
Total financial assets at fair value through profit or loss 121,492,821 154,976,803 150,385,885 89.35%
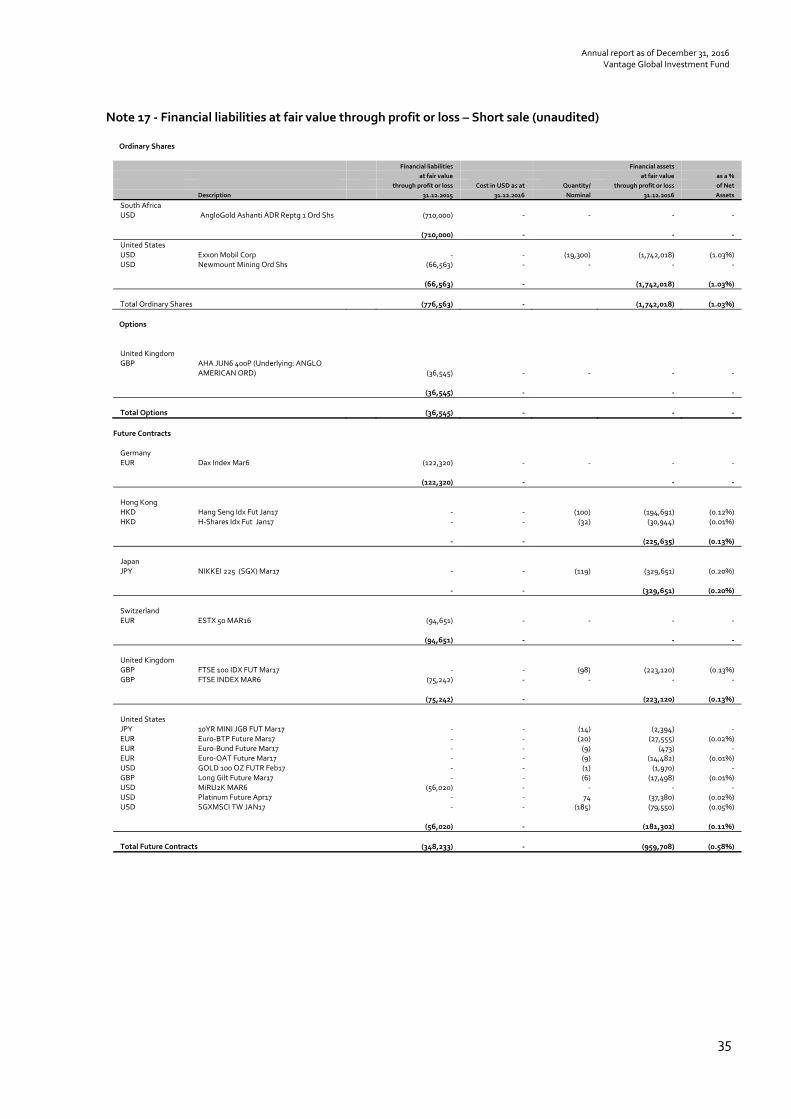
Annual report as of December 31, 2016 Vantage Global Investment Fund
35
Note 17 ‐ Financial liabilities at fair value through profit or loss – Short sale (unaudited) Ordinary Shares
Financial liabilities Financial assets
at fair value at fair value as a %
through profit or loss Cost in USD as at Quantity/ through profit or loss of Net
Description 31.12.2015 31.12.2016 Nominal 31.12.2016 Assets
South Africa USD AngloGold Ashanti ADR Reptg 1 Ord Shs (710,000) ‐ ‐ ‐ ‐ (710,000) ‐ ‐ ‐
United States USD Exxon Mobil Corp ‐ ‐ (19,300) (1,742,018) (1.03%) USD Newmount Mining Ord Shs (66,563) ‐ ‐ ‐ ‐
(66,563) ‐ (1,742,018) (1.03%)
Total Ordinary Shares (776,563) ‐ (1,742,018) (1.03%)
Options United Kingdom GBP AHA JUN6 400P (Underlying: ANGLO
AMERICAN ORD) (36,545) ‐ ‐ ‐ ‐
(36,545) ‐ ‐ ‐
Total Options (36,545) ‐ ‐ ‐
Future Contracts Germany EUR Dax Index Mar6 (122,320) ‐ ‐ ‐ ‐
(122,320) ‐ ‐ ‐
Hong Kong HKD Hang Seng Idx Fut Jan17 ‐ ‐ (100) (194,691) (0.12%) HKD H‐Shares Idx Fut Jan17 ‐ ‐ (32) (30,944) (0.01%)
‐ ‐ (225,635) (0.13%)
Japan JPY NIKKEI 225 (SGX) Mar17 ‐ ‐ (119) (329,651) (0.20%)
‐ ‐ (329,651) (0.20%)
Switzerland EUR ESTX 50 MAR16 (94,651) ‐ ‐ ‐ ‐
(94,651) ‐ ‐ ‐
United Kingdom GBP FTSE 100 IDX FUT Mar17 ‐ ‐ (98) (223,120) (0.13%) GBP FTSE INDEX MAR6 (75,242) ‐ ‐ ‐ ‐
(75,242) ‐ (223,120) (0.13%)
United States JPY 10YR MINI JGB FUT Mar17 ‐ ‐ (14) (2,394) ‐ EUR Euro‐BTP Future Mar17 ‐ ‐ (20) (27,555) (0.02%) EUR Euro‐Bund Future Mar17 ‐ ‐ (9) (473) ‐ EUR Euro‐OAT Future Mar17 ‐ ‐ (9) (14,482) (0.01%) USD GOLD 100 OZ FUTR Feb17 ‐ ‐ (1) (1,970) ‐ GBP Long Gilt Future Mar17 ‐ ‐ (6) (17,498) (0.01%) USD MiRU2K MAR6 (56,020) ‐ ‐ ‐ ‐ USD Platinum Future Apr17 ‐ ‐ 74 (37,380) (0.02%) USD SGXMSCI TW JAN17 ‐ ‐ (185) (79,550) (0.05%)
(56,020) ‐ (181,302) (0.11%)
Total Future Contracts (348,233) ‐ (959,708) (0.58%)

Annual report as of December 31, 2016 Vantage Global Investment Fund
36
Note 17 ‐ Financial liabilities at fair value through profit or loss – Short sale (unaudited) Forwards
Unrealized Unrealised
Currency sold gain/(loss) Currency bought Maturity date gain/(loss) as a % of
31.12.2015 31.12.2016 net assets
USD 2,230,000 (44,994) CNY 14,706,119 08.18.2016 ‐ ‐ USD 2,300,000 (9,080) SGD 3,256,487 03.03.2016 ‐ ‐ USD 2,300,000 (8,787) SGD 3,256,904 03.03.2016 ‐ ‐ USD 2,300,000 (14,247) TWD 75,508,972 03.03.2016 ‐ ‐ USD 2,400,000 (10,981) TWD 78,912,000 03.03.2016 ‐ ‐ USD 1,000,000 (31,712) ZAR 15,158,335 03.30.2016 ‐ ‐ USD (900,000) (4,699) USD (646,113) 06.30.2016 ‐ ‐ JPY (1,530,000,000) (105,453) USD (12,692,777) 06.30.2016 ‐ ‐ JPY (133,719,850) (15,009) USD (1,100,000) 03.30.2016 ‐ ‐
KRW (1,063,312,380) (3,221) USD (900,000) 03.30.2016 ‐ ‐ KRW (15,988,801,674) (61,494) USD (13,520,042) 03.30.2016 ‐ ‐ KRW (2,728,175,360) (17,423) USD (2,300,000) 03.30.2016 ‐ ‐ MYR (5,211,810) (4,834) USD (1,202,263) 03.30.2016 ‐ ‐ TWD (59,526,000) (1,928) USD (1,800,000) 03.03.2016 ‐ ‐ CHF (1,633,513) ‐ EUR (1,521,233) 03.31.2017 (4,873) (0.01%) USD (3,170,728) ‐ DKK (22,027,558) 03.31.2017 (38,415) (0.02%) EUR (5,029,594) ‐ USD (5,300,000) 03.31.2017 (14,686) (0.01%) NOK (8,091,000) ‐ EUR (941,741) 03.31.2017 (27) ‐ USD (10,478,377) ‐ GBP (8,291,141) 03.31.2017 (223,521) (0.13%) HKD (98,899,870) ‐ USD (12,740,020) 03.31.2017 (14,835) (0.01%) USD (1,110,000) ‐ KRW (1,322,504,061) 06.30.2017 (13,851) (0.01%) USD (2,101,998) ‐ SGD (3,008,793) 03.31.2017 (23,245) (0.01%) ZAR (101,046,469) ‐ USD (7,189,345) 03.31.2017 (42,931) (0.03%) ZAR (26,658,183) ‐ USD (1,866,200) 03.31.2017 (41,826) (0.02%)
Total Forward Contracts (333,862) (418,210) (0.25%)
Total financial liabilities at fair value through profit or loss (1,495,203) ‐ (3,119,936) (1.85%)