vanguard u.s. stock index funds large-capitalization ... · vanguard u.s. stock index funds...
TRANSCRIPT

Vanguard U.S. Stock Index Funds
Large-Capitalization Portfolios
Vanguard Growth Index Fund
Vanguard Value Index Fund
Vanguard Large-Cap Index Fund
Semiannual Report | June 30, 2018

Contents
Please note: The opinions expressed in this report are just that—informed opinions. They should not be considered promisesor advice. Also, please keep in mind that the information and opinions cover the period through the date on the front of thisreport. Of course, the risks of investing in your fund are spelled out in the prospectus.
See the Glossary for definitions of investment terms used in this report.About the cover: Nautical images have been part of Vanguard’s rich heritage since its start in 1975. For anincoming ship, a lighthouse offers a beacon and safe path to shore. You can similarly depend on Vanguard to putyou first––and light the way––as you strive to meet your financial goals. Our client focus and low costs,stemming from our unique ownership structure, assure that your interests are paramount.
Vanguard’s Principles for Investing Success
We want to give you the best chance of investment success. Theseprinciples, grounded in Vanguard’s research and experience, can put you onthe right path.
Goals. Create clear, appropriate investment goals.
Balance. Develop a suitable asset allocation using broadly diversified funds.
Cost. Minimize cost.
Discipline. Maintain perspective and long-term discipline.
A single theme unites these principles: Focus on the things you can control.We believe there is no wiser course for any investor.
Your Fund’s Performance at a Glance. . . . . . . . . . . . . . . . . . 1
CEO’s Perspective. . . . . . . . . . . . . . . . . . . . . . . . . . . . . . . . . 3
Growth Index Fund. . . . . . . . . . . . . . . . . . . . . . . . . . . . . . . . .5
Value Index Fund. . . . . . . . . . . . . . . . . . . . . . . . . . . . . . . . . 25
Large-Cap Index Fund. . . . . . . . . . . . . . . . . . . . . . . . . . . . . .45
About Your Fund’s Expenses. . . . . . . . . . . . . . . . . . . . . . . . 68
Trustees Approve Advisory Arrangements. . . . . . . . . . . . . .71
Glossary. . . . . . . . . . . . . . . . . . . . . . . . . . . . . . . . . . . . . . . . 73
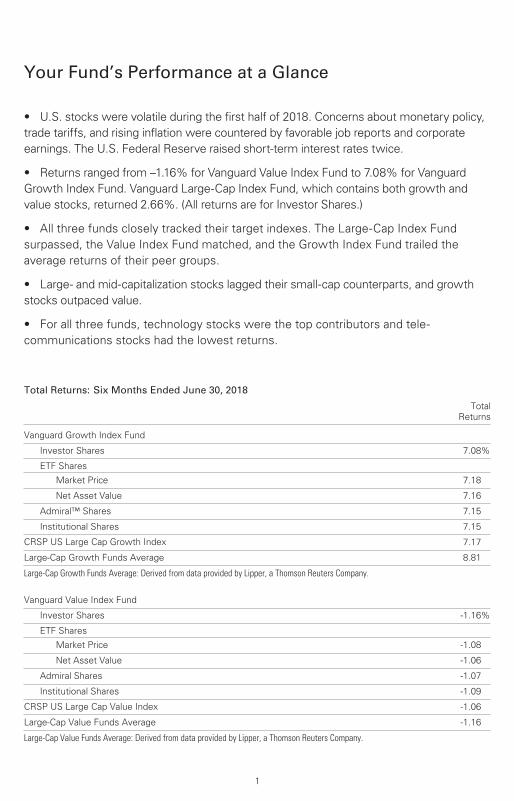
Your Fund’s Performance at a Glance
1
Total Returns: Six Months Ended June 30, 2018
Total
Returns
Vanguard Growth Index Fund
Investor Shares 7.08%
ETF Shares
Market Price 7.18
Net Asset Value 7.16
Admiral™ Shares 7.15
Institutional Shares 7.15
CRSP US Large Cap Growth Index 7.17
Large-Cap Growth Funds Average 8.81
Large-Cap Growth Funds Average: Derived from data provided by Lipper, a Thomson Reuters Company.
Vanguard Value Index Fund
Investor Shares -1.16%
ETF Shares
Market Price -1.08
Net Asset Value -1.06
Admiral Shares -1.07
Institutional Shares -1.09
CRSP US Large Cap Value Index -1.06
Large-Cap Value Funds Average -1.16
Large-Cap Value Funds Average: Derived from data provided by Lipper, a Thomson Reuters Company.
• U.S. stocks were volatile during the first half of 2018. Concerns about monetary policy,
trade tariffs, and rising inflation were countered by favorable job reports and corporate
earnings. The U.S. Federal Reserve raised short-term interest rates twice.
• Returns ranged from –1.16% for Vanguard Value Index Fund to 7.08% for Vanguard
Growth Index Fund. Vanguard Large-Cap Index Fund, which contains both growth and
value stocks, returned 2.66%. (All returns are for Investor Shares.)
• All three funds closely tracked their target indexes. The Large-Cap Index Fund
surpassed, the Value Index Fund matched, and the Growth Index Fund trailed the
average returns of their peer groups.
• Large- and mid-capitalization stocks lagged their small-cap counterparts, and growth
stocks outpaced value.
• For all three funds, technology stocks were the top contributors and tele-
communications stocks had the lowest returns.

2
Total Returns: Six Months Ended June 30, 2018
Total
Returns
Vanguard Large-Cap Index Fund
Investor Shares 2.66%
ETF Shares
Market Price 2.73
Net Asset Value 2.73
Admiral Shares 2.73
Institutional Shares 2.73
CRSP US Large Cap Index 2.74
Large-Cap Core Funds Average 1.75
Large-Cap Core Funds Average: Derived from data provided by Lipper, a Thomson Reuters Company.
Admiral Shares carry lower expenses and are available to investors who meet certain account-balance requirements. Institutional Sharesare available to certain institutional investors who meet specific administrative, service, and account-size criteria. The Vanguard ETF®Shares shown are traded on the NYSE Arca exchange and are available only through brokers. The table provides ETF returns based onboth the NYSE Arca market price and the net asset value for a share. U.S. Pat. Nos. 6,879,964; 7,337,138; 7,720,749; 7,925,573;8,090,646; and 8,417,623.
For the ETF Shares, the market price is determined by the midpoint of the bid-offer spread as of the closing time of the New York Stock Exchange (generally 4 p.m., Eastern time). The net asset value is also determined as of the NYSE closing time. For more information about how the ETF Shares' market prices have compared with their net asset value, visit vanguard.com, select your ETF, and then select the Price and Performance tab. The ETF premium/discount analysis there shows the percentages of days on which the ETF Shares' market price was above or below the NAV.
Expense RatiosYour Fund Compared With Its Peer Group
Investor
Shares
ETF
Shares
Admiral
Shares
Institutional
Shares
Peer Group
Average
Growth Index Fund 0.17% 0.05% 0.05% 0.04% 1.10%
Value Index Fund 0.17 0.05 0.05 0.04 1.04
Large-Cap Index Fund 0.17 0.05 0.05 0.04 1.03
The fund expense ratios shown are from the prospectus dated April 25, 2018, and represent estimated costs for the current fiscal year. Forthe six months ended June 30, 2018, the funds’ annualized expense ratios were: for the Growth Index Fund, 0.17% for Investor Shares,0.05% for ETF Shares, 0.05% for Admiral Shares, and 0.04% for Institutional Shares; for the Value Index Fund, 0.17% for Investor Shares,0.05% for ETF Shares, 0.05% for Admiral Shares, and 0.04% for Institutional Shares; and for the Large-Cap Index Fund, 0.17% for InvestorShares, 0.05% for ETF Shares, 0.05% for Admiral Shares, and 0.04% for Institutional Shares. The peer-group expense ratios are derivedfrom data provided by Lipper, a Thomson Reuters Company, and capture information through year-end 2017.
Peer groups: For the Growth Index Fund, Large-Cap Growth Funds; for the Value Index Fund, Large-Cap Value Funds; and for the Large-CapIndex Fund, Large-Cap Core Funds.

Dear Shareholder,
I feel extremely fortunate to have the
chance to lead a company filled with
people who come to work every day
passionate about Vanguard’s core
purpose: to take a stand for all investors,
to treat them fairly, and to give them the
best chance for investment success.
When I joined Vanguard in 1991,
I found a mission-driven team focused
on improving lives—helping people retire
more comfortably, put their children
through college, and achieve financial
security. I also found a company with
purpose in an industry ripe for
improvement.
It was clear, even early in my career,
that the cards were stacked against most
investors. Hidden fees, performance-
chasing, and poor advice were relentlessly
eroding investors’ dreams.
We knew Vanguard could be different
and, as a result, could make a real
difference. We have lowered the costs
of investing for our shareholders
significantly. And we’re proud of the
performance of our funds.
Vanguard is built for Vanguard
investors—we focus solely on you,
our fund shareholders. Everything we
do is designed to give our clients the
best chance for investment success.
In my role as CEO, I’ll keep this priority
CEO’s Perspective
Tim Buckley
President and Chief Executive Officer
3

front and center. We’re proud of what
we’ve achieved, but we’re even more
excited about what’s to come.
Steady, time-tested guidance
Our guidance for investors, as always, is
to stay the course, tune out the hyperbolic
headlines, and focus on your goals and
what you can control, such as costs and
how much you save. This time-tested
advice has served our clients well over
the decades.
Regardless of how the markets perform
in the short term, I’m incredibly optimistic
about the future for our investors. We
have a dedicated team serving you,
and we will never stop striving to make
Vanguard the best place for you to
invest through our high-quality funds
and services, advice and guidance
to help you meet your financial goals,
and an experience that makes you
feel good about entrusting us with
your hard-earned savings.
Thank you for your continued loyalty.
Sincerely,
Mortimer J. Buckley
President and Chief Executive Officer
July 13, 2018
Market Barometer
Total Returns
Periods Ended June 30, 2018
Six One Five Years
Months Year (Annualized)
Stocks
Russell 1000 Index (Large-caps) 2.85% 14.54% 13.37%
Russell 2000 Index (Small-caps) 7.66 17.57 12.46
Russell 3000 Index (Broad U.S. market) 3.22 14.78 13.29
FTSE All-World ex US Index (International) -3.83 7.28 6.35
Bonds
Bloomberg Barclays U.S. Aggregate Bond Index
(Broad taxable market) -1.62% -0.40% 2.27%
Bloomberg Barclays Municipal Bond Index
(Broad tax-exempt market) -0.25 1.56 3.53
FTSE Three-Month U.S. Treasury Bill Index 0.78 1.33 0.38
CPI
Consumer Price Index 2.22% 2.87% 1.54%
4

Growth Index Fund
Fund ProfileAs of June 30, 2018
1 The expense ratios shown are from the prospectus dated April 25, 2018, and represent estimated costs for the current fiscal year. Forthe six months ended June 30, 2018, the annualized expense ratios were 0.17% for Investor Shares, 0.05% for ETF Shares, 0.05% forAdmiral Shares, and 0.04% for Institutional Shares.
5
Share-Class Characteristics
Investor
Shares ETF Shares
Admiral
Shares
Institutional
Shares
Ticker Symbol VIGRX VUG VIGAX VIGIX
Expense Ratio1 0.17% 0.05% 0.05% 0.04%
30-Day SEC Yield 1.07% 1.19% 1.19% 1.20%
Volatility Measures
CRSP US
Large Cap
Growth Index
DJ
U.S. Total
Market
FA Index
R-Squared 1.00 0.89
Beta 1.00 1.05
These measures show the degree and timing of the fund’s fluctuations compared with the indexes over 36 months.
Portfolio Characteristics
Fund
CRSP US
Large Cap
Growth
Index
DJ
U.S. Total
Market
FA Index
Number of Stocks 306 304 3,779
Median Market Cap $92.9B $92.9B $64.0B
Price/Earnings Ratio 26.7x 26.7x 20.7x
Price/Book Ratio 5.7x 5.7x 3.0x
Return on Equity 18.4% 18.4% 15.0%
Earnings Growth Rate 13.6% 13.5% 8.3%
Dividend Yield 1.1% 1.1% 1.8%
Foreign Holdings 0.0% 0.0% 0.0%
Turnover Rate
(Annualized) 10% — —
Short-Term Reserves 0.0% — —
Ten Largest Holdings (% of total net assets)
Apple Inc. Computer Hardware 7.2%
Amazon.com Inc. Broadline Retailers 6.1
Alphabet Inc. Internet 5.9
Facebook Inc. Internet 4.1
Visa Inc. Consumer Finance 2.1
Home Depot Inc. Home Improvement
Retailers 2.0
Boeing Co. Aerospace 1.7
Mastercard Inc. Consumer Finance 1.6
Netflix Inc. Specialty Retailers 1.4
Comcast Corp. Broadcasting &
Entertainment 1.3
Top Ten 33.4%
The holdings listed exclude any temporary cash investments andequity index products.
Sector Diversification (% of equity exposure)
Fund
CRSP USLarge Cap
GrowthIndex
DJU.S. Total
MarketFA Index
Basic Materials 1.1% 1.1% 2.5%
Consumer Goods 7.1 7.1 8.1
Consumer Services 20.6 20.6 13.3
Financials 13.2 13.2 19.9
Health Care 11.0 11.0 12.6
Industrials 14.2 14.2 12.7
Oil & Gas 4.0 4.0 6.1
Technology 28.6 28.6 20.1
Telecommunications 0.2 0.2 1.8
Utilities 0.0 0.0 2.9
Sector categories are based on the Industry ClassificationBenchmark (“ICB”), except for the “Other” category (if applicable),which includes securities that have not been provided an ICBclassification as of the effective reporting period.

Growth Index Fund-1
6
Investment Focus
Market Cap
Value
Large
Medium
Small
Blend Growth Style

All of the returns in this report represent past performance, which is not a guarantee of future results that may be achieved by the fund. (Current performance may be lower or higher thanthe performance data cited. For performance data current to the most recent month-end, visitour website at vanguard.com/performance.) Note, too, that both investment returns and principal value can fluctuate widely, so an investor’s shares, when sold, could be worth more or less than their original cost. The returns shown do not reflect taxes that a shareholder would pay
on fund distributions or on the sale of fund shares.
Performance Summary
Growth Index Fund
See Financial Highlights for dividend and capital gains information.
7
Fiscal-Year Total Returns (%): December 31, 2007, Through June 30, 2018
–38.32 –38.22
2008
36.29 36.50
2009
16.96 17.23
2010
1.71 1.96
2011
16.89 17.14
2012
32.16 32.47
2013
13.47 13.69
2014
3.17 3.38
2015
5.99 6.16
2016
27.65 27.86
2017
7.08 7.17
2018
Growth Index Fund Investor Shares
Spliced Growth Index
For a benchmark description, see the Glossary.
Note: For 2018, performance data reflect the six months ended June 30, 2018.
Average Annual Total Returns: Periods Ended June 30, 2018
InceptionDate
OneYear
FiveYears
TenYears
Investor Shares 11/2/1992 19.20% 15.19% 11.02%
ETF Shares 1/26/2004
Market Price 19.37 15.36 11.18
Net Asset Value 19.34 15.35 11.18
Admiral Shares 11/13/2000 19.34 15.34 11.17
Institutional Shares 5/14/1998 19.35 15.36 11.19

Market
Value•
Shares ($000)
Market
Value•
Shares ($000)
Common Stocks (99.9%)1
Basic Materials (1.2%)
Praxair Inc. 2,029,863 321,023
Ecolab Inc. 1,834,251 257,400
FMC Corp. 950,068 84,756
Albemarle Corp. 782,296 73,794
International Flavors &
Fragrances Inc. 557,539 69,113* Axalta Coating Systems
Ltd. 1,559,227 47,260
CF Industries Holdings
Inc. 823,255 36,552
Steel Dynamics Inc. 790,082 36,304
926,202
Consumer Goods (7.1%)
Philip Morris International
Inc. 10,979,526 886,487
NIKE Inc. Class B 9,059,952 721,897
Colgate-Palmolive Co. 6,161,259 399,311
Activision Blizzard Inc. 5,107,771 389,825
Altria Group Inc. 6,684,039 379,587*,^ Tesla Inc. 899,492 308,481* Electronic Arts Inc. 2,167,258 305,627
Kraft Heinz Co. 4,305,789 270,490
Constellation Brands Inc.
Class A 1,127,750 246,831
Estee Lauder Cos. Inc.
Class A 1,582,165 225,759* Monster Beverage Corp. 2,980,931 170,807
McCormick & Co. Inc. 856,661 99,450
Brown-Forman Corp.
Class B 1,978,897 96,986* Mohawk Industries Inc. 447,880 95,967* Take-Two Interactive
Software Inc. 807,888 95,622
Hershey Co. 997,470 92,825
Church & Dwight Co.
Inc. 1,728,435 91,884* Lululemon Athletica Inc. 711,371 88,815
Stanley Black & Decker
Inc. 545,625 72,464* NVR Inc. 24,279 72,117* LKQ Corp. 2,078,104 66,291
Snap-on Inc. 399,752 64,248
Clorox Co. 457,346 61,856
Lennar Corp. Class A 1,018,412 53,467
DR Horton Inc. 1,266,244 51,916
Polaris Industries Inc. 423,703 51,768
Tapestry Inc. 1,015,575 47,437
Coty Inc. Class A 3,180,656 44,847* WABCO Holdings Inc. 378,574 44,301
Hormel Foods Corp. 935,058 34,793*,^ Under Armour Inc.
Class A 1,309,296 29,433*,^ Under Armour Inc. 1,354,235 28,547
Lennar Corp. Class B 51,376 2,193
Coca-Cola Co. 886 39
Newell Brands Inc. 369 9
5,692,377
Consumer Services (20.6%) * Amazon.com Inc. 2,913,191 4,951,842
Home Depot Inc. 8,147,742 1,589,624* Netflix Inc. 2,916,842 1,141,739
Comcast Corp. Class A 32,436,013 1,064,226
Walt Disney Co. 10,001,553 1,048,263
McDonald’s Corp. 5,545,879 868,984* Booking Holdings Inc. 340,270 689,758
Costco Wholesale Corp. 3,099,502 647,734
Lowe’s Cos. Inc. 5,540,991 529,552
Starbucks Corp. 9,259,956 452,349
TJX Cos. Inc. 4,206,757 400,399* Charter Communications
Inc. Class A 1,174,114 344,262
Marriott International Inc.
Class A 1,871,989 236,994
Ross Stores Inc. 2,674,433 226,658
Southwest Airlines Co. 3,686,126 187,550
Dollar General Corp. 1,896,918 187,036
Yum! Brands Inc. 2,283,147 178,588
Financial Statements (unaudited)
Statement of Net AssetsAs of June 30, 2018
The fund reports a complete list of its holdings in regulatory filings four times in each fiscal year, at
the quarter-ends. For the second and fourth fiscal quarters, the lists appear in the fund’s semiannual
and annual reports to shareholders. For the first and third fiscal quarters, the fund files the lists with
the Securities and Exchange Commission on Form N-Q. Shareholders can look up the fund’s Forms
N-Q on the SEC’s website at sec.gov. Forms N-Q may also be reviewed and copied at the SEC’s
Public Reference Room (see the back cover of this report for further information).
Growth Index Fund
8

Growth Index Fund
Market
Value•
Shares ($000)
Market
Value•
Shares ($000)
Hilton Worldwide
Holdings Inc. 2,113,866 167,334* O’Reilly Automotive Inc. 578,600 158,288* Dollar Tree Inc. 1,679,352 142,745* AutoZone Inc. 190,012 127,485
Royal Caribbean Cruises
Ltd. 1,196,486 123,956
Wynn Resorts Ltd. 689,833 115,437
Expedia Group Inc. 873,105 104,938
MGM Resorts
International 3,539,455 102,750* Ulta Beauty Inc. 406,035 94,793
Carnival Corp. 1,415,332 81,113* Chipotle Mexican Grill
Inc. Class A 176,709 76,227* Norwegian Cruise Line
Holdings Ltd. 1,428,281 67,486
Tractor Supply Co. 862,067 65,939
Tiffany & Co. 416,782 54,849
FactSet Research
Systems Inc. 274,595 54,397^ Sirius XM Holdings Inc. 7,908,669 53,542* CarMax Inc. 628,847 45,824
Domino’s Pizza Inc. 149,321 42,134
Wyndham Hotels &
Resorts Inc. 704,767 41,461* Copart Inc. 695,350 39,329
Hyatt Hotels Corp.
Class A 295,397 22,790* TripAdvisor Inc. 374,045 20,838
Rollins Inc. 346,150 18,201
Wyndham Destinations
Inc. 176,446 7,811
16,575,225
Financials (13.1%)
Visa Inc. Class A 12,616,008 1,670,990
Mastercard Inc. Class A 6,548,897 1,286,989
American Tower Corp. 3,119,528 449,742
Charles Schwab Corp. 8,576,704 438,270
BlackRock Inc. 791,932 395,206
Simon Property Group
Inc. 2,187,406 372,275
S&P Global Inc. 1,775,106 361,926
Crown Castle
International Corp. 2,929,985 315,911
Intercontinental
Exchange Inc. 4,091,389 300,922
Marsh & McLennan
Cos. Inc. 3,590,754 294,334
Prologis Inc. 3,758,928 246,924
Equinix Inc. 561,343 241,316
Public Storage 1,046,008 237,297
Aon plc 1,727,249 236,927
Moody’s Corp. 1,152,547 196,578
Weyerhaeuser Co. 5,349,352 195,037
T. Rowe Price Group Inc. 1,624,914 188,636
AvalonBay Communities
Inc. 976,429 167,838
Digital Realty Trust Inc. 1,454,694 162,315
Boston Properties Inc. 1,090,298 136,745* SBA Communications
Corp. Class A 813,616 134,344* IHS Markit Ltd. 2,541,740 131,128* E*TRADE Financial Corp. 1,864,024 114,004
Essex Property Trust Inc. 466,519 111,531
First Republic Bank 1,142,834 110,615
TD Ameritrade Holding
Corp. 2,003,965 109,757* CBRE Group Inc. Class A 2,279,458 108,821
Realty Income Corp. 2,008,746 108,050* SVB Financial Group 373,925 107,975
Equifax Inc. 849,582 106,291
MSCI Inc. Class A 634,852 105,024* Markel Corp. 93,198 101,059
Alexandria Real Estate
Equities Inc. 727,358 91,771
Vornado Realty Trust 1,208,854 89,359
Extra Space Storage Inc. 846,166 84,456
Arthur J Gallagher & Co. 1,286,152 83,960
Cboe Global Markets Inc. 794,536 82,687
Welltower Inc. 1,312,150 82,259
Mid-America Apartment
Communities Inc. 803,729 80,911
Ventas Inc. 1,258,403 71,666
UDR Inc. 1,890,177 70,957
Iron Mountain Inc. 2,019,362 70,698
Regency Centers Corp. 1,076,964 66,858
Federal Realty
Investment Trust 517,179 65,449
SL Green Realty Corp. 624,657 62,797
SEI Investments Co. 1,003,567 62,743
Comerica Inc. 606,904 55,180* Black Knight Inc. 1,002,572 53,688
Invitation Homes Inc. 2,019,122 46,561
Raymond James
Financial Inc. 463,621 41,425
Interactive Brokers Group
Inc. 478,677 30,832
Camden Property Trust 328,612 29,946
Jones Lang LaSalle Inc. 160,230 26,597
10,595,577
Health Care (11.0%)
AbbVie Inc. 10,703,854 991,712
Medtronic plc 9,573,070 819,551
Bristol-Myers Squibb Co. 11,544,978 638,899
Thermo Fisher Scientific
Inc. 2,841,696 588,629
Becton Dickinson and
Co. 1,887,249 452,109* Biogen Inc. 1,490,313 432,548
9

Growth Index Fund
Market
Value•
Shares ($000)
Market
Value•
Shares ($000)
* Celgene Corp. 5,119,363 406,580* Intuitive Surgical Inc. 800,217 382,888
Stryker Corp. 2,111,667 356,576* Boston Scientific Corp. 9,745,763 318,687* Vertex Pharmaceuticals
Inc. 1,799,984 305,925
Zoetis Inc. 3,417,704 291,154* Illumina Inc. 1,038,305 289,988* Edwards Lifesciences
Corp. 1,488,796 216,724* Regeneron
Pharmaceuticals Inc. 561,498 193,711* Alexion Pharmaceuticals
Inc. 1,493,726 185,446* Align Technology Inc. 538,077 184,098* Centene Corp. 1,377,484 169,720* IDEXX Laboratories Inc. 613,551 133,717
Baxter International Inc. 1,804,359 133,234* Laboratory Corp. of
America Holdings 722,632 129,734* ABIOMED Inc. 297,996 121,895* IQVIA Holdings Inc. 1,218,728 121,653* BioMarin Pharmaceutical
Inc. 1,247,344 117,500
ResMed Inc. 1,008,172 104,427* Waters Corp. 525,707 101,772
Teleflex Inc. 321,395 86,201* Incyte Corp. 1,272,560 85,262
Cooper Cos. Inc. 346,241 81,522* Henry Schein Inc. 1,087,927 79,027* Varian Medical Systems
Inc. 646,294 73,497* Jazz Pharmaceuticals plc 402,594 69,367* Alnylam Pharmaceuticals
Inc. 639,906 63,024* Nektar Therapeutics
Class A 1,209,674 59,068* Alkermes plc 1,095,049 45,072
Universal Health Services
Inc. Class B 307,759 34,297* Seattle Genetics Inc. 363,201 24,113
8,889,327
Industrials (14.1%)
Boeing Co. 4,114,926 1,380,599
3M Co. 4,193,300 824,906
Union Pacific Corp. 5,440,612 770,826
Accenture plc Class A 4,542,269 743,070* PayPal Holdings Inc. 7,967,500 663,454
United Parcel Service Inc.
Class B 4,870,660 517,410
Lockheed Martin Corp. 1,714,264 506,445
Automatic Data
Processing Inc. 2,955,951 396,511
Fidelity National
Information Services
Inc. 2,338,142 247,913
Sherwin-Williams Co. 594,717 242,389
Danaher Corp. 2,220,353 219,104* Fiserv Inc. 2,892,183 214,282
Roper Technologies Inc. 728,762 201,073
FedEx Corp. 849,433 192,872
Amphenol Corp. Class A 2,129,621 185,596* Worldpay Inc. Class A 2,100,770 171,801
Fortive Corp. 2,215,789 170,859
Rockwell Collins Inc. 1,160,073 156,239
Paychex Inc. 2,285,200 156,193
Illinois Tool Works Inc. 1,077,388 149,261
Rockwell Automation Inc. 887,044 147,453
Agilent Technologies Inc. 2,274,315 140,644
Waste Connections Inc. 1,860,949 140,092* FleetCor Technologies
Inc. 633,158 133,375
Global Payments Inc. 1,126,861 125,634
Vulcan Materials Co. 933,762 120,511* Verisk Analytics Inc.
Class A 1,108,849 119,357
AMETEK Inc. 1,635,653 118,029
TransDigm Group Inc. 333,295 115,033
Cintas Corp. 603,001 111,597* CoStar Group Inc. 257,194 106,126* Mettler-Toledo
International Inc. 179,327 103,764
Martin Marietta
Materials Inc. 443,737 99,100
Total System Services
Inc. 1,158,896 97,950
Fastenal Co. 2,031,686 97,785
Broadridge Financial
Solutions Inc. 832,059 95,770
Expeditors International
of Washington Inc. 1,233,796 90,190
Xylem Inc. 1,270,751 85,623* XPO Logistics Inc. 851,470 85,300
CH Robinson Worldwide
Inc. 983,472 82,277
Masco Corp. 2,193,065 82,064
Kansas City Southern 724,704 76,790
JB Hunt Transport
Services Inc. 620,189 75,384
Packaging Corp. of
America 665,858 74,436
Huntington Ingalls
Industries Inc. 314,339 68,146
Wabtec Corp. 612,010 60,332* Trimble Inc. 1,760,282 57,808* Sensata Technologies
Holding plc 1,210,671 57,604
10

Growth Index Fund
Market
Value•
Shares ($000)
Market
Value•
Shares ($000)
Fortune Brands Home
& Security Inc. 1,030,736 55,340* IPG Photonics Corp. 246,476 54,380
Robert Half International
Inc. 829,030 53,970
TransUnion 648,770 46,478* United Rentals Inc. 295,240 43,583
Hubbell Inc. Class B 387,502 40,974
Alliance Data Systems
Corp. 166,576 38,846
Old Dominion Freight
Line Inc. 246,372 36,700
AO Smith Corp. 513,910 30,398
Cognex Corp. 579,143 25,836
FLIR Systems Inc. 484,601 25,185
Owens Corning 390,948 24,774
Sealed Air Corp. 569,160 24,161
Acuity Brands Inc. 145,039 16,806
11,396,408
Oil & Gas (4.0%)
Schlumberger Ltd. 9,784,131 655,830
EOG Resources Inc. 4,089,091 508,806
Occidental Petroleum
Corp. 5,409,398 452,658
Anadarko Petroleum
Corp. 3,638,738 266,538
Pioneer Natural
Resources Co. 1,203,942 227,834* Concho Resources Inc. 1,052,929 145,673
Halliburton Co. 2,938,707 132,418
Noble Energy Inc. 3,421,766 120,720
ONEOK Inc. 1,450,657 101,299* Cheniere Energy Inc. 1,489,614 97,108
Diamondback Energy Inc. 695,939 91,565
Cabot Oil & Gas Corp. 3,189,164 75,902
Cimarex Energy Co. 674,048 68,578
Apache Corp. 1,347,773 63,008
EQT Corp. 939,171 51,823* Continental Resources
Inc. 664,046 43,004
Targa Resources Corp. 736,463 36,447* Antero Resources Corp. 1,676,693 35,797
Helmerich & Payne Inc. 182,381 11,629
3,186,637
Technology (28.6%)
Apple Inc. 31,245,236 5,783,806* Facebook Inc. Class A 16,941,966 3,292,163* Alphabet Inc. Class A 2,109,078 2,381,550* Alphabet Inc. Class C 2,095,411 2,337,745
NVIDIA Corp. 3,858,634 914,110* Adobe Systems Inc. 3,478,463 848,084
Texas Instruments Inc. 6,914,082 762,278
Broadcom Inc. 2,901,217 703,951* salesforce.com Inc. 4,984,736 679,918
* Micron Technology Inc. 8,191,721 429,574
Intuit Inc. 1,721,782 351,769
Applied Materials Inc. 7,421,215 342,786
Cognizant Technology
Solutions Corp. Class A 4,138,380 326,891
Analog Devices Inc. 2,612,182 250,560* ServiceNow Inc. 1,248,071 215,255* Twitter Inc. 4,786,305 209,018* Autodesk Inc. 1,547,983 202,925
Lam Research Corp. 1,159,094 200,349* Red Hat Inc. 1,255,200 168,661
Microchip Technology
Inc. 1,661,071 151,074* Cerner Corp. 2,226,447 133,119* Palo Alto Networks Inc. 616,314 126,634* Workday Inc. Class A 1,032,477 125,054
Skyworks Solutions Inc. 1,286,123 124,304
Harris Corp. 838,602 121,212* Square Inc. 1,945,311 119,909
Xilinx Inc. 1,789,892 116,808
Maxim Integrated
Products Inc. 1,975,458 115,880
KLA-Tencor Corp. 1,100,961 112,882* VeriSign Inc. 783,094 107,613* ANSYS Inc. 593,432 103,364* Splunk Inc. 1,024,005 101,489* Advanced Micro Devices
Inc. 6,499,190 97,423* Citrix Systems Inc. 909,347 95,336* Arista Networks Inc. 367,759 94,694* Cadence Design
Systems Inc. 1,991,097 86,234* Akamai Technologies Inc. 1,146,303 83,944* IAC/InterActiveCorp 549,706 83,825* Gartner Inc. 612,187 81,360* VMware Inc. Class A 520,551 76,505* F5 Networks Inc. 431,647 74,437* Qorvo Inc. 893,465 71,629
CDK Global Inc. 929,586 60,470*,^ Snap Inc. 3,668,677 48,023
LogMeIn Inc. 368,744 38,073
SS&C Technologies
Holdings Inc. 713,554 37,033* GoDaddy Inc. Class A 498,252 35,177* Dropbox Inc. Class A 390,400 12,657*,^ Match Group Inc. 177,161 6,863
23,044,418
Telecommunications (0.2%) * T-Mobile US Inc. 2,096,237 125,250* Zayo Group Holdings Inc. 1,492,237 54,437
179,687
Total Common Stocks
(Cost $46,742,651) 80,485,858
11

Growth Index Fund
Market
Value•
Shares ($000)
At June 30, 2018, net assets consisted of:
Amount
($000)
Temporary Cash Investments (0.4%)1
Money Market Fund (0.4%)2,3 Vanguard Market Liquidity
Fund, 2.122% 3,253,902 325,423
Face
Amount
($000)
U.S. Government and Agency Obligations (0.0%) 4 United States Treasury
Bill, 1.986%, 10/18/18 5,500 5,4684 United States Treasury
Bill, 2.027%, 11/15/18 2,000 1,985
7,453
Total Temporary Cash Investments
(Cost $332,817) 332,876
Total Investments (100.3%)
(Cost $47,075,468) 80,818,734
Amount
($000)
Other Assets and Liabilities (-0.3%)
Other Assets
Investment in Vanguard 4,219
Receivables for Accrued Income 53,409
Receivables for Capital Shares Issued 71,564
Variation Margin Receivable—
Futures Contracts 103
Total Other Assets 129,295
Liabilities
Payables for Investment Securities
Purchased (45,265)
Collateral for Securities on Loan (235,181)
Payables for Capital Shares Redeemed (39,575)
Payables for Distributions (1)
Payables to Vanguard (25,027)
Other Liabilities (30)
Total Liabilities (345,079)
Net Assets (100%) 80,602,950
Paid-in Capital 48,214,393
Undistributed Net Investment Income 2,502
Accumulated Net Realized Losses (1,354,183)
Unrealized Appreciation (Depreciation)
Investment Securities 33,743,266
Futures Contracts (3,028)
Net Assets 80,602,950
Investor Shares—Net Assets
Applicable to 41,227,695 outstanding
$.001 par value shares of beneficial
interest (unlimited authorization) 3,179,888
Net Asset Value Per Share—
Investor Shares $77.13
ETF Shares—Net Assets
Applicable to 236,257,996 outstanding
$.001 par value shares of beneficial
interest (unlimited authorization) 35,395,527
Net Asset Value Per Share—
ETF Shares $149.82
Admiral Shares—Net Assets
Applicable to 367,312,886 outstanding
$.001 par value shares of beneficial
interest (unlimited authorization) 28,326,275
Net Asset Value Per Share—
Admiral Shares $77.12
12

Growth Index Fund
Amount
($000)
Institutional Shares—Net Assets
Applicable to 177,657,840 outstanding
$.001 par value shares of beneficial
interest (unlimited authorization) 13,701,260
Net Asset Value Per Share—
Institutional Shares $77.12
• See Note A in Notes to Financial Statements.
* Non-income-producing security.
^ Includes partial security positions on loan to broker-dealers. The total value of securities on loan is $225,208,000.
1 The fund invests a portion of its cash reserves in equity markets through the use of index futures contracts. After giving effect to futures investments, the fund’s effective common stock and temporary cash investment positions represent 100.0% and 0.3%, respectively, of net assets.
2 Affiliated money market fund available only to Vanguard funds and certain trusts and accounts managed by Vanguard. Rate shown is the 7-day yield.
3 Includes $235,181,000 of collateral received for securities on loan.
4 Securities with a value of $5,766,000 have been segregated as initial margin for open futures contracts.
See accompanying Notes, which are an integral part of the Financial Statements.
Derivative Financial Instruments Outstanding as of Period End
Futures Contracts
($000)
Value and
Number of Unrealized
Long (Short) Notional Appreciation
Expiration Contracts Amount (Depreciation)
Long Futures Contracts
E-mini S&P 500 Index September 2018 982 133,631 (3,028)
Unrealized appreciation (depreciation) on open futures contracts is required to be treated as realized
gain (loss) for tax purposes.
13
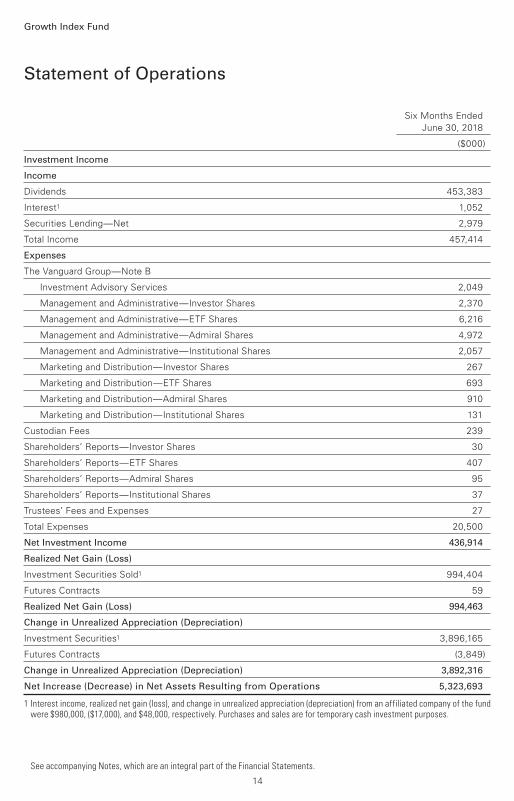
Six Months Ended
June 30, 2018
($000)
Investment Income
Income
Dividends 453,383
Interest1 1,052
Securities Lending—Net 2,979
Total Income 457,414
Expenses
The Vanguard Group—Note B
Investment Advisory Services 2,049
Management and Administrative—Investor Shares 2,370
Management and Administrative—ETF Shares 6,216
Management and Administrative—Admiral Shares 4,972
Management and Administrative—Institutional Shares 2,057
Marketing and Distribution—Investor Shares 267
Marketing and Distribution—ETF Shares 693
Marketing and Distribution—Admiral Shares 910
Marketing and Distribution—Institutional Shares 131
Custodian Fees 239
Shareholders’ Reports—Investor Shares 30
Shareholders’ Reports—ETF Shares 407
Shareholders’ Reports—Admiral Shares 95
Shareholders’ Reports—Institutional Shares 37
Trustees’ Fees and Expenses 27
Total Expenses 20,500
Net Investment Income 436,914
Realized Net Gain (Loss)
Investment Securities Sold1 994,404
Futures Contracts 59
Realized Net Gain (Loss) 994,463
Change in Unrealized Appreciation (Depreciation)
Investment Securities1 3,896,165
Futures Contracts (3,849)
Change in Unrealized Appreciation (Depreciation) 3,892,316
Net Increase (Decrease) in Net Assets Resulting from Operations 5,323,693
1 Interest income, realized net gain (loss), and change in unrealized appreciation (depreciation) from an affiliated company of the fund were $980,000, ($17,000), and $48,000, respectively. Purchases and sales are for temporary cash investment purposes.
Statement of Operations
Growth Index Fund
See accompanying Notes, which are an integral part of the Financial Statements.
14

Statement of Changes in Net Assets
Growth Index Fund
See accompanying Notes, which are an integral part of the Financial Statements.
Six Months Ended Year Ended
June 30, December 31,
2018 2017
($000) ($000)
Increase (Decrease) in Net Assets
Operations
Net Investment Income 436,914 817,270
Realized Net Gain (Loss) 994,463 2,678,539
Change in Unrealized Appreciation (Depreciation) 3,892,316 11,974,496
Net Increase (Decrease) in Net Assets Resulting from Operations 5,323,693 15,470,305
Distributions
Net Investment Income
Investor Shares (15,071) (36,010)
ETF Shares (180,554) (350,060)
Admiral Shares (146,068) (286,472)
Institutional Shares (70,953) (144,292)
Realized Capital Gain
Investor Shares — —
ETF Shares — —
Admiral Shares — —
Institutional Shares — —
Total Distributions (412,646) (816,834)
Capital Share Transactions
Investor Shares (237,741) (467,007)
ETF Shares 1,844,547 2,142,821
Admiral Shares 590,644 2,282,546
Institutional Shares 377,799 176,388
Net Increase (Decrease) from Capital Share Transactions 2,575,249 4,134,748
Total Increase (Decrease) 7,486,296 18,788,219
Net Assets
Beginning of Period 73,116,654 54,328,435
End of Period1 80,602,950 73,116,654
1 Net Assets—End of Period includes undistributed (overdistributed) net investment income of $2,502,000 and ($21,766,000).
15
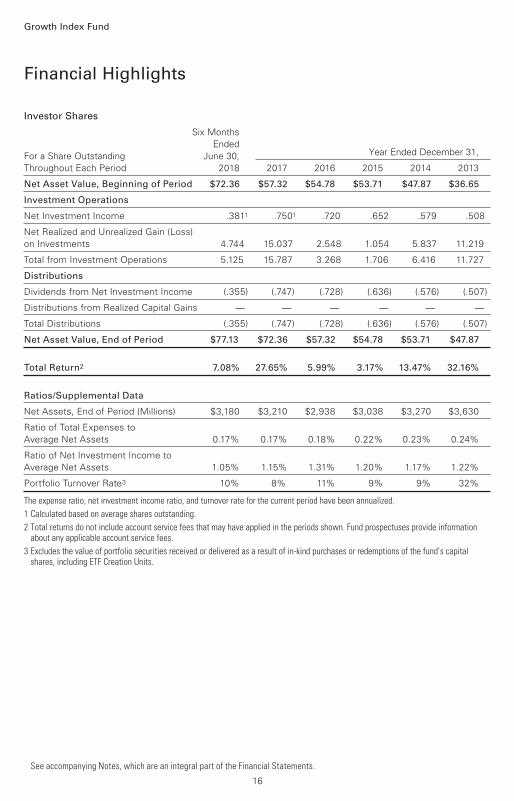
Investor Shares
Six Months
Ended
For a Share Outstanding June 30, Year Ended December 31,
Throughout Each Period 2018 2017 2016 2015 2014 2013
Net Asset Value, Beginning of Period $72.36 $57.32 $54.78 $53.71 $47.87 $36.65
Investment Operations
Net Investment Income .3811 .7501 .720 .652 .579 .508
Net Realized and Unrealized Gain (Loss)
on Investments 4.744 15.037 2.548 1.054 5.837 11.219
Total from Investment Operations 5.125 15.787 3.268 1.706 6.416 11.727
Distributions
Dividends from Net Investment Income (.355) (.747) (.728) (.636) (.576) (.507)
Distributions from Realized Capital Gains — — — — — —
Total Distributions (.355) (.747) (.728) (.636) (.576) (.507)
Net Asset Value, End of Period $77.13 $72.36 $57.32 $54.78 $53.71 $47.87
Total Return2 7.08% 27.65% 5.99% 3.17% 13.47% 32.16%
Ratios/Supplemental Data
Net Assets, End of Period (Millions) $3,180 $3,210 $2,938 $3,038 $3,270 $3,630
Ratio of Total Expenses to
Average Net Assets 0.17% 0.17% 0.18% 0.22% 0.23% 0.24%
Ratio of Net Investment Income to
Average Net Assets 1.05% 1.15% 1.31% 1.20% 1.17% 1.22%
Portfolio Turnover Rate3 10% 8% 11% 9% 9% 32%
The expense ratio, net investment income ratio, and turnover rate for the current period have been annualized.
1 Calculated based on average shares outstanding.
2 Total returns do not include account service fees that may have applied in the periods shown. Fund prospectuses provide information about any applicable account service fees.
3 Excludes the value of portfolio securities received or delivered as a result of in-kind purchases or redemptions of the fund’s capital shares, including ETF Creation Units.
Financial Highlights
See accompanying Notes, which are an integral part of the Financial Statements.
Growth Index Fund
16

ETF Shares
Six Months
Ended
For a Share Outstanding June 30, Year Ended December 31,
Throughout Each Period 2018 2017 2016 2015 2014 2013
Net Asset Value, Beginning of Period $140.55 $111.33 $106.40 $104.33 $92.99 $71.19
Investment Operations
Net Investment Income .8311 1.6261 1.528 1.420 1.268 1.112
Net Realized and Unrealized Gain (Loss)
on Investments 9.218 29.200 4.949 2.038 11.332 21.798
Total from Investment Operations 10.049 30.826 6.477 3.458 12.600 22.910
Distributions
Dividends from Net Investment Income (.779) (1.606) (1.547) (1.388) (1.260) (1.110)
Distributions from Realized Capital Gains — — — — — —
Total Distributions (.779) (1.606) (1.547) (1.388) (1.260) (1.110)
Net Asset Value, End of Period $149.82 $140.55 $111.33 $106.40 $104.33 $92.99
Total Return 7.16% 27.80% 6.13% 3.32% 13.62% 32.38%
Ratios/Supplemental Data
Net Assets, End of Period (Millions) $35,396 $31,399 $23,040 $20,706 $17,340 $13,265
Ratio of Total Expenses to
Average Net Assets 0.05% 0.05% 0.06% 0.08% 0.09% 0.09%
Ratio of Net Investment Income to
Average Net Assets 1.17% 1.27% 1.43% 1.34% 1.31% 1.37%
Portfolio Turnover Rate2 10% 8% 11% 9% 9% 32%
The expense ratio, net investment income ratio, and turnover rate for the current period have been annualized.
1 Calculated based on average shares outstanding.
2 Excludes the value of portfolio securities received or delivered as a result of in-kind purchases or redemptions of the fund’s capital shares, including ETF Creation Units.
Financial Highlights
See accompanying Notes, which are an integral part of the Financial Statements.
Growth Index Fund
17
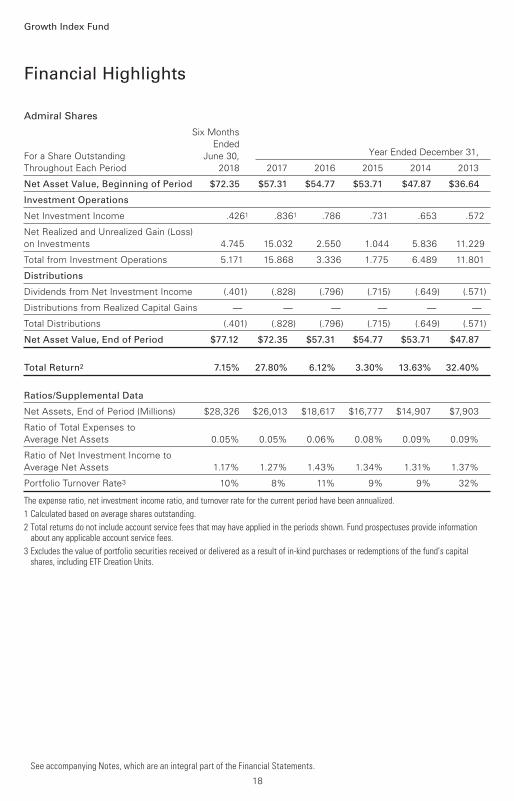
Admiral Shares
Six Months
Ended
For a Share Outstanding June 30, Year Ended December 31,
Throughout Each Period 2018 2017 2016 2015 2014 2013
Net Asset Value, Beginning of Period $72.35 $57.31 $54.77 $53.71 $47.87 $36.64
Investment Operations
Net Investment Income .4261 .8361 .786 .731 .653 .572
Net Realized and Unrealized Gain (Loss)
on Investments 4.745 15.032 2.550 1.044 5.836 11.229
Total from Investment Operations 5.171 15.868 3.336 1.775 6.489 11.801
Distributions
Dividends from Net Investment Income (.401) (.828) (.796) (.715) (.649) (.571)
Distributions from Realized Capital Gains — — — — — —
Total Distributions (.401) (.828) (.796) (.715) (.649) (.571)
Net Asset Value, End of Period $77.12 $72.35 $57.31 $54.77 $53.71 $47.87
Total Return2 7.15% 27.80% 6.12% 3.30% 13.63% 32.40%
Ratios/Supplemental Data
Net Assets, End of Period (Millions) $28,326 $26,013 $18,617 $16,777 $14,907 $7,903
Ratio of Total Expenses to
Average Net Assets 0.05% 0.05% 0.06% 0.08% 0.09% 0.09%
Ratio of Net Investment Income to
Average Net Assets 1.17% 1.27% 1.43% 1.34% 1.31% 1.37%
Portfolio Turnover Rate3 10% 8% 11% 9% 9% 32%
The expense ratio, net investment income ratio, and turnover rate for the current period have been annualized.
1 Calculated based on average shares outstanding.
2 Total returns do not include account service fees that may have applied in the periods shown. Fund prospectuses provide information about any applicable account service fees.
3 Excludes the value of portfolio securities received or delivered as a result of in-kind purchases or redemptions of the fund’s capital shares, including ETF Creation Units.
Financial Highlights
See accompanying Notes, which are an integral part of the Financial Statements.
Growth Index Fund
18

Institutional Shares
Six Months
Ended
For a Share Outstanding June 30, Year Ended December 31,
Throughout Each Period 2018 2017 2016 2015 2014 2013
Net Asset Value, Beginning of Period $72.35 $57.31 $54.77 $53.70 $47.87 $36.64
Investment Operations
Net Investment Income .4301 .8411 .792 .737 .657 .576
Net Realized and Unrealized Gain (Loss)
on Investments 4.744 15.032 2.549 1.053 5.826 11.229
Total from Investment Operations 5.174 15.873 3.341 1.790 6.483 11.805
Distributions
Dividends from Net Investment Income (.404) (.833) (.801) (.720) (.653) (.575)
Distributions from Realized Capital Gains — — — — — —
Total Distributions (.404) (.833) (.801) (.720) (.653) (.575)
Net Asset Value, End of Period $77.12 $72.35 $57.31 $54.77 $53.70 $47.87
Total Return 7.15% 27.81% 6.13% 3.33% 13.62% 32.41%
Ratios/Supplemental Data
Net Assets, End of Period (Millions) $13,701 $12,495 $9,733 $9,380 $9,545 $8,015
Ratio of Total Expenses to
Average Net Assets 0.04% 0.04% 0.05% 0.07% 0.08% 0.08%
Ratio of Net Investment Income to
Average Net Assets 1.18% 1.28% 1.44% 1.35% 1.32% 1.38%
Portfolio Turnover Rate2 10% 8% 11% 9% 9% 32%
The expense ratio, net investment income ratio, and turnover rate for the current period have been annualized.
1 Calculated based on average shares outstanding.
2 Excludes the value of portfolio securities received or delivered as a result of in-kind purchases or redemptions of the fund’s capital shares, including ETF Creation Units.
Financial Highlights
See accompanying Notes, which are an integral part of the Financial Statements.
Growth Index Fund
19

Notes to Financial Statements
Growth Index Fund
Vanguard Growth Index Fund is registered under the Investment Company Act of 1940 as an
open-end investment company, or mutual fund. The fund offers four classes of shares: Investor
Shares, ETF Shares, Admiral Shares, and Institutional Shares. Investor Shares are available to
any investor who meets the fund’s minimum purchase requirements. ETF Shares are listed for
trading on NYSE Arca; they can be purchased and sold through a broker. Admiral Shares and
Institutional Shares are designed for investors who meet certain administrative, service, and
account-size criteria.
A. The following significant accounting policies conform to generally accepted accounting
principles for U.S. investment companies. The fund consistently follows such policies in
preparing its financial statements.
1. Security Valuation: Securities are valued as of the close of trading on the New York Stock
Exchange (generally 4 p.m., Eastern time) on the valuation date. Equity securities are valued at the
latest quoted sales prices or official closing prices taken from the primary market in which each
security trades; such securities not traded on the valuation date are valued at the mean of the
latest quoted bid and asked prices. Securities for which market quotations are not readily available,
or whose values have been materially affected by events occurring before the fund’s pricing time
but after the close of the securities’ primary markets, are valued by methods deemed by the board
of trustees to represent fair value. Investments in Vanguard Market Liquidity Fund are valued at that
fund’s net asset value. Temporary cash investments are valued using the latest bid prices or using
valuations based on a matrix system (which considers such factors as security prices, yields,
maturities, and ratings), both as furnished by independent pricing services.
2. Futures Contracts: The fund uses index futures contracts to a limited extent, with the objectives of
maintaining full exposure to the stock market, maintaining liquidity, and minimizing transaction costs.
The fund may purchase futures contracts to immediately invest incoming cash in the market, or sell
futures in response to cash outflows, thereby simulating a fully invested position in the underlying
index while maintaining a cash balance for liquidity. The primary risks associated with the use of
futures contracts are imperfect correlation between changes in market values of stocks held by the
fund and the prices of futures contracts, and the possibility of an illiquid market. Counterparty risk
involving futures is mitigated because a regulated clearinghouse is the counterparty instead of the
clearing broker. To further mitigate counterparty risk, the fund trades futures contracts on an
exchange, monitors the financial strength of its clearing brokers and clearinghouse, and has
entered into clearing agreements with its clearing brokers. The clearinghouse imposes initial margin
requirements to secure the fund’s performance and requires daily settlement of variation margin
representing changes in the market value of each contract.
Futures contracts are valued at their quoted daily settlement prices. The notional amounts of the
contracts are not recorded in the Statement of Net Assets. Fluctuations in the value of the contracts
are recorded in the Statement of Net Assets as an asset (liability) and in the Statement of Operations
as unrealized appreciation (depreciation) until the contracts are closed, when they are recorded as
realized futures gains (losses).
During the six months ended June 30, 2018, the fund’s average investments in long and short
futures contracts represented less than 1% and 0% of net assets, respectively, based on the
average of the notional amounts at each quarter-end during the period.
20

Growth Index Fund
3. Federal Income Taxes: The fund intends to continue to qualify as a regulated investment
company and distribute all of its taxable income. Management has analyzed the fund’s tax positions
taken for all open federal income tax years (December 31, 2014–2017), and for the period ended
June 30, 2018, and has concluded that no provision for federal income tax is required in the fund’s
financial statements.
4. Distributions: Distributions to shareholders are recorded on the ex-dividend date.
5. Securities Lending: To earn additional income, the fund lends its securities to qualified
institutional borrowers. Security loans are subject to termination by the fund at any time, and are
required to be secured at all times by collateral in an amount at least equal to the market value of
securities loaned. Daily market fluctuations could cause the value of loaned securities to be more
or less than the value of the collateral received. When this occurs, the collateral is adjusted and
settled before the opening of the market on the next business day. The fund further mitigates its
counterparty risk by entering into securities lending transactions only with a diverse group of
prequalified counterparties, monitoring their financial strength, and entering into master securities
lending agreements with its counterparties. The master securities lending agreements provide that,
in the event of a counterparty’s default (including bankruptcy), the fund may terminate any loans
with that borrower, determine the net amount owed, and sell or retain the collateral up to the net
amount owed to the fund; however, such actions may be subject to legal proceedings. While
collateral mitigates counterparty risk, in the event of a default, the fund may experience delays
and costs in recovering the securities loaned. The fund invests cash collateral received in Vanguard
Market Liquidity Fund, and records a liability in the Statement of Net Assets for the return of the
collateral, during the period the securities are on loan. Securities lending income represents fees
charged to borrowers plus income earned on invested cash collateral, less expenses associated
with the loan. During the term of the loan, the fund is entitled to all distributions made on or in
respect of the loaned securities.
6. Credit Facility: The fund and certain other funds managed by The Vanguard Group (“Vanguard”)
participate in a $3.1 billion committed credit facility provided by a syndicate of lenders pursuant to
a credit agreement that may be renewed annually; each fund is individually liable for its borrowings,
if any, under the credit facility. Borrowings may be utilized for temporary and emergency purposes,
and are subject to the fund’s regulatory and contractual borrowing restrictions. The participating
funds are charged administrative fees and an annual commitment fee of 0.10% of the undrawn
amount of the facility; these fees are allocated to the funds based on a method approved by the
fund’s board of trustees and included in Management and Administrative expenses on the fund’s
Statement of Operations. Any borrowings under this facility bear interest at a rate based upon the
higher of the one-month London Interbank Offered Rate, federal funds effective rate, or overnight
bank funding rate plus an agreed-upon spread.
The fund had no borrowings outstanding at June 30, 2018, or at any time during the period
then ended.
7. Other: Dividend income is recorded on the ex-dividend date. Interest income includes income
distributions received from Vanguard Market Liquidity Fund and is accrued daily. Premiums and
discounts on debt securities purchased are amortized and accreted, respectively, to interest income
over the lives of the respective securities. Security transactions are accounted for on the date
securities are bought or sold. Costs used to determine realized gains (losses) on the sale of
investment securities are those of the specific securities sold.
21

Growth Index Fund
Each class of shares has equal rights as to assets and earnings, except that each class separately
bears certain class-specific expenses related to maintenance of shareholder accounts (included in
Management and Administrative expenses), shareholder reporting, and the proxy. Marketing and
distribution expenses are allocated to each class of shares based on a method approved by the
board of trustees. Income, other non-class-specific expenses, and gains and losses on
investments are allocated to each class of shares based on its relative net assets.
B. In accordance with the terms of a Funds’ Service Agreement (the “FSA”) between Vanguard
and the fund, Vanguard furnishes to the fund investment advisory, corporate management,
administrative, marketing, and distribution services at Vanguard’s cost of operations (as defined by
the FSA). These costs of operations are allocated to the fund based on methods and guidelines
approved by the board of trustees. Vanguard does not require reimbursement in the current period
for certain costs of operations (such as deferred compensation/benefits and risk/insurance costs);
the fund’s liability for these costs of operations is included in Payables to Vanguard on the Statement
of Net Assets. All other costs of operations payable to Vanguard are generally settled twice a month.
Upon the request of Vanguard, the fund may invest up to 0.40% of its net assets as capital in
Vanguard. At June 30, 2018, the fund had contributed to Vanguard capital in the amount of
$4,219,000, representing 0.01% of the fund’s net assets and 1.69% of Vanguard’s capitalization.
The fund’s trustees and officers are also directors and employees, respectively, of Vanguard.
C. Various inputs may be used to determine the value of the fund’s investments. These inputs are
summarized in three broad levels for financial statement purposes. The inputs or methodologies
used to value securities are not necessarily an indication of the risk associated with investing in
those securities.
Level 1—Quoted prices in active markets for identical securities.
Level 2—Other significant observable inputs (including quoted prices for similar securities, interest
rates, prepayment speeds, credit risk, etc.).
Level 3—Significant unobservable inputs (including the fund’s own assumptions used to determine
the fair value of investments). Any investments valued with significant unobservable inputs are
noted on the Statement of Net Assets.
The following table summarizes the market value of the fund’s investments as of June 30, 2018,
based on the inputs used to value them:
Level 1 Level 2 Level 3
Investments ($000) ($000) ($000)
Common Stocks 80,485,858 — —
Temporary Cash Investments 325,423 7,453 —
Futures Contracts—Assets1 103 — —
Total 80,811,384 7,453 —
1 Represents variation margin on the last day of the reporting period.
22
Growth Index Fund
D. Distributions are determined on a tax basis and may differ from net investment income and
realized capital gains for financial reporting purposes. Differences may be permanent or temporary.
Permanent differences are reclassified among capital accounts in the financial statements to reflect
their tax character. Temporary differences arise when certain items of income, expense, gain, or
loss are recognized in different periods for financial statement and tax purposes. These differences
will reverse at some time in the future. Differences in classification may also result from the
treatment of short-term gains as ordinary income for tax purposes.
During the six months ended June 30, 2018, the fund realized $1,206,823,000 of net capital gains
resulting from in-kind redemptions—in which shareholders exchanged fund shares for securities
held by the fund rather than for cash. Because such gains are not taxable to the fund, and are not
distributed to shareholders, they have been reclassified from accumulated net realized losses to
paid-in capital.
The fund’s tax-basis capital gains and losses are determined only at the end of each fiscal year. For
tax purposes, at December 31, 2017, the fund had available capital losses totaling $1,138,498,000
that may be carried forward indefinitely to offset future net capital gains. The fund will use
these capital losses to offset net taxable capital gains, if any, realized during the year ending
December 31, 2018; should the fund realize net capital losses for the year, the losses will be
added to the loss carryforward balance above.
At June 30, 2018, the cost of investment securities for tax purposes was $47,075,468,000. Net
unrealized appreciation of investment securities for tax purposes was $33,743,266,000, consisting
of unrealized gains of $34,381,328,000 on securities that had risen in value since their purchase
and $638,062,000 in unrealized losses on securities that had fallen in value since their purchase.
E. During the six months ended June 30, 2018, the fund purchased $9,525,807,000 of investment
securities and sold $6,877,688,000 of investment securities, other than temporary cash investments.
Purchases and sales include $5,003,477,000 and $3,214,244,000, respectively, in connection with
in-kind purchases and redemptions of the fund’s capital shares.
The fund purchased securities from and sold securities to other Vanguard funds or accounts
managed by Vanguard or its affiliates, in accordance with procedures adopted by the board
of trustees in compliance with Rule 17a-7 of the Investment Company Act of 1940. For the
six months ended June 30, 2018, such purchases and sales were $570,683,000 and
$1,499,325,000, respectively; these amounts are included in the purchases and sales
of investment securities noted above.
23

Growth Index Fund
F. Capital share transactions for each class of shares were:
Six Months Ended Year Ended
June 30, 2018 December 31, 2017
Amount Shares Amount Shares
($000) (000) ($000) (000)
Investor Shares (sample)
Issued 288,387 3,818 574,900 8,773
Issued in Lieu of Cash Distributions 13,964 181 33,555 500
Redeemed (540,092) (7,128) (1,075,462) (16,179)
Net Increase (Decrease)—Investor Shares (237,741) (3,129) (467,007) (6,906)
ETF Shares
Issued 5,079,931 34,481 7,231,868 55,920
Issued in Lieu of Cash Distributions — — — —
Redeemed (3,235,384) (21,625) (5,089,047) (39,475)
Net Increase (Decrease)—ETF Shares 1,844,547 12,856 2,142,821 16,445
Admiral Shares
Issued 2,890,229 38,272 5,551,319 84,396
Issued in Lieu of Cash Distributions 130,078 1,688 254,602 3,779
Redeemed (2,429,663) (32,208) (3,523,375) (53,477)
Net Increase (Decrease)—Admiral Shares 590,644 7,752 2,282,546 34,698
Institutional Shares
Issued 1,370,742 18,165 2,399,897 36,639
Issued in Lieu of Cash Distributions 66,201 859 135,176 2,010
Redeemed (1,059,144) (14,070) (2,358,685) (35,775)
Net Increase (Decrease)—Institutional Shares 377,799 4,954 176,388 2,874
G. Management has determined that no events or transactions occurred subsequent to
June 30, 2018, that would require recognition or disclosure in these financial statements.
24

Value Index Fund
Fund ProfileAs of June 30, 2018
1 The expense ratios shown are from the prospectus dated April 25, 2018, and represent estimated costs for the current fiscal year. Forthe six months ended June 30, 2018, the annualized expense ratios were 0.17% for Investor Shares, 0.05% for ETF Shares, 0.05% forAdmiral Shares, and 0.04% for Institutional Shares.
25
Share-Class Characteristics
Investor
Shares ETF Shares
Admiral
Shares
Institutional
Shares
Ticker Symbol VIVAX VTV VVIAX VIVIX
Expense Ratio1 0.17% 0.05% 0.05% 0.04%
30-Day SEC Yield 2.43% 2.55% 2.55% 2.56%
Volatility Measures
CRSP US
Large Cap
Value Index
DJ
U.S. Total
Market
FA Index
R-Squared 1.00 0.92
Beta 1.00 0.93
These measures show the degree and timing of the fund’s fluctuations compared with the indexes over 36 months.
Portfolio Characteristics
Fund
CRSP US
Large Cap
Value
Index
DJ
U.S. Total
Market
FA Index
Number of Stocks 339 336 3,779
Median Market Cap $100.0B $100.0B $64.0B
Price/Earnings Ratio 17.3x 17.3x 20.7x
Price/Book Ratio 2.3x 2.3x 3.0x
Return on Equity 14.8% 14.6% 15.0%
Earnings Growth Rate 3.1% 3.1% 8.3%
Dividend Yield 2.5% 2.5% 1.8%
Foreign Holdings 0.0% 0.0% 0.0%
Turnover Rate
(Annualized) 9% — —
Short-Term Reserves 0.0% — —
Ten Largest Holdings (% of total net assets)
Microsoft Corp. Software 6.1%
Berkshire Hathaway Inc. Reinsurance 2.9
JPMorgan Chase & Co. Banks 2.9
Exxon Mobil Corp. Integrated Oil & Gas 2.8
Johnson & Johnson Pharmaceuticals 2.6
Bank of America Corp. Banks 2.2
Wells Fargo & Co. Banks 2.0
Chevron Corp. Integrated Oil & Gas 1.9
UnitedHealth Group Inc. Health Care
Providers 1.9
AT&T Inc. Fixed Line
Telecommunications 1.9
Top Ten 27.2%
The holdings listed exclude any temporary cash investments andequity index products.
Sector Diversification (% of equity exposure)
Fund
CRSP USLarge Cap
ValueIndex
DJU.S. Total
MarketFA Index
Basic Materials 3.2% 3.2% 2.5%
Consumer Goods 9.4 9.4 8.1
Consumer Services 6.9 6.9 13.3
Financials 24.1 24.1 19.9
Health Care 14.5 14.5 12.6
Industrials 9.9 9.9 12.7
Oil & Gas 8.4 8.4 6.1
Technology 14.5 14.5 20.1
Telecommunications 3.7 3.7 1.8
Utilities 5.4 5.4 2.9
Sector categories are based on the Industry ClassificationBenchmark (“ICB”), except for the “Other” category (if applicable),which includes securities that have not been provided an ICBclassification as of the effective reporting period.

Value Index Fund-2
26
Investment Focus
Market Cap
Value
Large
Medium
Small
Blend Growth Style
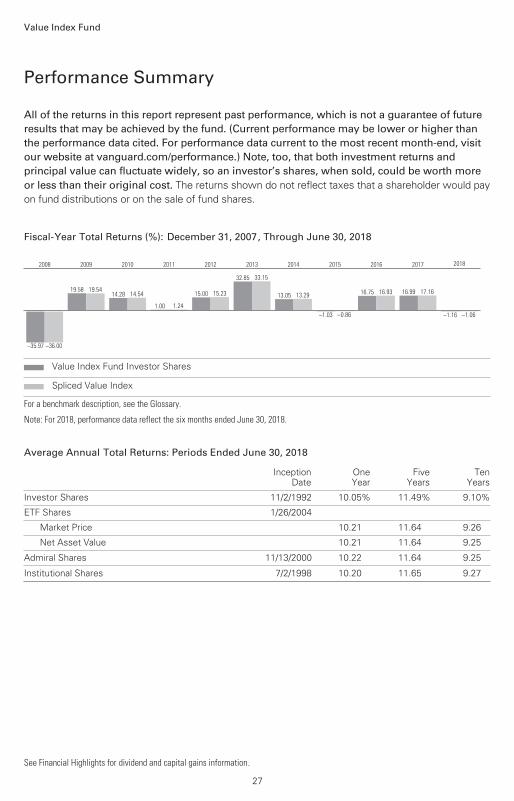
All of the returns in this report represent past performance, which is not a guarantee of future results that may be achieved by the fund. (Current performance may be lower or higher thanthe performance data cited. For performance data current to the most recent month-end, visitour website at vanguard.com/performance.) Note, too, that both investment returns and principal value can fluctuate widely, so an investor’s shares, when sold, could be worth more or less than their original cost. The returns shown do not reflect taxes that a shareholder would pay
on fund distributions or on the sale of fund shares.
Performance Summary
Value Index Fund
See Financial Highlights for dividend and capital gains information.
27
Fiscal-Year Total Returns (%): December 31, 2007, Through June 30, 2018
–35.97 –36.00
2008
19.58 19.54
2009
14.28 14.54
2010
1.00 1.24
2011
15.00 15.23
2012
32.85 33.15
2013
13.05 13.29
2014
–1.03 –0.86
2015
16.75 16.93
2016
16.99 17.16
2017
–1.16 –1.06
2018
Value Index Fund Investor Shares
Spliced Value Index
For a benchmark description, see the Glossary.
Note: For 2018, performance data reflect the six months ended June 30, 2018.
Average Annual Total Returns: Periods Ended June 30, 2018
InceptionDate
OneYear
FiveYears
TenYears
Investor Shares 11/2/1992 10.05% 11.49% 9.10%
ETF Shares 1/26/2004
Market Price 10.21 11.64 9.26
Net Asset Value 10.21 11.64 9.25
Admiral Shares 11/13/2000 10.22 11.64 9.25
Institutional Shares 7/2/1998 10.20 11.65 9.27
Market
Value•
Shares ($000)
Market
Value•
Shares ($000)
Common Stocks (99.8%)1
Basic Materials (3.2%)
DowDuPont Inc. 12,576,049 829,013
LyondellBasell Industries
NV Class A 1,700,079 186,754
Air Products & Chemicals
Inc. 1,188,193 185,037
PPG Industries Inc. 1,351,884 140,231
Freeport-McMoRan Inc. 7,463,762 128,825
International Paper Co. 2,242,482 116,788
Newmont Mining Corp. 2,893,874 109,128
Nucor Corp. 1,722,664 107,666
Celanese Corp. Class A 735,580 81,694
Eastman Chemical Co. 695,552 69,527
Mosaic Co. 1,883,416 52,830
Avery Dennison Corp. 476,405 48,641
Reliance Steel &
Aluminum Co. 371,634 32,533
CF Industries Holdings
Inc. 631,449 28,036* Alcoa Corp. 504,347 23,644
Westlake Chemical Corp. 210,286 22,633
2,162,980
Consumer Goods (9.4%)
Procter & Gamble Co. 13,624,751 1,063,548
Coca-Cola Co. 20,749,814 910,087
PepsiCo Inc. 7,682,746 836,421
Mondelez International
Inc. Class A 7,992,789 327,704
Altria Group Inc. 5,127,612 291,197
General Motors Co. 6,873,120 270,801
Ford Motor Co. 21,220,295 234,909
Kimberly-Clark Corp. 1,893,116 199,421
General Mills Inc. 3,214,255 142,263
VF Corp. 1,722,486 140,417
Archer-Daniels-Midland
Co. 3,031,765 138,946
Aptiv plc 1,435,801 131,562
Dr Pepper Snapple Group
Inc. 977,260 119,226
Tyson Foods Inc. Class A 1,614,108 111,131
Kellogg Co. 1,505,038 105,157
Conagra Brands Inc. 2,130,059 76,107
Genuine Parts Co. 757,401 69,522
Molson Coors Brewing
Co. Class B 1,007,788 68,570
Lear Corp. 358,945 66,696
JM Smucker Co. 583,996 62,768
PVH Corp. 417,078 62,445
Newell Brands Inc. 2,367,171 61,049
Hasbro Inc. 608,649 56,184
Stanley Black & Decker
Inc. 418,908 55,635
Lamb Weston Holdings
Inc. 791,254 54,209
Bunge Ltd. 762,604 53,161* Michael Kors Holdings
Ltd. 782,248 52,098
Whirlpool Corp. 349,366 51,088
BorgWarner Inc. 1,136,789 49,064
Clorox Co. 351,263 47,508^ Hanesbrands Inc. 1,949,080 42,919^ Campbell Soup Co. 1,057,830 42,884
Lennar Corp. Class A 799,847 41,992
PulteGroup Inc. 1,390,795 39,985
DR Horton Inc. 972,392 39,868
Harley-Davidson Inc. 900,741 37,903
Ralph Lauren Corp.
Class A 301,157 37,862
Tapestry Inc. 778,680 36,372
Jefferies Financial Group
Inc. 1,584,934 36,041
Hormel Foods Corp. 717,313 26,691
Ingredion Inc. 196,136 21,712
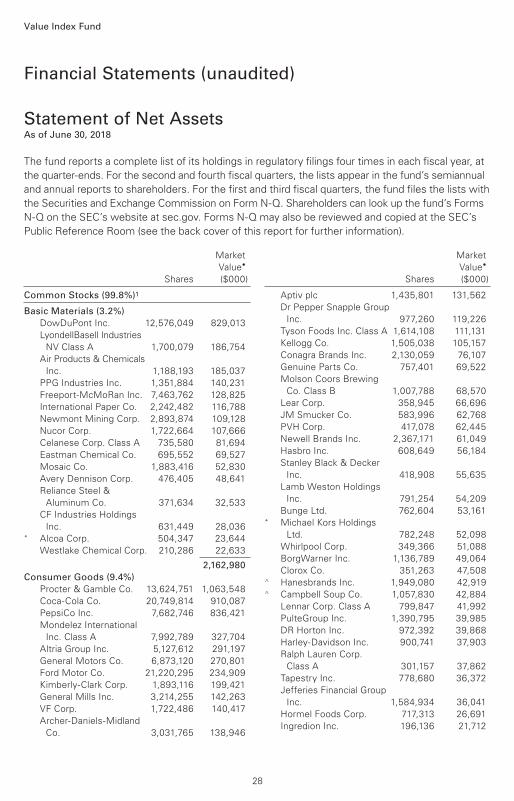
Financial Statements (unaudited)
Statement of Net AssetsAs of June 30, 2018
The fund reports a complete list of its holdings in regulatory filings four times in each fiscal year, at
the quarter-ends. For the second and fourth fiscal quarters, the lists appear in the fund’s semiannual
and annual reports to shareholders. For the first and third fiscal quarters, the fund files the lists with
the Securities and Exchange Commission on Form N-Q. Shareholders can look up the fund’s Forms
N-Q on the SEC’s website at sec.gov. Forms N-Q may also be reviewed and copied at the SEC’s
Public Reference Room (see the back cover of this report for further information).
Value Index Fund
28
Value Index Fund
Market
Value•
Shares ($000)
Market
Value•
Shares ($000)
Goodyear Tire & Rubber
Co. 653,741 15,226* Pilgrim’s Pride Corp. 135,669 2,731
Lennar Corp. Class B 14,996 640
6,331,720
Consumer Services (6.9%)
Walmart Inc. 7,999,504 685,158
CVS Health Corp. 5,510,050 354,572
Twenty-First Century
Fox Inc. Class A 5,712,676 283,863
Walgreens Boots
Alliance Inc. 4,568,296 274,166
Target Corp. 2,889,446 219,945* eBay Inc. 5,117,886 185,575
Sysco Corp. 2,541,334 173,548
Delta Air Lines Inc. 3,423,762 169,613
Las Vegas Sands Corp. 2,139,186 163,348
McKesson Corp. 1,118,570 149,217
Twenty-First Century
Fox Inc. 2,596,582 127,934
Kroger Co. 4,359,636 124,032
CBS Corp. Class B 1,768,237 99,410
Best Buy Co. Inc. 1,297,373 96,758
Omnicom Group Inc. 1,231,230 93,906* United Continental
Holdings Inc. 1,275,970 88,973
American Airlines Group
Inc. 2,281,014 86,587
Cardinal Health Inc. 1,682,005 82,132
AmerisourceBergen
Corp. Class A 892,498 76,103
Darden Restaurants Inc. 670,256 71,758
Kohl’s Corp. 910,808 66,398
Carnival Corp. 1,087,524 62,326
Macy’s Inc. 1,658,723 62,086
Nielsen Holdings plc 1,928,584 59,651
Viacom Inc. Class B 1,970,237 59,422
Advance Auto Parts Inc. 380,817 51,677* Qurate Retail Group Inc.
QVC Group Class A 2,383,143 50,570
Aramark 1,331,838 49,411
Interpublic Group of
Cos. Inc. 2,085,855 48,892
Gap Inc. 1,475,634 47,796
L Brands Inc. 1,282,289 47,291* Discovery
Communications Inc. 1,827,499 46,601* Liberty Media Corp-
Liberty SiriusXM C 928,234 42,105
Tiffany & Co. 319,227 42,010
News Corp. Class A 2,709,884 42,003
Alaska Air Group Inc. 667,600 40,316* DISH Network Corp.
Class A 1,180,930 39,691* CarMax Inc. 481,818 35,110
Nordstrom Inc. 637,715 33,021^,* Discovery
Communications Inc.
Class A 869,697 23,917* Liberty Media Corp-
Liberty SiriusXM A 442,862 19,951
Altice USA Inc. Class A 664,856 11,342
Wyndham Destinations
Inc. 138,125 6,115
CBS Corp. Class A 30,645 1,736
News Corp. Class B 18,801 298
Viacom Inc. Class A 5,457 194
Hilton Worldwide
Holdings Inc. 345 27
4,596,555
Financials (24.0%) * Berkshire Hathaway Inc.
Class B 10,553,683 1,969,845
JPMorgan Chase & Co. 18,450,362 1,922,528
Bank of America Corp. 52,199,055 1,471,491
Wells Fargo & Co. 23,765,669 1,317,569
Citigroup Inc. 13,818,668 924,745
US Bancorp 8,456,598 422,999
Goldman Sachs Group
Inc. 1,842,532 406,407
American Express Co. 3,729,185 365,460
Morgan Stanley 7,195,029 341,044
PNC Financial Services
Group Inc. 2,416,430 326,460
Chubb Ltd. 2,397,743 304,561
CME Group Inc. 1,845,360 302,491
Bank of New York
Mellon Corp. 4,930,044 265,877
American International
Group Inc. 4,864,213 257,901
Capital One Financial
Corp. 2,636,991 242,339
BB&T Corp. 4,225,768 213,148
Prudential Financial Inc. 2,276,485 212,874
MetLife Inc. 4,407,742 192,178
Progressive Corp. 3,156,398 186,701
Aflac Inc. 4,196,776 180,545
Travelers Cos. Inc. 1,464,970 179,224
State Street Corp. 1,880,266 175,034
Allstate Corp. 1,905,417 173,907
SunTrust Banks Inc. 2,521,263 166,454
Discover Financial
Services 1,890,276 133,094
Synchrony Financial 3,889,062 129,817
Equity Residential 1,996,852 127,179
M&T Bank Corp. 708,943 120,627
Northern Trust Corp. 1,158,000 119,147
KeyCorp 5,759,673 112,544
Ameriprise Financial Inc. 783,280 109,565
Willis Towers Watson plc 715,106 108,410
29
Value Index Fund
Market
Value•
Shares ($000)
Market
Value•
Shares ($000)
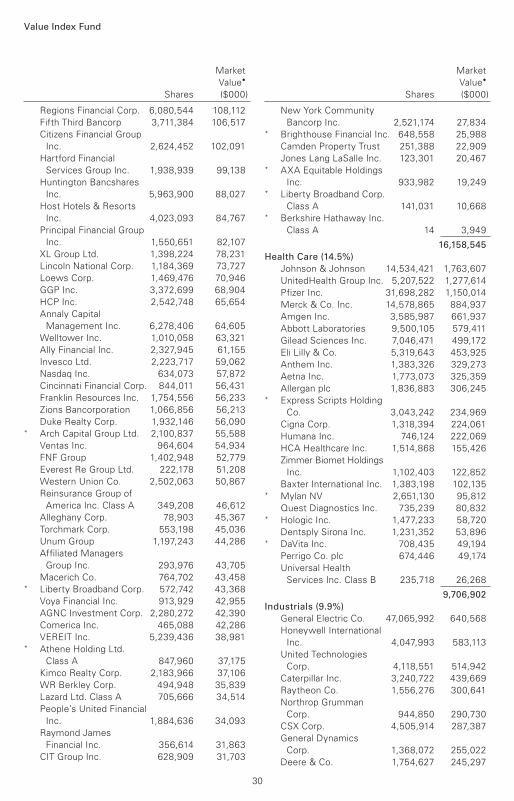
Regions Financial Corp. 6,080,544 108,112
Fifth Third Bancorp 3,711,384 106,517
Citizens Financial Group
Inc. 2,624,452 102,091
Hartford Financial
Services Group Inc. 1,938,939 99,138
Huntington Bancshares
Inc. 5,963,900 88,027
Host Hotels & Resorts
Inc. 4,023,093 84,767
Principal Financial Group
Inc. 1,550,651 82,107
XL Group Ltd. 1,398,224 78,231
Lincoln National Corp. 1,184,369 73,727
Loews Corp. 1,469,476 70,946
GGP Inc. 3,372,699 68,904
HCP Inc. 2,542,748 65,654
Annaly Capital
Management Inc. 6,278,406 64,605
Welltower Inc. 1,010,058 63,321
Ally Financial Inc. 2,327,945 61,155
Invesco Ltd. 2,223,717 59,062
Nasdaq Inc. 634,073 57,872
Cincinnati Financial Corp. 844,011 56,431
Franklin Resources Inc. 1,754,556 56,233
Zions Bancorporation 1,066,856 56,213
Duke Realty Corp. 1,932,146 56,090* Arch Capital Group Ltd. 2,100,837 55,588
Ventas Inc. 964,604 54,934
FNF Group 1,402,948 52,779
Everest Re Group Ltd. 222,178 51,208
Western Union Co. 2,502,063 50,867
Reinsurance Group of
America Inc. Class A 349,208 46,612
Alleghany Corp. 78,903 45,367
Torchmark Corp. 553,198 45,036
Unum Group 1,197,243 44,286
Affiliated Managers
Group Inc. 293,976 43,705
Macerich Co. 764,702 43,458* Liberty Broadband Corp. 572,742 43,368
Voya Financial Inc. 913,929 42,955
AGNC Investment Corp. 2,280,272 42,390
Comerica Inc. 465,088 42,286
VEREIT Inc. 5,239,436 38,981* Athene Holding Ltd.
Class A 847,960 37,175
Kimco Realty Corp. 2,183,966 37,106
WR Berkley Corp. 494,948 35,839
Lazard Ltd. Class A 705,666 34,514
People’s United Financial
Inc. 1,884,636 34,093
Raymond James
Financial Inc. 356,614 31,863
CIT Group Inc. 628,909 31,703
New York Community
Bancorp Inc. 2,521,174 27,834* Brighthouse Financial Inc. 648,558 25,988
Camden Property Trust 251,388 22,909
Jones Lang LaSalle Inc. 123,301 20,467* AXA Equitable Holdings
Inc. 933,982 19,249* Liberty Broadband Corp.
Class A 141,031 10,668* Berkshire Hathaway Inc.
Class A 14 3,949
16,158,545
Health Care (14.5%)
Johnson & Johnson 14,534,421 1,763,607
UnitedHealth Group Inc. 5,207,522 1,277,614
Pfizer Inc. 31,698,282 1,150,014
Merck & Co. Inc. 14,578,865 884,937
Amgen Inc. 3,585,987 661,937
Abbott Laboratories 9,500,105 579,411
Gilead Sciences Inc. 7,046,471 499,172
Eli Lilly & Co. 5,319,643 453,925
Anthem Inc. 1,383,326 329,273
Aetna Inc. 1,773,073 325,359
Allergan plc 1,836,883 306,245* Express Scripts Holding
Co. 3,043,242 234,969
Cigna Corp. 1,318,394 224,061
Humana Inc. 746,124 222,069
HCA Healthcare Inc. 1,514,868 155,426
Zimmer Biomet Holdings
Inc. 1,102,403 122,852
Baxter International Inc. 1,383,198 102,135* Mylan NV 2,651,130 95,812
Quest Diagnostics Inc. 735,239 80,832* Hologic Inc. 1,477,233 58,720
Dentsply Sirona Inc. 1,231,352 53,896* DaVita Inc. 708,435 49,194
Perrigo Co. plc 674,446 49,174
Universal Health
Services Inc. Class B 235,718 26,268
9,706,902
Industrials (9.9%)
General Electric Co. 47,065,992 640,568
Honeywell International
Inc. 4,047,993 583,113
United Technologies
Corp. 4,118,551 514,942
Caterpillar Inc. 3,240,722 439,669
Raytheon Co. 1,556,276 300,641
Northrop Grumman
Corp. 944,850 290,730
CSX Corp. 4,505,914 287,387
General Dynamics
Corp. 1,368,072 255,022
Deere & Co. 1,754,627 245,297
30

Value Index Fund
Market
Value•
Shares ($000)
Market
Value•
Shares ($000)
Emerson Electric Co. 3,414,596 236,085
Norfolk Southern Corp. 1,531,145 231,004
Waste Management Inc. 2,343,817 190,646
Eaton Corp. plc 2,370,520 177,173
TE Connectivity Ltd. 1,898,157 170,948
Danaher Corp. 1,704,375 168,188
Johnson Controls
International plc 5,020,615 167,940
FedEx Corp. 651,977 148,038
Ingersoll-Rand plc 1,344,810 120,670
PACCAR Inc. 1,908,086 118,225
Illinois Tool Works Inc. 825,525 114,368
Cummins Inc. 849,014 112,919
Parker-Hannifin Corp. 719,954 112,205
Textron Inc. 1,250,012 82,388
L3 Technologies Inc. 424,892 81,715
WW Grainger Inc. 257,776 79,498
WestRock Co. 1,391,358 79,335
Republic Services Inc.
Class A 1,154,309 78,909
Ball Corp. 1,890,204 67,197
Dover Corp. 837,454 61,302* First Data Corp. Class A 2,497,485 52,272
Jacobs Engineering
Group Inc. 767,547 48,732
Arconic Inc. 2,359,775 40,140
Fluor Corp. 763,177 37,228
Pentair plc 868,132 36,531* Arrow Electronics Inc. 473,957 35,680* United Rentals Inc. 226,253 33,399* Crown Holdings Inc. 729,992 32,674
ManpowerGroup Inc. 356,268 30,660
Alliance Data Systems
Corp. 128,065 29,865
Allison Transmission
Holdings Inc. 706,551 28,608
Xerox Corp. 1,172,372 28,137
Owens Corning 299,694 18,992
Sealed Air Corp. 436,629 18,535* Stericycle Inc. 231,185 15,094
Flowserve Corp. 354,973 14,341^ ADT Inc. 604,693 5,231
Lockheed Martin Corp. 86 25
6,662,266
Oil & Gas (8.3%)
Exxon Mobil Corp. 22,943,350 1,898,103
Chevron Corp. 10,355,721 1,309,274
ConocoPhillips 6,341,852 441,520
Valero Energy Corp. 2,335,414 258,834
Phillips 66 2,271,711 255,136
Kinder Morgan Inc. 10,165,047 179,616
Marathon Petroleum
Corp. 2,503,513 175,647
Williams Cos. Inc. 4,488,396 121,681
Devon Energy Corp. 2,696,597 118,542
Hess Corp. 1,546,505 103,446
Andeavor 777,269 101,962
Halliburton Co. 2,252,117 101,480
Marathon Oil Corp. 4,619,079 96,354
National Oilwell Varco
Inc. 2,067,604 89,734
ONEOK Inc. 1,112,666 77,698
Baker Hughes a GE Co. 2,253,953 74,448
HollyFrontier Corp. 955,620 65,393
Apache Corp. 1,034,487 48,362
EQT Corp. 720,691 39,768
OGE Energy Corp. 1,080,310 38,038
Helmerich & Payne Inc. 141,254 9,006
5,604,042
Technology (14.5%)
Microsoft Corp. 41,634,362 4,105,564
Intel Corp. 25,251,710 1,255,263
Cisco Systems Inc. 25,484,649 1,096,604
International Business
Machines Corp. 4,974,359 694,918
Oracle Corp. 15,485,479 682,290
QUALCOMM Inc. 8,034,077 450,872
HP Inc. 8,875,923 201,395
DXC Technology Co. 1,549,386 124,896
Corning Inc. 4,503,226 123,884
Hewlett Packard
Enterprise Co. 8,268,065 120,796
Western Digital Corp. 1,541,760 119,348
NetApp Inc. 1,450,581 113,914
Motorola Solutions Inc. 879,251 102,318* Dell Technologies Inc.
Class V 1,079,265 91,284
Seagate Technology plc 1,398,762 78,988
Symantec Corp. 3,372,516 69,643* Synopsys Inc. 805,048 68,888
CA Inc. 1,691,404 60,299
Juniper Networks Inc. 1,890,182 51,829
Marvell Technology
Group Ltd. 2,305,896 49,438
Garmin Ltd. 615,066 37,519
CDW Corp. 412,386 33,317* Advanced Micro
Devices Inc. 130 2
9,733,269
Telecommunications (3.7%)
AT&T Inc. 39,369,373 1,264,151
Verizon
Communications Inc. 22,389,514 1,126,416
CenturyLink Inc. 5,267,333 98,183^,* Sprint Corp. 3,264,369 17,758
2,506,508
Utilities (5.4%)
NextEra Energy Inc. 2,555,006 426,763
Duke Energy Corp. 3,798,669 300,399
Southern Co. 5,486,351 254,073
31

Value Index Fund
Market
Value•
Shares ($000)
Market
Value•
Shares ($000)
Dominion Energy Inc. 3,536,096 241,091
Exelon Corp. 5,229,982 222,797
American Electric Power
Co. Inc. 2,669,919 184,892
Sempra Energy 1,430,581 166,105
Public Service Enterprise
Group Inc. 2,739,281 148,305
Consolidated Edison Inc. 1,683,176 131,254
Xcel Energy Inc. 2,759,373 126,048
PG&E Corp. 2,800,710 119,198
PPL Corp. 4,089,334 116,751
Edison International 1,767,040 111,801
WEC Energy Group Inc. 1,708,642 110,464
DTE Energy Co. 982,757 101,843
Eversource Energy 1,715,608 100,552
FirstEnergy Corp. 2,586,890 92,895
American Water Works
Co. Inc. 964,268 82,329
Ameren Corp. 1,313,296 79,914
Entergy Corp. 978,765 79,074
CMS Energy Corp. 1,532,984 72,479
CenterPoint Energy Inc. 2,336,152 64,735
Alliant Energy Corp. 1,252,041 52,986
NiSource Inc. 1,970,391 51,782
Pinnacle West Capital
Corp. 605,545 48,783
AES Corp. 3,581,220 48,024* Evergy Inc. 733,749 41,200* Vistra Energy Corp. 1,138,046 26,926
Avangrid Inc. 337,160 17,846
SCANA Corp. 365,114 14,064
3,635,373
Total Common Stocks
(Cost $53,374,524) 67,098,160
Temporary Cash Investments (0.2%)1
Money Market Fund (0.2%)2,3 Vanguard Market Liquidity
Fund, 2.122% 1,557,018 155,717
Face
Amount
($000)
U.S. Government and Agency Obligations (0.0%) 4 United States Treasury
Bill, 1.890%, 8/9/18 1,000 9984 United States Treasury
Bill, 2.078%, 11/15/18 6,000 5,955
6,953
Total Temporary Cash Investments
(Cost $162,663) 162,670
Total Investments (100.0%)
(Cost $53,537,187) 67,260,830
Amount
($000)
Other Assets and Liabilities (0.0%)
Other Assets
Investment in Vanguard 3,492
Receivables for Accrued Income 64,948
Receivables for Capital Shares Issued 34,125
Variation Margin Receivable—
Futures Contracts 112
Other Assets 332
Total Other Assets 103,009
Liabilities
Payables for Investment Securities
Purchased (61,174)
Collateral for Securities on Loan (23,695)
Payables for Capital Shares Redeemed (12,036)
Payables for Distributions (2)
Payables to Vanguard (18,143)
Total Liabilities (115,050)
Net Assets (100%) 67,248,789
32

Value Index Fund
At June 30, 2018, net assets consisted of:
Amount
($000)
Amount
($000)
Paid-in Capital 54,176,490
Undistributed Net Investment Income 7,776
Accumulated Net Realized Losses (655,834)
Unrealized Appreciation (Depreciation)
Investment Securities 13,723,643
Futures Contracts (3,286)
Net Asset 67,248,789
Investor Shares—Net Assets
Applicable to 38,027,666 outstanding
$.001 par value shares of beneficial
interest (unlimited authorization) 1,539,893
Net Asset Value Per Share—
Investor Shares $40.49
ETF Shares—Net Assets
Applicable to 373,144,595 outstanding
$.001 par value shares of beneficial
interest (unlimited authorization) 38,725,410
Net Asset Value Per Share—
ETF Shares $103.78
Admiral Shares—Net Assets
Applicable to 418,492,238 outstanding
$.001 par value shares of beneficial
interest (unlimited authorization) 16,942,682
Net Asset Value Per Share—
Admiral Shares $40.49
Institutional Shares—Net Assets
Applicable to 248,020,376 outstanding
$.001 par value shares of beneficial
interest (unlimited authorization) 10,040,804
Net Asset Value Per Share—
Institutional Shares $40.48
• See Note A in Notes to Financial Statements.
* Non-income-producing security.
^ Includes partial security positions on loan to broker-dealers. The total value of securities on loan is $21,804,000.
1 The fund invests a portion of its cash reserves in equity markets through the use of index futures contracts. After giving effect to futures investments, the fund’s effective common stock and temporary cash investment positions represent 100.0% and 0.0%, respectively, of net assets.
2 Affiliated money market fund available only to Vanguard funds and certain trusts and accounts managed by Vanguard. Rate shown is the 7-day yield.
3 Includes $23,695,000 of collateral received for securities on loan.
4 Securities with a value of $6,307,000 have been segregated as initial margin for open futures contracts.
See accompanying Notes, which are an integral part of the Financial Statements.
Derivative Financial Instruments Outstanding as of Period End
Futures Contracts
($000)
Value and
Number of Unrealized
Long (Short) Notional Appreciation
Expiration Contracts Amount (Depreciation)
Long Futures Contracts
E-mini S&P 500 Index September 2018 1,065 144,925 (3,286)
Unrealized appreciation (depreciation) on open futures contracts is required to be treated as realized
gain (loss) for tax purposes.
33

Six Months Ended
June 30, 2018
($000)
Investment Income
Income
Dividends 809,738
Interest1 880
Securities Lending—Net 298
Total Income 810,916
Expenses
The Vanguard Group—Note B
Investment Advisory Services 1,916
Management and Administrative—Investor Shares 1,149
Management and Administrative—ETF Shares 6,614
Management and Administrative—Admiral Shares 2,952
Management and Administrative—Institutional Shares 1,539
Marketing and Distribution—Investor Shares 136
Marketing and Distribution—ETF Shares 889
Marketing and Distribution—Admiral Shares 620
Marketing and Distribution—Institutional Shares 98
Custodian Fees 284
Shareholders’ Reports—Investor Shares 14
Shareholders’ Reports—ETF Shares 445
Shareholders’ Reports—Admiral Shares 65
Shareholders’ Reports—Institutional Shares 41
Trustees’ Fees and Expenses 22
Total Expenses 16,784
Net Investment Income 794,132
Realized Net Gain (Loss)
Investment Securities Sold1 1,111,905
Futures Contracts 3,661
Realized Net Gain (Loss) 1,115,566
Change in Unrealized Appreciation (Depreciation)
Investment Securities1 (2,656,121)
Futures Contracts (4,159)
Change in Unrealized Appreciation (Depreciation) (2,660,280)
Net Increase (Decrease) in Net Assets Resulting from Operations (750,582)
1 Interest income, realized net gain (loss), and change in unrealized appreciation (depreciation) from an affiliated company of the fund were $793,000, ($13,000), and $1,000, respectively. Purchases and sales are for temporary cash investment purposes.
Statement of Operations
Value Index Fund
See accompanying Notes, which are an integral part of the Financial Statements.
34

Statement of Changes in Net Assets
Value Index Fund
See accompanying Notes, which are an integral part of the Financial Statements.
Six Months Ended Year Ended
June 30, December 31,
2018 2017
($000) ($000)
Increase (Decrease) in Net Assets
Operations
Net Investment Income 794,132 1,453,302
Realized Net Gain (Loss) 1,115,566 1,593,601
Change in Unrealized Appreciation (Depreciation) (2,660,280) 6,244,701
Net Increase (Decrease) in Net Assets Resulting from Operations (750,582) 9,291,604
Distributions
Net Investment Income
Investor Shares (17,459) (37,322)
ETF Shares (442,464) (810,631)
Admiral Shares (197,827) (373,158)
Institutional Shares (118,089) (233,385)
Realized Capital Gain
Investor Shares — —
ETF Shares — —
Admiral Shares — —
Institutional Shares — —
Total Distributions (775,839) (1,454,496)
Capital Share Transactions
Investor Shares (50,868) (173,183)
ETF Shares 3,051,750 5,105,313
Admiral Shares 547,783 1,318,632
Institutional Shares 177,798 139,503
Net Increase (Decrease) from Capital Share Transactions 3,726,463 6,390,265
Total Increase (Decrease) 2,200,042 14,227,373
Net Assets
Beginning of Period 65,048,747 50,821,374
End of Period1 67,248,789 65,048,747
1 Net Assets—End of Period includes undistributed (overdistributed) net investment income of $7,776,000 and ($10,517,000).
35

Investor Shares
Six Months
Ended
For a Share Outstanding June 30, Year Ended December 31,
Throughout Each Period 2018 2017 2016 2015 2014 2013
Net Asset Value, Beginning of Period $41.42 $36.24 $31.82 $32.95 $29.78 $22.93
Investment Operations
Net Investment Income .4751 .9181 .850 .782 .691 .621
Net Realized and Unrealized Gain (Loss)
on Investments (.950) 5.166 4.415 (1.130) 3.164 6.847
Total from Investment Operations (.475) 6.084 5.265 (.348) 3.855 7.468
Distributions
Dividends from Net Investment Income (.455) (.904) (.845) (.782) (.685) (.618)
Distributions from Realized Capital Gains — — — — — —
Total Distributions (.455) (.904) (.845) (.782) (.685) (.618)
Net Asset Value, End of Period $40.49 $41.42 $36.24 $31.82 $32.95 $29.78
Total Return2 -1.16% 16.99% 16.75% -1.03% 13.05% 32.85%
Ratios/Supplemental Data
Net Assets, End of Period (Millions) $1,540 $1,626 $1,587 $1,397 $1,593 $1,731
Ratio of Total Expenses to
Average Net Assets 0.17% 0.17% 0.18% 0.22% 0.23% 0.24%
Ratio of Net Investment Income to
Average Net Assets 2.30% 2.40% 2.64% 2.44% 2.25% 2.35%
Portfolio Turnover Rate3 9% 9% 7% 8% 6% 25%
The expense ratio, net investment income ratio, and turnover rate for the current period have been annualized.
1 Calculated based on average shares outstanding.
2 Total returns do not include account service fees that may have applied in the periods shown. Fund prospectuses provide information about any applicable account service fees.
3 Excludes the value of portfolio securities received or delivered as a result of in-kind purchases or redemptions of the fund’s capital shares, including ETF Creation Units.
Financial Highlights
See accompanying Notes, which are an integral part of the Financial Statements.
Value Index Fund
36

ETF Shares
Six Months
Ended
For a Share Outstanding June 30, Year Ended December 31,
Throughout Each Period 2018 2017 2016 2015 2014 2013
Net Asset Value, Beginning of Period $106.14 $92.87 $81.56 $84.45 $76.34 $58.79
Investment Operations
Net Investment Income 1.2781 2.4731 2.282 2.123 1.888 1.700
Net Realized and Unrealized Gain (Loss)
on Investments (2.407) 13.234 11.301 (2.890) 8.095 17.538
Total from Investment Operations (1.129) 15.707 13.583 (.767) 9.983 19.238
Distributions
Dividends from Net Investment Income (1.231) (2.437) (2.273) (2.123) (1.873) (1.688)
Distributions from Realized Capital Gains — — — — — —
Total Distributions (1.231) (2.437) (2.273) (2.123) (1.873) (1.688)
Net Asset Value, End of Period $103.78 $106.14 $92.87 $81.56 $84.45 $76.34
Total Return -1.06% 17.12% 16.88% -0.89% 13.19% 33.03%
Ratios/Supplemental Data
Net Assets, End of Period (Millions) $38,725 $36,560 $27,126 $18,648 $17,277 $12,461
Ratio of Total Expenses to
Average Net Assets 0.05% 0.05% 0.06% 0.08% 0.09% 0.09%
Ratio of Net Investment Income to
Average Net Assets 2.42% 2.52% 2.76% 2.58% 2.39% 2.50%
Portfolio Turnover Rate2 9% 9% 7% 8% 6% 25%
The expense ratio, net investment income ratio, and turnover rate for the current period have been annualized.
1 Calculated based on average shares outstanding.
2 Excludes the value of portfolio securities received or delivered as a result of in-kind purchases or redemptions of the fund’s capital shares, including ETF Creation Units.
Financial Highlights
See accompanying Notes, which are an integral part of the Financial Statements.
Value Index Fund
37

Admiral Shares
Six Months
Ended
For a Share Outstanding June 30, Year Ended December 31,
Throughout Each Period 2018 2017 2016 2015 2014 2013
Net Asset Value, Beginning of Period $41.41 $36.23 $31.82 $32.94 $29.78 $22.93
Investment Operations
Net Investment Income .4991 .9651 .890 .829 .737 .663
Net Realized and Unrealized Gain (Loss)
on Investments (.939) 5.165 4.407 (1.121) 3.154 6.845
Total from Investment Operations (.440) 6.130 5.297 (.292) 3.891 7.508
Distributions
Dividends from Net Investment Income (.480) (.950) (.887) (.828) (.731) (.658)
Distributions from Realized Capital Gains — — — — — —
Total Distributions (.480) (.950) (.887) (.828) (.731) (.658)
Net Asset Value, End of Period $40.49 $41.41 $36.23 $31.82 $32.94 $29.78
Total Return2 -1.07% 17.13% 16.86% -0.86% 13.18% 33.05%
Ratios/Supplemental Data
Net Assets, End of Period (Millions) $16,943 $16,778 $13,424 $10,408 $9,701 $5,054
Ratio of Total Expenses to
Average Net Assets 0.05% 0.05% 0.06% 0.08% 0.09% 0.09%
Ratio of Net Investment Income to
Average Net Assets 2.42% 2.52% 2.76% 2.58% 2.39% 2.50%
Portfolio Turnover Rate3 9% 9% 7% 8% 6% 25%
The expense ratio, net investment income ratio, and turnover rate for the current period have been annualized.
1 Calculated based on average shares outstanding.
2 Total returns do not include account service fees that may have applied in the periods shown. Fund prospectuses provide information about any applicable account service fees.
3 Excludes the value of portfolio securities received or delivered as a result of in-kind purchases or redemptions of the fund’s capital shares, including ETF Creation Units.
Financial Highlights
See accompanying Notes, which are an integral part of the Financial Statements.
Value Index Fund
38

Institutional Shares
Six Months
Ended
For a Share Outstanding June 30, Year Ended December 31,
Throughout Each Period 2018 2017 2016 2015 2014 2013
Net Asset Value, Beginning of Period $41.41 $36.23 $31.82 $32.94 $29.78 $22.93
Investment Operations
Net Investment Income .5011 .9691 .893 .831 .739 .666
Net Realized and Unrealized Gain (Loss)
on Investments (.949) 5.165 4.407 (1.120) 3.154 6.846
Total from Investment Operations (.448) 6.134 5.300 (.289) 3.893 7.512
Distributions
Dividends from Net Investment Income (.482) (.954) (.890) (.831) (.733) (.662)
Distributions from Realized Capital Gains — — — — — —
Total Distributions (.482) (.954) (.890) (.831) (.733) (.662)
Net Asset Value, End of Period $40.48 $41.41 $36.23 $31.82 $32.94 $29.78
Total Return -1.09% 17.14% 16.87% -0.85% 13.19% 33.07%
Ratios/Supplemental Data
Net Assets, End of Period (Millions) $10,041 $10,085 $8,684 $7,176 $7,860 $6,431
Ratio of Total Expenses to
Average Net Assets 0.04% 0.04% 0.05% 0.07% 0.08% 0.08%
Ratio of Net Investment Income to
Average Net Assets 2.43% 2.53% 2.77% 2.59% 2.40% 2.51%
Portfolio Turnover Rate2 9% 9% 7% 8% 6% 25%
The expense ratio, net investment income ratio, and turnover rate for the current period have been annualized.
1 Calculated based on average shares outstanding.
2 Excludes the value of portfolio securities received or delivered as a result of in-kind purchases or redemptions of the fund’s capital shares, including ETF Creation Units.
Financial Highlights
See accompanying Notes, which are an integral part of the Financial Statements.
Value Index Fund
39

Notes to Financial Statements
Value Index Fund
Vanguard Value Index Fund is registered under the Investment Company Act of 1940 as an
open-end investment company, or mutual fund. The fund offers four classes of shares: Investor
Shares, ETF Shares, Admiral Shares, and Institutional Shares. Investor Shares are available to
any investor who meets the fund’s minimum purchase requirements. ETF Shares are listed for
trading on NYSE Arca; they can be purchased and sold through a broker. Admiral Shares and
Institutional Shares are designed for investors who meet certain administrative, service, and
account-size criteria.
A. The following significant accounting policies conform to generally accepted accounting
principles for U.S. investment companies. The fund consistently follows such policies in
preparing its financial statements.
1. Security Valuation: Securities are valued as of the close of trading on the New York Stock
Exchange (generally 4 p.m., Eastern time) on the valuation date. Equity securities are valued at the
latest quoted sales prices or official closing prices taken from the primary market in which each
security trades; such securities not traded on the valuation date are valued at the mean of the
latest quoted bid and asked prices. Securities for which market quotations are not readily available,
or whose values have been materially affected by events occurring before the fund’s pricing time
but after the close of the securities’ primary markets, are valued by methods deemed by the board
of trustees to represent fair value. Investments in Vanguard Market Liquidity Fund are valued at that
fund’s net asset value. Temporary cash investments are valued using the latest bid prices or using
valuations based on a matrix system (which considers such factors as security prices, yields,
maturities, and ratings), both as furnished by independent pricing services.
2. Futures Contracts: The fund uses index futures contracts to a limited extent, with the objectives of
maintaining full exposure to the stock market, maintaining liquidity, and minimizing transaction costs.
The fund may purchase futures contracts to immediately invest incoming cash in the market, or sell
futures in response to cash outflows, thereby simulating a fully invested position in the underlying
index while maintaining a cash balance for liquidity. The primary risks associated with the use of
futures contracts are imperfect correlation between changes in market values of stocks held by the
fund and the prices of futures contracts, and the possibility of an illiquid market. Counterparty risk
involving futures is mitigated because a regulated clearinghouse is the counterparty instead of the
clearing broker. To further mitigate counterparty risk, the fund trades futures contracts on an
exchange, monitors the financial strength of its clearing brokers and clearinghouse, and has
entered into clearing agreements with its clearing brokers. The clearinghouse imposes initial
margin requirements to secure the fund’s performance and requires daily settlement of variation
margin representing changes in the market value of each contract.
Futures contracts are valued at their quoted daily settlement prices. The notional amounts of
the contracts are not recorded in the Statement of Net Assets. Fluctuations in the value of the
contracts are recorded in the Statement of Net Assets as an asset (liability) and in the Statement
of Operations as unrealized appreciation (depreciation) until the contracts are closed, when they
are recorded as realized futures gains (losses).
During the six months ended June 30, 2018, the fund’s average investments in long and short
futures contracts represented less than 1% and 0% of net assets, respectively, based on the
average of the notional amounts at each quarter-end during the period.
40

Value Index Fund
3. Federal Income Taxes: The fund intends to continue to qualify as a regulated investment company
and distribute all of its taxable income. Management has analyzed the fund’s tax positions taken
for all open federal income tax years (December 31, 2014–2017), and for the period ended June 30,
2018, and has concluded that no provision for federal income tax is required in the fund’s financial
statements.
4. Distributions: Distributions to shareholders are recorded on the ex-dividend date.
5. Securities Lending: To earn additional income, the fund lends its securities to qualified institutional
borrowers. Security loans are subject to termination by the fund at any time, and are required to be
secured at all times by collateral in an amount at least equal to the market value of securities loaned.
Daily market fluctuations could cause the value of loaned securities to be more or less than the value
of the collateral received. When this occurs, the collateral is adjusted and settled before the opening
of the market on the next business day. The fund further mitigates its counterparty risk by entering
into securities lending transactions only with a diverse group of prequalified counterparties,
monitoring their financial strength, and entering into master securities lending agreements with
its counterparties. The master securities lending agreements provide that, in the event of a
counterparty’s default (including bankruptcy), the fund may terminate any loans with that borrower,
determine the net amount owed, and sell or retain the collateral up to the net amount owed to the
fund; however, such actions may be subject to legal proceedings. While collateral mitigates
counterparty risk, in the event of a default, the fund may experience delays and costs in recovering
the securities loaned. The fund invests cash collateral received in Vanguard Market Liquidity Fund,
and records a liability in the Statement of Net Assets for the return of the collateral, during the
period the securities are on loan. Securities lending income represents fees charged to borrowers
plus income earned on invested cash collateral, less expenses associated with the loan. During the
term of the loan, the fund is entitled to all distributions made on or in respect of the loaned securities.
6. Credit Facility: The fund and certain other funds managed by The Vanguard Group (“Vanguard”)
participate in a $3.1 billion committed credit facility provided by a syndicate of lenders pursuant to
a credit agreement that may be renewed annually; each fund is individually liable for its borrowings,
if any, under the credit facility. Borrowings may be utilized for temporary and emergency purposes,
and are subject to the fund’s regulatory and contractual borrowing restrictions. The participating
funds are charged administrative fees and an annual commitment fee of 0.10% of the undrawn
amount of the facility; these fees are allocated to the funds based on a method approved by the
fund’s board of trustees and included in Management and Administrative expenses on the fund’s
Statement of Operations. Any borrowings under this facility bear interest at a rate based upon the
higher of the one-month London Interbank Offered Rate, federal funds effective rate, or overnight
bank funding rate plus an agreed-upon spread.
The fund had no borrowings outstanding at June 30, 2018, or at any time during the period
then ended.
7. Other: Dividend income is recorded on the ex-dividend date. Interest income includes income
distributions received from Vanguard Market Liquidity Fund and is accrued daily. Premiums and
discounts on debt securities purchased are amortized and accreted, respectively, to interest
income over the lives of the respective securities. Security transactions are accounted for on
the date securities are bought or sold. Costs used to determine realized gains (losses) on the
sale of investment securities are those of the specific securities sold.
41

Value Index Fund
Each class of shares has equal rights as to assets and earnings, except that each class separately
bears certain class-specific expenses related to maintenance of shareholder accounts (included in
Management and Administrative expenses), shareholder reporting, and the proxy. Marketing and
distribution expenses are allocated to each class of shares based on a method approved by the
board of trustees. Income, other non-class-specific expenses, and gains and losses on investments
are allocated to each class of shares based on its relative net assets.
B. In accordance with the terms of a Funds’ Service Agreement (the “FSA”) between Vanguard
and the fund, Vanguard furnishes to the fund investment advisory, corporate management,
administrative, marketing, and distribution services at Vanguard’s cost of operations (as defined
by the FSA). These costs of operations are allocated to the fund based on methods and guidelines
approved by the board of trustees. Vanguard does not require reimbursement in the current period
for certain costs of operations (such as deferred compensation/benefits and risk/insurance costs);
the fund’s liability for these costs of operations is included in Payables to Vanguard on the Statement
of Net Assets. All other costs of operations payable to Vanguard are generally settled twice a month.
Upon the request of Vanguard, the fund may invest up to 0.40% of its net assets as capital in
Vanguard. At June 30, 2018, the fund had contributed to Vanguard capital in the amount of
$3,492,000, representing 0.01% of the fund’s net assets and 1.40% of Vanguard’s capitalization.
The fund’s trustees and officers are also directors and employees, respectively, of Vanguard.
C. Various inputs may be used to determine the value of the fund’s investments. These inputs are
summarized in three broad levels for financial statement purposes. The inputs or methodologies
used to value securities are not necessarily an indication of the risk associated with investing in
those securities.
Level 1—Quoted prices in active markets for identical securities.
Level 2—Other significant observable inputs (including quoted prices for similar securities, interest
rates, prepayment speeds, credit risk, etc.).
Level 3—Significant unobservable inputs (including the fund’s own assumptions used to determine
the fair value of investments). Any investments valued with significant unobservable inputs are
noted on the Statement of Net Assets.
The following table summarizes the market value of the fund’s investments as of June 30, 2018,
based on the inputs used to value them:
Level 1 Level 2 Level 3
Investments ($000) ($000) ($000)
Common Stocks 67,098,160 — —
Temporary Cash Investments 155,717 6,953 —
Futures Contracts—Assets1 112 — —
Total 67,253,989 6,953 —
1 Represents variation margin on the last day of the reporting period.
42

Value Index Fund
D. Distributions are determined on a tax basis and may differ from net investment income and
realized capital gains for financial reporting purposes. Differences may be permanent or temporary.
Permanent differences are reclassified among capital accounts in the financial statements to reflect
their tax character. Temporary differences arise when certain items of income, expense, gain, or
loss are recognized in different periods for financial statement and tax purposes. These differences
will reverse at some time in the future. Differences in classification may also result from the
treatment of short-term gains as ordinary income for tax purposes.
During the six months ended June 30, 2018, the fund realized $1,182,433,000 of net capital gains
resulting from in-kind redemptions—in which shareholders exchanged fund shares for securities
held by the fund rather than for cash. Because such gains are not taxable to the fund, and are not
distributed to shareholders, they have been reclassified from accumulated net realized losses to
paid-in capital.
The fund’s tax-basis capital gains and losses are determined only at the end of each fiscal year. For
tax purposes, at December 31, 2017, the fund had available capital losses totaling $558,094,000
that may be carried forward indefinitely to offset future net capital gains. The fund will use these
capital losses to offset net taxable capital gains, if any, realized during the year ending December 31,
2018; should the fund realize net capital losses for the year, the losses will be added to the loss
carryforward balance above.
At June 30, 2018, the cost of investment securities for tax purposes was $53,537,187,000. Net
unrealized appreciation of investment securities for tax purposes was $13,723,643,000, consisting
of unrealized gains of $15,505,911,000 on securities that had risen in value since their purchase and
$1,782,268,000 in unrealized losses on securities that had fallen in value since their purchase.
E. During the six months ended June 30, 2018, the fund purchased $9,350,836,000 of investment
securities and sold $5,565,667,000 of investment securities, other than temporary cash investments.
Purchases and sales include $5,235,043,000 and $2,558,099,000, respectively, in connection with
in-kind purchases and redemptions of the fund’s capital shares.
The fund purchased securities from and sold securities to other Vanguard funds or accounts
managed by Vanguard or its affiliates, in accordance with procedures adopted by the board
of trustees in compliance with Rule 17a-7 of the Investment Company Act of 1940. For the
six months ended June 30, 2018, such purchases and sales were $1,296,915,000 and
$585,754,000, respectively; these amounts are included in the purchases and sales of
investment securities noted above.
43
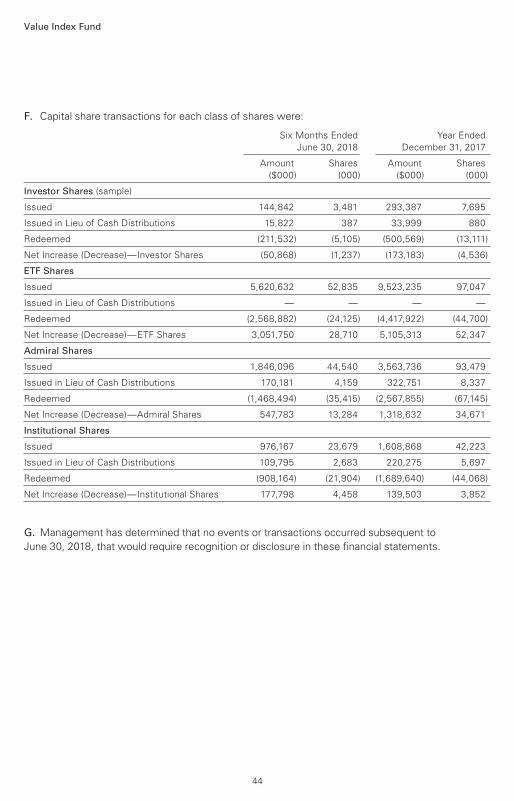
Value Index Fund
F. Capital share transactions for each class of shares were:
Six Months Ended Year Ended
June 30, 2018 December 31, 2017
Amount Shares Amount Shares
($000) (000) ($000) (000)
Investor Shares (sample)
Issued 144,842 3,481 293,387 7,695
Issued in Lieu of Cash Distributions 15,822 387 33,999 880
Redeemed (211,532) (5,105) (500,569) (13,111)
Net Increase (Decrease)—Investor Shares (50,868) (1,237) (173,183) (4,536)
ETF Shares
Issued 5,620,632 52,835 9,523,235 97,047
Issued in Lieu of Cash Distributions — — — —
Redeemed (2,568,882) (24,125) (4,417,922) (44,700)
Net Increase (Decrease)—ETF Shares 3,051,750 28,710 5,105,313 52,347
Admiral Shares
Issued 1,846,096 44,540 3,563,736 93,479
Issued in Lieu of Cash Distributions 170,181 4,159 322,751 8,337
Redeemed (1,468,494) (35,415) (2,567,855) (67,145)
Net Increase (Decrease)—Admiral Shares 547,783 13,284 1,318,632 34,671
Institutional Shares
Issued 976,167 23,679 1,608,868 42,223
Issued in Lieu of Cash Distributions 109,795 2,683 220,275 5,697
Redeemed (908,164) (21,904) (1,689,640) (44,068)
Net Increase (Decrease)—Institutional Shares 177,798 4,458 139,503 3,852
G. Management has determined that no events or transactions occurred subsequent to
June 30, 2018, that would require recognition or disclosure in these financial statements.
44

Large-Cap Index Fund
Fund ProfileAs of June 30, 2018
1 The expense ratios shown are from the prospectus dated April 25, 2018, and represent estimated costs for the current fiscal year. Forthe six months ended June 30, 2018, the annualized expense ratios were 0.17% for Investor Shares, 0.05% for ETF Shares, 0.05% forAdmiral Shares, and 0.04% for Institutional Shares.
45
Share-Class Characteristics
Investor
Shares ETF Shares
Admiral
Shares
Institutional
Shares
Ticker Symbol VLACX VV VLCAX VLISX
Expense Ratio1 0.17% 0.05% 0.05% 0.04%
30-Day SEC Yield 1.78% 1.90% 1.90% 1.91%
Volatility Measures
CRSP US
Large Cap
Index
DJ
U.S. Total
Market
FA Index
R-Squared 1.00 0.99
Beta 1.00 0.99
These measures show the degree and timing of the fund’s fluctuations compared with the indexes over 36 months.
Portfolio Characteristics
Fund
CRSP US
Large Cap
Index
DJ
U.S. Total
Market
FA Index
Number of Stocks 612 607 3,779
Median Market Cap $97.8B $97.8B $64.0B
Price/Earnings Ratio 20.9x 20.9x 20.7x
Price/Book Ratio 3.2x 3.2x 3.0x
Return on Equity 15.9% 15.9% 15.0%
Earnings Growth Rate 7.9% 7.9% 8.3%
Dividend Yield 1.8% 1.8% 1.8%
Foreign Holdings 0.0% 0.0% 0.0%
Turnover Rate
(Annualized) 4% — —
Short-Term Reserves 0.0% — —
Ten Largest Holdings (% of total net assets)
Apple Inc. Computer Hardware 3.4%
Microsoft Corp. Software 3.2
Amazon.com Inc. Broadline Retailers 2.9
Alphabet Inc. Internet 2.8
Facebook Inc. Internet 2.0
Berkshire Hathaway Inc. Reinsurance 1.5
JPMorgan Chase & Co. Banks 1.5
Exxon Mobil Corp. Integrated Oil & Gas 1.5
Johnson & Johnson Pharmaceuticals 1.4
Bank of America Corp. Banks 1.1
Top Ten 21.3%
The holdings listed exclude any temporary cash investments andequity index products.
Sector Diversification (% of equity exposure)
Fund
CRSP USLarge Cap
Index
DJU.S. Total
MarketFA Index
Basic Materials 2.2% 2.2% 2.5%
Consumer Goods 8.3 8.3 8.1
Consumer Services 13.4 13.4 13.3
Financials 18.9 18.9 19.9
Health Care 12.8 12.8 12.6
Industrials 12.0 12.0 12.7
Oil & Gas 6.2 6.2 6.1
Technology 21.3 21.3 20.1
Telecommunications 2.1 2.1 1.8
Utilities 2.8 2.8 2.9
Sector categories are based on the Industry ClassificationBenchmark (“ICB”), except for the “Other” category (if applicable),which includes securities that have not been provided an ICBclassification as of the effective reporting period.

Large-Cap Index Fund-3
46
Investment Focus
Market Cap
Value
Large
Medium
Small
Blend Growth Style

All of the returns in this report represent past performance, which is not a guarantee of future results that may be achieved by the fund. (Current performance may be lower or higher thanthe performance data cited. For performance data current to the most recent month-end, visitour website at vanguard.com/performance.) Note, too, that both investment returns and principal value can fluctuate widely, so an investor’s shares, when sold, could be worth more or less than their original cost. The returns shown do not reflect taxes that a shareholder would pay
on fund distributions or on the sale of fund shares.
Performance Summary
Large-Cap Index Fund
See Financial Highlights for dividend and capital gains information.
47
Fiscal-Year Total Returns (%): December 31, 2007, Through June 30, 2018
–37.08 –37.06
2008
27.60 27.80
2009
15.63 15.92
2010
1.44 1.65
2011
15.94 16.18
2012
32.45 32.74
2013
13.24 13.47
2014
0.93 1.11
2015
11.50 11.75
2016
21.89 22.07
2017
2.66 2.74
2018
Large-Cap Index Fund Investor Shares
Spliced Large Cap Index
For a benchmark description, see the Glossary.
Note: For 2018, performance data reflect the six months ended June 30, 2018.
Average Annual Total Returns: Periods Ended June 30, 2018
InceptionDate
OneYear
FiveYears
TenYears
Investor Shares 1/30/2004 14.29% 13.19% 10.01%
ETF Shares 1/27/2004
Market Price 14.46 13.36 10.17
Net Asset Value 14.43 13.34 10.16
Admiral Shares 2/2/2004 14.41 13.33 10.16
Institutional Shares 6/30/2005 14.43 13.34 10.18

Market
Value•
Shares ($000)
Market
Value•
Shares ($000)
Common Stocks (99.5%)1
Basic Materials (2.2%)
DowDuPont Inc. 1,951,698 128,656
Praxair Inc. 241,572 38,205
Ecolab Inc. 218,434 30,653
LyondellBasell Industries
NV Class A 263,833 28,982
Air Products & Chemicals
Inc. 184,209 28,687
PPG Industries Inc. 209,536 21,735
Freeport-McMoRan Inc. 1,157,790 19,983
International Paper Co. 348,072 18,128
Newmont Mining Corp. 448,493 16,913
Nucor Corp. 267,271 16,704
Celanese Corp. Class A 114,343 12,699
Eastman Chemical Co. 108,151 10,811
FMC Corp. 113,130 10,092
Albemarle Corp. 93,091 8,781
CF Industries Holdings
Inc. 196,239 8,713
International Flavors &
Fragrances Inc. 66,343 8,224
Mosaic Co. 291,247 8,169
Avery Dennison Corp. 73,977 7,553* Axalta Coating Systems
Ltd. 185,716 5,629
Reliance Steel &
Aluminum Co. 57,685 5,050
Steel Dynamics Inc. 93,929 4,316* Alcoa Corp. 78,176 3,665
Westlake Chemical Corp. 32,790 3,529
445,877
Consumer Goods (8.3%)
Procter & Gamble Co. 2,114,460 165,055
Coca-Cola Co. 3,220,336 141,244
PepsiCo Inc. 1,192,212 129,796
Philip Morris International
Inc. 1,307,164 105,540
Altria Group Inc. 1,591,521 90,382
NIKE Inc. Class B 1,078,717 85,952
Mondelez International
Inc. Class A 1,240,531 50,862
Colgate-Palmolive Co. 733,456 47,535
Activision Blizzard Inc. 608,105 46,411
General Motors Co. 1,066,778 42,031*,^ Tesla Inc. 107,072 36,720
Ford Motor Co. 3,292,570 36,449* Electronic Arts Inc. 258,125 36,401
Kraft Heinz Co. 512,713 32,209
Kimberly-Clark Corp. 293,890 30,958
Constellation Brands Inc.
Class A 134,254 29,384
Estee Lauder Cos. Inc.
Class A 188,375 26,879
General Mills Inc. 498,214 22,051
VF Corp. 266,874 21,756
Archer-Daniels-Midland
Co. 469,925 21,537
Aptiv plc 222,522 20,390* Monster Beverage Corp. 354,661 20,322
Dr Pepper Snapple Group
Inc. 151,530 18,487
Tyson Foods Inc. Class A 250,305 17,233
Stanley Black & Decker
Inc. 129,684 17,223
Kellogg Co. 233,281 16,299
Clorox Co. 108,862 14,724
Lennar Corp. Class A 242,469 12,730
DR Horton Inc. 301,703 12,370
McCormick & Co. Inc. 102,089 11,852
Conagra Brands Inc. 331,163 11,832
Brown-Forman Corp.
Class B 235,798 11,556* Mohawk Industries Inc. 53,333 11,428* Take-Two Interactive
Software Inc. 96,326 11,401
Tapestry Inc. 242,288 11,317
Financial Statements (unaudited)
Statement of Net AssetsAs of June 30, 2018
The fund reports a complete list of its holdings in regulatory filings four times in each fiscal year, at
the quarter-ends. For the second and fourth fiscal quarters, the lists appear in the fund’s semiannual
and annual reports to shareholders. For the first and third fiscal quarters, the fund files the lists with
the Securities and Exchange Commission on Form N-Q. Shareholders can look up the fund’s Forms
N-Q on the SEC’s website at sec.gov. Forms N-Q may also be reviewed and copied at the SEC’s
Public Reference Room (see the back cover of this report for further information).
Large-Cap Index Fund
48

Large-Cap Index Fund
Market
Value•
Shares ($000)
Market
Value•
Shares ($000)
Hershey Co. 118,897 11,065
Church & Dwight Co. Inc. 205,992 10,951
Genuine Parts Co. 117,429 10,779
Molson Coors Brewing
Co. Class B 156,353 10,638* Lululemon Athletica Inc. 84,761 10,582
Lear Corp. 55,854 10,378
JM Smucker Co. 90,580 9,736
PVH Corp. 64,756 9,695
Newell Brands Inc. 368,138 9,494
Hasbro Inc. 94,520 8,725* NVR Inc. 2,878 8,549
Lamb Weston Holdings
Inc. 122,974 8,425
Hormel Foods Corp. 222,976 8,297
Bunge Ltd. 118,330 8,249* Michael Kors Holdings
Ltd. 121,343 8,081
Whirlpool Corp. 54,275 7,937* LKQ Corp. 247,202 7,886
Snap-on Inc. 47,685 7,664
BorgWarner Inc. 176,446 7,615
Hanesbrands Inc. 303,153 6,675^ Campbell Soup Co. 164,401 6,665
PulteGroup Inc. 215,728 6,202
Polaris Industries Inc. 50,457 6,165
Harley-Davidson Inc. 139,640 5,876
Ralph Lauren Corp.
Class A 46,675 5,868
Jefferies Financial Group
Inc. 247,201 5,621
Coty Inc. Class A 379,204 5,347* WABCO Holdings Inc. 44,936 5,258*,^ Under Armour Inc.
Class A 155,888 3,504* Under Armour Inc. 160,141 3,376
Ingredion Inc. 30,261 3,350
Goodyear Tire & Rubber
Co. 100,675 2,345
Lennar Corp. Class B 12,505 534* Pilgrim’s Pride Corp. 20,891 421
Mattel Inc. 176 3
1,660,272
Consumer Services (13.4%) * Amazon.com Inc. 346,819 589,523
Home Depot Inc. 970,020 189,251* Netflix Inc. 347,248 135,923
Comcast Corp. Class A 3,861,626 126,700
Walt Disney Co. 1,190,767 124,804
Walmart Inc. 1,241,424 106,328
McDonald’s Corp. 660,254 103,455* Booking Holdings Inc. 40,501 82,099
Costco Wholesale Corp. 369,035 77,121
Lowe’s Cos. Inc. 659,670 63,045
CVS Health Corp. 854,879 55,011
Starbucks Corp. 1,102,384 53,851
TJX Cos. Inc. 500,881 47,674
Twenty-First Century Fox
Inc. Class A 912,010 45,318
Walgreens Boots Alliance
Inc. 708,856 42,542* Charter Communications
Inc. Class A 139,723 40,968
Target Corp. 448,331 34,127* eBay Inc. 794,308 28,802
Marriott International Inc.
Class A 222,895 28,219
Ross Stores Inc. 318,295 26,976
Sysco Corp. 394,346 26,930
Delta Air Lines Inc. 531,013 26,306
Las Vegas Sands Corp. 331,878 25,342
McKesson Corp. 173,620 23,161
Southwest Airlines Co. 439,060 22,339
Dollar General Corp. 225,715 22,256
Yum! Brands Inc. 271,569 21,242
Hilton Worldwide
Holdings Inc. 251,761 19,929
Carnival Corp. 336,835 19,304
Kroger Co. 675,752 19,225* O’Reilly Automotive Inc. 68,876 18,842
Twenty-First Century
Fox Inc. 377,007 18,575* Dollar Tree Inc. 199,850 16,987
CBS Corp. Class B 274,333 15,423* AutoZone Inc. 22,635 15,187
Best Buy Co. Inc. 201,444 15,024
Royal Caribbean Cruises
Ltd. 142,402 14,753
Omnicom Group Inc. 191,189 14,582* United Continental
Holdings Inc. 198,210 13,821
Wynn Resorts Ltd. 82,196 13,755
American Airlines Group
Inc. 354,298 13,449
Tiffany & Co. 99,189 13,053
Cardinal Health Inc. 261,329 12,761
Expedia Group Inc. 103,956 12,494
MGM Resorts
International 421,593 12,239
AmerisourceBergen
Corp. Class A 138,770 11,833* Ulta Beauty Inc. 48,292 11,274
Darden Restaurants Inc. 103,998 11,134* CarMax Inc. 149,828 10,918
Kohl’s Corp. 141,606 10,323
Macy’s Inc. 257,948 9,655
Nielsen Holdings plc 299,663 9,269
Viacom Inc. Class B 301,835 9,103
49
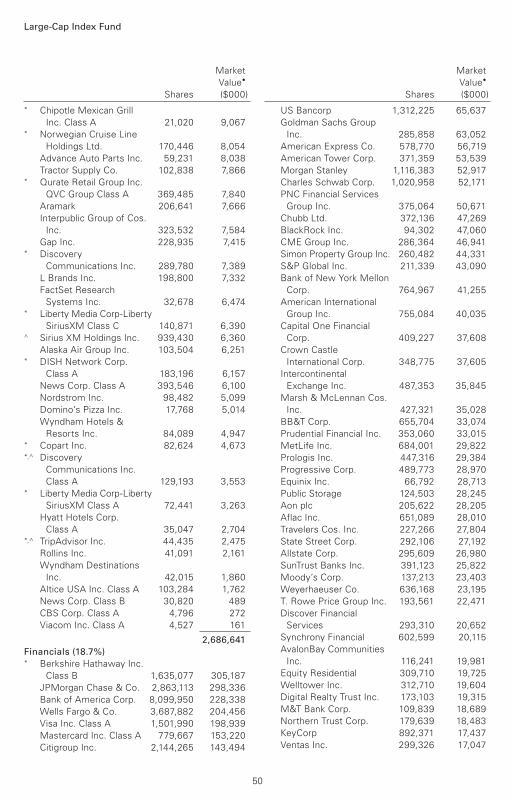
Large-Cap Index Fund
Market
Value•
Shares ($000)
Market
Value•
Shares ($000)
* Chipotle Mexican Grill
Inc. Class A 21,020 9,067* Norwegian Cruise Line
Holdings Ltd. 170,446 8,054
Advance Auto Parts Inc. 59,231 8,038
Tractor Supply Co. 102,838 7,866* Qurate Retail Group Inc.
QVC Group Class A 369,485 7,840
Aramark 206,641 7,666
Interpublic Group of Cos.
Inc. 323,532 7,584
Gap Inc. 228,935 7,415* Discovery
Communications Inc. 289,780 7,389
L Brands Inc. 198,800 7,332
FactSet Research
Systems Inc. 32,678 6,474* Liberty Media Corp-Liberty
SiriusXM Class C 140,871 6,390^ Sirius XM Holdings Inc. 939,430 6,360
Alaska Air Group Inc. 103,504 6,251* DISH Network Corp.
Class A 183,196 6,157
News Corp. Class A 393,546 6,100
Nordstrom Inc. 98,482 5,099
Domino’s Pizza Inc. 17,768 5,014
Wyndham Hotels &
Resorts Inc. 84,089 4,947* Copart Inc. 82,624 4,673*,^ Discovery
Communications Inc.
Class A 129,193 3,553* Liberty Media Corp-Liberty
SiriusXM Class A 72,441 3,263
Hyatt Hotels Corp.
Class A 35,047 2,704*,^ TripAdvisor Inc. 44,435 2,475
Rollins Inc. 41,091 2,161
Wyndham Destinations
Inc. 42,015 1,860
Altice USA Inc. Class A 103,284 1,762
News Corp. Class B 30,820 489
CBS Corp. Class A 4,796 272
Viacom Inc. Class A 4,527 161
2,686,641
Financials (18.7%) * Berkshire Hathaway Inc.
Class B 1,635,077 305,187
JPMorgan Chase & Co. 2,863,113 298,336
Bank of America Corp. 8,099,950 228,338
Wells Fargo & Co. 3,687,882 204,456
Visa Inc. Class A 1,501,990 198,939
Mastercard Inc. Class A 779,667 153,220
Citigroup Inc. 2,144,265 143,494
US Bancorp 1,312,225 65,637
Goldman Sachs Group
Inc. 285,858 63,052
American Express Co. 578,770 56,719
American Tower Corp. 371,359 53,539
Morgan Stanley 1,116,383 52,917
Charles Schwab Corp. 1,020,958 52,171
PNC Financial Services
Group Inc. 375,064 50,671
Chubb Ltd. 372,136 47,269
BlackRock Inc. 94,302 47,060
CME Group Inc. 286,364 46,941
Simon Property Group Inc. 260,482 44,331
S&P Global Inc. 211,339 43,090
Bank of New York Mellon
Corp. 764,967 41,255
American International
Group Inc. 755,084 40,035
Capital One Financial
Corp. 409,227 37,608
Crown Castle
International Corp. 348,775 37,605
Intercontinental
Exchange Inc. 487,353 35,845
Marsh & McLennan Cos.
Inc. 427,321 35,028
BB&T Corp. 655,704 33,074
Prudential Financial Inc. 353,060 33,015
MetLife Inc. 684,001 29,822
Prologis Inc. 447,316 29,384
Progressive Corp. 489,773 28,970
Equinix Inc. 66,792 28,713
Public Storage 124,503 28,245
Aon plc 205,622 28,205
Aflac Inc. 651,089 28,010
Travelers Cos. Inc. 227,266 27,804
State Street Corp. 292,106 27,192
Allstate Corp. 295,609 26,980
SunTrust Banks Inc. 391,123 25,822
Moody’s Corp. 137,213 23,403
Weyerhaeuser Co. 636,168 23,195
T. Rowe Price Group Inc. 193,561 22,471
Discover Financial
Services 293,310 20,652
Synchrony Financial 602,599 20,115
AvalonBay Communities
Inc. 116,241 19,981
Equity Residential 309,710 19,725
Welltower Inc. 312,710 19,604
Digital Realty Trust Inc. 173,103 19,315
M&T Bank Corp. 109,839 18,689
Northern Trust Corp. 179,639 18,483
KeyCorp 892,371 17,437
Ventas Inc. 299,326 17,047
50
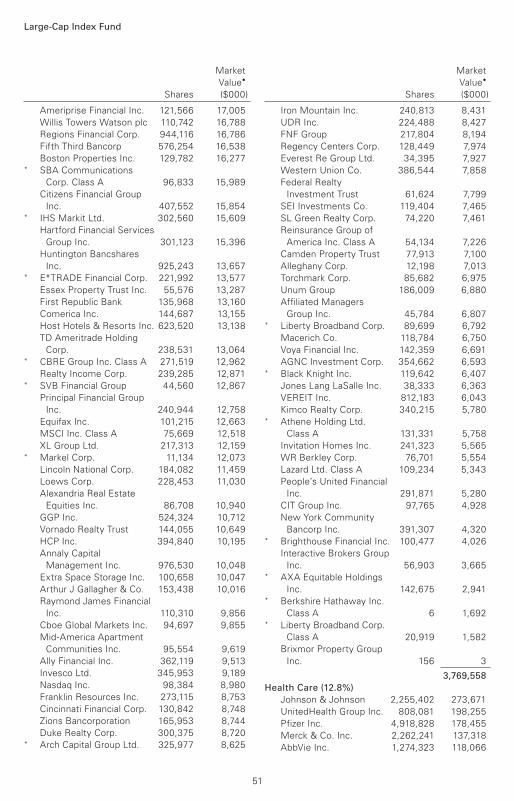
Large-Cap Index Fund
Market
Value•
Shares ($000)
Market
Value•
Shares ($000)
Ameriprise Financial Inc. 121,566 17,005
Willis Towers Watson plc 110,742 16,788
Regions Financial Corp. 944,116 16,786
Fifth Third Bancorp 576,254 16,538
Boston Properties Inc. 129,782 16,277* SBA Communications
Corp. Class A 96,833 15,989
Citizens Financial Group
Inc. 407,552 15,854* IHS Markit Ltd. 302,560 15,609
Hartford Financial Services
Group Inc. 301,123 15,396
Huntington Bancshares
Inc. 925,243 13,657* E*TRADE Financial Corp. 221,992 13,577
Essex Property Trust Inc. 55,576 13,287
First Republic Bank 135,968 13,160
Comerica Inc. 144,687 13,155
Host Hotels & Resorts Inc. 623,520 13,138
TD Ameritrade Holding
Corp. 238,531 13,064* CBRE Group Inc. Class A 271,519 12,962
Realty Income Corp. 239,285 12,871* SVB Financial Group 44,560 12,867
Principal Financial Group
Inc. 240,944 12,758
Equifax Inc. 101,215 12,663
MSCI Inc. Class A 75,669 12,518
XL Group Ltd. 217,313 12,159* Markel Corp. 11,134 12,073
Lincoln National Corp. 184,082 11,459
Loews Corp. 228,453 11,030
Alexandria Real Estate
Equities Inc. 86,708 10,940
GGP Inc. 524,324 10,712
Vornado Realty Trust 144,055 10,649
HCP Inc. 394,840 10,195
Annaly Capital
Management Inc. 976,530 10,048
Extra Space Storage Inc. 100,658 10,047
Arthur J Gallagher & Co. 153,438 10,016
Raymond James Financial
Inc. 110,310 9,856
Cboe Global Markets Inc. 94,697 9,855
Mid-America Apartment
Communities Inc. 95,554 9,619
Ally Financial Inc. 362,119 9,513
Invesco Ltd. 345,953 9,189
Nasdaq Inc. 98,384 8,980
Franklin Resources Inc. 273,115 8,753
Cincinnati Financial Corp. 130,842 8,748
Zions Bancorporation 165,953 8,744
Duke Realty Corp. 300,375 8,720* Arch Capital Group Ltd. 325,977 8,625
Iron Mountain Inc. 240,813 8,431
UDR Inc. 224,488 8,427
FNF Group 217,804 8,194
Regency Centers Corp. 128,449 7,974
Everest Re Group Ltd. 34,395 7,927
Western Union Co. 386,544 7,858
Federal Realty
Investment Trust 61,624 7,799
SEI Investments Co. 119,404 7,465
SL Green Realty Corp. 74,220 7,461
Reinsurance Group of
America Inc. Class A 54,134 7,226
Camden Property Trust 77,913 7,100
Alleghany Corp. 12,198 7,013
Torchmark Corp. 85,682 6,975
Unum Group 186,009 6,880
Affiliated Managers
Group Inc. 45,784 6,807* Liberty Broadband Corp. 89,699 6,792
Macerich Co. 118,784 6,750
Voya Financial Inc. 142,359 6,691
AGNC Investment Corp. 354,662 6,593* Black Knight Inc. 119,642 6,407
Jones Lang LaSalle Inc. 38,333 6,363
VEREIT Inc. 812,183 6,043
Kimco Realty Corp. 340,215 5,780* Athene Holding Ltd.
Class A 131,331 5,758
Invitation Homes Inc. 241,323 5,565
WR Berkley Corp. 76,701 5,554
Lazard Ltd. Class A 109,234 5,343
People’s United Financial
Inc. 291,871 5,280
CIT Group Inc. 97,765 4,928
New York Community
Bancorp Inc. 391,307 4,320* Brighthouse Financial Inc. 100,477 4,026
Interactive Brokers Group
Inc. 56,903 3,665* AXA Equitable Holdings
Inc. 142,675 2,941* Berkshire Hathaway Inc.
Class A 6 1,692* Liberty Broadband Corp.
Class A 20,919 1,582
Brixmor Property Group
Inc. 156 3
3,769,558
Health Care (12.8%)
Johnson & Johnson 2,255,402 273,671
UnitedHealth Group Inc. 808,081 198,255
Pfizer Inc. 4,918,828 178,455
Merck & Co. Inc. 2,262,241 137,318
AbbVie Inc. 1,274,323 118,066
51

Large-Cap Index Fund
Market
Value•
Shares ($000)
Market
Value•
Shares ($000)
Amgen Inc. 556,414 102,708
Medtronic plc 1,139,702 97,570
Abbott Laboratories 1,474,164 89,909
Gilead Sciences Inc. 1,093,373 77,455
Bristol-Myers Squibb Co. 1,374,420 76,060
Eli Lilly & Co. 825,411 70,432
Thermo Fisher Scientific
Inc. 338,304 70,076
Becton Dickinson and Co. 224,669 53,822* Biogen Inc. 177,457 51,505
Anthem Inc. 214,574 51,075
Aetna Inc. 275,046 50,471* Celgene Corp. 609,488 48,406
Allergan plc 285,098 47,532* Intuitive Surgical Inc. 95,286 45,592
Stryker Corp. 251,420 42,455* Boston Scientific Corp. 1,160,441 37,946* Express Scripts Holding
Co. 472,012 36,444* Vertex Pharmaceuticals
Inc. 214,324 36,427
Cigna Corp. 204,554 34,764
Zoetis Inc. 406,819 34,657* Illumina Inc. 123,657 34,536
Humana Inc. 115,726 34,444
Baxter International Inc. 429,791 31,736* Edwards Lifesciences
Corp. 177,146 25,787
HCA Healthcare Inc. 234,838 24,094* Regeneron
Pharmaceuticals Inc. 66,832 23,056* Alexion Pharmaceuticals
Inc. 177,657 22,056* Align Technology Inc. 64,048 21,913* Centene Corp. 163,863 20,190
Zimmer Biomet Holdings
Inc. 170,903 19,045* IDEXX Laboratories Inc. 72,979 15,905* Laboratory Corp. of
America Holdings 85,941 15,429* Mylan NV 411,731 14,880* ABIOMED Inc. 35,473 14,510* IQVIA Holdings Inc. 145,162 14,490* BioMarin Pharmaceutical
Inc. 148,593 13,997
Quest Diagnostics Inc. 114,109 12,545
ResMed Inc. 120,012 12,431* Waters Corp. 62,654 12,129
Teleflex Inc. 38,321 10,278* Incyte Corp. 151,755 10,168
Cooper Cos. Inc. 41,164 9,692* Henry Schein Inc. 129,652 9,418* Hologic Inc. 229,974 9,141
* Varian Medical Systems
Inc. 77,077 8,765
Dentsply Sirona Inc. 191,638 8,388* Jazz Pharmaceuticals plc 47,874 8,249
Universal Health Services
Inc. Class B 73,351 8,174* DaVita Inc. 110,275 7,658
Perrigo Co. plc 104,986 7,655* Alnylam Pharmaceuticals
Inc. 75,922 7,478* Nektar Therapeutics
Class A 144,418 7,052* Alkermes plc 130,685 5,379* Seattle Genetics Inc. 43,007 2,855
2,564,594
Industrials (11.9%)
Boeing Co. 489,883 164,361
General Electric Co. 7,303,546 99,401
3M Co. 499,282 98,219
Union Pacific Corp. 647,667 91,761
Honeywell International
Inc. 628,248 90,499
Accenture plc Class A 540,774 88,465
United Technologies
Corp. 639,204 79,920* PayPal Holdings Inc. 948,542 78,985
Caterpillar Inc. 502,844 68,221
United Parcel Service Inc.
Class B 579,776 61,590
Lockheed Martin Corp. 204,116 60,302
Danaher Corp. 528,632 52,165
Automatic Data
Processing Inc. 351,908 47,205
Raytheon Co. 241,598 46,672
FedEx Corp. 202,277 45,929
Northrop Grumman Corp. 146,662 45,128
CSX Corp. 699,274 44,600
General Dynamics Corp. 212,354 39,585
Deere & Co. 272,287 38,066
Emerson Electric Co. 529,645 36,620
Norfolk Southern Corp. 237,699 35,862
Illinois Tool Works Inc. 256,504 35,536
Waste Management Inc. 363,709 29,584
Fidelity National
Information Services Inc. 278,453 29,524
Sherwin-Williams Co. 70,804 28,858
Eaton Corp. plc 367,865 27,494
TE Connectivity Ltd. 294,507 26,523
Johnson Controls
International plc 779,412 26,071* Fiserv Inc. 344,458 25,521
Roper Technologies Inc. 86,738 23,932
Amphenol Corp. Class A 253,414 22,085* Worldpay Inc. Class A 249,911 20,438
52
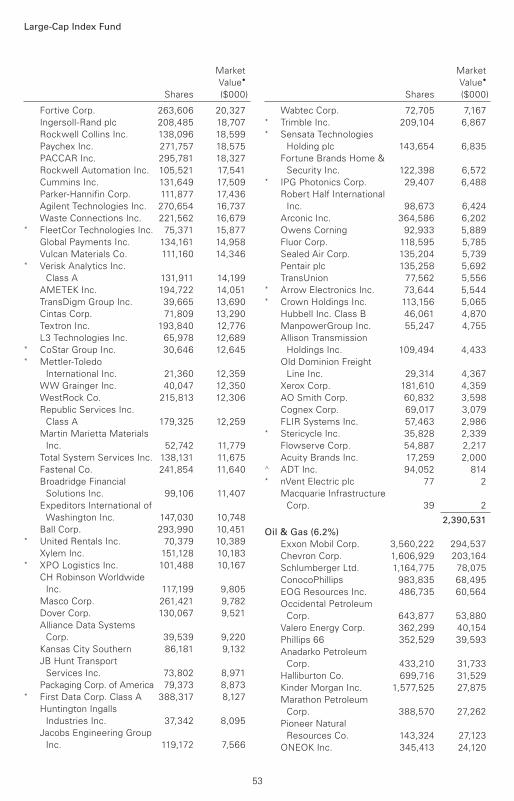
Large-Cap Index Fund
Market
Value•
Shares ($000)
Market
Value•
Shares ($000)
Fortive Corp. 263,606 20,327
Ingersoll-Rand plc 208,485 18,707
Rockwell Collins Inc. 138,096 18,599
Paychex Inc. 271,757 18,575
PACCAR Inc. 295,781 18,327
Rockwell Automation Inc. 105,521 17,541
Cummins Inc. 131,649 17,509
Parker-Hannifin Corp. 111,877 17,436
Agilent Technologies Inc. 270,654 16,737
Waste Connections Inc. 221,562 16,679* FleetCor Technologies Inc. 75,371 15,877
Global Payments Inc. 134,161 14,958
Vulcan Materials Co. 111,160 14,346* Verisk Analytics Inc.
Class A 131,911 14,199
AMETEK Inc. 194,722 14,051
TransDigm Group Inc. 39,665 13,690
Cintas Corp. 71,809 13,290
Textron Inc. 193,840 12,776
L3 Technologies Inc. 65,978 12,689* CoStar Group Inc. 30,646 12,645* Mettler-Toledo
International Inc. 21,360 12,359
WW Grainger Inc. 40,047 12,350
WestRock Co. 215,813 12,306
Republic Services Inc.
Class A 179,325 12,259
Martin Marietta Materials
Inc. 52,742 11,779
Total System Services Inc. 138,131 11,675
Fastenal Co. 241,854 11,640
Broadridge Financial
Solutions Inc. 99,106 11,407
Expeditors International of
Washington Inc. 147,030 10,748
Ball Corp. 293,990 10,451* United Rentals Inc. 70,379 10,389
Xylem Inc. 151,128 10,183* XPO Logistics Inc. 101,488 10,167
CH Robinson Worldwide
Inc. 117,199 9,805
Masco Corp. 261,421 9,782
Dover Corp. 130,067 9,521
Alliance Data Systems
Corp. 39,539 9,220
Kansas City Southern 86,181 9,132
JB Hunt Transport
Services Inc. 73,802 8,971
Packaging Corp. of America 79,373 8,873* First Data Corp. Class A 388,317 8,127
Huntington Ingalls
Industries Inc. 37,342 8,095
Jacobs Engineering Group
Inc. 119,172 7,566
Wabtec Corp. 72,705 7,167* Trimble Inc. 209,104 6,867* Sensata Technologies
Holding plc 143,654 6,835
Fortune Brands Home &
Security Inc. 122,398 6,572* IPG Photonics Corp. 29,407 6,488
Robert Half International
Inc. 98,673 6,424
Arconic Inc. 364,586 6,202
Owens Corning 92,933 5,889
Fluor Corp. 118,595 5,785
Sealed Air Corp. 135,204 5,739
Pentair plc 135,258 5,692
TransUnion 77,562 5,556* Arrow Electronics Inc. 73,644 5,544* Crown Holdings Inc. 113,156 5,065
Hubbell Inc. Class B 46,061 4,870
ManpowerGroup Inc. 55,247 4,755
Allison Transmission
Holdings Inc. 109,494 4,433
Old Dominion Freight
Line Inc. 29,314 4,367
Xerox Corp. 181,610 4,359
AO Smith Corp. 60,832 3,598
Cognex Corp. 69,017 3,079
FLIR Systems Inc. 57,463 2,986* Stericycle Inc. 35,828 2,339
Flowserve Corp. 54,887 2,217
Acuity Brands Inc. 17,259 2,000^ ADT Inc. 94,052 814* nVent Electric plc 77 2
Macquarie Infrastructure
Corp. 39 2
2,390,531
Oil & Gas (6.2%)
Exxon Mobil Corp. 3,560,222 294,537
Chevron Corp. 1,606,929 203,164
Schlumberger Ltd. 1,164,775 78,075
ConocoPhillips 983,835 68,495
EOG Resources Inc. 486,735 60,564
Occidental Petroleum
Corp. 643,877 53,880
Valero Energy Corp. 362,299 40,154
Phillips 66 352,529 39,593
Anadarko Petroleum
Corp. 433,210 31,733
Halliburton Co. 699,716 31,529
Kinder Morgan Inc. 1,577,525 27,875
Marathon Petroleum
Corp. 388,570 27,262
Pioneer Natural
Resources Co. 143,324 27,123
ONEOK Inc. 345,413 24,120
53

Large-Cap Index Fund
Market
Value•
Shares ($000)
Market
Value•
Shares ($000)
Williams Cos. Inc. 695,357 18,851
Devon Energy Corp. 418,044 18,377* Concho Resources Inc. 125,315 17,337
Hess Corp. 239,756 16,037
Andeavor 120,732 15,838
Apache Corp. 321,398 15,025
Marathon Oil Corp. 717,600 14,969
Noble Energy Inc. 407,526 14,377
National Oilwell Varco Inc. 321,364 13,947
EQT Corp. 223,412 12,328
Baker Hughes a GE Co. 350,475 11,576* Cheniere Energy Inc. 177,502 11,571
Diamondback Energy Inc. 82,969 10,916
HollyFrontier Corp. 148,502 10,162
Cabot Oil & Gas Corp. 380,292 9,051
Cimarex Energy Co. 80,332 8,173
OGE Energy Corp. 168,246 5,924* Continental Resources Inc. 78,955 5,113
Targa Resources Corp. 87,532 4,332* Antero Resources Corp. 200,399 4,279
Helmerich & Payne Inc. 43,319 2,762* Apergy Corp. 39 2
1,249,051
Technology (21.2%)
Apple Inc. 3,719,825 688,577
Microsoft Corp. 6,460,852 637,105* Facebook Inc. Class A 2,016,983 391,940* Alphabet Inc. Class A 251,038 283,470* Alphabet Inc. Class C 249,518 278,375
Intel Corp. 3,918,585 194,793
Cisco Systems Inc. 3,954,532 170,163
NVIDIA Corp. 459,387 108,829
International Business
Machines Corp. 771,920 107,837
Oracle Corp. 2,403,045 105,878* Adobe Systems Inc. 414,126 100,968
Texas Instruments Inc. 823,179 90,755
Broadcom Inc. 345,403 83,809* salesforce.com Inc. 593,440 80,945
QUALCOMM Inc. 1,246,749 69,968* Micron Technology Inc. 975,225 51,141
Intuit Inc. 205,020 41,887
Applied Materials Inc. 883,728 40,819
Cognizant Technology
Solutions Corp. Class A 492,886 38,933
HP Inc. 1,377,348 31,252
Analog Devices Inc. 310,969 29,828* ServiceNow Inc. 148,626 25,633* Twitter Inc. 569,950 24,890* Autodesk Inc. 184,122 24,137
Lam Research Corp. 137,899 23,836* Red Hat Inc. 149,506 20,089
DXC Technology Co. 240,066 19,352
Corning Inc. 697,864 19,198
Hewlett Packard
Enterprise Co. 1,283,384 18,750
Western Digital Corp. 238,909 18,494
Microchip Technology Inc. 197,576 17,969
NetApp Inc. 225,149 17,681
Motorola Solutions Inc. 136,272 15,858* Cerner Corp. 265,211 15,857* Palo Alto Networks Inc. 73,372 15,076* Workday Inc. Class A 122,908 14,887
Skyworks Solutions Inc. 153,095 14,797
Harris Corp. 99,937 14,445* Square Inc. 231,575 14,274* Dell Technologies Inc.
Class V 167,623 14,178
Xilinx Inc. 213,092 13,906
Maxim Integrated
Products Inc. 235,285 13,802
KLA-Tencor Corp. 131,097 13,441* VeriSign Inc. 93,212 12,809* ANSYS Inc. 70,600 12,297
Seagate Technology plc 217,364 12,274* Splunk Inc. 121,946 12,086*,^ Advanced Micro
Devices Inc. 774,953 11,617* Citrix Systems Inc. 108,252 11,349* Arista Networks Inc. 43,849 11,291
Symantec Corp. 521,854 10,776* Synopsys Inc. 125,111 10,706* Cadence Design
Systems Inc. 236,825 10,257* IAC/InterActiveCorp 65,500 9,988* Akamai Technologies Inc. 136,385 9,987* Gartner Inc. 72,935 9,693
CA Inc. 262,649 9,363* VMware Inc. Class A 61,885 9,095* F5 Networks Inc. 51,468 8,876* Qorvo Inc. 106,370 8,528
Juniper Networks Inc. 294,245 8,068
Marvell Technology
Group Ltd. 356,416 7,642
CDK Global Inc. 110,378 7,180
Garmin Ltd. 94,903 5,789*,^ Snap Inc. 435,768 5,704
CDW Corp. 64,006 5,171
LogMeIn Inc. 43,909 4,534
SS&C Technologies
Holdings Inc. 84,763 4,399* GoDaddy Inc. Class A 59,190 4,179* Dropbox Inc. Class A 46,380 1,504* Match Group Inc. 21,022 814
4,253,798
Telecommunications (2.0%)
AT&T Inc. 6,109,467 196,175
Verizon Communications
Inc. 3,474,686 174,811
54
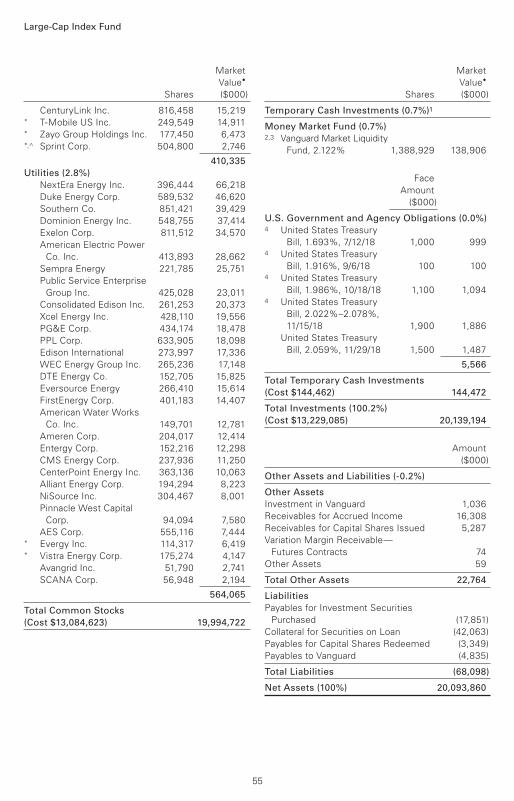
Large-Cap Index Fund
Market
Value•
Shares ($000)
Market
Value•
Shares ($000)
CenturyLink Inc. 816,458 15,219* T-Mobile US Inc. 249,549 14,911* Zayo Group Holdings Inc. 177,450 6,473*,^ Sprint Corp. 504,800 2,746
410,335
Utilities (2.8%)
NextEra Energy Inc. 396,444 66,218
Duke Energy Corp. 589,532 46,620
Southern Co. 851,421 39,429
Dominion Energy Inc. 548,755 37,414
Exelon Corp. 811,512 34,570
American Electric Power
Co. Inc. 413,893 28,662
Sempra Energy 221,785 25,751
Public Service Enterprise
Group Inc. 425,028 23,011
Consolidated Edison Inc. 261,253 20,373
Xcel Energy Inc. 428,110 19,556
PG&E Corp. 434,174 18,478
PPL Corp. 633,905 18,098
Edison International 273,997 17,336
WEC Energy Group Inc. 265,236 17,148
DTE Energy Co. 152,705 15,825
Eversource Energy 266,410 15,614
FirstEnergy Corp. 401,183 14,407
American Water Works
Co. Inc. 149,701 12,781
Ameren Corp. 204,017 12,414
Entergy Corp. 152,216 12,298
CMS Energy Corp. 237,936 11,250
CenterPoint Energy Inc. 363,136 10,063
Alliant Energy Corp. 194,294 8,223
NiSource Inc. 304,467 8,001
Pinnacle West Capital
Corp. 94,094 7,580
AES Corp. 555,116 7,444* Evergy Inc. 114,317 6,419* Vistra Energy Corp. 175,274 4,147
Avangrid Inc. 51,790 2,741
SCANA Corp. 56,948 2,194
564,065
Total Common Stocks
(Cost $13,084,623) 19,994,722
Temporary Cash Investments (0.7%)1
Money Market Fund (0.7%)2,3 Vanguard Market Liquidity
Fund, 2.122% 1,388,929 138,906
Face
Amount
($000)
U.S. Government and Agency Obligations (0.0%) 4 United States Treasury
Bill, 1.693%, 7/12/18 1,000 9994 United States Treasury
Bill, 1.916%, 9/6/18 100 1004 United States Treasury
Bill, 1.986%, 10/18/18 1,100 1,0944 United States Treasury
Bill, 2.022%–2.078%,
11/15/18 1,900 1,886
United States Treasury
Bill, 2.059%, 11/29/18 1,500 1,487
5,566
Total Temporary Cash Investments
(Cost $144,462) 144,472
Total Investments (100.2%)
(Cost $13,229,085) 20,139,194
Amount
($000)
Other Assets and Liabilities (-0.2%)
Other Assets
Investment in Vanguard 1,036
Receivables for Accrued Income 16,308
Receivables for Capital Shares Issued 5,287
Variation Margin Receivable—
Futures Contracts 74
Other Assets 59
Total Other Assets 22,764
Liabilities
Payables for Investment Securities
Purchased (17,851)
Collateral for Securities on Loan (42,063)
Payables for Capital Shares Redeemed (3,349)
Payables to Vanguard (4,835)
Total Liabilities (68,098)
Net Assets (100%) 20,093,860
55
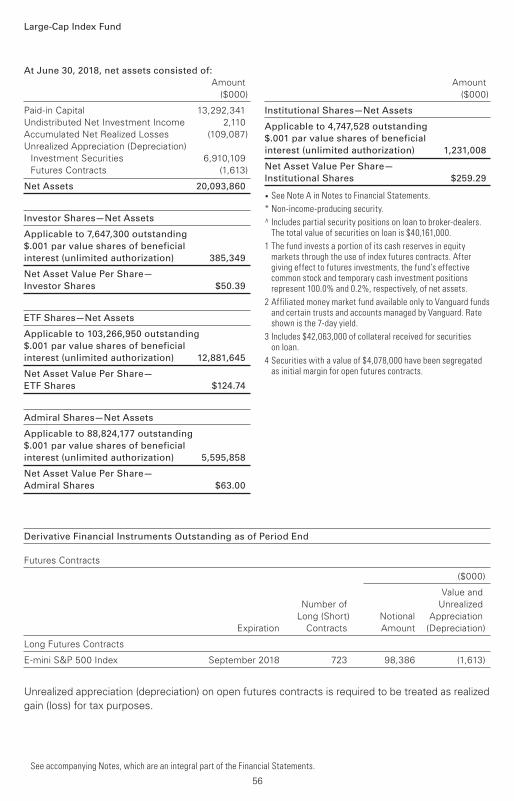
Large-Cap Index Fund
At June 30, 2018, net assets consisted of:
Amount
($000)
Amount
($000)
Paid-in Capital 13,292,341
Undistributed Net Investment Income 2,110
Accumulated Net Realized Losses (109,087)
Unrealized Appreciation (Depreciation)
Investment Securities 6,910,109
Futures Contracts (1,613)
Net Assets 20,093,860
Investor Shares—Net Assets
Applicable to 7,647,300 outstanding
$.001 par value shares of beneficial
interest (unlimited authorization) 385,349
Net Asset Value Per Share—
Investor Shares $50.39
ETF Shares—Net Assets
Applicable to 103,266,950 outstanding
$.001 par value shares of beneficial
interest (unlimited authorization) 12,881,645
Net Asset Value Per Share—
ETF Shares $124.74
Admiral Shares—Net Assets
Applicable to 88,824,177 outstanding
$.001 par value shares of beneficial
interest (unlimited authorization) 5,595,858
Net Asset Value Per Share—
Admiral Shares $63.00
Institutional Shares—Net Assets
Applicable to 4,747,528 outstanding
$.001 par value shares of beneficial
interest (unlimited authorization) 1,231,008
Net Asset Value Per Share—
Institutional Shares $259.29
• See Note A in Notes to Financial Statements.
* Non-income-producing security.
^ Includes partial security positions on loan to broker-dealers. The total value of securities on loan is $40,161,000.
1 The fund invests a portion of its cash reserves in equity markets through the use of index futures contracts. After giving effect to futures investments, the fund’s effective common stock and temporary cash investment positions represent 100.0% and 0.2%, respectively, of net assets.
2 Affiliated money market fund available only to Vanguard funds and certain trusts and accounts managed by Vanguard. Rate shown is the 7-day yield.
3 Includes $42,063,000 of collateral received for securities on loan.
4 Securities with a value of $4,078,000 have been segregated as initial margin for open futures contracts.
See accompanying Notes, which are an integral part of the Financial Statements.
Derivative Financial Instruments Outstanding as of Period End
Futures Contracts
($000)
Value and
Number of Unrealized
Long (Short) Notional Appreciation
Expiration Contracts Amount (Depreciation)
Long Futures Contracts
E-mini S&P 500 Index September 2018 723 98,386 (1,613)
Unrealized appreciation (depreciation) on open futures contracts is required to be treated as realized
gain (loss) for tax purposes.
56

Six Months Ended
June 30, 2018
($000)
Investment Income
Income
Dividends 178,257
Interest1 389
Securities Lending—Net 371
Total Income 179,017
Expenses
The Vanguard Group—Note B
Investment Advisory Services 1,388
Management and Administrative—Investor Shares 260
Management and Administrative—ETF Shares 1,641
Management and Administrative—Admiral Shares 739
Management and Administrative—Institutional Shares 132
Marketing and Distribution—Investor Shares 42
Marketing and Distribution—ETF Shares 259
Marketing and Distribution—Admiral Shares 183
Marketing and Distribution—Institutional Shares 11
Custodian Fees 129
Shareholders’ Report—Investor Shares 4
Shareholders’ Reports—ETF Shares 145
Shareholders’ Reports—Admiral Shares 16
Shareholders’ Reports—Institutional Shares 1
Trustees’ Fees and Expenses 6
Total Expenses 4,956
Net Investment Income 174,061
Realized Net Gain (Loss)
Investment Securities Sold1 338,605
Futures Contracts 3,347
Realized Net Gain (Loss) 341,952
Change in Unrealized Appreciation (Depreciation)
Investment Securities1 (934)
Futures Contracts (1,741)
Change in Unrealized Appreciation (Depreciation) (2,675)
Net Increase (Decrease) in Net Assets Resulting from Operations 513,338
1 Interest income, realized net gain (loss), and change in unrealized appreciation (depreciation) from an affiliated company of the fund were $361,000, ($4,000), and $9,000 respectively. Purchases and sales are for temporary cash investment purposes.
Statement of Operations
Large-Cap Index Fund
See accompanying Notes, which are an integral part of the Financial Statements.
57

Statement of Changes in Net Assets
Large-Cap Index Fund
See accompanying Notes, which are an integral part of the Financial Statements.
Six Months Ended Year Ended
June 30, December 31,
2018 2017
($000) ($000)
Increase (Decrease) in Net Assets
Operations
Net Investment Income 174,061 308,673
Realized Net Gain (Loss) 341,952 217,973
Change in Unrealized Appreciation (Depreciation) (2,675) 2,670,826
Net Increase (Decrease) in Net Assets Resulting from Operations 513,338 3,197,472
Distributions
Net Investment Income
Investor Shares (3,185) (7,172)
ETF Shares (107,240) (190,180)
Admiral Shares (48,289) (91,116)
Institutional Shares (10,226) (20,083)
Realized Capital Gain
Investor Shares — —
ETF Shares — —
Admiral Shares — —
Institutional Shares — —
Return of Capital
Total Distributions (168,940) (308,551)
Capital Share Transactions
Investor Shares (8,427) (86,883)
ETF Shares 1,053,297 1,372,048
Admiral Shares 122,124 392,051
Institutional Shares (4,224) 89,869
Net Increase (Decrease) from Capital Share Transactions 1,162,770 1,767,085
Total Increase (Decrease) 1,507,168 4,656,006
Net Assets
Beginning of Period 18,586,692 13,930,686
End of Period1 20,093,860 18,586,692
1 Net Assets—End of Period includes undistributed (overdistributed) net investment income of $2,110,000 and ($3,011,000).
58

Investor Shares
Six Months
Ended
For a Share Outstanding June 30, Year Ended December 31,
Throughout Each Period 2018 2017 2016 2015 2014 2013
Net Asset Value, Beginning of Period $49.48 $41.31 $37.78 $38.12 $34.24 $26.32
Investment Operations
Net Investment Income .4271 .8191 .768 .702 .624 .556
Net Realized and Unrealized Gain (Loss)
on Investments .890 8.161 3.533 (.348) 3.879 7.921
Total from Investment Operations 1.317 8.980 4.301 .354 4.503 8.477
Distributions
Dividends from Net Investment Income (.407) (.810) (.771) (.694) (.623) (.557)
Distributions from Realized Capital Gains — — — — — —
Total Distributions (.407) (.810) (.771) (.694) (.623) (.557)
Net Asset Value, End of Period $50.39 $49.48 $41.31 $37.78 $38.12 $34.24
Total Return2 2.66% 21.89% 11.50% 0.93% 13.24% 32.45%
Ratios/Supplemental Data
Net Assets, End of Period (Millions) $385 $387 $400 $375 $399 $391
Ratio of Total Expenses to
Average Net Assets 0.17% 0.17% 0.18% 0.20% 0.23% 0.24%
Ratio of Net Investment Income to
Average Net Assets 1.71% 1.81% 2.02% 1.86% 1.76% 1.82%
Portfolio Turnover Rate3 4% 3% 5% 4% 3% 9%
The expense ratio, net investment income ratio, and turnover rate for the current period have been annualized.
1 Calculated based on average shares outstanding.
2 Total returns do not include account service fees that may have applied in the periods shown. Fund prospectuses provide information about any applicable account service fees.
3 Excludes the value of portfolio securities received or delivered as a result of in-kind purchases or redemptions of the fund’s capital shares, including ETF Creation Units.
Financial Highlights
See accompanying Notes, which are an integral part of the Financial Statements.
Large-Cap Index Fund
59
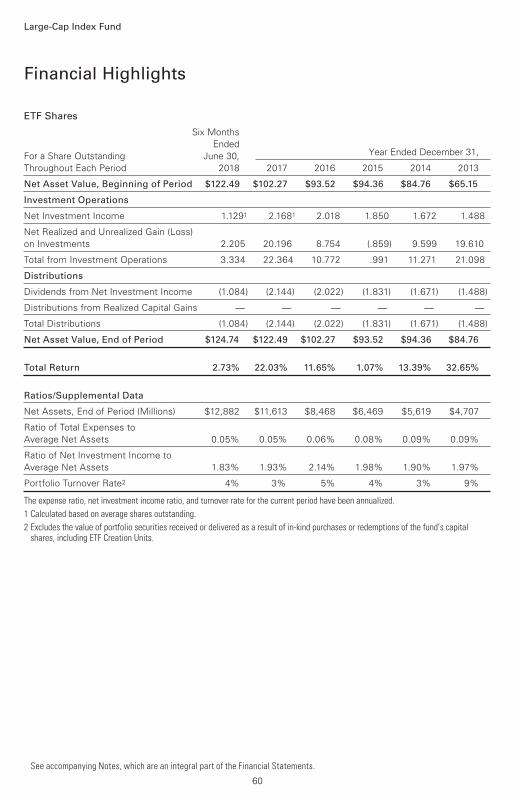
ETF Shares
Six Months
Ended
For a Share Outstanding June 30, Year Ended December 31,
Throughout Each Period 2018 2017 2016 2015 2014 2013
Net Asset Value, Beginning of Period $122.49 $102.27 $93.52 $94.36 $84.76 $65.15
Investment Operations
Net Investment Income 1.1291 2.1681 2.018 1.850 1.672 1.488
Net Realized and Unrealized Gain (Loss)
on Investments 2.205 20.196 8.754 (.859) 9.599 19.610
Total from Investment Operations 3.334 22.364 10.772 .991 11.271 21.098
Distributions
Dividends from Net Investment Income (1.084) (2.144) (2.022) (1.831) (1.671) (1.488)
Distributions from Realized Capital Gains — — — — — —
Total Distributions (1.084) (2.144) (2.022) (1.831) (1.671) (1.488)
Net Asset Value, End of Period $124.74 $122.49 $102.27 $93.52 $94.36 $84.76
Total Return 2.73% 22.03% 11.65% 1.07% 13.39% 32.65%
Ratios/Supplemental Data
Net Assets, End of Period (Millions) $12,882 $11,613 $8,468 $6,469 $5,619 $4,707
Ratio of Total Expenses to
Average Net Assets 0.05% 0.05% 0.06% 0.08% 0.09% 0.09%
Ratio of Net Investment Income to
Average Net Assets 1.83% 1.93% 2.14% 1.98% 1.90% 1.97%
Portfolio Turnover Rate2 4% 3% 5% 4% 3% 9%
The expense ratio, net investment income ratio, and turnover rate for the current period have been annualized.
1 Calculated based on average shares outstanding.
2 Excludes the value of portfolio securities received or delivered as a result of in-kind purchases or redemptions of the fund’s capital shares, including ETF Creation Units.
Financial Highlights
See accompanying Notes, which are an integral part of the Financial Statements.
Large-Cap Index Fund
60

Admiral Shares
Six Months
Ended
For a Share Outstanding June 30, Year Ended December 31,
Throughout Each Period 2018 2017 2016 2015 2014 2013
Net Asset Value, Beginning of Period $61.86 $51.65 $47.23 $47.65 $42.81 $32.90
Investment Operations
Net Investment Income .5701 1.0941 1.019 .936 .846 .752
Net Realized and Unrealized Gain (Loss)
on Investments 1.117 10.197 4.422 (.430) 4.839 9.909
Total from Investment Operations 1.687 11.291 5.441 .506 5.685 10.661
Distributions
Dividends from Net Investment Income (.547) (1.081) (1.021) (.926) (.845) (.751)
Distributions from Realized Capital Gains — — — — — —
Total Distributions (.547) (1.081) (1.021) (.926) (.845) (.751)
Net Asset Value, End of Period $63.00 $61.86 $51.65 $47.23 $47.65 $42.81
Total Return2 2.73% 22.03% 11.65% 1.07% 13.38% 32.66%
Ratios/Supplemental Data
Net Assets, End of Period (Millions) $5,596 $5,375 $4,130 $3,527 $3,085 $1,438
Ratio of Total Expenses to
Average Net Assets 0.05% 0.05% 0.06% 0.08% 0.09% 0.09%
Ratio of Net Investment Income to
Average Net Assets 1.83% 1.93% 2.14% 1.98% 1.90% 1.97%
Portfolio Turnover Rate3 4% 3% 5% 4% 3% 9%
The expense ratio, net investment income ratio, and turnover rate for the current period have been annualized.
1 Calculated based on average shares outstanding.
2 Total returns do not include account service fees that may have applied in the periods shown. Fund prospectuses provide information about any applicable account service fees.
3 Excludes the value of portfolio securities received or delivered as a result of in-kind purchases or redemptions of the fund’s capital shares, including ETF Creation Units.
Financial Highlights
See accompanying Notes, which are an integral part of the Financial Statements.
Large-Cap Index Fund
61

Institutional Shares
Six Months
Ended
For a Share Outstanding June 30, Year Ended December 31,
Throughout Each Period 2018 2017 2016 2015 2014 2013
Net Asset Value, Beginning of Period $254.60 $212.59 $194.40 $196.14 $176.18 $135.42
Investment Operations
Net Investment Income 2.3621 4.5291 4.215 3.865 3.492 3.105
Net Realized and Unrealized Gain (Loss)
on Investments 4.593 41.958 18.199 (1.781) 19.957 40.761
Total from Investment Operations 6.955 46.487 22.414 2.084 23.449 43.866
Distributions
Dividends from Net Investment Income (2.265) (4.477) (4.224) (3.824) (3.489) (3.106)
Distributions from Realized Capital Gains — — — — — —
Total Distributions (2.265) (4.477) (4.224) (3.824) (3.489) (3.106)
Net Asset Value, End of Period $259.29 $254.60 $212.59 $194.40 $196.14 $176.18
Total Return 2.73% 22.03% 11.66% 1.07% 13.41% 32.65%
Ratios/Supplemental Data
Net Assets, End of Period (Millions) $1,231 $1,212 $932 $794 $857 $750
Ratio of Total Expenses to
Average Net Assets 0.04% 0.04% 0.05% 0.07% 0.08% 0.08%
Ratio of Net Investment Income to
Average Net Assets 1.84% 1.94% 2.15% 1.99% 1.91% 1.98%
Portfolio Turnover Rate2 4% 3% 5% 4% 3% 9%
The expense ratio, net investment income ratio, and turnover rate for the current period have been annualized.
1 Calculated based on average shares outstanding.
2 Excludes the value of portfolio securities received or delivered as a result of in-kind purchases or redemptions of the fund’s capital shares, including ETF Creation Units.
Financial Highlights
See accompanying Notes, which are an integral part of the Financial Statements.
Large-Cap Index Fund
62

Notes to Financial Statements
Large-Cap Index Fund
Vanguard Large-Cap Index Fund is registered under the Investment Company Act of 1940 as an
open-end investment company, or mutual fund. The fund offers four classes of shares: Investor
Shares, ETF Shares, Admiral Shares, and Institutional Shares. Investor Shares are available to any
investor who meets the fund’s minimum purchase requirements. ETF Shares are listed for trading
on NYSE Arca; they can be purchased and sold through a broker. Admiral Shares and Institutional
Shares are designed for investors who meet certain administrative, service, and account-size
criteria.
A. The following significant accounting policies conform to generally accepted accounting
principles for U.S. investment companies. The fund consistently follows such policies in
preparing its financial statements.
1. Security Valuation: Securities are valued as of the close of trading on the New York Stock
Exchange (generally 4 p.m., Eastern time) on the valuation date. Equity securities are valued at
the latest quoted sales prices or official closing prices taken from the primary market in which each
security trades; such securities not traded on the valuation date are valued at the mean of the latest
quoted bid and asked prices. Securities for which market quotations are not readily available, or
whose values have been materially affected by events occurring before the fund’s pricing time but
after the close of the securities’ primary markets, are valued by methods deemed by the board of
trustees to represent fair value. Investments in Vanguard Market Liquidity Fund are valued at that
fund’s net asset value. Temporary cash investments are valued using the latest bid prices or using
valuations based on a matrix system (which considers such factors as security prices, yields,
maturities, and ratings), both as furnished by independent pricing services.
2. Futures Contracts: The fund uses index futures contracts to a limited extent, with the objectives of
maintaining full exposure to the stock market, maintaining liquidity, and minimizing transaction costs.
The fund may purchase futures contracts to immediately invest incoming cash in the market, or sell
futures in response to cash outflows, thereby simulating a fully invested position in the underlying
index while maintaining a cash balance for liquidity. The primary risks associated with the use of
futures contracts are imperfect correlation between changes in market values of stocks held by
the fund and the prices of futures contracts, and the possibility of an illiquid market. Counterparty
risk involving futures is mitigated because a regulated clearinghouse is the counterparty instead
of the clearing broker. To further mitigate counterparty risk, the fund trades futures contracts on
an exchange, monitors the financial strength of its clearing brokers and clearinghouse, and has
entered into clearing agreements with its clearing brokers. The clearinghouse imposes initial
margin requirements to secure the fund’s performance and requires daily settlement of variation
margin representing changes in the market value of each contract.
Futures contracts are valued at their quoted daily settlement prices. The notional amounts of the
contracts are not recorded in the Statement of Net Assets. Fluctuations in the value of the contracts
are recorded in the Statement of Net Assets as an asset (liability) and in the Statement of Operations
as unrealized appreciation (depreciation) until the contracts are closed, when they are recorded as
realized futures gains (losses).
During the six months ended June 30, 2018, the fund’s average investments in long and short
futures contracts represented less than 1% and 0% of net assets, respectively, based on the
average of the notional amounts at each quarter-end during the period.
63
Large-Cap Index Fund
3. Federal Income Taxes: The fund intends to continue to qualify as a regulated investment
company and distribute all of its taxable income. Management has analyzed the fund’s tax
positions taken for all open federal income tax years (December 31, 2014–2017), and for the
period ended June 30, 2018, and has concluded that no provision for federal income tax is
required in the fund’s financial statements.
4. Distributions: Distributions to shareholders are recorded on the ex-dividend date.
5. Securities Lending: To earn additional income, the fund lends its securities to qualified institutional
borrowers. Security loans are subject to termination by the fund at any time, and are required to be
secured at all times by collateral in an amount at least equal to the market value of securities loaned.
Daily market fluctuations could cause the value of loaned securities to be more or less than the value
of the collateral received. When this occurs, the collateral is adjusted and settled before the opening
of the market on the next business day. The fund further mitigates its counterparty risk by entering
into securities lending transactions only with a diverse group of prequalified counterparties,
monitoring their financial strength, and entering into master securities lending agreements with
its counterparties. The master securities lending agreements provide that, in the event of a
counterparty’s default (including bankruptcy), the fund may terminate any loans with that borrower,
determine the net amount owed, and sell or retain the collateral up to the net amount owed to the
fund; however, such actions may be subject to legal proceedings. While collateral mitigates
counterparty risk, in the event of a default, the fund may experience delays and costs in recovering
the securities loaned. The fund invests cash collateral received in Vanguard Market Liquidity Fund,
and records a liability in the Statement of Net Assets for the return of the collateral, during the period
the securities are on loan. Securities lending income represents fees charged to borrowers plus
income earned on invested cash collateral, less expenses associated with the loan. During the term
of the loan, the fund is entitled to all distributions made on or in respect of the loaned securities.
6. Credit Facility: The fund and certain other funds managed by The Vanguard Group (“Vanguard”)
participate in a $3.1 billion committed credit facility provided by a syndicate of lenders pursuant to
a credit agreement that may be renewed annually; each fund is individually liable for its borrowings,
if any, under the credit facility. Borrowings may be utilized for temporary and emergency purposes,
and are subject to the fund’s regulatory and contractual borrowing restrictions. The participating
funds are charged administrative fees and an annual commitment fee of 0.10% of the undrawn
amount of the facility; these fees are allocated to the funds based on a method approved by the
fund’s board of trustees and included in Management and Administrative expenses on the fund’s
Statement of Operations. Any borrowings under this facility bear interest at a rate based upon the
higher of the one-month London Interbank Offered Rate, federal funds effective rate, or overnight
bank funding rate plus an agreed-upon spread.
The fund had no borrowings outstanding at June 30, 2018, or at any time during the period
then ended.
7. Other: Dividend income is recorded on the ex-dividend date. Interest income includes income
distributions received from Vanguard Market Liquidity Fund and is accrued daily. Premiums and
discounts on debt securities purchased are amortized and accreted, respectively, to interest
income over the lives of the respective securities. Security transactions are accounted for on the
date securities are bought or sold. Costs used to determine realized gains (losses) on the sale of
investment securities are those of the specific securities sold.
64
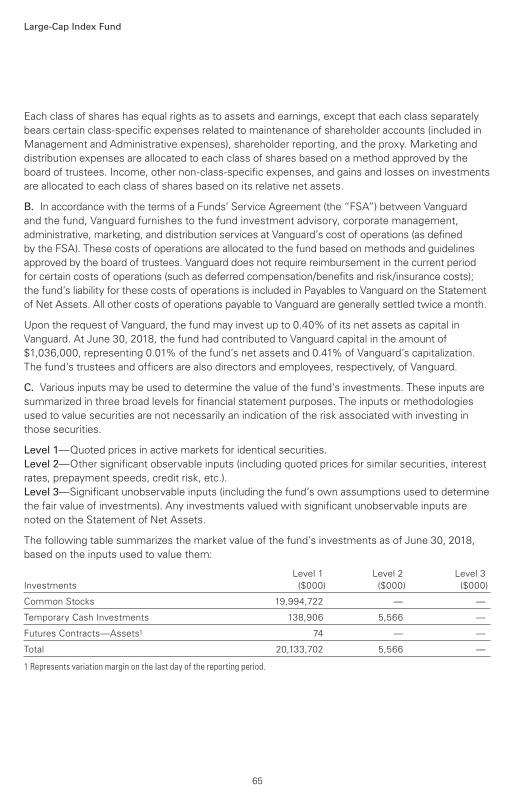
Large-Cap Index Fund
Each class of shares has equal rights as to assets and earnings, except that each class separately
bears certain class-specific expenses related to maintenance of shareholder accounts (included in
Management and Administrative expenses), shareholder reporting, and the proxy. Marketing and
distribution expenses are allocated to each class of shares based on a method approved by the
board of trustees. Income, other non-class-specific expenses, and gains and losses on investments
are allocated to each class of shares based on its relative net assets.
B. In accordance with the terms of a Funds’ Service Agreement (the “FSA”) between Vanguard
and the fund, Vanguard furnishes to the fund investment advisory, corporate management,
administrative, marketing, and distribution services at Vanguard’s cost of operations (as defined
by the FSA). These costs of operations are allocated to the fund based on methods and guidelines
approved by the board of trustees. Vanguard does not require reimbursement in the current period
for certain costs of operations (such as deferred compensation/benefits and risk/insurance costs);
the fund’s liability for these costs of operations is included in Payables to Vanguard on the Statement
of Net Assets. All other costs of operations payable to Vanguard are generally settled twice a month.
Upon the request of Vanguard, the fund may invest up to 0.40% of its net assets as capital in
Vanguard. At June 30, 2018, the fund had contributed to Vanguard capital in the amount of
$1,036,000, representing 0.01% of the fund’s net assets and 0.41% of Vanguard’s capitalization.
The fund’s trustees and officers are also directors and employees, respectively, of Vanguard.
C. Various inputs may be used to determine the value of the fund’s investments. These inputs are
summarized in three broad levels for financial statement purposes. The inputs or methodologies
used to value securities are not necessarily an indication of the risk associated with investing in
those securities.
Level 1—Quoted prices in active markets for identical securities.
Level 2—Other significant observable inputs (including quoted prices for similar securities, interest
rates, prepayment speeds, credit risk, etc.).
Level 3—Significant unobservable inputs (including the fund’s own assumptions used to determine
the fair value of investments). Any investments valued with significant unobservable inputs are
noted on the Statement of Net Assets.
The following table summarizes the market value of the fund’s investments as of June 30, 2018,
based on the inputs used to value them:
Level 1 Level 2 Level 3
Investments ($000) ($000) ($000)
Common Stocks 19,994,722 — —
Temporary Cash Investments 138,906 5,566 —
Futures Contracts—Assets1 74 — —
Total 20,133,702 5,566 —
1 Represents variation margin on the last day of the reporting period.
65
Large-Cap Index Fund
D. Distributions are determined on a tax basis and may differ from net investment income and
realized capital gains for financial reporting purposes. Differences may be permanent or temporary.
Permanent differences are reclassified among capital accounts in the financial statements to reflect
their tax character. Temporary differences arise when certain items of income, expense, gain, or
loss are recognized in different periods for financial statement and tax purposes. These differences
will reverse at some time in the future. Differences in classification may also result from the
treatment of short-term gains as ordinary income for tax purposes.
During the six months ended June 30, 2018, the fund realized $322,274,000 of net capital gains
resulting from in-kind redemptions—in which shareholders exchanged fund shares for securities
held by the fund rather than for cash. Because such gains are not taxable to the fund, and are not
distributed to shareholders, they have been reclassified from accumulated net realized losses to
paid-in capital.
The fund’s tax-basis capital gains and losses are determined only at the end of each fiscal year. For
tax purposes, at December 31, 2017, the fund had available capital losses totaling $118,637,000 to
offset future net capital gains. Of this amount, $24,177,000 is subject to expiration on December 31,
2018. Capital losses of $94,460,000 realized beginning in fiscal 2011 may be carried forward
indefinitely under the Regulated Investment Company Modernization Act of 2010, but must be used
before any expiring loss carryforwards. The fund will use these capital losses to offset net taxable
capital gains, if any, realized during the year ending December 31, 2018; should the fund realize net
capital losses for the year, the losses will be added to the loss carryforward balance above.
At June 30, 2018, the cost of investment securities for tax purposes was $13,229,085,000. Net
unrealized appreciation of investment securities for tax purposes was $6,910,109,000, consisting
of unrealized gains of $7,197,234,000 on securities that had risen in value since their purchase and
$287,125,000 in unrealized losses on securities that had fallen in value since their purchase.
E. During the six months ended June 30, 2018, the fund purchased $1,962,929,000 of investment
securities and sold $866,809,000 of investment securities, other than temporary cash investments.
Purchases and sales include $1,515,238,000 and $521,103,000, respectively, in connection with
in-kind purchases and redemptions of the fund’s capital shares.
66

Large-Cap Index Fund
F. Capital share transactions for each class of shares were:
Six Months Ended Year Ended
June 30, 2018 December 31, 2017
Amount Shares Amount Shares
($000) (000) ($000) (000)
Investor Shares
Issued 73,486 1,446 118,135 2,621
Issued in Lieu of Cash Distributions 3,049 60 6,912 150
Redeemed (84,962) (1,680) (211,930) (4,643)
Net Increase (Decrease)—Investor Shares (8,427) (174) (86,883) (1,872)
ETF Shares
Issued 1,575,840 12,582 1,614,290 14,185
Issued in Lieu of Cash Distributions — — — —
Redeemed (522,543) (4,125) (242,242) (2,175)
Net Increase (Decrease)—ETF Shares 1,053,297 8,457 1,372,048 12,010
Admiral Shares
Issued 613,695 9,735 1,077,132 19,032
Issued in Lieu of Cash Distributions 39,677 627 74,998 1,299
Redeemed (531,248) (8,433) (760,079) (13,403)
Net Increase (Decrease)—Admiral Shares 122,124 1,929 392,051 6,928
Institutional Shares
Issued 132,811 511 316,743 1,353
Issued in Lieu of Cash Distributions 8,686 33 16,062 67
Redeemed (145,721) (555) (242,936) (1,043)
Net Increase (Decrease)—Institutional Shares (4,224) (11) 89,869 377
G. Management has determined that no events or transactions occurred subsequent to
June 30, 2018, that would require recognition or disclosure in these financial statements.
67
About Your Fund’s Expenses
68
As a shareholder of the fund, you incur ongoing costs, which include costs for portfolio management,
administrative services, and shareholder reports (like this one), among others. Operating expenses,
which are deducted from a fund’s gross income, directly reduce the investment return of the fund.
A fund’s expenses are expressed as a percentage of its average net assets. This figure is known as
the expense ratio. The following examples are intended to help you understand the ongoing costs (in
dollars) of investing in your fund and to compare these costs with those of other mutual funds. The
examples are based on an investment of $1,000 made at the beginning of the period shown and held
for the entire period.
The accompanying table illustrates your fund’s costs in two ways:
• Based on actual fund return. This section helps you to estimate the actual expenses that you
paid over the period. The ”Ending Account Value“ shown is derived from the fund‘s actual return,
and the third column shows the dollar amount that would have been paid by an investor who started
with $1,000 in the fund. You may use the information here, together with the amount you invested,
to estimate the expenses that you paid over the period.
To do so, simply divide your account value by $1,000 (for example, an $8,600 account value divided
by $1,000 = 8.6), then multiply the result by the number given for your fund under the heading
”Expenses Paid During Period.“
• Based on hypothetical 5% yearly return. This section is intended to help you compare your
fund‘s costs with those of other mutual funds. It assumes that the fund had a yearly return of 5%
before expenses, but that the expense ratio is unchanged. In this case—because the return used is
not the fund’s actual return—the results do not apply to your investment. The example is useful in
making comparisons because the Securities and Exchange Commission requires all mutual funds to
calculate expenses based on a 5% return. You can assess your fund’s costs by comparing this
hypothetical example with the hypothetical examples that appear in shareholder reports of other
funds.
Note that the expenses shown in the table are meant to highlight and help you compare ongoingcosts only and do not reflect transaction costs incurred by the fund for buying and sellingsecurities. Further, the expenses do not include any purchase, redemption, or account servicefees described in the fund prospectus. If such fees were applied to your account, your costswould be higher. Your fund does not carry a “sales load.”
The calculations assume no shares were bought or sold during the period. Your actual costs may
have been higher or lower, depending on the amount of your investment and the timing of any
purchases or redemptions.
You can find more information about the fund’s expenses, including annual expense ratios, in the
Financial Statements section of this report. For additional information on operating expenses and
other shareholder costs, please refer to your fund’s current prospectus.

69
Six Months Ended June 30, 2018
Beginning
Account Value
12/31/2017
Ending
Account Value
6/30/2018
Expenses
Paid During
Period
Based on Actual Fund Return
Growth Index Fund
Investor Shares $1,000.00 $1,070.83 $0.87
ETF Shares 1,000.00 1,071.58 0.26
Admiral Shares 1,000.00 1,071.48 0.26
Institutional Shares 1,000.00 1,071.53 0.21
Value Index Fund
Investor Shares $1,000.00 $988.44 $0.84
ETF Shares 1,000.00 989.39 0.25
Admiral Shares 1,000.00 989.28 0.25
Institutional Shares 1,000.00 989.09 0.20
Large-Cap Index Fund
Investor Shares $1,000.00 $1,026.60 $0.85
ETF Shares 1,000.00 1,027.29 0.25
Admiral Shares 1,000.00 1,027.25 0.25
Institutional Shares 1,000.00 1,027.29 0.20
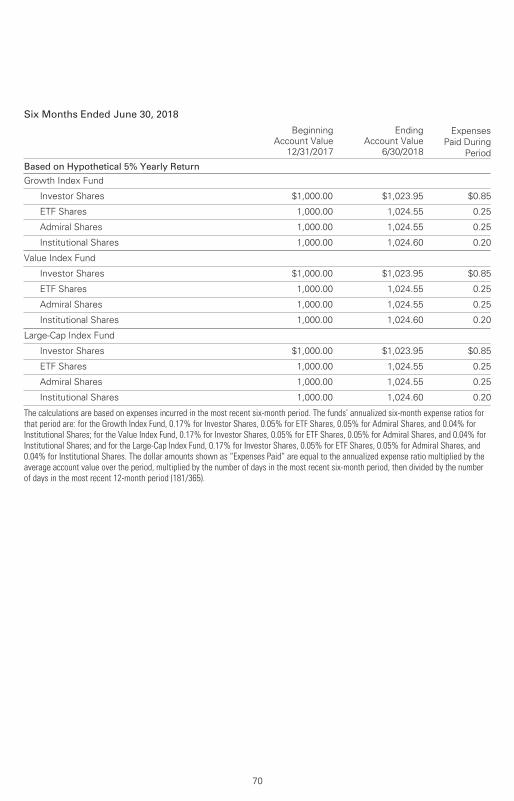
70
Six Months Ended June 30, 2018
Beginning
Account Value
12/31/2017
Ending
Account Value
6/30/2018
Expenses
Paid During
Period
Based on Hypothetical 5% Yearly Return
Growth Index Fund
Investor Shares $1,000.00 $1,023.95 $0.85
ETF Shares 1,000.00 1,024.55 0.25
Admiral Shares 1,000.00 1,024.55 0.25
Institutional Shares 1,000.00 1,024.60 0.20
Value Index Fund
Investor Shares $1,000.00 $1,023.95 $0.85
ETF Shares 1,000.00 1,024.55 0.25
Admiral Shares 1,000.00 1,024.55 0.25
Institutional Shares 1,000.00 1,024.60 0.20
Large-Cap Index Fund
Investor Shares $1,000.00 $1,023.95 $0.85
ETF Shares 1,000.00 1,024.55 0.25
Admiral Shares 1,000.00 1,024.55 0.25
Institutional Shares 1,000.00 1,024.60 0.20
The calculations are based on expenses incurred in the most recent six-month period. The funds’ annualized six-month expense ratios forthat period are: for the Growth Index Fund, 0.17% for Investor Shares, 0.05% for ETF Shares, 0.05% for Admiral Shares, and 0.04% forInstitutional Shares; for the Value Index Fund, 0.17% for Investor Shares, 0.05% for ETF Shares, 0.05% for Admiral Shares, and 0.04% forInstitutional Shares; and for the Large-Cap Index Fund, 0.17% for Investor Shares, 0.05% for ETF Shares, 0.05% for Admiral Shares, and0.04% for Institutional Shares. The dollar amounts shown as “Expenses Paid” are equal to the annualized expense ratio multiplied by theaverage account value over the period, multiplied by the number of days in the most recent six-month period, then divided by the numberof days in the most recent 12-month period (181/365).
The board of trustees of Vanguard Growth Index Fund, Vanguard Value Index Fund, and Vanguard
Large-Cap Index Fund has renewed each fund’s investment advisory arrangement with The
Vanguard Group, Inc. (Vanguard), through its Equity Index Group. The board determined that
continuing each fund’s internalized management structure was in the best interests of the
fund and its shareholders.
The board based its decision upon an evaluation of the advisor’s investment staff, portfolio
management process, and performance. This evaluation included information provided to the
board by Vanguard’s Portfolio Review Department, which is responsible for fund and advisor
oversight and product management. The Portfolio Review Department met regularly with the
advisor and made monthly presentations to the board during the fiscal year that directed the
board’s focus to relevant information and topics.
The board, or an investment committee made up of board members, also received information
throughout the year during advisor presentations. For each advisor presentation, the board was
provided with letters and reports that included information about, among other things, the advisory
firm and the advisor’s assessment of the investment environment, portfolio performance, and
portfolio characteristics.
In addition, the board received monthly reports, which included a Market and Economic Report,
a Fund Dashboard Monthly Summary, and a Fund Performance Report.
Prior to their meeting, the trustees were provided with a memo and materials that summarized the
information they received over the course of the year. They also considered the factors discussed
below, among others. However, no single factor determined whether the board approved the
arrangements. Rather, it was the totality of the circumstances that drove the board’s decision.
Nature, extent, and quality of services
The board reviewed the quality of each fund’s investment management services over both the
short and long term and took into account the organizational depth and stability of the advisor. The
board considered that Vanguard has been managing investments for more than four decades. The
Equity Index Group adheres to a sound, disciplined investment management process; the team has
considerable experience, stability, and depth.
The board concluded that Vanguard’s experience, stability, depth, and performance, among other
factors, warranted continuation of each advisory arrangement.
Investment performance
The board considered the short- and long-term performance of each fund, including any periods of
outperformance or underperformance compared with its target index and peer group. The board
concluded that the performance was such that each advisory arrangement should continue.
Information about each fund’s most recent performance can be found on the Performance
Summary pages of this report.
Trustees Approve Advisory Arrangements
71

Cost
The board concluded that each fund’s expense ratio was well below the average expense ratio
charged by funds in its peer group and that each fund’s advisory expenses were also well below
its peer-group average. Information about the funds’ expenses appears in the About Your Fund’s
Expenses section of this report as well as in the Financial Statements sections.
The board does not conduct a profitability analysis of Vanguard because of Vanguard’s unique
“at-cost” structure. Unlike most other mutual fund management companies, Vanguard is owned
by the funds it oversees and produces “profits” only in the form of reduced expenses for fund
shareholders.
The benefit of economies of scale
The board concluded that the funds’ at-cost arrangements with Vanguard ensure that the funds
will realize economies of scale as they grow, with the cost to shareholders declining as fund
assets increase.
The board will consider whether to renew the advisory arrangements again after a one-year period.
72

Glossary
73
30-Day SEC Yield. A fund’s 30-day SEC yield is derived using a formula specified by the U.S.
Securities and Exchange Commission. Under the formula, data related to the fund’s security
holdings in the previous 30 days are used to calculate the fund’s hypothetical net income for that
period, which is then annualized and divided by the fund’s estimated average net assets over the
calculation period. For the purposes of this calculation, a security’s income is based on its current
market yield to maturity (for bonds), its actual income (for asset-backed securities), or its
projected dividend yield (for stocks). Because the SEC yield represents hypothetical annualized
income, it will differ—at times significantly—from the fund’s actual experience. As a result, the
fund’s income distributions may be higher or lower than implied by the SEC yield.
Beta. A measure of the magnitude of a fund’s past share-price fluctuations in relation to the ups
and downs of a given market index. The index is assigned a beta of 1.00. Compared with a given
index, a fund with a beta of 1.20 typically would have seen its share price rise or fall by 12%
when the index rose or fell by 10%. For this report, beta is based on returns over the past 36
months for both the fund and the index. Note that a fund’s beta should be reviewed in conjunction
with its R-squared (see definition). The lower the R-squared, the less correlation there is between
the fund and the index, and the less reliable beta is as an indicator of volatility.
Dividend Yield. Dividend income earned by stocks, expressed as a percentage of the aggregate
market value (or of net asset value, for a fund). The yield is determined by dividing the amount of
the annual dividends by the aggregate value (or net asset value) at the end of the period. For a
fund, the dividend yield is based solely on stock holdings and does not include any income
produced by other investments.
Earnings Growth Rate. The average annual rate of growth in earnings over the past five years for
the stocks now in a fund.
Equity Exposure. A measure that reflects a fund’s investments in stocks and stock futures. Any
holdings in short-term reserves are excluded.
Expense Ratio. A fund’s total annual operating expenses expressed as a percentage of the fund’s
average net assets. The expense ratio includes management and administrative expenses, but
does not include the transaction costs of buying and selling portfolio securities.
Foreign Holdings. The percentage of a fund represented by securities or depositary receipts of
companies based outside the United States.
Inception Date. The date on which the assets of a fund (or one of its share classes) are first
invested in accordance with the fund’s investment objective. For funds with a subscription period,
the inception date is the day after that period ends. Investment performance is measured from
the inception date.
Median Market Cap. An indicator of the size of companies in which a fund invests; the midpoint
of market capitalization (market price x shares outstanding) of a fund’s stocks, weighted by the
proportion of the fund’s assets invested in each stock. Stocks representing half of the fund’s
assets have market capitalizations above the median, and the rest are below it.
Price/Book Ratio. The share price of a stock divided by its net worth, or book value, per share.
For a fund, the weighted average price/book ratio of the stocks it holds.

74
Price/Earnings Ratio. The ratio of a stock’s current price to its per-share earnings over the past
year. For a fund, the weighted average P/E of the stocks it holds. P/E is an indicator of market
expectations about corporate prospects; the higher the P/E, the greater the expectations for a
company’s future growth.
R-Squared. A measure of how much of a fund’s past returns can be explained by the returns
from the market in general, as measured by a given index. If a fund’s total returns were precisely
synchronized with an index’s returns, its R-squared would be 1.00. If the fund’s returns bore no
relationship to the index’s returns, its R-squared would be 0. For this report, R-squared is based
on returns over the past 36 months for both the fund and the index.
Return on Equity. The annual average rate of return generated by a company during the past five
years for each dollar of shareholder’s equity (net income divided by shareholder’s equity). For a
fund, the weighted average return on equity for the companies whose stocks it holds.
Short-Term Reserves. The percentage of a fund invested in highly liquid, short-term securities
that can be readily converted to cash.
Turnover Rate. An indication of the fund’s trading activity. Funds with high turnover rates incur
higher transaction costs and may be more likely to distribute capital gains (which may be taxable
to investors). The turnover rate excludes in-kind transactions, which have minimal impact on
costs.
Benchmark Information
Spliced Growth Index: S&P 500 Growth Index (formerly known as the S&P 500/Barra Growth
Index) through May 16, 2003; MSCI US Prime Market Growth Index through April 16, 2013; CRSP
US Large Cap Growth Index thereafter.
Spliced Large Cap Index: MSCI US Prime Market 750 Index through January 30, 2013; CRSP US
Large Cap Index thereafter.
Spliced Value Index: S&P 500 Value Index (formerly known as the S&P 500/Barra Value Index)
through May 16, 2003; MSCI US Prime Market Value Index through April 16, 2013; CRSP US
Large Cap Value Index thereafter.
The People Who Govern Your Fund
The trustees of your mutual fund are there to see that the fund is operated and managed in your
best interests since, as a shareholder, you are a part owner of the fund. Your fund’s trustees also
serve on the board of directors of The Vanguard Group, Inc., which is owned by the Vanguard
funds and provides services to them on an at-cost basis.
A majority of Vanguard’s board members are independent, meaning that they have no affiliation
with Vanguard or the funds they oversee, apart from the sizable personal investments they have
made as private individuals. The independent board members have distinguished backgrounds
in business, academia, and public service. Each of the trustees and executive officers oversees
208 Vanguard funds.
Information for each trustee and executive officer of the fund appears below. The mailing address
of the trustees and officers is P.O. Box 876, Valley Forge, PA 19482. More information about the
trustees is in the Statement of Additional Information, which can be obtained, without charge,
by contacting Vanguard at 800-662-7447, or online at vanguard.com.
Interested Trustees1
F. William McNabb III
Born in 1957. Trustee since July 2009. Principal
occupation(s) during the past five years and
other experience: chairman of the board
(January 2010–present) of Vanguard and of each
of the investment companies served by Vanguard,
trustee (2009–present) of each of the investment
companies served by Vanguard, and director
(2008–present) of Vanguard. Chief executive officer
and president (2008–2017) of Vanguard and each
of the investment companies served by Vanguard,
managing director (1995–2008) of Vanguard,
and director (1997–2018) of Vanguard Marketing
Corporation. Director (2018–present) of
UnitedHealth Group.
Mortimer J. Buckley
Born in 1969. Trustee since January 2018. Principal
occupation(s) during the past five years and
other experience: chief executive officer
(January 2018–present) of Vanguard; chief executive
officer, president, and trustee (January 2018–present)
of each of the investment companies served by
Vanguard; president and director (2017–present) of
Vanguard; and president (February 2018–present) of
Vanguard Marketing Corporation. Chief investment
officer (2013–2017), managing director (2002–2017),
head of the Retail Investor Group (2006–2012), and
chief information officer (2001–2006) of Vanguard.
Chairman of the board (2011–2017) of the Children’s
Hospital of Philadelphia.
Independent Trustees
Emerson U. Fullwood
Born in 1948. Trustee since January 2008. Principal
occupation(s) during the past five years and other
experience: executive chief staff and marketing officer
for North America and corporate vice president (retired
2008) of Xerox Corporation (document management
products and services). Former president of the
Worldwide Channels Group, Latin America, and
Worldwide Customer Service and executive chief
staff officer of Developing Markets of Xerox. Executive
in residence and 2009–2010 Distinguished Minett
Professor at the Rochester Institute of Technology.
Lead director of SPX FLOW, Inc. (multi-industry
manufacturing). Director of the University of Rochester
Medical Center, the Monroe Community College
Foundation, the United Way of Rochester, North
Carolina A&T University, and Roberts Wesleyan
College. Trustee of the University of Rochester.
Amy Gutmann
Born in 1949. Trustee since June 2006. Principal
occupation(s) during the past five years and other
experience: president (2004–present) of the University
of Pennsylvania. Christopher H. Browne Distinguished
Professor of Political Science, School of Arts and
Sciences, and professor of communication, Annenberg
School for Communication, with secondary faculty
appointments in the Department of Philosophy, School
of Arts and Sciences, and at the Graduate School of
Education, University of Pennsylvania. Trustee of the
National Constitution Center.
1 Mr. McNabb and Mr. Buckley are considered “interested persons,” as defined in the Investment Company Act of 1940, because they are officers of the Vanguard funds.

JoAnn Heffernan Heisen
Born in 1950. Trustee since July 1998. Principal
occupation(s) during the past five years and other
experience: corporate vice president of Johnson &
Johnson (pharmaceuticals/medical devices/consumer
products) and member of its executive committee
(1997–2008). Chief global diversity officer (retired
2008), vice president and chief information officer
(1997–2006), controller (1995–1997), treasurer
(1991–1995), and assistant treasurer (1989–1991)
of Johnson & Johnson. Director of Skytop Lodge
Corporation (hotels) and the Robert Wood Johnson
Foundation. Member of the advisory board of the
Institute for Women’s Leadership at Rutgers University.
F. Joseph Loughrey
Born in 1949. Trustee since October 2009. Principal
occupation(s) during the past five years and other
experience: president and chief operating officer
(retired 2009) and vice chairman of the board
(2008–2009) of Cummins Inc. (industrial machinery).
Chairman of the board of Hillenbrand, Inc. (specialized
consumer services), Oxfam America, and the Lumina
Foundation for Education. Director of the V Foundation
for Cancer Research. Member of the advisory council
for the College of Arts and Letters and chair of the
advisory board to the Kellogg Institute for International
Studies, both at the University of Notre Dame.
Mark Loughridge
Born in 1953. Trustee since March 2012. Principal
occupation(s) during the past five years and other
experience: senior vice president and chief financial
officer (retired 2013) of IBM (information technology
services). Fiduciary member of IBM’s Retirement
Plan Committee (2004–2013), senior vice president
and general manager (2002–2004) of IBM Global
Financing, vice president and controller (1998–2002)
of IBM, and a variety of other prior management roles
at IBM. Member of the Council on Chicago Booth.
Scott C. Malpass
Born in 1962. Trustee since March 2012. Principal
occupation(s) during the past five years and other
experience: chief investment officer (1989–present)
and vice president (1996–present) of the University
of Notre Dame. Assistant professor of finance at the
Mendoza College of Business, University of Notre
Dame, and member of the Notre Dame 403(b)
Investment Committee. Chairman of the board of
TIFF Advisory Services, Inc. Member of the board
of Catholic Investment Services, Inc. (investment
advisors), the board of advisors for Spruceview
Capital Partners, and the board of superintendence
of the Institute for the Works of Religion.
Deanna Mulligan
Born in 1963. Trustee since January 2018. Principal
occupation(s) during the past five years and other
experience: president (2010–present) and chief
executive officer (2011–present) of The Guardian
Life Insurance Company of America. Chief operating
officer (2010–2011) and executive vice president
(2008–2010) of Individual Life and Disability of
The Guardian Life Insurance Company of America.
Member of the board of The Guardian Life Insurance
Company of America, the American Council of Life
Insurers, the Partnership for New York City (business
leadership), and the Committee Encouraging Corporate
Philanthropy. Trustee of the Economic Club of New
York and the Bruce Museum (arts and science).
Member of the Advisory Council for the Stanford
Graduate School of Business.
André F. Perold
Born in 1952. Trustee since December 2004. Principal
occupation(s) during the past five years and other
experience: George Gund Professor of Finance and
Banking, Emeritus at the Harvard Business School
(retired 2011). Chief investment officer and co-
managing partner of HighVista Strategies LLC
(private investment firm). Overseer of the Museum
of Fine Arts Boston.
Sarah Bloom Raskin
Born in 1961. Trustee since January 2018. Principal
occupation(s) during the past five years and other
experience: deputy secretary (2014–2017) of
the United States Department of the Treasury.
Governor (2010–2014) of the Federal Reserve Board.
Commissioner (2007–2010) of financial regulation
for the State of Maryland. Member of the board of
directors (2012–2014) of Neighborhood Reinvestment
Corporation. Director of i(x) Investments, LLC.
Peter F. Volanakis
Born in 1955. Trustee since July 2009. Principal
occupation(s) during the past five years and other
experience: president and chief operating officer
(retired 2010) of Corning Incorporated (communications
equipment) and director of Corning Incorporated
(2000–2010) and Dow Corning (2001–2010).
Director (2012) of SPX Corporation (multi-industry
manufacturing). Overseer of the Amos Tuck School
of Business Administration, Dartmouth College
(2001–2013). Chairman of the board of trustees of
Colby-Sawyer College. Member of the Board of
Hypertherm Inc. (industrial cutting systems, software,
and consumables).
Executive Officers
Glenn Booraem
Born in 1967. Principal occupation(s) during the past
five years and other experience: principal of Vanguard.
Investment stewardship officer (2017–present),
treasurer (2015–2017), controller (2010–2015),
and assistant controller (2001–2010) of each of
the investment companies served by Vanguard.
Christine M. Buchanan
Born in 1970. Principal occupation(s) during the past
five years and other experience: principal of Vanguard
and global head of Fund Administration at Vanguard.
Treasurer (2017–present) of each of the investment
companies served by Vanguard. Partner (2005–2017)
at KPMG LLP (audit, tax, and advisory services).
Brian Dvorak
Born in 1973. Principal occupation(s) during the past
five years and other experience: principal of Vanguard.
Chief compliance officer (2017–present) of Vanguard
and each of the investment companies served by
Vanguard. Assistant vice president (2017–present) of
Vanguard Marketing Corporation. Vice president and
director of Enterprise Risk Management (2011–2013)
at Oppenheimer Funds, Inc.
Thomas J. Higgins
Born in 1957. Principal occupation(s) during the past
five years and other experience: principal of Vanguard.
Chief financial officer (2008–present) and treasurer
(1998–2008) of each of the investment companies
served by Vanguard.
Peter Mahoney
Born in 1974. Principal occupation(s) during the past
five years and other experience: principal of Vanguard.
Controller (2015–present) of each of the investment
companies served by Vanguard. Head of International
Fund Services (2008–2014) at Vanguard.
Anne E. Robinson
Born in 1970. Principal occupation(s) during the
past five years and other experience: general
counsel (2016–present) of Vanguard. Secretary
(2016–present) of Vanguard and of each of the
investment companies served by Vanguard.
Managing director (2016–present) of Vanguard.
Director and senior vice president (2016–2018)
of Vanguard Marketing Corporation. Managing
director and general counsel of Global Cards and
Consumer Services (2014–2016) at Citigroup.
Counsel (2003–2014) at American Express.
Michael Rollings
Born in 1963. Principal occupation(s) during the
past five years and other experience: finance
director (2017–present) and treasurer (2017) of each
of the investment companies served by Vanguard.
Managing director (2016–present) of Vanguard. Chief
financial officer (2016–present) of Vanguard. Director
(2016–present) of Vanguard Marketing Corporation.
Executive vice president and chief financial officer
(2006–2016) of MassMutual Financial Group.
Vanguard Senior Management Team
Mortimer J. Buckley James M. Norris
Gregory Davis Thomas M. Rampulla
John James Karin A. Risi
Martha G. King Anne E. Robinson
John T. Marcante Michael Rollings
Chris D. McIsaac
Chairman Emeritus and Senior Advisor
John J. Brennan
Chairman, 1996–2009
Chief Executive Officer and President, 1996–2008
Founder
John C. Bogle
Chairman and Chief Executive Officer, 1974–1996

P.O. Box 2600
Valley Forge, PA 19482-2600
Connect with Vanguard® > vanguard.com
Fund Information > 800-662-7447
Direct Investor Account Services > 800-662-2739
Institutional Investor Services > 800-523-1036
Text Telephone for PeopleWho Are Deaf or Hard of Hearing > 800-749-7273
This material may be used in conjunctionwith the offering of shares of any Vanguardfund only if preceded or accompanied bythe fund’s current prospectus.
All comparative mutual fund data are from Lipper, aThomson Reuters Company, or Morningstar, Inc., unlessotherwise noted.
You can obtain a free copy of Vanguard’s proxy votingguidelines by visiting vanguard.com/proxyreporting or bycalling Vanguard at 800-662-2739. The guidelines arealso available from the SEC’s website, sec.gov. Inaddition, you may obtain a free report on how your fundvoted the proxies for securities it owned during the 12months ended June 30. To get the report, visit eithervanguard.com/proxyreporting or sec.gov.
You can review and copy information about your fund atthe SEC’s Public Reference Room in Washington, D.C. Tofind out more about this public service, call the SEC at202-551-8090. Information about your fund is alsoavailable on the SEC’s website, and you can receivecopies of this information, for a fee, by sending arequest in either of two ways: via email addressed [email protected] or via regular mail addressed to thePublic Reference Section, Securities and ExchangeCommission, Washington, DC 20549-1520.
Source for Bloomberg Barclays indexes: BloombergIndex Services Limited. Copyright 2018, Bloomberg.All rights reserved.
© 2018 The Vanguard Group, Inc.All rights reserved.Vanguard Marketing Corporation, Distributor.
Q03072 082018