vanguard strategic equity fund annual report september 30, 2016
TRANSCRIPT

Vanguard Strategic Equity Fund
Annual Report | September 30, 2017

Contents
Please note: The opinions expressed in this report are just that—informed opinions. They should not be considered promisesor advice. Also, please keep in mind that the information and opinions cover the period through the date on the front of thisreport. Of course, the risks of investing in your fund are spelled out in the prospectus.
See the Glossary for definitions of investment terms used in this report.About the cover: Nautical images have been part of Vanguard’s rich heritage since its start in 1975. For anincoming ship, a lighthouse offers a beacon and safe path to shore. You can similarly depend on Vanguard to putyou first––and light the way––as you strive to meet your financial goals. Our client focus and low costs,stemming from our unique ownership structure, assure that your interests are paramount.
Vanguard’s Principles for Investing Success
We want to give you the best chance of investment success. Theseprinciples, grounded in Vanguard’s research and experience, can put you onthe right path.
Goals. Create clear, appropriate investment goals.
Balance. Develop a suitable asset allocation using broadly diversified funds.
Cost. Minimize cost.
Discipline. Maintain perspective and long-term discipline.
A single theme unites these principles: Focus on the things you can control.We believe there is no wiser course for any investor.
Your Fund’s Performance at a Glance. . . . . . . . . . . . . . . . . . 1
Chairman’s Perspective. . . . . . . . . . . . . . . . . . . . . . . . . . . . . 3
Advisor’s Report. . . . . . . . . . . . . . . . . . . . . . . . . . . . . . . . . . . 7
Fund Profile. . . . . . . . . . . . . . . . . . . . . . . . . . . . . . . . . . . . . . .9
Performance Summary. . . . . . . . . . . . . . . . . . . . . . . . . . . . .10
Financial Statements. . . . . . . . . . . . . . . . . . . . . . . . . . . . . . 12
Your Fund’s After-Tax Returns. . . . . . . . . . . . . . . . . . . . . . . 26
About Your Fund’s Expenses. . . . . . . . . . . . . . . . . . . . . . . . 27
Glossary. . . . . . . . . . . . . . . . . . . . . . . . . . . . . . . . . . . . . . . . 29

Your Fund’s Performance at a Glance
1
Total Returns: Fiscal Year Ended September 30, 2017
TotalReturns
Vanguard Strategic Equity Fund 18.28%
MSCI US Small + Mid Cap 2200 Index 17.22
Mid-Cap Core Funds Average 15.96
Mid-Cap Core Funds Average: Derived from data provided by Lipper, a Thomson Reuters Company.
Total Returns: Ten Years Ended September 30, 2017
Average
Annual Return
Strategic Equity Fund 7.78%
MSCI US Small + Mid Cap 2200 Index 8.38
Mid-Cap Core Funds Average 6.86
Mid-Cap Core Funds Average: Derived from data provided by Lipper, a Thomson Reuters Company.
The figures shown represent past performance, which is not a guarantee of future results. (Current performance may be lower or higher than the performance data cited. For performance data current to the most recent month-end, visit our website at vanguard.com/performance.) Note, too, that both investment returns and principal value can fluctuate widely, so an investor’s shares, when sold, could be worth more or less than their original cost.
• Vanguard Strategic Equity Fund returned more than 18% for the 12 months ended
September 30, 2017. It outpaced its benchmark, the MSCI US Small + Mid Cap 2200
Index, by about a percentage point and also beat its peer-group average.
• The fund seeks long-term capital appreciation by investing in mid- and small-
capitalization domestic stocks, using a quantitative approach.
• Eight of the fund’s 11 sectors delivered gains for the year. Materials, industrials,
and financials were the strongest performers. Telecommunication services, energy,
and consumer staples posted negative results.
• Over the ten years ended September 30, 2017, the fund’s average annual return
was about half a percentage point below that of its benchmark index but higher than
the average return of its peer group.

2
Expense RatiosYour Fund Compared With Its Peer Group
Fund
Peer Group
Average
Strategic Equity Fund 0.18% 1.13%
The fund expense ratio shown is from the prospectus dated January 27, 2017, and represents estimated costs for the current fiscal year.For the fiscal year ended September 30, 2017, the fund’s expense ratio was 0.18%. The peer-group expense ratio is derived from dataprovided by Lipper, a Thomson Reuters Company, and captures information through year-end 2016.
Peer group: Mid-Cap Core Funds.

Dear Shareholder,
Our investors depend on Vanguard to
be a responsible steward of their assets.
This includes our obvious responsibilities—
managing the funds, offering investment
perspectives and advice, and assisting
with questions and transactions.
But because a long-term perspective
informs every aspect of our investment
approach, we also work on your behalf in
less obvious ways, such as by advocating
for responsible governance among the
companies in which Vanguard funds invest.
Vanguard’s index funds are essentially
permanent owners of thousands of publicly
traded companies, and we have a special
obligation to be engaged stewards actively
focused on the long term.
Simply put, we believe that well-governed
companies are more likely to perform well
over the long run.
Although Vanguard has always been an
advocate for strong corporate governance,
we have expanded our efforts recently
as our investor base continues to grow.
Our Investment Stewardship team has
doubled in size since 2015, and we
continue to add analysts, researchers,
and operations team members. The
team guides our engagement activities
and our funds’ proxy voting by analyzing
corporate governance practices in
companies around the world.
Chairman’s Perspective
Bill McNabb
Chairman and Chief Executive Officer
3

Our four Investment
Stewardship pillars
As we evaluate company responsive-
ness to governance matters, including
environmental and social concerns, we
focus on four key areas—what we call
our Investment Stewardship pillars:
• The board: A high-functioning,
well-composed, independent, diverse, and
experienced board with effective ongoing
evaluation practices.
• Governance structures: Provisions
and structures that empower shareholders
and protect their rights.
• Appropriate compensation: Pay that
incentivizes relative outperformance over
the long term.
• Risk oversight: Effective, integrated,
and ongoing oversight of relevant industry-
and company-specific risks.
Guided by these pillars, our Investment
Stewardship team conducted more
than 950 engagements, or discussions,
with company directors and leaders
worldwide during the 12 months ended
June 30, 2017.
Market Barometer
Average Annual Total Returns
Periods Ended September 30, 2017
One Year Three Years Five Years
Stocks
Russell 1000 Index (Large-caps) 18.54% 10.63% 14.27%
Russell 2000 Index (Small-caps) 20.74 12.18 13.79
Russell 3000 Index (Broad U.S. market) 18.71 10.74 14.23
FTSE All-World ex US Index (International) 19.49 5.11 7.35
Bonds
Bloomberg Barclays U.S. Aggregate Bond Index
(Broad taxable market) 0.07% 2.71% 2.06%
Bloomberg Barclays Municipal Bond Index
(Broad tax-exempt market) 0.87 3.19 3.01
Citigroup Three-Month U.S. Treasury Bill Index 0.64 0.28 0.18
CPI
Consumer Price Index 2.23% 1.22% 1.30%
4

We also cast more than 171,000 votes
on behalf of Vanguard funds at more
than 18,000 shareholder meetings.
Gender diversity on boards and
climate risk
As we engage with companies, we are
devoting increased attention to two specific
topics. The first is gender diversity on
boards. It’s no secret that the right
combination of talent, skills, and experience
leads to better results, so we pay close
attention to how company boards are
structured and managed, and how
they evolve.
In recent years, a growing body of
research has demonstrated that greater
diversity on boards can lead to improved
governance and company performance.
We are advocating for boards to incorporate
diverse perspectives and experience into
their strategic planning and decision-making.
One example of our commitment to more
diverse boards is our participation in the
30% Club, a global coalition working to
increase the representation of women
in boardrooms and leadership roles.
The second issue is climate risk. We
will continue to engage with companies
to understand their responses to this
risk. Regardless of one’s perspective
on the issue, the potential is real for
changing regulations, demographics, and
consumption behavior to affect business
results for companies in many sectors.
We want to ensure that such business
and regulatory risks are sufficiently
disclosed so investors can value
companies appropriately. In the past
year, we have voted for shareholder
proposals at several energy companies
that called for management to improve
its climate risk assessment and planning,
and we will consider supporting similar
proposals if we believe they are beneficial
to long-term shareholder value. When a
proposal from a shareholder presents a
strong case for change, we’re more than
willing to fully consider it. And even if the
case falls short, these proposals often
catalyze a discussion that generates
meaningful change over time.
In addition to considering activists’
proposals, we consult research providers
and our own network of experts. When
we detect material risks to a company’s
long-term value (such as bad leadership,
poor disclosure, misaligned compensation
structures, or threats to shareholder
rights), we act with our voice and our vote.
Our stewardship reflects our mission
But we don’t act as independent agents
with our own agenda. Every time we
speak with a company chairman, CEO,
or director, we’re acutely aware of the
role we play in representing the economic
interests of more than 20 million Vanguard
investors. So you can expect us to speak
out when we detect threats to the
economic interests of our shareholders.
5

We take positions on these matters not
because they are inherently good or noble
but because they are tied to the long-term
economic value of your funds’ investments.
You trust us to represent your interests
across the globe. You can be confident
we act on that responsibility with the
seriousness and dedication it deserves.
To learn more about our Investment
Stewardship program, including how
our funds have voted, visit https://about.
vanguard.com/investment-stewardship/.
As always, thank you for investing
with Vanguard.
Sincerely,
F. William McNabb III
Chairman and Chief Executive Officer
October 13, 2017
6

Advisor’s Report
7
For the 12 months ended September 30,
2017, Vanguard Strategic Equity Fund
returned 18.28%, outpacing its benchmark,
the MSCI US Small + Mid Cap 2200 Index,
by about a percentage point.
Please note that as of September 30, 2017,
the Strategic Equity Fund had realized
short-term capital gains equal to about
0.4% of fund assets and long-term capital
gains equal to about 6.0%. Gains will be
distributed in December.
Investment environmentOverall global economic growth, though
uncertain and mixed at times, combined
with rising corporate earnings to support
a strong performance by U.S. stocks.
Stock valuations climbed as investors
embraced risk.
The election of Donald Trump as U.S.
president last November spurred the
market. Investors anticipated the prospect
of favorable corporate tax code changes,
greater deregulation, and increased infra-
structure spending. Expectations waned
as change proved elusive, but markets
pressed higher even as the United States
was confronted by mounting tensions with
North Korea and several major hurricanes.
U.S. economic fundamentals remained
firm after favorable consumer confidence,
unemployment, and GDP data. The Federal
Reserve acknowledged the economy’s
strength, pushing the range of the federal
funds target rate to 1%–1.25% with hikes
in March and June. The groundwork has
been set for another increase in December
and three more in 2018.
The broad U.S. equity market (as measured
by the Russell 3000 Index) returned 18.71%
for the period. Growth stocks outperformed
their value counterparts, while small-
capitalization companies beat large-caps.
U.S. stocks trailed their developed-market
and emerging-market peers.
Investment objective and strategyAlthough it’s important to understand
how overall performance is affected
by the macroeconomic factors we’ve
described, our approach to investing
focuses on fundamentals—not technical
analysis of stock price movements. We
compare stocks within the same industry
group in order to identify those with
characteristics that we believe will
outperform over the long run.
To do this, we use a strict quantitative
approach to evaluate a stock’s attractive-
ness based on five characteristics: 1) high
quality—healthy balance sheets and
steady cash-flow generation; 2) effective
use of capital—sound investment policies
that favor internal over external funding;
3) consistent earnings growth—the ability
to grow earnings year after year; 4) strong
market sentiment—market confirmation
of our view; and 5) reasonable valuation—
we strive to avoid overpriced stocks.
Using these five characteristics, we
generate a daily composite stock ranking
as we seek to capitalize on market
inefficiencies. We then monitor our portfolio
based on those rankings and adjust when
appropriate to maximize expected returns
while minimizing exposure to risks that our
research indicates don’t improve returns

8
(such as industry selection and other risks
relative to our benchmark). Our approach
also includes a dynamic weighting process
that shifts the characteristics’ relative
importance over time.
Our successes and shortfallsOverall, the fund performed well. Although
only four of its 11 sectors boosted relative
results, their contributions helped the
fund surpass its benchmark. Our growth,
momentum, and valuation models were
useful, but our management decisions and
quality models did not perform as expected.
Stock selection in industrials and materials
lifted performance most. These sectors
have done well since the U.S. presidential
election in anticipation of increased
spending on infrastructure. Selection in
health care was also positive, but poor
selection in energy and consumer
discretionary stocks hurt.
Our most successful holdings included
Meritor, Spirit AeroSystems, Chemours,
AK Steel, and Array BioPharma. Results
were dragged down by Brinker, Sanchez
Energy, Newfield Exploration, and
FirstEnergy.
We continue to believe that constructing
a portfolio focused on the fundamentals
described above will benefit investors over
the long term, although we recognize that
risk can reward or punish us in the near
term. We feel the fund offers a strong
mix of stocks with attractive valuation
and growth characteristics relative to
its benchmark.
We thank you for your investment and
look forward to the coming fiscal year.
Portfolio Managers:
James P. Stetler
Binbin Guo, Principal,
Head of Alpha Equity Investments
Vanguard Quantitative Equity Group
October 10, 2017

Strategic Equity Fund
Fund ProfileAs of September 30, 2017
1 The expense ratio shown is from the prospectus dated January 27, 2017, and represents estimated costs for the current fiscal year. For the fiscal year ended September 30, 2017, the expense ratio was 0.18%.
9
Volatility Measures
MSCI US
Small +
Mid Cap
2200 Index
DJ
U.S. Total
Market
FA Index
R-Squared 0.93 0.80
Beta 1.03 1.07
These measures show the degree and timing of the fund’s fluctuations compared with the indexes over 36 months.
Portfolio Characteristics
Fund
MSCI US
Small +
Mid Cap
2200 Index
DJ
U.S.
Total
Market
FA
Index
Number of Stocks 330 2,165 3,808
Median Market Cap $5.4B $7.0B $61.4B
Price/Earnings Ratio 18.2x 22.7x 21.9x
Price/Book Ratio 2.6x 2.4x 2.9x
Return on Equity 11.6% 10.7% 15.1%
Earnings Growth
Rate 15.7% 10.5% 9.6%
Dividend Yield 1.6% 1.5% 1.8%
Foreign Holdings 0.2% 0.0% 0.0%
Turnover Rate 81% — —
Ticker Symbol VSEQX — —
Expense Ratio1
0.18% — —
30-Day SEC Yield 1.49% — —
Short-Term Reserves 0.0% — —
Sector Diversification (% of equity exposure)
Fund
MSCI USSmall +
Mid Cap2200 Index
DJU.S. Total
MarketFA Index
Consumer Discretionary 14.1% 14.1% 12.3%
Consumer Staples 3.0 2.9 7.3
Energy 4.2 4.2 5.8
Financials 15.6 15.7 15.0
Health Care 10.8 10.8 14.0
Industrials 15.3 15.2 10.8
Information Technology 17.3 17.2 22.3
Materials 6.0 6.2 3.4
Real Estate 9.1 9.0 4.0
TelecommunicationServices 0.4 0.4 2.0
Utilities 4.2 4.3 3.1
Sector categories are based on the Global Industry ClassificationStandard (“GICS”), except for the “Other” category (if applicable),which includes securities that have not been provided a GICSclassification as of the effective reporting period.
Ten Largest Holdings (% of total net assets)
Citizens Financial Group
Inc. Regional Banks 1.1%
Regions Financial Corp. Regional Banks 1.1
United Rentals Inc. Trading Companies &
Distributors 1.0
Best Buy Co. Inc. Computer &
Electronics Retail 1.0
Lear Corp. Auto Parts &
Equipment 1.0
CDW Corp. Technology
Distributors 1.0
E*TRADE Financial
Corp.
Investment Banking
& Brokerage 1.0
MSCI Inc. Financial Exchanges
& Data 1.0
Lincoln National Corp. Life & Health
Insurance 1.0
Owens Corning Building Products 0.9
Top Ten 10.1%
The holdings listed exclude any temporary cash investments andequity index products.
Investment Focus
Market Cap
Value
Large
Medium
Small
Blend Growth Style

All of the returns in this report represent past performance, which is not a guarantee of future results that may be achieved by the fund. (Current performance may be lower or higher thanthe performance data cited. For performance data current to the most recent month-end, visitour website at vanguard.com/performance.) Note, too, that both investment returns and principal value can fluctuate widely, so an investor’s shares, when sold, could be worth more or less than their original cost. The returns shown do not reflect taxes that a shareholder would pay
on fund distributions or on the sale of fund shares.
Strategic Equity Fund
Performance Summary
See Financial Highlights for dividend and capital gains information.
10
Cumulative Performance: September 30, 2007, Through September 30, 2017Initial Investment of $10,000
2017201620152014201320122011201020092008
$28,000
2,000
21,156
Average Annual Total Returns
Periods Ended September 30, 2017
OneYear
FiveYears
TenYears
Final Valueof a $10,000Investment
Strategic Equity Fund* 18.28% 15.90% 7.78% $21,156
• • • • • • • • MSCI US Small + Mid Cap 2200 Index 17.22 14.62 8.38 22,370
– – – – Mid-Cap Core Funds Average 15.96 12.61 6.86 19,416_________ Dow Jones U.S. Total Stock Market
Float Adjusted Index 18.67 14.15 7.64 20,887
Mid-Cap Core Funds Average: Derived from data provided by Lipper, a Thomson Reuters Company.

Strategic Equity Fund
11
Fiscal-Year Total Returns (%): September 30, 2007, Through September 30, 2017
–25.37–21.50
2008
–9.66–3.00
2009
13.7116.78
2010
1.23
–1.31
2011
30.32 28.86
2012
32.23 29.69
2013
18.5312.88
2014
2.01 0.65
2015
10.6214.54
2016
18.28 17.22
2017
Strategic Equity Fund
MSCI US Small + Mid Cap 2200 Index

Market
Value•
Shares ($000)
Market
Value•
Shares ($000)
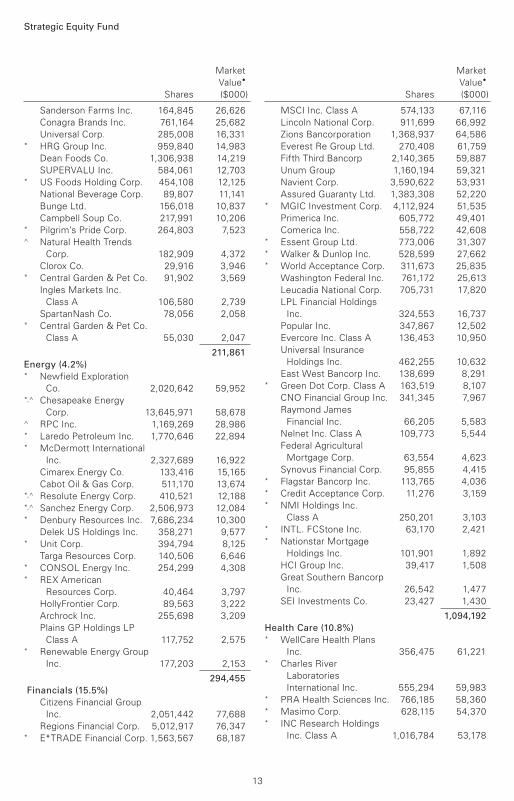
Common Stocks (99.6%)1
Consumer Discretionary (14.0%)
Best Buy Co. Inc. 1,235,845 70,394
Lear Corp. 401,406 69,475
Children’s Place Inc. 513,143 60,628* Burlington Stores Inc. 520,806 49,716* iRobot Corp. 613,499 47,276* Liberty Media Corp-
Liberty SiriusXM
Class A Shares 1,127,735 47,252
Bloomin’ Brands Inc. 2,578,686 45,385
Big Lots Inc. 834,036 44,679
Domino’s Pizza Inc. 222,635 44,204
Coach Inc. 960,570 38,692* NVR Inc. 12,747 36,393
Tailored Brands Inc. 2,109,672 30,464* Taylor Morrison Home
Corp. Class A 1,358,603 29,957
H&R Block Inc. 1,114,791 29,520
Brinker International Inc. 891,178 28,393
KB Home 1,162,885 28,049
Nutrisystem Inc. 438,223 24,497* MSG Networks Inc. 1,001,436 21,230* Live Nation
Entertainment Inc. 455,056 19,818
Ralph Lauren Corp.
Class A 221,426 19,550
Hasbro Inc. 196,389 19,181
BorgWarner Inc. 316,493 16,214* Dave & Buster’s
Entertainment Inc. 284,978 14,956* Liberty Media Corp-
Liberty SiriusXM
Class C Shares 338,887 14,189
News Corp. Class B 882,645 12,048* Cooper-Standard
Holdings Inc. 99,757 11,569
* Hyatt Hotels Corp.
Class A 183,411 11,333
Strayer Education Inc. 124,471 10,863
Service Corp.
International 298,147 10,286
MDC Holdings Inc. 266,593 8,853
PetMed Express Inc. 249,133 8,259
New York Times Co.
Class A 411,849 8,072* Discovery
Communications Inc.
Class A 303,318 6,458* Chegg Inc. 351,240 5,212* Adtalem Global
Education Inc. 144,444 5,178
Wolverine World Wide
Inc. 166,987 4,817
Aaron’s Inc. 109,282 4,768 * Select Comfort Corp. 143,195 4,446* Sotheby’s 91,320 4,211* Iconix Brand Group Inc. 578,360 3,291
Aramark 70,700 2,871
Wynn Resorts Ltd. 19,064 2,839* Visteon Corp. 22,292 2,759* Grand Canyon Education
Inc. 22,874 2,077
Capella Education Co. 29,450 2,066
Cracker Barrel Old
Country Store Inc. 10,021 1,519* Hovnanian Enterprises
Inc. Class A 781,198 1,508* Red Robin Gourmet
Burgers Inc. 22,266 1,492
986,907
Consumer Staples (3.0%)
Nu Skin Enterprises Inc.
Class A 500,224 30,754
Financial Statements
Statement of Net AssetsAs of September 30, 2017
The fund reports a complete list of its holdings in regulatory filings four times in each fiscal year, at
the quarter-ends. For the second and fourth fiscal quarters, the lists appear in the fund’s semiannual
and annual reports to shareholders. For the first and third fiscal quarters, the fund files the lists with
the Securities and Exchange Commission on Form N-Q. Shareholders can look up the fund’s Forms
N-Q on the SEC’s website at sec.gov. Forms N-Q may also be reviewed and copied at the SEC’s
Public Reference Room (see the back cover of this report for further information).
Strategic Equity Fund
12
Strategic Equity Fund
Market
Value•
Shares ($000)
Market
Value•
Shares ($000)
Sanderson Farms Inc. 164,845 26,626
Conagra Brands Inc. 761,164 25,682
Universal Corp. 285,008 16,331* HRG Group Inc. 959,840 14,983
Dean Foods Co. 1,306,938 14,219
SUPERVALU Inc. 584,061 12,703* US Foods Holding Corp. 454,108 12,125
National Beverage Corp. 89,807 11,141
Bunge Ltd. 156,018 10,837
Campbell Soup Co. 217,991 10,206* Pilgrim’s Pride Corp. 264,803 7,523^ Natural Health Trends
Corp. 182,909 4,372
Clorox Co. 29,916 3,946* Central Garden & Pet Co. 91,902 3,569
Ingles Markets Inc.
Class A 106,580 2,739
SpartanNash Co. 78,056 2,058* Central Garden & Pet Co.
Class A 55,030 2,047
211,861
Energy (4.2%) * Newfield Exploration
Co. 2,020,642 59,952*,^ Chesapeake Energy
Corp. 13,645,971 58,678^ RPC Inc. 1,169,269 28,986* Laredo Petroleum Inc. 1,770,646 22,894* McDermott International
Inc. 2,327,689 16,922
Cimarex Energy Co. 133,416 15,165
Cabot Oil & Gas Corp. 511,170 13,674*,^ Resolute Energy Corp. 410,521 12,188*,^ Sanchez Energy Corp. 2,506,973 12,084* Denbury Resources Inc. 7,686,234 10,300
Delek US Holdings Inc. 358,271 9,577* Unit Corp. 394,794 8,125
Targa Resources Corp. 140,506 6,646* CONSOL Energy Inc. 254,299 4,308* REX American
Resources Corp. 40,464 3,797
HollyFrontier Corp. 89,563 3,222
Archrock Inc. 255,698 3,209
Plains GP Holdings LP
Class A 117,752 2,575* Renewable Energy Group
Inc. 177,203 2,153
294,455
Financials (15.5%)
Citizens Financial Group
Inc. 2,051,442 77,688
Regions Financial Corp. 5,012,917 76,347* E*TRADE Financial Corp. 1,563,567 68,187
MSCI Inc. Class A 574,133 67,116
Lincoln National Corp. 911,699 66,992
Zions Bancorporation 1,368,937 64,586
Everest Re Group Ltd. 270,408 61,759
Fifth Third Bancorp 2,140,365 59,887
Unum Group 1,160,194 59,321
Navient Corp. 3,590,622 53,931
Assured Guaranty Ltd. 1,383,308 52,220* MGIC Investment Corp. 4,112,924 51,535
Primerica Inc. 605,772 49,401
Comerica Inc. 558,722 42,608* Essent Group Ltd. 773,006 31,307* Walker & Dunlop Inc. 528,599 27,662* World Acceptance Corp. 311,673 25,835
Washington Federal Inc. 761,172 25,613
Leucadia National Corp. 705,731 17,820
LPL Financial Holdings
Inc. 324,553 16,737
Popular Inc. 347,867 12,502
Evercore Inc. Class A 136,453 10,950
Universal Insurance
Holdings Inc. 462,255 10,632
East West Bancorp Inc. 138,699 8,291* Green Dot Corp. Class A 163,519 8,107
CNO Financial Group Inc. 341,345 7,967
Raymond James
Financial Inc. 66,205 5,583
Nelnet Inc. Class A 109,773 5,544
Federal Agricultural
Mortgage Corp. 63,554 4,623
Synovus Financial Corp. 95,855 4,415* Flagstar Bancorp Inc. 113,765 4,036* Credit Acceptance Corp. 11,276 3,159* NMI Holdings Inc.
Class A 250,201 3,103* INTL. FCStone Inc. 63,170 2,421* Nationstar Mortgage
Holdings Inc. 101,901 1,892
HCI Group Inc. 39,417 1,508
Great Southern Bancorp
Inc. 26,542 1,477
SEI Investments Co. 23,427 1,430
1,094,192
Health Care (10.8%) * WellCare Health Plans
Inc. 356,475 61,221* Charles River
Laboratories
International Inc. 555,294 59,983* PRA Health Sciences Inc. 766,185 58,360* Masimo Corp. 628,115 54,370* INC Research Holdings
Inc. Class A 1,016,784 53,178
13

Strategic Equity Fund
Market
Value•
Shares ($000)
Market
Value•
Shares ($000)
* Array BioPharma Inc. 4,311,608 53,033* Quintiles IMS Holdings
Inc. 554,738 52,739* Centene Corp. 529,992 51,287* Veeva Systems Inc.
Class A 740,609 41,778
Quest Diagnostics Inc. 402,907 37,728
Chemed Corp. 182,171 36,808* Tivity Health Inc. 851,704 34,749* IDEXX Laboratories Inc. 210,563 32,740 * Prestige Brands Holdings
Inc. 604,090 30,259* Exelixis Inc. 848,032 20,548* OraSure Technologies
Inc. 786,408 17,694* Mettler-Toledo
International Inc. 28,130 17,614
Agilent Technologies Inc. 273,582 17,564* Varian Medical Systems
Inc. 84,166 8,422
Bruker Corp. 176,567 5,253* ImmunoGen Inc. 479,871 3,671* Lantheus Holdings Inc. 178,400 3,175* Halyard Health Inc. 69,766 3,142
Cooper Cos. Inc. 12,496 2,963* Corcept Therapeutics Inc. 105,024 2,027* Cardiovascular Systems
Inc. 49,314 1,388
761,694
Industrials (15.2%) * United Rentals Inc. 510,143 70,777
Owens Corning 853,646 66,030
Spirit AeroSystems
Holdings Inc. Class A 829,052 64,434
ManpowerGroup Inc. 541,117 63,754
Huntington Ingalls
Industries Inc. 267,165 60,497* Meritor Inc. 2,237,170 58,189
Wabash National Corp. 2,466,052 56,275
Greenbrier Cos. Inc. 1,057,774 50,932
Brink’s Co. 584,008 49,203* Hawaiian Holdings Inc. 1,282,584 48,161* XPO Logistics Inc. 635,383 43,066
Oshkosh Corp. 503,492 41,558
GATX Corp. 608,041 37,431
SkyWest Inc. 769,166 33,766* MasTec Inc. 670,707 31,121
L3 Technologies Inc. 163,051 30,724
Allison Transmission
Holdings Inc. 806,487 30,267
Quad/Graphics Inc. 887,480 20,066
Argan Inc. 273,589 18,399* TriNet Group Inc. 470,099 15,805
Republic Services Inc.
Class A 226,538 14,965
Herman Miller Inc. 404,300 14,514* TransUnion 297,909 14,079
Timken Co. 223,204 10,837
Toro Co. 160,299 9,948
Global Brass & Copper
Holdings Inc. 281,610 9,518
Graco Inc. 68,236 8,440* JetBlue Airways Corp. 391,339 7,252* Rush Enterprises Inc.
Class A 154,573 7,155* Harsco Corp. 309,156 6,461
Steelcase Inc. Class A 375,318 5,780* ACCO Brands Corp. 432,272 5,144
LSC Communications Inc. 299,034 4,937
General Cable Corp. 257,854 4,861
Regal Beloit Corp. 60,622 4,789
Brady Corp. Class A 121,645 4,616* TrueBlue Inc. 199,034 4,468* Continental Building
Products Inc. 171,156 4,450* SPX Corp. 142,287 4,175 Ennis Inc. 197,520 3,881* Chart Industries Inc. 98,795 3,876
Applied Industrial
Technologies Inc. 55,809 3,672
Triumph Group Inc. 122,410 3,642* Aerojet Rocketdyne
Holdings Inc. 85,734 3,002
BWX Technologies Inc. 49,635 2,781
MSA Safety Inc. 27,939 2,221
Crane Co. 27,630 2,210
HEICO Corp. 24,337 2,186* ICF International Inc. 38,939 2,101
Rollins Inc. 43,375 2,001
Insperity Inc. 18,277 1,608
Robert Half International
Inc. 28,976 1,459
Barnes Group Inc. 20,408 1,438
Briggs & Stratton Corp. 57,949 1,362
1,074,284
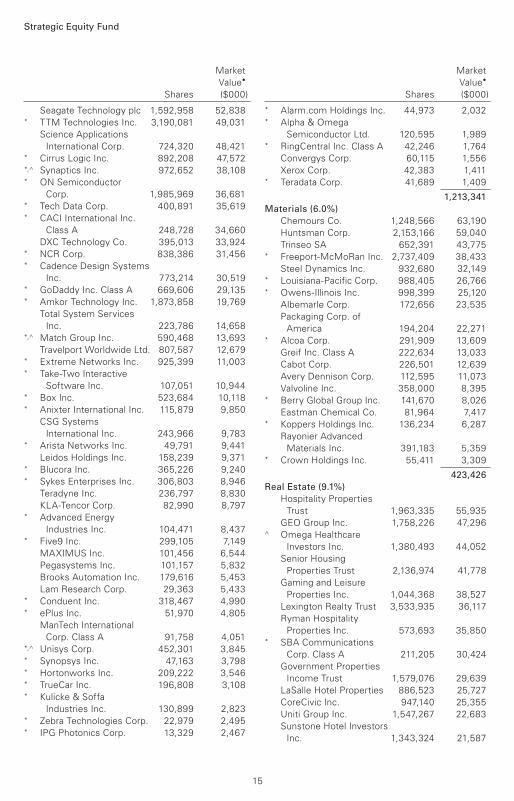
Information Technology (17.2%)
CDW Corp. 1,036,261 68,393*,^ Advanced Micro Devices
Inc. 5,016,182 63,956
Booz Allen Hamilton
Holding Corp. Class A 1,665,194 62,262
SYNNEX Corp. 490,977 62,113* Square Inc. 2,149,843 61,937* First Data Corp. Class A 3,359,348 60,603
CSRA Inc. 1,836,509 59,264* Aspen Technology Inc. 872,313 54,790
14
Strategic Equity Fund
Market
Value•
Shares ($000)
Market
Value•
Shares ($000)
Seagate Technology plc 1,592,958 52,838* TTM Technologies Inc. 3,190,081 49,031
Science Applications
International Corp. 724,320 48,421* Cirrus Logic Inc. 892,208 47,572*,^ Synaptics Inc. 972,652 38,108* ON Semiconductor
Corp. 1,985,969 36,681* Tech Data Corp. 400,891 35,619* CACI International Inc.
Class A 248,728 34,660
DXC Technology Co. 395,013 33,924* NCR Corp. 838,386 31,456* Cadence Design Systems
Inc. 773,214 30,519* GoDaddy Inc. Class A 669,606 29,135* Amkor Technology Inc. 1,873,858 19,769
Total System Services
Inc. 223,786 14,658*,^ Match Group Inc. 590,468 13,693
Travelport Worldwide Ltd. 807,587 12,679* Extreme Networks Inc. 925,399 11,003* Take-Two Interactive
Software Inc. 107,051 10,944* Box Inc. 523,684 10,118* Anixter International Inc. 115,879 9,850
CSG Systems
International Inc. 243,966 9,783* Arista Networks Inc. 49,791 9,441
Leidos Holdings Inc. 158,239 9,371* Blucora Inc. 365,226 9,240* Sykes Enterprises Inc. 306,803 8,946
Teradyne Inc. 236,797 8,830
KLA-Tencor Corp. 82,990 8,797* Advanced Energy
Industries Inc. 104,471 8,437* Five9 Inc. 299,105 7,149 MAXIMUS Inc. 101,456 6,544
Pegasystems Inc. 101,157 5,832
Brooks Automation Inc. 179,616 5,453
Lam Research Corp. 29,363 5,433* Conduent Inc. 318,467 4,990* ePlus Inc. 51,970 4,805
ManTech International
Corp. Class A 91,758 4,051*,^ Unisys Corp. 452,301 3,845* Synopsys Inc. 47,163 3,798* Hortonworks Inc. 209,222 3,546* TrueCar Inc. 196,808 3,108* Kulicke & Soffa
Industries Inc. 130,899 2,823* Zebra Technologies Corp. 22,979 2,495* IPG Photonics Corp. 13,329 2,467
* Alarm.com Holdings Inc. 44,973 2,032* Alpha & Omega
Semiconductor Ltd. 120,595 1,989* RingCentral Inc. Class A 42,246 1,764
Convergys Corp. 60,115 1,556
Xerox Corp. 42,383 1,411* Teradata Corp. 41,689 1,409
1,213,341
Materials (6.0%)
Chemours Co. 1,248,566 63,190
Huntsman Corp. 2,153,166 59,040
Trinseo SA 652,391 43,775* Freeport-McMoRan Inc. 2,737,409 38,433
Steel Dynamics Inc. 932,680 32,149* Louisiana-Pacific Corp. 988,405 26,766* Owens-Illinois Inc. 998,399 25,120
Albemarle Corp. 172,656 23,535
Packaging Corp. of
America 194,204 22,271* Alcoa Corp. 291,909 13,609
Greif Inc. Class A 222,634 13,033
Cabot Corp. 226,501 12,639
Avery Dennison Corp. 112,595 11,073
Valvoline Inc. 358,000 8,395* Berry Global Group Inc. 141,670 8,026
Eastman Chemical Co. 81,964 7,417* Koppers Holdings Inc. 136,234 6,287
Rayonier Advanced
Materials Inc. 391,183 5,359* Crown Holdings Inc. 55,411 3,309
423,426
Real Estate (9.1%)
Hospitality Properties
Trust 1,963,335 55,935
GEO Group Inc. 1,758,226 47,296^ Omega Healthcare
Investors Inc. 1,380,493 44,052
Senior Housing
Properties Trust 2,136,974 41,778
Gaming and Leisure
Properties Inc. 1,044,368 38,527
Lexington Realty Trust 3,533,935 36,117
Ryman Hospitality
Properties Inc. 573,693 35,850* SBA Communications
Corp. Class A 211,205 30,424
Government Properties
Income Trust 1,579,076 29,639
LaSalle Hotel Properties 886,523 25,727
CoreCivic Inc. 947,140 25,355 Uniti Group Inc. 1,547,267 22,683
Sunstone Hotel Investors
Inc. 1,343,324 21,587
15

Strategic Equity Fund
Market
Value•
Shares ($000)
Market
Value•
Shares ($000)
Summit Hotel Properties
Inc. 1,302,856 20,833
Sabra Health Care REIT
Inc. 853,082 18,717^ CBL & Associates
Properties Inc. 2,107,997 17,686
Washington Prime Group
Inc. 1,527,510 12,724
Xenia Hotels & Resorts
Inc. 581,802 12,247
Ashford Hospitality Trust
Inc. 1,699,662 11,337
Essex Property Trust Inc. 42,336 10,755
Brandywine Realty Trust 577,517 10,101
CoreSite Realty Corp. 82,296 9,209
Select Income REIT 364,195 8,529
MGM Growth Properties
LLC Class A 267,381 8,078
Pebblebrook Hotel Trust 215,179 7,777*,2 Forestar Group Inc. 350,891 6,035
DiamondRock Hospitality
Co. 481,813 5,276
Outfront Media Inc. 191,018 4,810
NorthStar Realty Europe
Corp. 354,448 4,540
Equity LifeStyle
Properties Inc. 47,095 4,007
New Senior Investment
Group Inc. 401,108 3,670
Universal Health Realty
Income Trust 38,604 2,914
RLJ Lodging Trust 105,478 2,320
National Health Investors
Inc. 19,112 1,477
Piedmont Office Realty
Trust Inc. Class A 68,065 1,372
639,384
Telecommunication Services (0.4%) * Zayo Group Holdings Inc. 673,498 23,182
Cincinnati Bell Inc. 89,810 1,782
24,964
Utilities (4.2%)
FirstEnergy Corp. 2,132,255 65,737
CenterPoint Energy Inc. 2,199,643 64,252
Entergy Corp. 695,977 53,145
MDU Resources Group
Inc. 1,426,372 37,014
National Fuel Gas Co. 289,269 16,375
Ameren Corp. 259,685 15,020
NRG Energy Inc. 453,388 11,602
DTE Energy Co. 76,472 8,210
PNM Resources Inc. 184,667 7,442
AES Corp. 572,101 6,305
UGI Corp. 113,403 5,314
Black Hills Corp. 42,441 2,923^ Spark Energy Inc.
Class A 137,179 2,058
Avangrid Inc. 29,397 1,394
296,791
Total Common Stocks
(Cost $5,813,735) 7,021,299
Temporary Cash Investments (1.2%)1
Money Market Fund (1.2%)3,4 Vanguard Market
Liquidity Fund,
1.223% 828,541 82,871
Face
Amount
($000)
U.S. Government and Agency Obligations (0.0%)
United States Treasury Bill,
0.980%, 10/5/17 450 4505 United States Treasury Bill,
1.033%–1.038%, 11/2/17 750 750
United States Treasury Bill,
1.101%, 2/22/18 900 8965 United States Treasury Bill,
1.169%, 3/22/18 500 497
2,593
Total Temporary Cash Investments
(Cost $85,458) 85,464
Total Investments (100.8%)
(Cost $5,899,193) 7,106,763
16

Derivative Financial Instruments Outstanding as of Period End
Futures Contracts
($000)
Value and
Number of Unrealized
Long (Short) Notional Appreciation
Expiration Contracts Amount (Depreciation)
Long Futures Contracts
E-mini Russell 2000 Index December 2017 241 17,989 393
E-mini S&P Mid-Cap 400 Index December 2017 54 9,697 419
812
Unrealized appreciation (depreciation) on open futures contracts is required to be treated as realized
gain (loss) for tax purposes.
Strategic Equity Fund
Amount
($000)
At September 30, 2017, net assets consisted of:
Amount
($000)
Other Assets and Liabilities (-0.8%)
Other Assets
Investment in Vanguard 430
Receivables for Investment Securities Sold 4,820
Receivables for Accrued Income 9,339
Receivables for Capital Shares Issued 3,766
Variation Margin Receivable—
Futures Contracts 12
Other Assets 247
Total Other Assets 18,614
Liabilities
Payables for Investment Securities
Purchased (5,781)
Collateral for Securities on Loan (59,775)
Payables for Capital Shares Redeemed (2,559)
Payables to Vanguard (6,426)
Other Liabilities (247)
Total Liabilities (74,788)
Net Assets (100%)
Applicable to 202,061,768 outstanding
$.001 par value shares of beneficial
interest (unlimited authorization) 7,050,589
Net Asset Value Per Share $34.89
Paid-in Capital 5,326,308
Undistributed Net Investment Income 62,713
Accumulated Net Realized Gains 453,186
Unrealized Appreciation (Depreciation)
Investment Securities 1,207,570
Futures Contracts 812
Net Assets 7,050,589
• See Note A in Notes to Financial Statements.
* Non-income-producing security.
^ Includes partial security positions on loan to broker-dealers. The total value of securities on loan is $56,182,000.
1 The fund invests a portion of its cash reserves in equity markets through the use of index futures contracts. After giving effect to futures investments, the fund’s effective common stock and temporary cash investment positions represent 100.0% and 0.8%, respectively, of net assets.
2 Security value determined using significant unobservable inputs.
3 Affiliated money market fund available only to Vanguard funds and certain trusts and accounts managed by Vanguard. Rate shown is the 7-day yield.
4 Includes $59,775,000 of collateral received for securities on loan.
5 Securities with a value of $1,247,000 have been segregated as initial margin for open futures contracts.
REIT—Real Estate Investment Trust.
See accompanying Notes, which are an integral part of the Financial Statements.
17

Year Ended
September 30, 2017
($000)
Investment Income
Income
Dividends 110,658
Interest 278
Securities Lending—Net 4,225
Total Income 115,161
Expenses
The Vanguard Group—Note B
Investment Advisory Services 2,231
Management and Administrative 8,523
Marketing and Distribution 1,003
Custodian Fees 86
Auditing Fees 36
Shareholders’ Reports and Proxy 271
Trustees’ Fees and Expenses 8
Total Expenses 12,158
Net Investment Income 103,003
Realized Net Gain (Loss)
Investment Securities Sold 484,146
Futures Contracts 4,271
Realized Net Gain (Loss) 488,417
Change in Unrealized Appreciation (Depreciation)
Investment Securities 508,394
Futures Contracts 559
Change in Unrealized Appreciation (Depreciation) 508,953
Net Increase (Decrease) in Net Assets Resulting from Operations 1,100,373
Statement of Operations
Strategic Equity Fund
See accompanying Notes, which are an integral part of the Financial Statements.
18

Statement of Changes in Net Assets
Strategic Equity Fund
See accompanying Notes, which are an integral part of the Financial Statements.
Year Ended September 30,
2017 2016
($000) ($000)
Increase (Decrease) in Net Assets
Operations
Net Investment Income 103,003 120,742
Realized Net Gain (Loss) 488,417 143,016
Change in Unrealized Appreciation (Depreciation) 508,953 325,286
Net Increase (Decrease) in Net Assets Resulting from Operations 1,100,373 589,044
Distributions
Net Investment Income (101,097) (93,924)
Realized Capital Gain1 (99,945) (549,653)
Total Distributions (201,042) (643,577)
Capital Share Transactions
Issued 1,014,707 714,159
Issued in Lieu of Cash Distributions 188,875 602,796
Redeemed (1,098,154) (956,042)
Net Increase (Decrease) from Capital Share Transactions 105,428 360,913
Total Increase (Decrease) 1,004,759 306,380
Net Assets
Beginning of Period 6,045,830 5,739,450
End of Period2 7,050,589 6,045,830
1 Includes fiscal 2017 and 2016 short-term gain distributions totaling $0 and $0, respectively. Short-term gain distributions are treated as ordinary income dividends for tax purposes.
2 Net Assets—End of Period includes undistributed (overdistributed) net investment income of $62,713,000 and $67,820,000.
19

For a Share Outstanding Year Ended September 30,
Throughout Each Period 2017 2016 2015 2014 2013
Net Asset Value, Beginning of Period $30.41 $30.82 $32.02 $27.34 $21.02
Investment Operations
Net Investment Income .5041 .624 .466 .361 .4262
Net Realized and Unrealized Gain (Loss)
on Investments 4.988 2.440 .207 4.679 6.244
Total from Investment Operations 5.492 3.064 .673 5.040 6.670
Distributions
Dividends from Net Investment Income (.509) (.507) (.354) (.360) (.350)
Distributions from Realized Capital Gains (.503) (2.967) (1.519) — —
Total Distributions (1.012) (3.474) (1.873) (.360) (.350)
Net Asset Value, End of Period $34.89 $30.41 $30.82 $32.02 $27.34
Total Return3 18.28% 10.62% 2.01% 18.53% 32.23%
Ratios/Supplemental Data
Net Assets, End of Period (Millions) $7,051 $6,046 $5,739 $5,392 $4,239
Ratio of Total Expenses to Average Net Assets 0.18% 0.18% 0.21% 0.27% 0.28%
Ratio of Net Investment Income to
Average Net Assets 1.53% 2.09% 1.41% 1.19% 1.75%2
Portfolio Turnover Rate 81% 74% 70% 60% 64%
1 Calculated based on average shares outstanding.
2 Net investment income per share and the ratio of net investment income to average net assets include $.043 and 0.18%, respectively, resulting from a special dividend received in connection with a merger between T-Mobile US Inc. and Metro PCS Communications Inc. in May 2013.
3 Total returns do not include account service fees that may have applied in the periods shown. Fund prospectuses provide information about any applicable account service fees.
Financial Highlights
See accompanying Notes, which are an integral part of the Financial Statements.
Strategic Equity Fund
20

Notes to Financial Statements
Strategic Equity Fund
Vanguard Strategic Equity Fund is registered under the Investment Company Act of 1940 as
an open-end investment company, or mutual fund.
A. The following significant accounting policies conform to generally accepted accounting
principles for U.S. investment companies. The fund consistently follows such policies in preparing
its financial statements.
1. Security Valuation: Securities are valued as of the close of trading on the New York Stock
Exchange (generally 4 p.m., Eastern time) on the valuation date. Equity securities are valued at
the latest quoted sales prices or official closing prices taken from the primary market in which
each security trades; such securities not traded on the valuation date are valued at the mean of the
latest quoted bid and asked prices. Securities for which market quotations are not readily available,
or whose values have been materially affected by events occurring before the fund’s pricing time
but after the close of the securities’ primary markets, are valued by methods deemed by the board
of trustees to represent fair value. Investments in Vanguard Market Liquidity Fund are valued at that
fund’s net asset value. Temporary cash investments are valued using the latest bid prices or using
valuations based on a matrix system (which considers such factors as security prices, yields,
maturities, and ratings), both as furnished by independent pricing services.
2. Futures Contracts: The fund uses index futures contracts to a limited extent, with the objective
of maintaining full exposure to the stock market while maintaining liquidity. The fund may purchase
or sell futures contracts to achieve a desired level of investment, whether to accommodate portfolio
turnover or cash flows from capital share transactions. The primary risks associated with the use
of futures contracts are imperfect correlation between changes in market values of stocks held by
the fund and the prices of futures contracts, and the possibility of an illiquid market. Counterparty
risk involving futures is mitigated because a regulated clearinghouse is the counterparty instead
of the clearing broker. To further mitigate counterparty risk, the fund trades futures contracts on
an exchange, monitors the financial strength of its clearing brokers and clearinghouse, and has
entered into clearing agreements with its clearing brokers. The clearinghouse imposes initial margin
requirements to secure the fund’s performance and requires daily settlement of variation margin
representing changes in the market value of each contract.
Futures contracts are valued at their quoted daily settlement prices. The notional amounts of
the contracts are not recorded in the Statement of Net Assets. Fluctuations in the value of the
contracts are recorded in the Statement of Net Assets as an asset (liability) and in the Statement
of Operations as unrealized appreciation (depreciation) until the contracts are closed, when they
are recorded as realized futures gains (losses).
During the year ended September 30, 2017, the fund’s average investments in long and short
futures contracts represented less than 1% and 0% of net assets, respectively, based on the
average of the notional amounts at each quarter-end during the period.
3. Federal Income Taxes: The fund intends to continue to qualify as a regulated investment
company and distribute all of its taxable income. Management has analyzed the fund’s tax positions
taken for all open federal income tax years (September 30, 2014–2017), and has concluded that no
provision for federal income tax is required in the fund’s financial statements.
4. Distributions: Distributions to shareholders are recorded on the ex-dividend date.
21

Strategic Equity Fund
5. Securities Lending: To earn additional income, the fund lends its securities to qualified
institutional borrowers. Security loans are subject to termination by the fund at any time, and
are required to be secured at all times by collateral in an amount at least equal to the market
value of securities loaned. Daily market fluctuations could cause the value of loaned securities
to be more or less than the value of the collateral received. When this occurs, the collateral
is adjusted and settled on the next business day. The fund further mitigates its counterparty
risk by entering into securities lending transactions only with a diverse group of prequalified
counterparties, monitoring their financial strength, and entering into master securities lending
agreements with its counterparties. The master securities lending agreements provide that, in
the event of a counterparty’s default (including bankruptcy), the fund may terminate any loans
with that borrower, determine the net amount owed, and sell or retain the collateral up to the
net amount owed to the fund; however, such actions may be subject to legal proceedings. While
collateral mitigates counterparty risk, in the event of a default, the fund may experience delays
and costs in recovering the securities loaned. The fund invests cash collateral received in Vanguard
Market Liquidity Fund, and records a liability in the Statement of Net Assets for the return of the
collateral, during the period the securities are on loan. Securities lending income represents fees
charged to borrowers plus income earned on invested cash collateral, less expenses associated
with the loan. During the term of the loan, the fund is entitled to all distributions made on or in
respect of the loaned securities.
6. Credit Facility: The fund and certain other funds managed by The Vanguard Group (“Vanguard”)
participate in a $3.1 billion committed credit facility provided by a syndicate of lenders pursuant to
a credit agreement that may be renewed annually; each fund is individually liable for its borrowings,
if any, under the credit facility. Borrowings may be utilized for temporary and emergency purposes,
and are subject to the fund’s regulatory and contractual borrowing restrictions. The participating
funds are charged administrative fees and an annual commitment fee of 0.10% of the undrawn
amount of the facility; these fees are allocated to the funds based on a method approved by the
fund’s board of trustees and included in Management and Administrative expenses on the fund’s
Statement of Operations. Any borrowings under this facility bear interest at a rate based upon the
higher of the one-month London Interbank Offered Rate, federal funds effective rate, or overnight
bank funding rate plus an agreed-upon spread.
The fund had no borrowings outstanding at September 30, 2017, or at any time during the period
then ended.
7. Other: Dividend income is recorded on the ex-dividend date. Interest income includes income
distributions received from Vanguard Market Liquidity Fund and is accrued daily. Premiums and
discounts on debt securities purchased are amortized and accreted, respectively, to interest income
over the lives of the respective securities. Security transactions are accounted for on the date
securities are bought or sold. Costs used to determine realized gains (losses) on the sale of
investment securities are those of the specific securities sold.
B. In accordance with the terms of a Funds’ Service Agreement (the “FSA”) between Vanguard
and the fund, Vanguard furnishes to the fund investment advisory, corporate management,
administrative, marketing, and distribution services at Vanguard’s cost of operations (as defined
by the FSA). These costs of operations are allocated to the fund based on methods and guidelines
approved by the board of trustees. Vanguard does not require reimbursement in the current period
22

Strategic Equity Fund
for certain costs of operations (such as deferred compensation/benefits and risk/insurance
costs); the fund’s liability for these costs of operations is included in Payables to Vanguard on
the Statement of Net Assets.
Upon the request of Vanguard, the fund may invest up to 0.40% of its net assets as capital in
Vanguard. At September 30, 2017, the fund had contributed to Vanguard capital in the amount
of $430,000, representing 0.01% of the fund’s net assets and 0.17% of Vanguard’s capitalization.
The fund’s trustees and officers are also directors and employees, respectively, of Vanguard.
C. Various inputs may be used to determine the value of the fund’s investments. These inputs
are summarized in three broad levels for financial statement purposes. The inputs or methodologies
used to value securities are not necessarily an indication of the risk associated with investing in
those securities.
Level 1—Quoted prices in active markets for identical securities.
Level 2—Other significant observable inputs (including quoted prices for similar securities, interest
rates, prepayment speeds, credit risk, etc.).
Level 3—Significant unobservable inputs (including the fund’s own assumptions used to determine
the fair value of investments). Any investments valued with significant unobservable inputs are
noted on the Statement of Net Assets.
The following table summarizes the market value of the fund’s investments as of September 30,
2017, based on the inputs used to value them:
Level 1 Level 2 Level 3
Investments ($000) ($000) ($000)
Common Stocks 7,015,264 — 6,035
Temporary Cash Investments 82,871 2,593 —
Futures Contracts—Assets1 12 — —
Total 7,098,147 2,593 6,035
1 Represents variation margin on the last day of the reporting period.
D. Distributions are determined on a tax basis and may differ from net investment income and
realized capital gains for financial reporting purposes. Differences may be permanent or temporary.
Permanent differences are reclassified among capital accounts in the financial statements to reflect
their tax character. Temporary differences arise when certain items of income, expense, gain, or
loss are recognized in different periods for financial statement and tax purposes. These differences
will reverse at some time in the future. Differences in classification may also result from the
treatment of short-term gains as ordinary income for tax purposes.
The fund used a tax accounting practice to treat a portion of the price of capital shares redeemed
during the year as distributions from net investment income and realized capital gains. Accordingly,
the fund has reclassified $7,241,000 from undistributed net investment income, and $34,354,000
from accumulated net realized gains to paid-in capital.
For tax purposes, at September 30, 2017, the fund had $97,283,000 of ordinary income and
$425,305,000 of long-term capital gains available for distribution.
23

Strategic Equity Fund
At September 30, 2017, the cost of investment securities for tax purposes was $5,899,193,000.
Net unrealized appreciation of investment securities for tax purposes was $1,207,570,000, consisting
of unrealized gains of $1,401,226,000 on securities that had risen in value since their purchase and
$193,656,000 in unrealized losses on securities that had fallen in value since their purchase.
E. During the year ended September 30, 2017, the fund purchased $5,445,163,000 of investment
securities and sold $5,418,976,000 of investment securities, other than temporary cash investments.
F. Capital shares issued and redeemed were:
Year Ended September 30,
2017 2016
Shares Shares
(000) (000)
Issued 30,675 24,472
Issued in Lieu of Cash Distributions 5,767 21,011
Redeemed (33,176) (32,942)
Net Increase (Decrease) in Shares Outstanding 3,266 12,541
G. Certain of the fund’s investments are in companies that are considered to be affiliated
companies of the fund because the fund owns more than 5% of the outstanding voting securities
of the company or the issuer is another member of The Vanguard Group. Transactions during the
period in securities of these companies were as follows:
Current Period Transactions
Sept. 30, Proceeds Sept. 30,
2016 from Realized Change in Capital Gain 2017
Market Purchases Securities Net Gain Unrealized Distributions Market
Value at Cost Sold (Loss) App. (Dep.) Income Received Value
($000) ($000) ($000) ($000) ($000) ($000) ($000) ($000)
Vanguard Market
Liquidity Fund 79,728 NA1 NA1 8 — 266 — 82,871
Wabash
National Corp. 47,721 1,890 21,265 7,044 20,885 519 — NA2
Total 127,449 — — 7,052 20,885 785 — 82,871
1 Not applicable—purchases and sales are for temporary cash investment purposes.
2 Not applicable—at September 30, 2017, the security was still held, but the issuer was no longer an affiliated company of the fund.
H. Management has determined that no material events or transactions occurred subsequent to
September 30, 2017, that would require recognition or disclosure in these financial statements.
24

To the Board of Trustees of Vanguard Horizon Funds and the Shareholders of Vanguard Strategic
Equity Fund
In our opinion, the accompanying statement of net assets and the related statements of operations
and of changes in net assets and the financial highlights present fairly, in all material respects, the
financial position of Vanguard Strategic Equity Fund (constituting a separate portfolio of Vanguard
Horizon Funds, hereafter referred to as the “Fund”) as of September 30, 2017, the results of its
operations for the year then ended, the changes in its net assets for each of the two years in the
period then ended and the financial highlights for each of the five years in the period then ended,
in conformity with accounting principles generally accepted in the United States of America. These
financial statements and financial highlights (hereafter referred to as “financial statements”) are
the responsibility of the Fund’s management. Our responsibility is to express an opinion on these
financial statements based on our audits. We conducted our audits of these financial statements in
accordance with the standards of the Public Company Accounting Oversight Board (United States).
Those standards require that we plan and perform the audit to obtain reasonable assurance about
whether the financial statements are free of material misstatement. An audit includes examining, on
a test basis, evidence supporting the amounts and disclosures in the financial statements, assessing
the accounting principles used and significant estimates made by management, and evaluating the
overall financial statement presentation. We believe that our audits, which included confirmation
of securities as of September 30, 2017 by correspondence with the custodian and brokers and by
agreement to the underlying ownership records of the transfer agent, provide a reasonable basis
for our opinion.
/s/PricewaterhouseCoopers LLP
Philadelphia, Pennsylvania
November 13, 2017
Report of Independent Registered Public Accounting Firm
Special 2017 tax information (unaudited) for Vanguard Strategic Equity Fund
This information for the fiscal year ended September 30, 2017, is included pursuant to provisions
of the Internal Revenue Code.
The fund distributed $132,128,000 as capital gain dividends (20% rate gain distributions) to
shareholders during the fiscal year.
The fund distributed $76,874,000 of qualified dividend income to shareholders during the fiscal year.
For corporate shareholders, 53.7% of investment income (dividend income plus short-term gains,
if any) qualifies for the dividends-received deduction.
25
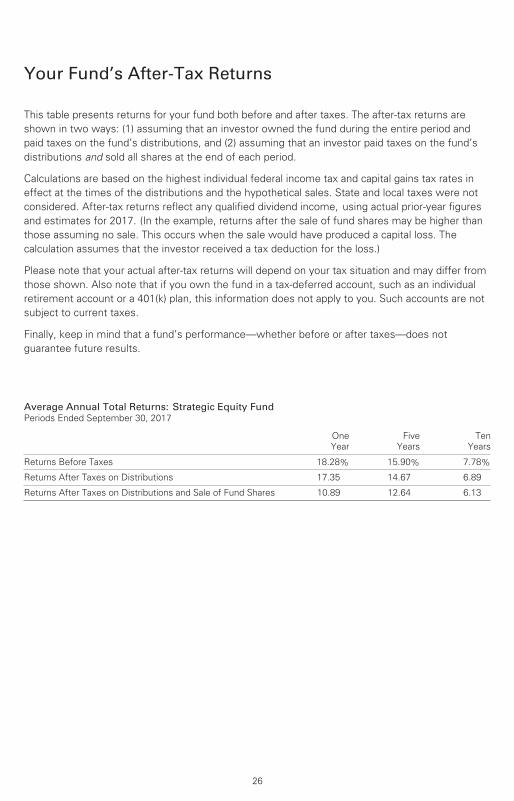
Your Fund’s After-Tax Returns
26
This table presents returns for your fund both before and after taxes. The after-tax returns are
shown in two ways: (1) assuming that an investor owned the fund during the entire period and
paid taxes on the fund’s distributions, and (2) assuming that an investor paid taxes on the fund’s
distributions and sold all shares at the end of each period.
Calculations are based on the highest individual federal income tax and capital gains tax rates in
effect at the times of the distributions and the hypothetical sales. State and local taxes were not
considered. After-tax returns reflect any qualified dividend income, using actual prior-year figures
and estimates for 2017. (In the example, returns after the sale of fund shares may be higher than
those assuming no sale. This occurs when the sale would have produced a capital loss. The
calculation assumes that the investor received a tax deduction for the loss.)
Please note that your actual after-tax returns will depend on your tax situation and may differ from
those shown. Also note that if you own the fund in a tax-deferred account, such as an individual
retirement account or a 401(k) plan, this information does not apply to you. Such accounts are not
subject to current taxes.
Finally, keep in mind that a fund’s performance—whether before or after taxes—does not
guarantee future results.
Average Annual Total Returns: Strategic Equity Fund Periods Ended September 30, 2017
One
Year
Five
Years
Ten
Years
Returns Before Taxes 18.28% 15.90% 7.78%
Returns After Taxes on Distributions 17.35 14.67 6.89
Returns After Taxes on Distributions and Sale of Fund Shares 10.89 12.64 6.13

About Your Fund’s Expenses
27
As a shareholder of the fund, you incur ongoing costs, which include costs for portfolio management,
administrative services, and shareholder reports (like this one), among others. Operating expenses,
which are deducted from a fund’s gross income, directly reduce the investment return of the fund.
A fund’s expenses are expressed as a percentage of its average net assets. This figure is known as
the expense ratio. The following examples are intended to help you understand the ongoing costs (in
dollars) of investing in your fund and to compare these costs with those of other mutual funds. The
examples are based on an investment of $1,000 made at the beginning of the period shown and held
for the entire period.
The accompanying table illustrates your fund’s costs in two ways:
• Based on actual fund return. This section helps you to estimate the actual expenses that you
paid over the period. The ”Ending Account Value“ shown is derived from the fund‘s actual return,
and the third column shows the dollar amount that would have been paid by an investor who started
with $1,000 in the fund. You may use the information here, together with the amount you invested,
to estimate the expenses that you paid over the period.
To do so, simply divide your account value by $1,000 (for example, an $8,600 account value divided
by $1,000 = 8.6), then multiply the result by the number given for your fund under the heading
”Expenses Paid During Period.“
• Based on hypothetical 5% yearly return. This section is intended to help you compare your
fund‘s costs with those of other mutual funds. It assumes that the fund had a yearly return of 5%
before expenses, but that the expense ratio is unchanged. In this case—because the return used is
not the fund’s actual return—the results do not apply to your investment. The example is useful in
making comparisons because the Securities and Exchange Commission requires all mutual funds to
calculate expenses based on a 5% return. You can assess your fund’s costs by comparing this
hypothetical example with the hypothetical examples that appear in shareholder reports of other
funds.
Note that the expenses shown in the table are meant to highlight and help you compare ongoingcosts only and do not reflect transaction costs incurred by the fund for buying and sellingsecurities. Further, the expenses do not include any purchase, redemption, or account servicefees described in the fund prospectus. If such fees were applied to your account, your costswould be higher. Your fund does not carry a “sales load.”
The calculations assume no shares were bought or sold during the period. Your actual costs may
have been higher or lower, depending on the amount of your investment and the timing of any
purchases or redemptions.
You can find more information about the fund’s expenses, including annual expense ratios, in the
Financial Statements section of this report. For additional information on operating expenses and
other shareholder costs, please refer to your fund’s current prospectus.

28
Six Months Ended September 30, 2017
Strategic Equity Fund
Beginning
Account Value
3/31/2017
Ending
Account Value
9/30/2017
Expenses
Paid During
Period
Based on Actual Fund Return $1,000.00 $1,046.18 $0.92
Based on Hypothetical 5% Yearly Return 1,000.00 1,024.17 0.91
The calculations are based on expenses incurred in the most recent six-month period. The fund’s annualized six-month expense ratio forthat period is 0.18%. The dollar amounts shown as “Expenses Paid” are equal to the annualized expense ratio multiplied by the averageaccount value over the period, multiplied by the number of days in the most recent six-month period, then divided by the number of days inthe most recent 12-month period (183/365).

Glossary
29
30-Day SEC Yield. A fund’s 30-day SEC yield is derived using a formula specified by the U.S.
Securities and Exchange Commission. Under the formula, data related to the fund’s security
holdings in the previous 30 days are used to calculate the fund’s hypothetical net income for that
period, which is then annualized and divided by the fund’s estimated average net assets over the
calculation period. For the purposes of this calculation, a security’s income is based on its current
market yield to maturity (for bonds), its actual income (for asset-backed securities), or its
projected dividend yield (for stocks). Because the SEC yield represents hypothetical annualized
income, it will differ—at times significantly—from the fund’s actual experience. As a result, the
fund’s income distributions may be higher or lower than implied by the SEC yield.
Beta. A measure of the magnitude of a fund’s past share-price fluctuations in relation to the ups
and downs of a given market index. The index is assigned a beta of 1.00. Compared with a given
index, a fund with a beta of 1.20 typically would have seen its share price rise or fall by 12%
when the index rose or fell by 10%. For this report, beta is based on returns over the past 36
months for both the fund and the index. Note that a fund’s beta should be reviewed in conjunction
with its R-squared (see definition). The lower the R-squared, the less correlation there is between
the fund and the index, and the less reliable beta is as an indicator of volatility.
Dividend Yield. Dividend income earned by stocks, expressed as a percentage of the aggregate
market value (or of net asset value, for a fund). The yield is determined by dividing the amount of
the annual dividends by the aggregate value (or net asset value) at the end of the period. For a
fund, the dividend yield is based solely on stock holdings and does not include any income
produced by other investments.
Earnings Growth Rate. The average annual rate of growth in earnings over the past five years for
the stocks now in a fund.
Equity Exposure. A measure that reflects a fund’s investments in stocks and stock futures. Any
holdings in short-term reserves are excluded.
Expense Ratio. A fund’s total annual operating expenses expressed as a percentage of the fund’s
average net assets. The expense ratio includes management and administrative expenses, but
does not include the transaction costs of buying and selling portfolio securities.
Foreign Holdings. The percentage of a fund represented by securities or depositary receipts of
companies based outside the United States.
Inception Date. The date on which the assets of a fund (or one of its share classes) are first
invested in accordance with the fund’s investment objective. For funds with a subscription period,
the inception date is the day after that period ends. Investment performance is measured from
the inception date.
Median Market Cap. An indicator of the size of companies in which a fund invests; the midpoint
of market capitalization (market price x shares outstanding) of a fund’s stocks, weighted by the
proportion of the fund’s assets invested in each stock. Stocks representing half of the fund’s
assets have market capitalizations above the median, and the rest are below it.
Price/Book Ratio. The share price of a stock divided by its net worth, or book value, per share.
For a fund, the weighted average price/book ratio of the stocks it holds.
30
Price/Earnings Ratio. The ratio of a stock’s current price to its per-share earnings over the past
year. For a fund, the weighted average P/E of the stocks it holds. P/E is an indicator of market
expectations about corporate prospects; the higher the P/E, the greater the expectations for a
company’s future growth.
R-Squared. A measure of how much of a fund’s past returns can be explained by the returns
from the market in general, as measured by a given index. If a fund’s total returns were precisely
synchronized with an index’s returns, its R-squared would be 1.00. If the fund’s returns bore no
relationship to the index’s returns, its R-squared would be 0. For this report, R-squared is based
on returns over the past 36 months for both the fund and the index.
Return on Equity. The annual average rate of return generated by a company during the past five
years for each dollar of shareholder’s equity (net income divided by shareholder’s equity). For a
fund, the weighted average return on equity for the companies whose stocks it holds.
Short-Term Reserves. The percentage of a fund invested in highly liquid, short-term securities
that can be readily converted to cash.
Turnover Rate. An indication of the fund’s trading activity. Funds with high turnover rates incur
higher transaction costs and may be more likely to distribute capital gains (which may be taxable
to investors). The turnover rate excludes in-kind transactions, which have minimal impact on
costs.

The Global Industry Classification Standard (“GICS”) was developed by and is the exclusive property and a service mark
of MSCI Inc. (“MSCI”) and Standard and Poor’s, a division of McGraw-Hill Companies, Inc. (“S&P”), and is licensed for use
by Vanguard. Neither MSCI, S&P nor any third party involved in making or compiling the GICS or any GICS classification
makes any express or implied warranties or representations with respect to such standard or classification (or the results
to be obtained by the use thereof), and all such parties hereby expressly disclaim all warranties of originality, accuracy,
completeness, merchantability or fitness for a particular purpose with respect to any such standard or classification.
Without limiting any of the foregoing, in no event shall MSCI, S&P, any of its affiliates or any third party involved in
making or compiling the GICS or any GICS classification have any liability for any direct, indirect, special, punitive,
consequential or any other damages (including lost profits) even if notified of the possibility of such damages.
31
The People Who Govern Your Fund
The trustees of your mutual fund are there to see that the fund is operated and managed in your
best interests since, as a shareholder, you are a part owner of the fund. Your fund’s trustees also
serve on the board of directors of The Vanguard Group, Inc., which is owned by the Vanguard
funds and provides services to them on an at-cost basis.
A majority of Vanguard’s board members are independent, meaning that they have no affiliation
with Vanguard or the funds they oversee, apart from the sizable personal investments they have
made as private individuals. The independent board members have distinguished backgrounds
in business, academia, and public service. Each of the trustees and executive officers oversees
198 Vanguard funds.
Information for each trustee and executive officer of the fund appears below. The mailing address
of the trustees and officers is P.O. Box 876, Valley Forge, PA 19482. More information about the
trustees is in the Statement of Additional Information, which can be obtained, without charge,
by contacting Vanguard at 800-662-7447, or online at vanguard.com.
Interested Trustee1
F. William McNabb III
Born 1957. Trustee Since July 2009. Chairman
of the Board. Principal Occupation(s) During the
Past Five Years and Other Experience: Chairman
of the Board of The Vanguard Group, Inc., and
of each of the investment companies served by
The Vanguard Group, since January 2010; Chief
Executive Officer and Director of The Vanguard
Group and President and Chief Executive Officer
of each of the investment companies served by
The Vanguard Group, since 2008; Director of
Vanguard Marketing Corporation; President of
The Vanguard Group (2008–2017); Managing
Director of The Vanguard Group (1995–2008).
Independent Trustees
Emerson U. Fullwood
Born 1948. Trustee Since January 2008. Principal
Occupation(s) During the Past Five Years and Other
Experience: Executive Chief Staff and Marketing
Officer for North America and Corporate Vice
President (retired 2008) of Xerox Corporation
(document manage ment products and services);
Executive in Residence and 2009–2010
Distinguished Minett Professor at the Rochester
Institute of Technology; Lead Director of SPX
FLOW, Inc. (multi-industry manufacturing);
Director of the United Way of Rochester, the
University of Rochester Medical Center, Monroe
Community College Foundation, North Carolina
A&T University, and Roberts Wesleyan College;
Trustee of the University of Rochester.
Rajiv L. Gupta
Born 1945. Trustee Since December 2001.2
Principal Occupation(s) During the Past Five
Years and Other Experience: Chairman and
Chief Executive Officer (retired 2009) and
President (2006–2008) of Rohm and Haas Co.
(chemicals); Director of Arconic Inc. (diversified
manufacturer), HP Inc. (printer and personal
computer manufacturing), and Delphi Automotive
plc (automotive components); Senior Advisor at
New Mountain Capital.
Amy Gutmann
Born 1949. Trustee Since June 2006. Principal
Occupation(s) During the Past Five Years and
Other Experience: President of the University
of Pennsylvania; Christopher H. Browne
1 Mr. McNabb is considered an “interested person,” as defined in the Investment Company Act of 1940, because he is an officer of the Vanguard funds.
2 December 2002 for Vanguard Equity Income Fund, the Vanguard Municipal Bond Funds, and the Vanguard State Tax-Exempt Funds.

Distinguished Professor of Political Science,
School of Arts and Sciences, and Professor
of Communication, Annenberg School for
Communication, with secondary faculty appoint-
ments in the Department of Philosophy, School
of Arts and Sciences, and at the Graduate School
of Education, University of Pennsylvania; Trustee
of the National Constitution Center.
JoAnn Heffernan Heisen
Born 1950. Trustee Since July 1998. Principal
Occupation(s) During the Past Five Years and
Other Experience: Corporate Vice President
and Member of the Executive Committee
(1997–2008), Chief Global Diversity Officer
(retired 2008), Vice President and Chief
Information Officer (1997–2006), Controller
(1995–1997), Treasurer (1991–1995), and
Assistant Treasurer (1989–1991) of Johnson
& Johnson (pharmaceuticals/medical devices/
consumer products); Director of Skytop Lodge
Corporation (hotels) and the Robert Wood
Johnson Foundation; Member of the Advisory
Board of the Institute for Women’s Leadership
at Rutgers University.
F. Joseph Loughrey
Born 1949. Trustee Since October 2009.
Principal Occupation(s) During the Past Five
Years and Other Experience: President and Chief
Operating Officer (retired 2009) of Cummins Inc.
(industrial machinery); Chairman of the Board of
Hillenbrand, Inc. (specialized consumer services),
Oxfam America, and the Lumina Foundation for
Education; Director of the V Foundation for
Cancer Research; Member of the Advisory
Council for the College of Arts and Letters
and Chair of the Advisory Board to the Kellogg
Institute for International Studies, both at the
University of Notre Dame.
Mark Loughridge
Born 1953. Trustee Since March 2012. Principal
Occupation(s) During the Past Five Years and
Other Experience: Senior Vice President and
Chief Financial Officer (retired 2013) at IBM
(information technology services); Fiduciary
Member of IBM’s Retirement Plan Committee
(2004–2013); Member of the Council on
Chicago Booth.
Scott C. Malpass
Born 1962. Trustee Since March 2012. Principal
Occupation(s) During the Past Five Years and
Other Experience: Chief Investment Officer and
Vice President at the University of Notre Dame;
Assistant Professor of Finance at the Mendoza
College of Business at Notre Dame; Member of
the Notre Dame 403(b) Investment Committee,
the Board of Advisors for Spruceview Capital
Partners, the Board of Catholic Investment
Services, Inc. (investment advisor), and the
Board of Superintendence of the Institute for
the Works of Religion; Chairman of the Board of
TIFF Advisory Services, Inc. (investment advisor).
André F. Perold
Born 1952. Trustee Since December 2004.
Principal Occupation(s) During the Past Five Years
and Other Experience: George Gund Professor of
Finance and Banking, Emeritus at the Harvard
Business School (retired 2011); Chief Investment
Officer and Co-Managing Partner of HighVista
Strategies LLC (private investment firm);
Overseer of the Museum of Fine Arts Boston.
Peter F. Volanakis
Born 1955. Trustee Since July 2009. Principal
Occupation(s) During the Past Five Years and
Other Experience: President and Chief Operating
Officer (retired 2010) of Corning Incorporated
(communications equipment); Chairman of the
Board of Trustees of Colby-Sawyer College;
Member of the Board of Hypertherm, Inc.
(industrial cutting systems, software, and
consumables).
Executive Officers
Glenn Booraem
Born 1967. Investment Stewardship Officer Since
February 2017. Principal Occupation(s) During the
Past Five Years and Other Experience: Principal of
The Vanguard Group, Inc.; Treasurer (2015–2017),
Controller (2010–2015), and Assistant Controller
(2001–2010) of each of the investment companies
served by The Vanguard Group.
Thomas J. Higgins
Born 1957. Chief Financial Officer Since
September 2008. Principal Occupation(s) During
the Past Five Years and Other Experience: Principal
of The Vanguard Group, Inc.; Chief Financial Officer
of each of the investment companies served by
The Vanguard Group; Treasurer of each of the
investment companies served by The Vanguard
Group (1998–2008).
Peter Mahoney
Born 1974. Controller Since May 2015. Principal
Occupation(s) During the Past Five Years and
Other Experience: Principal of The Vanguard
Group, Inc.; Controller of each of the investment
companies served by The Vanguard Group; Head
of International Fund Services at The Vanguard
Group (2008–2014).
Anne E. Robinson
Born 1970. Secretary Since September 2016.
Principal Occupation(s) During the Past Five Years
and Other Experience: Managing Director of The
Vanguard Group, Inc.; General Counsel of The
Vanguard Group; Secretary of The Vanguard Group
and of each of the investment companies served
by The Vanguard Group; Director and Senior Vice
President of Vanguard Marketing Corporation;
Managing Director and General Counsel of Global
Cards and Consumer Services at Citigroup
(2014–2016); Counsel at American Express
(2003–2014).
Michael Rollings
Born 1963. Treasurer Since February 2017.
Principal Occupation(s) During the Past Five
Years and Other Experience: Managing Director
of The Vanguard Group, Inc.; Treasurer of each
of the investment companies served by The
Vanguard Group; Director of Vanguard Marketing
Corporation; Executive Vice President and Chief
Financial Officer of MassMutual Financial Group
(2006–2016).
Vanguard Senior Management Team
Mortimer J. Buckley Chris D. McIsaac
Gregory Davis James M. Norris
John James Thomas M. Rampulla
Martha G. King Karin A. Risi
John T. Marcante
Chairman Emeritus and Senior Advisor
John J. Brennan
Chairman, 1996–2009
Chief Executive Officer and President, 1996–2008
Founder
John C. Bogle
Chairman and Chief Executive Officer, 1974–1996
P.O. Box 2600
Valley Forge, PA 19482-2600
Connect with Vanguard® > vanguard.com
Fund Information > 800-662-7447
Direct Investor Account Services > 800-662-2739
Institutional Investor Services > 800-523-1036
Text Telephone for PeopleWho Are Deaf or Hard of Hearing > 800-749-7273
This material may be used in conjunctionwith the offering of shares of any Vanguardfund only if preceded or accompanied bythe fund’s current prospectus.
All comparative mutual fund data are from Lipper, aThomson Reuters Company, or Morningstar, Inc., unlessotherwise noted.
You can obtain a free copy of Vanguard’s proxy votingguidelines by visiting vanguard.com/proxyreporting or bycalling Vanguard at 800-662-2739. The guidelines arealso available from the SEC’s website, sec.gov. Inaddition, you may obtain a free report on how your fundvoted the proxies for securities it owned during the 12months ended June 30. To get the report, visit eithervanguard.com/proxyreporting or sec.gov.
You can review and copy information about your fund atthe SEC’s Public Reference Room in Washington, D.C. Tofind out more about this public service, call the SEC at202-551-8090. Information about your fund is alsoavailable on the SEC’s website, and you can receivecopies of this information, for a fee, by sending arequest in either of two ways: via email addressed [email protected] or via regular mail addressed to thePublic Reference Section, Securities and ExchangeCommission, Washington, DC 20549-1520.
© 2017 The Vanguard Group, Inc.All rights reserved.Vanguard Marketing Corporation, Distributor.
Q1140 112017