vanguard primecap core fund · incoming ship, a lighthouse offers a beacon and safe path to shore....
TRANSCRIPT

Vanguard PRIMECAP Core Fund
Semiannual Report | March 31, 2018

Contents
Please note: The opinions expressed in this report are just that—informed opinions. They should not be considered promisesor advice. Also, please keep in mind that the information and opinions cover the period through the date on the front of thisreport. Of course, the risks of investing in your fund are spelled out in the prospectus.
See the Glossary for definitions of investment terms used in this report.About the cover: Nautical images have been part of Vanguard’s rich heritage since its start in 1975. For anincoming ship, a lighthouse offers a beacon and safe path to shore. You can similarly depend on Vanguard to putyou first––and light the way––as you strive to meet your financial goals. Our client focus and low costs,stemming from our unique ownership structure, assure that your interests are paramount.
Vanguard’s Principles for Investing Success
We want to give you the best chance of investment success. Theseprinciples, grounded in Vanguard’s research and experience, can put you onthe right path.
Goals. Create clear, appropriate investment goals.
Balance. Develop a suitable asset allocation using broadly diversified funds.
Cost. Minimize cost.
Discipline. Maintain perspective and long-term discipline.
A single theme unites these principles: Focus on the things you can control.We believe there is no wiser course for any investor.
Your Fund’s Performance at a Glance. . . . . . . . . . . . . . . . . . 1
CEO’s Perspective. . . . . . . . . . . . . . . . . . . . . . . . . . . . . . . . . 2
Advisor’s Report. . . . . . . . . . . . . . . . . . . . . . . . . . . . . . . . . . . 4
Results of Proxy Voting. . . . . . . . . . . . . . . . . . . . . . . . . . . . . 7
Fund Profile. . . . . . . . . . . . . . . . . . . . . . . . . . . . . . . . . . . . . . .8
Performance Summary. . . . . . . . . . . . . . . . . . . . . . . . . . . . . .9
Financial Statements. . . . . . . . . . . . . . . . . . . . . . . . . . . . . . 10
About Your Fund’s Expenses. . . . . . . . . . . . . . . . . . . . . . . . 20
Trustees Approve Advisory Arrangement. . . . . . . . . . . . . . 22
Glossary. . . . . . . . . . . . . . . . . . . . . . . . . . . . . . . . . . . . . . . . 24

Your Fund’s Performance at a Glance
1
Total Returns: Six Months Ended March 31, 2018
TotalReturns
Vanguard PRIMECAP Core Fund 6.13%
MSCI US Prime Market 750 Index 5.98
Multi-Cap Core Funds Average 4.96
Multi-Cap Core Funds Average: Derived from data provided by Lipper, a Thomson Reuters Company.
Expense RatiosYour Fund Compared With Its Peer Group
Fund
Peer Group
Average
PRIMECAP Core Fund 0.46% 1.11%
The fund expense ratio shown is from the prospectus dated January 25, 2018, and represents estimated costs for the current fiscal year.For the six months ended March 31, 2018, the fund’s annualized expense ratio was 0.46%. The peer-group expense ratio is derived fromdata provided by Lipper, a Thomson Reuters Company, and captures information through year-end 2017.
Peer group: Multi-Cap Core Funds.
• For the six months ended March 31, 2018, Vanguard PRIMECAP Core Fund returned
6.13%, exceeding the 5.98% return of its benchmark and the 4.96% average return of its
multi-capitalization core fund peers.
• The broad stock market posted strong returns over the period’s first four months as
corp orate earnings generally exceeded expectations and investors were willing to pay
more for those earnings. Stocks declined in February and March as inflation concerns
increased.
• PRIMECAP Management Company, the fund’s advisor, traditionally invests most
heavily in the information technology and health care sectors. Technology, which advanced
about 15%, contributed most to the fund’s results. Health care, which declined about 3%,
detracted most.
• The fund’s industrial stocks also performed well, while its consumer discretionary
stocks lagged those in the benchmark.

Dear Shareholder,
I feel extremely fortunate to have the
chance to lead a company filled with
people who come to work every day
passionate about Vanguard’s core
purpose: to take a stand for all investors,
to treat them fairly, and to give them the
best chance for investment success.
When I joined Vanguard in 1991,
I found a mission-driven team focused
on improving lives—helping people retire
more comfortably, put their children
through college, and achieve financial
security. I also found a company with
purpose in an industry ripe for
improvement.
It was clear, even early in my career,
that the cards were stacked against most
investors. Hidden fees, performance-
chasing, and poor advice were relentlessly
eroding investors’ dreams.
We knew Vanguard could be different
and, as a result, could make a real
difference. We have lowered the costs
of investing for our shareholders
significantly. And we’re proud of the
performance of our funds.
Vanguard is built for Vanguard
investors—we focus solely on you,
our fund shareholders. Everything we
do is designed to give our clients the
best chance for investment success.
In my role as CEO, I’ll keep this priority
CEO’s Perspective
Tim Buckley
President and Chief Executive Officer
2

front and center. We’re proud of what
we’ve achieved, but we’re even more
excited about what’s to come.
Steady, time-tested guidance
Our guidance for investors, as always, is
to stay the course, tune out the hyperbolic
headlines, and focus on your goals and
what you can control, such as costs and
how much you save. This time-tested
advice has served our clients well over
the decades.
Regardless of how the markets perform
in the short term, I’m incredibly optimistic
about the future for our investors. We
have a dedicated team serving you,
and we will never stop striving to make
Vanguard the best place for you to
invest through our high-quality funds
and services, advice and guidance
to help you meet your financial goals,
and an experience that makes you
feel good about entrusting us with
your hard-earned savings.
Thank you for your continued loyalty.
Sincerely,
Mortimer J. Buckley
President and Chief Executive Officer
April 13, 2018
Market Barometer
Total Returns
Periods Ended March 31, 2018
Six One Five Years
Months Year (Annualized)
Stocks
Russell 1000 Index (Large-caps) 5.85% 13.98% 13.17%
Russell 2000 Index (Small-caps) 3.25 11.79 11.47
Russell 3000 Index (Broad U.S. market) 5.65 13.81 13.03
FTSE All-World ex US Index (International) 4.03 16.45 6.30
Bonds
Bloomberg Barclays U.S. Aggregate Bond Index
(Broad taxable market) -1.08% 1.20% 1.82%
Bloomberg Barclays Municipal Bond Index
(Broad tax-exempt market) -0.37 2.66 2.73
Citigroup Three-Month U.S. Treasury Bill Index 0.63 1.07 0.30
CPI
Consumer Price Index 1.11% 2.36% 1.40%
3
Advisor’s Report
4
For the six months ended March 31, 2018,
Vanguard PRIMECAP Core Fund returned
6.13%, slightly exceeding the 5.98% return
of the fund’s benchmark, the MSCI US
Prime Market 750 Index; the 4.96% average
return of the fund’s multi-capitalization core
fund competitors; and the 5.84% return
of the Standard & Poor’s 500 Index, which
serves as a proxy for the broad market in
the attribution discussion that follows.
Relative to the S&P 500 Index, sector
allocation, particularly the fund’s overweight
position in information technology, helped
relative results. Stock selection detracted
from relative results, as underperformance
in consumer discretionary and health care
more than offset strong stock selection in
industrials and information technology.
The investment environmentThe economy finished 2017 on solid footing.
Tax legislation passed in December, cata-
lyzing an optimism not seen since before
the 2008–2009 recession. Consumer
confidence climbed to its highest level in
a decade, and consumption increased at
a robust pace in the fourth quarter, buoyed
by continued gains in employment levels
and household net worth. Industrial
production and business investment
also increased at a solid pace. Treasury
yields rose but remained accommodative,
and the U.S. dollar weakened on foreign
economies’ growth and central bank
commentary. The U.S. stock market reacted
favorably to these developments, climbing
steadily to record highs in late January,
with historically low levels of volatility.
This relentless ascent eventually hit a snag,
largely in the form of potential regulatory
scrutiny of key technology companies and
combative trade rhetoric. Underlying eco-
nomic measures remained robust through
March-end, but volatility spiked and the U.S.
equity market corrected lower, finishing the
period 8% below January highs.
Despite the late retreat, cyclicals out-
performed during the period, with the
consumer discretionary and information
technology sectors each returning roughly
13%. Within these sectors, so-called
FAANG stocks (Facebook, Amazon, Apple,
Netflix, and Google) and their brethren
continued their outperformance streak.
More defensive sectors such as consumer
staples, telecommunication services, and
utilities lost absolute ground, as did energy
and real estate.
Portfolio updateSector allocation helped the fund’s relative
results. The portfolio maintained its sig -
nificant overweight position in information
technology, health care, and industrial stocks
(72% of ending assets versus 48% in the
benchmark). The portfolio has meaningful
underweight positions in consumer staples
and energy (1% versus 14%) and limited
exposure to materials, telecommunication
services, real estate, and utilities (2% versus
11%). The fund is also modestly under-
weighted in financials (10% versus 15%);
it maintains in-line exposure to consumer
discretionary (12%). The fund’s relative
results benefited most from its overweight
allocation to information technology and

5
underweights in consumer staples and
energy. This more than offset the negative
impact from its health care overweight.
The fund’s information technology holdings
contributed strongly, returning 15%, ahead
of the benchmark’s 13%. The fund main-
tains significant holdings in semiconductor
and software stocks. Key positive per-
formers included Texas Instruments (+17%)
and NVIDIA (+30%) in semiconductors;
software company Micro Focus Inter-
national (–56%) provided a partial offset.
Storage company NetApp (+42%) also
contributed meaningfully to outperformance.
The fund’s health care holdings detracted.
The portfolio returned –3% against a
roughly flat benchmark return. Biotech-
nology and pharmaceutical stocks, where
our holdings are concentrated, under-
performed health care providers and
services, which benefited from the tax
legislation and speculation about mergers
and acquisitions. During the period,
Biogen’s early 2017 spinoff, Bioverativ,
was acquired by Sanofi, generating an
84% return. However, our large position
in former parent Biogen (–13%) under-
performed the benchmark. Biotechnology
company Amgen (–7%) and pharma-
ceutical companies Eli Lilly (–8%) and
Roche (–7%) also contributed to sector
underperformance.
The fund’s industrial holdings contributed
to relative performance. Effective stock
selection in the sector contributed to relative
performance. The fund benefited from
owning Airbus (+21%) and avoiding General
Electric (–43%). Airlines, a significant
over weight position for the fund, saw
mixed results, as Delta Air Lines, United
Continental Holdings, and American Airlines
out-performed, while Southwest Airlines
underperformed.
In consumer discretionary, disappointing
stock selection led to underperformance.
Sony (+29%) was a positive contributor,
but the fund’s ownership of CarMax (–18%)
and its limited exposure to surging Amazon
(+51%) and Netflix (+63%) detracted from
relative results.
As of March 31, 2018, the fund’s top ten
holdings represented 30% of assets.
Advisor perspectivesThe current bull market recently eclipsed
the nine-year mark, and yet there are
reasons for late-cycle optimism. Earnings
growth in 2018 is expected to be robust,
driven in part by the substantial corporate
tax cut that is part of the new tax law.
Valuation is not excessive; following its
late-period correction, the S&P 500 Index
trades at a forward price/earnings multiple
(16.4 times) roughly in line with its 25-year
historical average (16.1 times). We remain
constructive on the U.S. economy, with
2.9% real GDP growth in last year’s fourth
quarter and comparable growth expected
during 2018. U.S. equities thus continue
to be attractive, particularly relative to the
10-year Treasury yield of 2.7% that was
briefly hit in January.

6
There are, as always, reasons for concern.
Chief among these is the heightened
possibility of a trade war. Legitimate U.S.
trade grievances certainly exist, and it
remains unclear whether President Trump’s
aggressive posturing is more bark or bite.
But the actions suggested by the President’s
threats of tariffs against various Chinese
imports are fraught with legal, economic,
and geopolitical risks. We remain hopeful
that this protectionist impulse will fade.
Importantly, many of our holdings have
opportunity sets that do not rely on near-
term macroeconomic trends. Our largest
sector positions are in information tech-
nology (32%) and health care (20%), and
in both sectors the forward P/E ratio is
below its 20-year average despite what we
view as strong secular growth trajectories.
ConclusionAs bottom-up stock pickers, we spend our
time searching for opportunities to invest
in stocks with long-term prospects we find
to be materially better than market prices
imply. We believe, as scientist and Nobel
laureate Alexander Fleming said, “It is the
lone worker who makes the first advance
in a subject; the details may be worked out
by a team, but the prime idea is due to the
enterprise, thought, and perception of an
individual.” This approach to stock selection,
which drives portfolio composition and, thus,
sector allocation, often results in portfolios
that bear little resemblance to market
indexes, creating the possibility for lengthy
periods of relative outperformance or under -
performance. We nonetheless believe that
this approach can generate superior results
for shareholders over the long term.
PRIMECAP Management Company
April 23, 2018

Results of Proxy Voting
At a special meeting of shareholders on November 15, 2017, fund shareholders approved the
following proposals:
Proposal 1—Elect trustees for the fund.*
The individuals listed in the table below were elected as trustees for the fund. All trustees with the
exception of Ms. Mulligan, Ms. Raskin, and Mr. Buckley (each of whom already serves as a director
of The Vanguard Group, Inc.) served as trustees to the funds prior to the shareholder meeting.
Percentage
Trustee For Withheld For
Mortimer J. Buckley 549,196,781 16,941,804 97.0%
Emerson U. Fullwood 548,277,743 17,860,842 96.8%
Amy Gutmann 547,523,838 18,614,747 96.7%
JoAnn Heffernan Heisen 548,366,779 17,771,806 96.9%
F. Joseph Loughrey 548,608,113 17,530,472 96.9%
Mark Loughridge 549,123,619 17,014,966 97.0%
Scott C. Malpass 547,921,510 18,217,075 96.8%
F. William McNabb III 548,186,555 17,952,030 96.8%
Deanna Mulligan 548,641,436 17,497,149 96.9%
André F. Perold 534,326,795 31,811,790 94.4%
Sarah Bloom Raskin 547,873,806 18,264,779 96.8%
Peter F. Volanakis 548,313,064 17,825,521 96.9%
* Results are for all funds within the same trust.
Proposal 3—Approve a manager-of-managers arrangement with wholly owned subsidiaries of Vanguard.
This arrangement enables Vanguard or the fund to enter into and materially amend investment
advisory arrangements with wholly owned subsidiaries of Vanguard, subject to the approval of the
fund’s board of trustees and any conditions imposed by the Securities and Exchange Commission
(SEC), while avoiding the costs and delays associated with obtaining future shareholder approval.
The ability of the fund to operate in this manner is contingent upon the SEC’s approval of a pending
application for an order of exemption.
Broker Percentage
Vanguard Fund For Abstain Against Non-Votes For
PRIMECAP Core Fund 196,188,984 9,123,464 15,124,845 28,508,738 78.8%
7

PRIMECAP Core Fund
Fund ProfileAs of March 31, 2018
1 The expense ratio shown is from the prospectus dated January 25, 2018, and represents estimated costs for the current fiscal year. Forthe six months ended March 31, 2018, the annualized expense ratio was 0.46%.
8
Volatility Measures
MSCI US
Prime Market
750 Index
DJ
U.S. Total
Market
FA Index
R-Squared 0.91 0.91
Beta 1.06 1.05
These measures show the degree and timing of the fund’s fluctuations compared with the indexes over 36 months.
Ten Largest Holdings (% of total net assets)
Southwest Airlines Co. Airlines 4.9%
JPMorgan Chase & Co. Diversified Banks 3.6
Alphabet Inc. Internet Software &
Services 3.4
Eli Lilly & Co. Pharmaceuticals 3.2
Amgen Inc. Biotechnology 3.2
Texas Instruments Inc. Semiconductors 3.1
Microsoft Corp. Systems Software 2.4
Biogen Inc. Biotechnology 2.2
FedEx Corp. Air Freight &
Logistics 2.2
AstraZeneca plc Pharmaceuticals 2.2
Top Ten 30.4%
The holdings listed exclude any temporary cash investments andequity index products.
Market Cap
Value
Large
Medium
Small
Blend Growth Style
Investment Focus
Portfolio Characteristics
Fund
MSCI US
Prime
Market
750 Index
DJ
U.S. Total
Market
FA Index
Number of Stocks 152 759 3,771
Median Market Cap $64.2B $85.1B $64.2B
Price/Earnings Ratio 19.3x 21.5x 21.2x
Price/Book Ratio 3.3x 3.1x 2.9x
Return on Equity 17.4% 15.9% 15.0%
Earnings Growth
Rate 10.8% 8.2% 8.4%
Dividend Yield 1.6% 1.8% 1.8%
Foreign Holdings 12.8% 0.0% 0.0%
Turnover Rate
(Annualized) 11% — —
Ticker Symbol VPCCX — —
Expense Ratio1
0.46% — —
30-Day SEC Yield 1.19% — —
Short-Term Reserves 2.6% — —
Sector Diversification (% of equity exposure)
Fund
MSCI USPrime
Market750 Index
DJU.S. Total
MarketFA Index
ConsumerDiscretionary 12.1% 13.0% 12.9%
Consumer Staples 0.6 7.4 6.8
Energy 0.7 5.6 5.5
Financials 10.2 14.4 15.1
Health Care 20.5 13.3 13.3
Industrials 20.3 10.5 10.9
InformationTechnology 33.2 24.8 23.9
Materials 2.0 3.0 3.3
Real Estate 0.0 3.2 3.7
TelecommunicationServices 0.4 1.9 1.7
Utilities 0.0 2.9 2.9
Sector categories are based on the Global Industry ClassificationStandard (“GICS”), except for the “Other” category (if applicable),which includes securities that have not been provided a GICSclassification as of the effective reporting period.

All of the returns in this report represent past performance, which is not a guarantee of future results that may be achieved by the fund. (Current performance may be lower or higher thanthe performance data cited. For performance data current to the most recent month-end, visitour website at vanguard.com/performance.) Note, too, that both investment returns and principal value can fluctuate widely, so an investor’s shares, when sold, could be worth more or less than their original cost. The returns shown do not reflect taxes that a shareholder would pay
on fund distributions or on the sale of fund shares.
PRIMECAP Core Fund
Performance Summary
See Financial Highlights for dividend and capital gains information.
9
Fiscal-Year Total Returns (%): September 30, 2007, Through March 31, 2018
–16.52–21.58
2008
1.45
–6.28
2009
10.39 10.68
2010
–0.10
1.09
2011
22.55
29.98
2012
28.88
20.34
2013
22.6019.23
2014
–0.73 –0.36
2015
16.78 15.00
2016
23.1318.57
2017
6.13 5.98
2018
PRIMECAP Core Fund
MSCI US Prime Market 750 Index
Note: For 2018, performance data reflect the six months ended March 31, 2018.
Average Annual Total Returns: Periods Ended March 31, 2018
InceptionDate
OneYear
FiveYears
TenYears
PRIMECAP Core Fund 12/9/2004 17.27% 15.44% 11.86%
Market
Value•
Shares ($000)
Market
Value•
Shares ($000)
Common Stocks (97.5%)
Consumer Discretionary (11.8%)
Sony Corp. ADR 3,800,000 183,692* CarMax Inc. 2,244,300 139,012
Carnival Corp. 1,885,900 123,677
Royal Caribbean
Cruises Ltd. 894,000 105,260
TJX Cos. Inc. 1,230,000 100,319
Ross Stores Inc. 1,120,000 87,338^ Mattel Inc. 5,887,699 77,423
L Brands Inc. 1,589,700 60,742
Whirlpool Corp. 386,774 59,219
Walt Disney Co. 500,000 50,220* Amazon.com Inc. 30,593 44,278
Las Vegas Sands
Corp. 460,000 33,074
Newell Brands Inc. 1,110,000 28,283
Tribune Media Co.
Class A 685,700 27,778
CBS Corp. Class B 441,234 22,675
VF Corp. 300,000 22,236
Marriott International
Inc. Class A 101,000 13,734
Comcast Corp.
Class A 372,000 12,711
Hilton Worldwide
Holdings Inc. 144,000 11,341* Charter
Communications Inc.
Class A 24,400 7,594* Norwegian Cruise
Line Holdings Ltd. 131,700 6,976
MGM Resorts
International 190,000 6,654
Gildan Activewear Inc.
Class A 200,000 5,778^ Entercom
Communications
Corp. Class A 569,543 5,496
Restaurant Brands
International Inc. 78,900 4,491
Bed Bath & Beyond
Inc. 133,191 2,796
Adient plc 27,050 1,617* Netflix Inc. 4,800 1,418* Tempur Sealy
International Inc. 22,000 996* Burlington Stores Inc. 4,600 612
1,247,440
Consumer Staples (0.6%)
CVS Health Corp. 472,377 29,386
PepsiCo Inc. 200,000 21,830
Tyson Foods Inc.
Class A 67,500 4,940
Constellation Brands
Inc. Class A 7,436 1,695
Philip Morris
International Inc. 9,875 982
Altria Group Inc. 10,624 662
59,495
Energy (0.7%)
Schlumberger Ltd. 394,300 25,543* Transocean Ltd. 1,321,800 13,086
Cabot Oil & Gas Corp. 496,250 11,900* Southwestern Energy
Co. 2,100,000 9,093
EOG Resources Inc. 62,600 6,590
National Oilwell Varco
Inc. 150,000 5,521
Pioneer Natural
Resources Co. 2,600 447
72,180
Financials (9.9%)
JPMorgan Chase & Co. 3,422,866 376,413
Charles Schwab Corp. 2,460,734 128,499
Discover Financial
Services 1,780,081 128,041
Wells Fargo & Co. 1,822,400 95,512
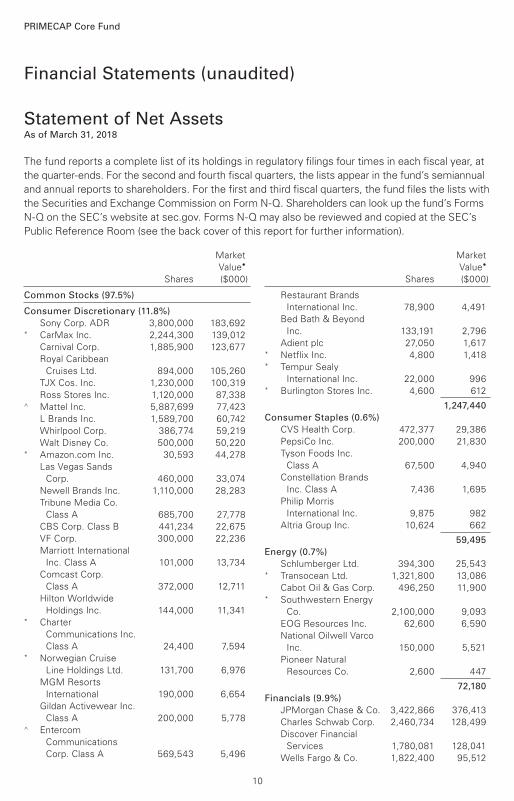
Financial Statements (unaudited)
Statement of Net AssetsAs of March 31, 2018
The fund reports a complete list of its holdings in regulatory filings four times in each fiscal year, at
the quarter-ends. For the second and fourth fiscal quarters, the lists appear in the fund’s semiannual
and annual reports to shareholders. For the first and third fiscal quarters, the fund files the lists with
the Securities and Exchange Commission on Form N-Q. Shareholders can look up the fund’s Forms
N-Q on the SEC’s website at sec.gov. Forms N-Q may also be reviewed and copied at the SEC’s
Public Reference Room (see the back cover of this report for further information).
PRIMECAP Core Fund
10

PRIMECAP Core Fund
Market
Value•
Shares ($000)
Market
Value•
Shares ($000)
Marsh & McLennan
Cos. Inc. 1,130,412 93,361
Northern Trust Corp. 899,450 92,760
Bank of America Corp. 1,594,859 47,830
US Bancorp 773,300 39,052
Progressive Corp. 360,800 21,983
CME Group Inc. 79,850 12,915
Travelers Cos. Inc. 49,000 6,804
American Express Co. 51,000 4,757
Comerica Inc. 35,000 3,358
Moody’s Corp. 12,000 1,936
Chubb Ltd. 9,630 1,317
1,054,538
Health Care (20.0%)
Eli Lilly & Co. 4,424,800 342,347
Amgen Inc. 1,986,936 338,733* Biogen Inc. 861,300 235,841
AstraZeneca plc ADR 6,532,200 228,431
Roche Holding AG 774,100 177,548
Novartis AG ADR 1,831,100 148,044
Thermo Fisher
Scientific Inc. 562,700 116,175
Bristol-Myers Squibb
Co. 1,609,200 101,782* Boston Scientific Corp. 3,512,200 95,953
Abbott Laboratories 1,552,400 93,020
Medtronic plc 693,000 55,592*,1 Siemens Healthineers
AG 1,260,200 51,791* Illumina Inc. 150,900 35,676
Agilent Technologies
Inc. 382,600 25,596
Sanofi ADR 540,000 21,643
Merck & Co. Inc. 375,000 20,426* Waters Corp. 65,000 12,912
Zimmer Biomet
Holdings Inc. 98,700 10,762
Stryker Corp. 45,500 7,322* Cerner Corp. 10,000 580
2,120,174
Industrials (19.8%)
Southwest Airlines
Co. 9,016,525 516,467
FedEx Corp. 973,500 233,747
American Airlines
Group Inc. 3,497,800 181,746
Airbus SE 1,468,050 169,859* United Continental
Holdings Inc. 2,064,800 143,442
Siemens AG 994,100 126,798
Caterpillar Inc. 680,000 100,218* AECOM 2,287,100 81,489
Delta Air Lines Inc. 1,483,000 81,283
United Parcel Service
Inc. Class B 742,700 77,731
Jacobs Engineering
Group Inc. 1,047,655 61,969
Deere & Co. 383,900 59,627
Boeing Co. 160,000 52,461
Textron Inc. 560,000 33,023
Honeywell
International Inc. 200,000 28,902
Rockwell Automation
Inc. 144,100 25,102
Union Pacific Corp. 160,000 21,509
Pentair plc 270,000 18,395
TransDigm Group Inc. 55,500 17,035
Ritchie Bros
Auctioneers Inc. 533,300 16,783
CSX Corp. 285,000 15,877
IDEX Corp. 92,000 13,111
General Dynamics
Corp. 50,000 11,045
Acuity Brands Inc. 50,000 6,960* Herc Holdings Inc. 104,000 6,755
2,101,334
Information Technology (32.4%)
Texas Instruments Inc. 3,190,200 331,430
Microsoft Corp. 2,796,400 255,227
NetApp Inc. 3,020,400 186,328* Alphabet Inc. Class A 176,827 183,394* Alphabet Inc. Class C 170,513 175,934
Hewlett Packard
Enterprise Co. 9,870,867 173,135
NVIDIA Corp. 715,000 165,587* Flex Ltd. 9,330,600 152,369
HP Inc. 6,739,367 147,727
KLA-Tencor Corp. 1,127,600 122,920
Intel Corp. 2,275,000 118,482
Cisco Systems Inc. 2,686,600 115,228* Alibaba Group
Holding Ltd. ADR 542,430 99,558
ASML Holding NV 480,000 95,309* Micron Technology
Inc. 1,790,000 93,331
QUALCOMM Inc. 1,658,830 91,916* Adobe Systems Inc. 390,000 84,271
Intuit Inc. 485,000 84,075
Applied Materials Inc. 1,280,000 71,181*,^ Telefonaktiebolaget
LM Ericsson ADR 11,006,000 70,438* eBay Inc. 1,457,900 58,666
DXC Technology Co. 544,646 54,753
Activision Blizzard Inc. 800,000 53,968* Altaba Inc. 691,600 51,206
Visa Inc. Class A 381,500 45,635* Keysight Technologies
Inc. 849,300 44,495
Corning Inc. 1,447,000 40,342
Analog Devices Inc. 439,100 40,015
11
PRIMECAP Core Fund
Market
Value•
Shares ($000)
Market
Value•
Shares ($000)
* PayPal Holdings Inc. 458,300 34,771
Micro Focus
International plc ADR 2,156,001 30,270* Dell Technologies Inc.
Class V 402,592 29,474* Electronic Arts Inc. 235,000 28,491
Apple Inc. 125,000 20,972
Oracle Corp. 450,000 20,588
Mastercard Inc.
Class A 104,000 18,217* BlackBerry Ltd. 1,547,500 17,796
Western Digital Corp. 188,000 17,347
Booz Allen Hamilton
Holding Corp. Class A 105,923 4,101
Teradyne Inc. 45,300 2,071
3,431,018
Materials (1.9%)
Monsanto Co. 773,350 90,242
DowDuPont Inc. 800,000 50,968
Praxair Inc. 229,700 33,146
Celanese Corp.
Class A 150,000 15,031
Cabot Corp. 125,000 6,965
Greif Inc. Class A 75,000 3,919
Greif Inc. Class B 35,000 2,039* AdvanSix Inc. 15,000 522
202,832
Telecommunication Services (0.4%) *,^ Sprint Corp. 8,480,000 41,382* T-Mobile US Inc. 82,600 5,042
46,424
Total Common Stocks
(Cost $5,391,918) 10,335,435
Temporary Cash Investment (3.0%)
Money Market Fund (3.0%)2,3 Vanguard Market
Liquidity Fund, 1.775%
(Cost $314,187) 3,142,171 314,217
Total Investments (100.5%)
(Cost $5,706,105) 10,649,652
Other Assets and Liabilities (-0.5%)
Other Assets
Investment in Vanguard 591
Receivables for Accrued Income 16,299
Receivables for Capital Shares Issued 2,063
Other Assets 3,806
Total Other Assets 22,759
Liabilities
Payables for Investment
Securities Purchased (4,819)
Collateral for Securities on Loan (43,488)
Payables to Investment Advisor (8,406)
Payables for Capital Shares Redeemed (5,748)
Payables to Vanguard (8,836)
Other Liabilities (1,184)
Total Liabilities (72,481)
Net Assets (100%)
Applicable to 394,738,692 outstanding
$.001 par value shares of beneficial
interest (unlimited authorization) 10,599,930
Net Asset Value Per Share $26.85
12
PRIMECAP Core Fund
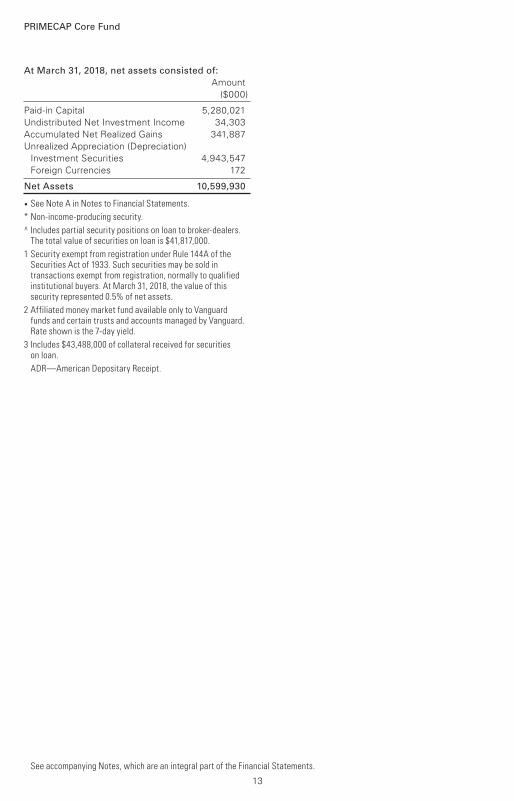
At March 31, 2018, net assets consisted of:
Amount
($000)
Paid-in Capital 5,280,021
Undistributed Net Investment Income 34,303
Accumulated Net Realized Gains 341,887
Unrealized Appreciation (Depreciation)
Investment Securities 4,943,547
Foreign Currencies 172
Net Assets 10,599,930
• See Note A in Notes to Financial Statements.
* Non-income-producing security.
^ Includes partial security positions on loan to broker-dealers. The total value of securities on loan is $41,817,000.
1 Security exempt from registration under Rule 144A of the Securities Act of 1933. Such securities may be sold in transactions exempt from registration, normally to qualified institutional buyers. At March 31, 2018, the value of this security represented 0.5% of net assets.
2 Affiliated money market fund available only to Vanguard funds and certain trusts and accounts managed by Vanguard. Rate shown is the 7-day yield.
3 Includes $43,488,000 of collateral received for securities on loan.
ADR—American Depositary Receipt.
See accompanying Notes, which are an integral part of the Financial Statements.
13

Six Months Ended
March 31, 2018
($000)
Investment Income
Income
Dividends1 87,225
Interest2 1,687
Securities Lending—Net 138
Total Income 89,050
Expenses
Investment Advisory Fees—Note B 16,452
The Vanguard Group—Note C
Management and Administrative 6,886
Marketing and Distribution 698
Custodian Fees 393
Shareholders’ Reports and Proxy 70
Trustees’ Fees and Expenses 7
Total Expenses 24,506
Net Investment Income 64,544
Realized Net Gain (Loss)
Investment Securities Sold2 362,455
Foreign Currencies (38)
Realized Net Gain (Loss) 362,417
Change in Unrealized Appreciation (Depreciation)
Investment Securities2 201,430
Foreign Currencies 52
Change in Unrealized Appreciation (Depreciation) 201,482
Net Increase (Decrease) in Net Assets Resulting from Operations 628,443
1 Dividends are net of foreign withholding taxes of $2,464,000.
2 Interest income, realized net gain (loss), and change in unrealized appreciation (depreciation) from affiliated companies of the fund were $1,687,000, ($19,000), and ($36,000), respectively. Purchases and sales are for temporary cash investment purposes.
Statement of Operations
PRIMECAP Core Fund
See accompanying Notes, which are an integral part of the Financial Statements.
14

Statement of Changes in Net Assets
PRIMECAP Core Fund
See accompanying Notes, which are an integral part of the Financial Statements.
Six Months Ended Year Ended
March 31, September 30,
2018 2017
($000) ($000)
Increase (Decrease) in Net Assets
Operations
Net Investment Income 64,544 117,017
Realized Net Gain (Loss) 362,417 319,881
Change in Unrealized Appreciation (Depreciation) 201,482 1,493,605
Net Increase (Decrease) in Net Assets Resulting from Operations 628,443 1,930,503
Distributions
Net Investment Income (111,019) (103,025)
Realized Capital Gain1 (315,476) (350,990)
Total Distributions (426,495) (454,015)
Capital Share Transactions
Issued 474,745 782,491
Issued in Lieu of Cash Distributions 362,767 388,936
Redeemed (663,457) (843,977)
Net Increase (Decrease) from Capital Share Transactions 174,055 327,450
Total Increase (Decrease) 376,003 1,803,938
Net Assets
Beginning of Period 10,223,927 8,419,989
End of Period2 10,599,930 10,223,927
1 Includes fiscal 2018 and 2017 short-term gain distributions totaling $10,086,000 and $12,674,000, respectively. Short-term gain distributions are treated as ordinary income dividends for tax purposes.
2 Net Assets—End of Period includes undistributed (overdistributed) net investment income of $34,303,000 and $80,816,000.
15

Six Months
Ended
For a Share Outstanding March 31, Year Ended September 30,
Throughout Each Period 2018 2017 2016 2015 2014 2013
Net Asset Value, Beginning of Period $26.33 $22.55 $20.26 $21.87 $18.65 $14.98
Investment Operations
Net Investment Income .1641 .3041 .275 .285 .255 .242
Net Realized and Unrealized Gain (Loss)
on Investments 1.459 4.701 3.047 (.328) 3.820 3.955
Total from Investment Operations 1.623 5.005 3.322 (.043) 4.075 4.197
Distributions
Dividends from Net Investment Income (.287) (.278) (.243) (.270) (.178) (.260)
Distributions from Realized Capital Gains (.816) (.947) (.789) (1.297) (.677) (.267)
Total Distributions (1.103) (1.225) (1.032) (1.567) (.855) (.527)
Net Asset Value, End of Period $26.85 $26.33 $22.55 $20.26 $21.87 $18.65
Total Return2 6.13% 23.13% 16.78% -0.73% 22.60% 28.88%
Ratios/Supplemental Data
Net Assets, End of Period (Millions) $10,600 $10,224 $8,420 $6,917 $6,828 $5,774
Ratio of Total Expenses to
Average Net Assets 0.46% 0.46% 0.46% 0.47% 0.50% 0.50%
Ratio of Net Investment Income to
Average Net Assets 1.20% 1.27% 1.31% 1.29% 1.23% 1.42%
Portfolio Turnover Rate 11% 9% 11% 10% 13% 7%
The expense ratio, net investment income ratio, and turnover rate for the current period have been annualized.
1 Calculated based on average shares outstanding.
2 Total returns do not include account service fees that may have applied in the periods shown. Fund prospectuses provide information about any applicable account service fees.
Financial Highlights
See accompanying Notes, which are an integral part of the Financial Statements.
PRIMECAP Core Fund
16

Notes to Financial Statements
PRIMECAP Core Fund
Vanguard PRIMECAP Core Fund is registered under the Investment Company Act of 1940 as an
open-end investment company, or mutual fund.
A. The following significant accounting policies conform to generally accepted accounting principles
for U.S. investment companies. The fund consistently follows such policies in preparing its financial
statements.
1. Security Valuation: Securities are valued as of the close of trading on the New York Stock Exchange
(generally 4 p.m., Eastern time) on the valuation date. Equity securities are valued at the latest quoted
sales prices or official closing prices taken from the primary market in which each security trades;
such securities not traded on the valuation date are valued at the mean of the latest quoted bid and
asked prices. Securities for which market quotations are not readily available, or whose values have
been affected by events occurring before the fund’s pricing time but after the close of the securities’
primary markets, are valued at their fair values calculated according to procedures adopted by the
board of trustees. These procedures include obtaining quotations from an independent pricing
service, monitoring news to identify significant market- or security-specific events, and evaluating
changes in the values of foreign market proxies (for example, ADRs, futures contracts, or exchange-
traded funds), between the time the foreign markets close and the fund’s pricing time. When fair-
value pricing is employed, the prices of securities used by a fund to calculate its net asset value may
differ from quoted or published prices for the same securities. Investments in Vanguard Market
Liquidity Fund are valued at that fund’s net asset value.
2. Foreign Currency: Securities and other assets and liabilities denominated in foreign currencies
are translated into U.S. dollars using exchange rates obtained from an independent third party as
of the fund’s pricing time on the valuation date. Realized gains (losses) and unrealized appreciation
(depreciation) on investment securities include the effects of changes in exchange rates since the
securities were purchased, combined with the effects of changes in security prices. Fluctuations
in the value of other assets and liabilities resulting from changes in exchange rates are recorded as
unrealized foreign currency gains (losses) until the assets or liabilities are settled in cash, at which
time they are recorded as realized foreign currency gains (losses).
3. Federal Income Taxes: The fund intends to continue to qualify as a regulated investment company
and distribute all of its taxable income. Management has analyzed the fund’s tax positions taken for
all open federal income tax years (September 30, 2014–2017), and for the period ended March 31,
2018, and has concluded that no provision for federal income tax is required in the fund’s financial
statements.
4. Distributions: Distributions to shareholders are recorded on the ex-dividend date.
5. Securities Lending: To earn additional income, the fund lends its securities to qualified institutional
borrowers. Security loans are subject to termination by the fund at any time, and are required to be
secured at all times by collateral in an amount at least equal to the market value of securities loaned.
Daily market fluctuations could cause the value of loaned securities to be more or less than the value
of the collateral received. When this occurs, the collateral is adjusted and settled on the next business
day. The fund further mitigates its counterparty risk by entering into securities lending transactions
only with a diverse group of prequalified counterparties, monitoring their financial strength, and
entering into master securities lending agreements with its counterparties. The master securities
lending agreements provide that, in the event of a counterparty’s default (including bankruptcy),
the fund may terminate any loans with that borrower, determine the net amount owed, and sell or
retain the collateral up to the net amount owed to the fund; however, such actions may be subject
17

PRIMECAP Core Fund
to legal proceedings. While collateral mitigates counterparty risk, in the event of a default, the fund
may experience delays and costs in recovering the securities loaned. The fund invests cash collateral
received in Vanguard Market Liquidity Fund, and records a liability in the Statement of Net Assets
for the return of the collateral, during the period the securities are on loan. Securities lending income
represents fees charged to borrowers plus income earned on invested cash collateral, less expenses
associated with the loan. During the term of the loan, the fund is entitled to all distributions made
on or in respect of the loaned securities.
6. Credit Facility: The fund and certain other funds managed by The Vanguard Group (“Vanguard”)
participate in a $3.1 billion committed credit facility provided by a syndicate of lenders pursuant to
a credit agreement that may be renewed annually; each fund is individually liable for its borrowings,
if any, under the credit facility. Borrowings may be utilized for temporary and emergency purposes,
and are subject to the fund’s regulatory and contractual borrowing restrictions. The participating
funds are charged administrative fees and an annual commitment fee of 0.10% of the undrawn
amount of the facility; these fees are allocated to the funds based on a method approved by the
fund’s board of trustees and included in Management and Administrative expenses on the fund’s
Statement of Operations. Any borrowings under this facility bear interest at a rate based upon the
higher of the one-month London Interbank Offered Rate, federal funds effective rate, or overnight
bank funding rate plus an agreed-upon spread.
The fund had no borrowings outstanding at March 31, 2018, or at any time during the period
then ended.
7. Other: Dividend income is recorded on the ex-dividend date. Interest income includes income
distributions received from Vanguard Market Liquidity Fund and is accrued daily. Security transactions
are accounted for on the date securities are bought or sold. Costs used to determine realized gains
(losses) on the sale of investment securities are those of the specific securities sold.
B. PRIMECAP Management Company provides investment advisory services to the fund for a fee
calculated at an annual percentage rate of average net assets. For the six months ended March 31,
2018, the investment advisory fee represented an effective annual rate of 0.31% of the fund’s
average net assets.
C. In accordance with the terms of a Funds’ Service Agreement (the “FSA”) between Vanguard
and the fund, Vanguard furnishes to the fund corporate management, administrative, marketing,
and distribution services at Vanguard’s cost of operations (as defined by the FSA). These costs
of operations are allocated to the fund based on methods and guidelines approved by the board
of trustees. Vanguard does not require reimbursement in the current period for certain costs of
operations (such as deferred compensation/benefits and risk/insurance costs); the fund’s liability
for these costs of operations is included in Payables to Vanguard on the Statement of Net Assets.
All other costs of operations payable to Vanguard are generally settled twice a month.
Upon the request of Vanguard, the fund may invest up to 0.40% of its net assets as capital in
Vanguard. At March 31, 2018, the fund had contributed to Vanguard capital in the amount of
$591,000, representing 0.01% of the fund’s net assets and 0.24% of Vanguard’s capitalization.
The fund’s trustees and officers are also directors and employees, respectively, of Vanguard.
D. Various inputs may be used to determine the value of the fund’s investments. These inputs are
summarized in three broad levels for financial statement purposes. The inputs or methodologies
used to value securities are not necessarily an indication of the risk associated with investing in
those securities.
18

PRIMECAP Core Fund
Level 1—Quoted prices in active markets for identical securities.
Level 2—Other significant observable inputs (including quoted prices for similar securities, interest
rates, prepayment speeds, credit risk, etc.).
Level 3—Significant unobservable inputs (including the fund’s own assumptions used to determine
the fair value of investments). Any investments valued with significant unobservable inputs are noted
on the Statement of Net Assets.
The following table summarizes the market value of the fund’s investments as of March 31, 2018,
based on the inputs used to value them:
Level 1 Level 2 Level 3
Investments ($000) ($000) ($000)
Common Stocks 9,809,440 525,995 —
Temporary Cash Investments 314,217 — —
Total 10,123,657 525,995 —
E. Distributions are determined on a tax basis and may differ from net investment income and
realized capital gains for financial reporting purposes. Differences may be permanent or temporary.
Permanent differences are reclassified among capital accounts in the financial statements to reflect
their tax character. Temporary differences arise when certain items of income, expense, gain, or
loss are recognized in different periods for financial statement and tax purposes. These differences
will reverse at some time in the future. Differences in classification may also result from the
treatment of short-term gains as ordinary income for tax purposes. The fund’s tax-basis capital
gains and losses are determined only at the end of each fiscal year.
At March 31, 2018, the cost of investment securities for tax purposes was $5,706,105,000. Net
unrealized appreciation of investment securities for tax purposes was $4,943,547,000, consisting
of unrealized gains of $5,208,827,000 on securities that had risen in value since their purchase and
$265,280,000 in unrealized losses on securities that had fallen in value since their purchase.
F. During the six months ended March 31, 2018, the fund purchased $560,422,000 of investment
securities and sold $704,259,000 of investment securities, other than temporary cash investments.
G. Capital shares issued and redeemed were:
Six Months Ended Year Ended
March 31, 2018 September 30, 2017
Shares Shares
(000) (000)
Issued 17,312 32,818
Issued in Lieu of Cash Distributions 13,401 17,325
Redeemed (24,226) (35,330)
Net Increase (Decrease) in Shares Outstanding 6,487 14,813
H. Management has determined that no material events or transactions occurred subsequent
to March 31, 2018, that would require recognition or disclosure in these financial statements.
19

About Your Fund’s Expenses
20
As a shareholder of the fund, you incur ongoing costs, which include costs for portfolio management,
administrative services, and shareholder reports (like this one), among others. Operating expenses,
which are deducted from a fund’s gross income, directly reduce the investment return of the fund.
A fund’s expenses are expressed as a percentage of its average net assets. This figure is known as
the expense ratio. The following examples are intended to help you understand the ongoing costs (in
dollars) of investing in your fund and to compare these costs with those of other mutual funds. The
examples are based on an investment of $1,000 made at the beginning of the period shown and held
for the entire period.
The accompanying table illustrates your fund’s costs in two ways:
• Based on actual fund return. This section helps you to estimate the actual expenses that you
paid over the period. The ”Ending Account Value“ shown is derived from the fund‘s actual return,
and the third column shows the dollar amount that would have been paid by an investor who started
with $1,000 in the fund. You may use the information here, together with the amount you invested,
to estimate the expenses that you paid over the period.
To do so, simply divide your account value by $1,000 (for example, an $8,600 account value divided
by $1,000 = 8.6), then multiply the result by the number given for your fund under the heading
”Expenses Paid During Period.“
• Based on hypothetical 5% yearly return. This section is intended to help you compare your
fund‘s costs with those of other mutual funds. It assumes that the fund had a yearly return of 5%
before expenses, but that the expense ratio is unchanged. In this case—because the return used is
not the fund’s actual return—the results do not apply to your investment. The example is useful in
making comparisons because the Securities and Exchange Commission requires all mutual funds to
calculate expenses based on a 5% return. You can assess your fund’s costs by comparing this
hypothetical example with the hypothetical examples that appear in shareholder reports of other
funds.
Note that the expenses shown in the table are meant to highlight and help you compare ongoingcosts only and do not reflect transaction costs incurred by the fund for buying and sellingsecurities. Further, the expenses do not include any purchase, redemption, or account servicefees described in the fund prospectus. If such fees were applied to your account, your costswould be higher. Your fund does not carry a “sales load.”
The calculations assume no shares were bought or sold during the period. Your actual costs may
have been higher or lower, depending on the amount of your investment and the timing of any
purchases or redemptions.
You can find more information about the fund’s expenses, including annual expense ratios, in the
Financial Statements section of this report. For additional information on operating expenses and
other shareholder costs, please refer to your fund’s current prospectus.

21
Six Months Ended March 31, 2018
PRIMECAP Core Fund
Beginning
Account Value
9/30/2017
Ending
Account Value
3/31/2018
Expenses
Paid During
Period
Based on Actual Fund Return $1,000.00 $1,061.33 $2.36
Based on Hypothetical 5% Yearly Return 1,000.00 1,022.64 2.32
The calculations are based on expenses incurred in the most recent six-month period. The fund’s annualized six-month expense ratio forthat period is 0.46%. The dollar amounts shown as “Expenses Paid” are equal to the annualized expense ratio multiplied by the averageaccount value over the period, multiplied by the number of days in the most recent six-month period, then divided by the number of days inthe most recent 12-month period (182/365).

The board of trustees of Vanguard PRIMECAP Core Fund has renewed the fund’s investment
advisory arrangement with PRIMECAP Management Company (PRIMECAP Management). The
board determined that renewing the fund’s advisory arrangement was in the best interests of the
fund and its shareholders.
The board based its decision upon an evaluation of the advisor’s investment staff, portfolio
management process, and performance. This evaluation included information provided to the board
by Vanguard’s Portfolio Review Department, which is responsible for fund and advisor oversight and
product management. The Portfolio Review Department met regularly with the advisor and made
monthly presentations to the board during the fiscal year that directed the board’s focus to relevant
information and topics.
The board, or an investment committee made up of board members, also received information
throughout the year during advisor presentations. For each advisor presentation, the board was
provided with letters and reports that included information about, among other things, the advisory
firm and the advisor’s assessment of the investment environment, portfolio performance, and
portfolio characteristics.
In addition, the board received monthly reports, which included a Market and Economic Report,
a Fund Dashboard Monthly Summary, and a Fund Performance Report.
Prior to their meeting, the trustees were provided with a memo and materials that summarized
the information they received over the course of the year. They also considered the factors
discussed below, among others. However, no single factor determined whether the board
approved the arrangement. Rather, it was the totality of the circumstances that drove the
board’s decision.
Nature, extent, and quality of services
The board reviewed the quality of the fund’s investment management services over both the
short and long term, and took into account the organizational depth and stability of the advisor.
The board considered that PRIMECAP Management, founded in 1983, is recognized for its
long-term approach to equity investing. The portfolio managers are responsible for separate
sub-portfolios, and each portfolio manager employs a fundamental, research-driven approach
in seeking to identify companies with long-term growth potential that the market has yet to
appreciate. The multi-counselor approach that the advisor employs is designed to emphasize
individual decision-making and enable the portfolio managers to invest only in their highest-
conviction ideas. PRIMECAP Management’s fundamental research focuses on developing
opinions independent from Wall Street’s consensus and maintaining a long-term time horizon.
PRIMECAP Management has managed the fund since its inception in 2004.
The board concluded that the advisor’s experience, stability, depth, and performance, among
other factors, warranted continuation of the advisory arrangement.
Investment performance
The board considered the short- and long-term performance of the fund, including any periods of
outperformance or underperformance compared with a relevant benchmark index and peer group.
The board concluded that the performance was such that the advisory arrangement should continue.
Information about the fund’s most recent performance can be found in the Performance Summary
section of this report.
Trustees Approve Advisory Arrangement
22

Cost
The board concluded that the fund’s expense ratio was well below the average expense ratio charged
by funds in its peer group and that the fund’s advisory fee rate was also well below its peer-group
average. Information about the fund’s expense ratio appears in the About Your Fund’s Expenses
section of this report as well as in the Financial Statements section, which also includes information
about the fund’s advisory fee rate.
The board did not consider the profitability of PRIMECAP Management in determining whether to
approve the advisory fee, because PRIMECAP Management is independent of Vanguard and the
advisory fee is the result of arm’s-length negotiations.
The benefit of economies of scale
The board concluded that the fund’s shareholders benefit from economies of scale because of the
breakpoints in the fund’s advisory fee schedule. The breakpoints reduce the effective rate of the
fee as the fund’s assets increase.
The board will consider whether to renew the advisory arrangement again after a one-year period.
23

Glossary
24
30-Day SEC Yield. A fund’s 30-day SEC yield is derived using a formula specified by the U.S.
Securities and Exchange Commission. Under the formula, data related to the fund’s security
holdings in the previous 30 days are used to calculate the fund’s hypothetical net income for that
period, which is then annualized and divided by the fund’s estimated average net assets over the
calculation period. For the purposes of this calculation, a security’s income is based on its current
market yield to maturity (for bonds), its actual income (for asset-backed securities), or its
projected dividend yield (for stocks). Because the SEC yield represents hypothetical annualized
income, it will differ—at times significantly—from the fund’s actual experience. As a result, the
fund’s income distributions may be higher or lower than implied by the SEC yield.
Beta. A measure of the magnitude of a fund’s past share-price fluctuations in relation to the ups
and downs of a given market index. The index is assigned a beta of 1.00. Compared with a given
index, a fund with a beta of 1.20 typically would have seen its share price rise or fall by 12%
when the index rose or fell by 10%. For this report, beta is based on returns over the past 36
months for both the fund and the index. Note that a fund’s beta should be reviewed in conjunction
with its R-squared (see definition). The lower the R-squared, the less correlation there is between
the fund and the index, and the less reliable beta is as an indicator of volatility.
Dividend Yield. Dividend income earned by stocks, expressed as a percentage of the aggregate
market value (or of net asset value, for a fund). The yield is determined by dividing the amount of
the annual dividends by the aggregate value (or net asset value) at the end of the period. For a
fund, the dividend yield is based solely on stock holdings and does not include any income
produced by other investments.
Earnings Growth Rate. The average annual rate of growth in earnings over the past five years for
the stocks now in a fund.
Equity Exposure. A measure that reflects a fund’s investments in stocks and stock futures. Any
holdings in short-term reserves are excluded.
Expense Ratio. A fund’s total annual operating expenses expressed as a percentage of the fund’s
average net assets. The expense ratio includes management and administrative expenses, but
does not include the transaction costs of buying and selling portfolio securities.
Foreign Holdings. The percentage of a fund represented by securities or depositary receipts of
companies based outside the United States.
Inception Date. The date on which the assets of a fund (or one of its share classes) are first
invested in accordance with the fund’s investment objective. For funds with a subscription period,
the inception date is the day after that period ends. Investment performance is measured from
the inception date.
Median Market Cap. An indicator of the size of companies in which a fund invests; the midpoint
of market capitalization (market price x shares outstanding) of a fund’s stocks, weighted by the
proportion of the fund’s assets invested in each stock. Stocks representing half of the fund’s
assets have market capitalizations above the median, and the rest are below it.
Price/Book Ratio. The share price of a stock divided by its net worth, or book value, per share.
For a fund, the weighted average price/book ratio of the stocks it holds.

25
Price/Earnings Ratio. The ratio of a stock’s current price to its per-share earnings over the past
year. For a fund, the weighted average P/E of the stocks it holds. P/E is an indicator of market
expectations about corporate prospects; the higher the P/E, the greater the expectations for a
company’s future growth.
R-Squared. A measure of how much of a fund’s past returns can be explained by the returns
from the market in general, as measured by a given index. If a fund’s total returns were precisely
synchronized with an index’s returns, its R-squared would be 1.00. If the fund’s returns bore no
relationship to the index’s returns, its R-squared would be 0. For this report, R-squared is based
on returns over the past 36 months for both the fund and the index.
Return on Equity. The annual average rate of return generated by a company during the past five
years for each dollar of shareholder’s equity (net income divided by shareholder’s equity). For a
fund, the weighted average return on equity for the companies whose stocks it holds.
Short-Term Reserves. The percentage of a fund invested in highly liquid, short-term securities
that can be readily converted to cash.
Turnover Rate. An indication of the fund’s trading activity. Funds with high turnover rates incur
higher transaction costs and may be more likely to distribute capital gains (which may be taxable
to investors). The turnover rate excludes in-kind transactions, which have minimal impact on
costs.

The Global Industry Classification Standard (“GICS”) was developed by and is the exclusive property and a service mark
of MSCI Inc. (“MSCI”) and Standard and Poor’s, a division of McGraw-Hill Companies, Inc. (“S&P”), and is licensed for use
by Vanguard. Neither MSCI, S&P nor any third party involved in making or compiling the GICS or any GICS classification
makes any express or implied warranties or representations with respect to such standard or classification (or the results
to be obtained by the use thereof), and all such parties hereby expressly disclaim all warranties of originality, accuracy,
completeness, merchantability or fitness for a particular purpose with respect to any such standard or classification.
Without limiting any of the foregoing, in no event shall MSCI, S&P, any of its affiliates or any third party involved in
making or compiling the GICS or any GICS classification have any liability for any direct, indirect, special, punitive,
consequential or any other damages (including lost profits) even if notified of the possibility of such damages.
26

The People Who Govern Your Fund
The trustees of your mutual fund are there to see that the fund is operated and managed in your
best interests since, as a shareholder, you are a part owner of the fund. Your fund’s trustees also
serve on the board of directors of The Vanguard Group, Inc., which is owned by the Vanguard
funds and provides services to them on an at-cost basis.
A majority of Vanguard’s board members are independent, meaning that they have no affiliation
with Vanguard or the funds they oversee, apart from the sizable personal investments they have
made as private individuals. The independent board members have distinguished backgrounds
in business, academia, and public service. Each of the trustees and executive officers oversees
208 Vanguard funds.
Information for each trustee and executive officer of the fund appears below. The mailing address
of the trustees and officers is P.O. Box 876, Valley Forge, PA 19482. More information about the
trustees is in the Statement of Additional Information, which can be obtained, without charge,
by contacting Vanguard at 800-662-7447, or online at vanguard.com.
Interested Trustees1
F. William McNabb III
Born in 1957. Trustee since July 2009. Principal
occupation(s) during the past five years and
other experience: chairman of the board
(January 2010–present) of Vanguard and of each
of the investment companies served by Vanguard,
trustee (2009–present) of each of the investment
companies served by Vanguard, and director
(2008–present) of Vanguard. Chief executive officer
and president (2008–2017) of Vanguard and each
of the investment companies served by Vanguard,
managing director (1995–2008) of Vanguard,
and director (1997–2018) of Vanguard Marketing
Corporation. Director (2018–present) of
UnitedHealth Group.
Mortimer J. Buckley
Born in 1969. Trustee since January 2018. Principal
occupation(s) during the past five years and
other experience: chief executive officer
(January 2018–present) of Vanguard; chief executive
officer, president, and trustee (January 2018–present)
of each of the investment companies served by
Vanguard; president and director (2017–present) of
Vanguard; and president (February 2018–present) of
Vanguard Marketing Corporation. Chief investment
officer (2013–2017), managing director (2002–2017),
head of the Retail Investor Group (2006–2012), and
chief information officer (2001–2006) of Vanguard.
Chairman of the board (2011–2017) of the Children’s
Hospital of Philadelphia.
Independent Trustees
Emerson U. Fullwood
Born in 1948. Trustee since January 2008. Principal
occupation(s) during the past five years and other
experience: executive chief staff and marketing officer
for North America and corporate vice president (retired
2008) of Xerox Corporation (document management
products and services). Former president of the
Worldwide Channels Group, Latin America, and
Worldwide Customer Service and executive chief
staff officer of Developing Markets of Xerox. Executive
in residence and 2009–2010 Distinguished Minett
Professor at the Rochester Institute of Technology.
Lead director of SPX FLOW, Inc. (multi-industry
manufacturing). Director of the University of Rochester
Medical Center, the Monroe Community College
Foundation, the United Way of Rochester, North
Carolina A&T University, and Roberts Wesleyan
College. Trustee of the University of Rochester.
Amy Gutmann
Born in 1949. Trustee since June 2006. Principal
occupation(s) during the past five years and other
experience: president (2004–present) of the University
of Pennsylvania. Christopher H. Browne Distinguished
Professor of Political Science, School of Arts and
Sciences, and professor of communication, Annenberg
School for Communication, with secondary faculty
appointments in the Department of Philosophy, School
of Arts and Sciences, and at the Graduate School of
Education, University of Pennsylvania. Trustee of the
National Constitution Center.
1 Mr. McNabb and Mr. Buckley are considered “interested persons,” as defined in the Investment Company Act of 1940, because they are officers of the Vanguard funds.

JoAnn Heffernan Heisen
Born in 1950. Trustee since July 1998. Principal
occupation(s) during the past five years and other
experience: corporate vice president of Johnson &
Johnson (pharmaceuticals/medical devices/consumer
products) and member of its executive committee
(1997–2008). Chief global diversity officer (retired
2008), vice president and chief information officer
(1997–2006), controller (1995–1997), treasurer
(1991–1995), and assistant treasurer (1989–1991)
of Johnson & Johnson. Director of Skytop Lodge
Corporation (hotels) and the Robert Wood Johnson
Foundation. Member of the advisory board of the
Institute for Women’s Leadership at Rutgers University.
F. Joseph Loughrey
Born in 1949. Trustee since October 2009. Principal
occupation(s) during the past five years and other
experience: president and chief operating officer
(retired 2009) and vice chairman of the board
(2008–2009) of Cummins Inc. (industrial machinery).
Chairman of the board of Hillenbrand, Inc. (specialized
consumer services), Oxfam America, and the Lumina
Foundation for Education. Director of the V Foundation
for Cancer Research. Member of the advisory council
for the College of Arts and Letters and chair of the
advisory board to the Kellogg Institute for International
Studies, both at the University of Notre Dame.
Mark Loughridge
Born in 1953. Trustee since March 2012. Principal
occupation(s) during the past five years and other
experience: senior vice president and chief financial
officer (retired 2013) of IBM (information technology
services). Fiduciary member of IBM’s Retirement
Plan Committee (2004–2013), senior vice president
and general manager (2002–2004) of IBM Global
Financing, vice president and controller (1998–2002)
of IBM, and a variety of other prior management roles
at IBM. Member of the Council on Chicago Booth.
Scott C. Malpass
Born in 1962. Trustee since March 2012. Principal
occupation(s) during the past five years and other
experience: chief investment officer (1989–present)
and vice president (1996–present) of the University
of Notre Dame. Assistant professor of finance at the
Mendoza College of Business, University of Notre
Dame, and member of the Notre Dame 403(b)
Investment Committee. Chairman of the board of
TIFF Advisory Services, Inc. Member of the board
of Catholic Investment Services, Inc. (investment
advisors), the board of advisors for Spruceview
Capital Partners, and the board of superintendence
of the Institute for the Works of Religion.
Deanna Mulligan
Born in 1963. Trustee since January 2018. Principal
occupation(s) during the past five years and other
experience: president (2010–present) and chief
executive officer (2011–present) of The Guardian
Life Insurance Company of America. Chief operating
officer (2010–2011) and executive vice president
(2008–2010) of Individual Life and Disability of
The Guardian Life Insurance Company of America.
Member of the board of The Guardian Life Insurance
Company of America, the American Council of Life
Insurers, the Partnership for New York City (business
leadership), and the Committee Encouraging Corporate
Philanthropy. Trustee of the Economic Club of New
York and the Bruce Museum (arts and science).
Member of the Advisory Council for the Stanford
Graduate School of Business.
André F. Perold
Born in 1952. Trustee since December 2004. Principal
occupation(s) during the past five years and other
experience: George Gund Professor of Finance and
Banking, Emeritus at the Harvard Business School
(retired 2011). Chief investment officer and co-
managing partner of HighVista Strategies LLC
(private investment firm). Overseer of the Museum
of Fine Arts Boston.
Sarah Bloom Raskin
Born in 1961. Trustee since January 2018. Principal
occupation(s) during the past five years and other
experience: deputy secretary (2014–2017) of
the United States Department of the Treasury.
Governor (2010–2014) of the Federal Reserve Board.
Commissioner (2007–2010) of financial regulation
for the State of Maryland. Member of the board of
directors (2012–2014) of Neighborhood Reinvestment
Corporation. Director of i(x) Investments, LLC.
Peter F. Volanakis
Born in 1955. Trustee since July 2009. Principal
occupation(s) during the past five years and other
experience: president and chief operating officer
(retired 2010) of Corning Incorporated (communications
equipment) and director of Corning Incorporated
(2000–2010) and Dow Corning (2001–2010).
Director (2012) of SPX Corporation (multi-industry
manufacturing). Overseer of the Amos Tuck School
of Business Administration, Dartmouth College
(2001–2013). Chairman of the board of trustees of
Colby-Sawyer College. Member of the Board of
Hypertherm Inc. (industrial cutting systems, software,
and consumables).

Executive Officers
Glenn Booraem
Born in 1967. Principal occupation(s) during the past
five years and other experience: principal of Vanguard.
Investment stewardship officer (2017–present),
treasurer (2015–2017), controller (2010–2015),
and assistant controller (2001–2010) of each of
the investment companies served by Vanguard.
Christine M. Buchanan
Born in 1970. Principal occupation(s) during the past
five years and other experience: principal of Vanguard
and global head of Fund Administration at Vanguard.
Treasurer (2017–present) of each of the investment
companies served by Vanguard. Partner (2005–2017)
at KPMG LLP (audit, tax, and advisory services).
Brian Dvorak
Born in 1973. Principal occupation(s) during the past
five years and other experience: principal of Vanguard.
Chief compliance officer (2017–present) of Vanguard
and each of the investment companies served by
Vanguard. Assistant vice president (2017–present) of
Vanguard Marketing Corporation. Vice president and
director of Enterprise Risk Management (2011–2013)
at Oppenheimer Funds, Inc.
Thomas J. Higgins
Born in 1957. Principal occupation(s) during the past
five years and other experience: principal of Vanguard.
Chief financial officer (2008–present) and treasurer
(1998–2008) of each of the investment companies
served by Vanguard.
Peter Mahoney
Born in 1974. Principal occupation(s) during the past
five years and other experience: principal of Vanguard.
Controller (2015–present) of each of the investment
companies served by Vanguard. Head of International
Fund Services (2008–2014) at Vanguard.
Anne E. Robinson
Born in 1970. Principal occupation(s) during the
past five years and other experience: general
counsel (2016–present) of Vanguard. Secretary
(2016–present) of Vanguard and of each of the
investment companies served by Vanguard.
Managing director (2016–present) of Vanguard.
Director and senior vice president (2016–2018)
of Vanguard Marketing Corporation. Managing
director and general counsel of Global Cards and
Consumer Services (2014–2016) at Citigroup.
Counsel (2003–2014) at American Express.
Michael Rollings
Born in 1963. Principal occupation(s) during the
past five years and other experience: finance
director (2017–present) and treasurer (2017) of each
of the investment companies served by Vanguard.
Managing director (2016–present) of Vanguard. Chief
financial officer (2016–present) of Vanguard. Director
(2016–present) of Vanguard Marketing Corporation.
Executive vice president and chief financial officer
(2006–2016) of MassMutual Financial Group.
Vanguard Senior Management Team
Mortimer J. Buckley James M. Norris
Gregory Davis Thomas M. Rampulla
John James Karin A. Risi
Martha G. King Anne E. Robinson
John T. Marcante Michael Rollings
Chris D. McIsaac
Chairman Emeritus and Senior Advisor
John J. Brennan
Chairman, 1996–2009
Chief Executive Officer and President, 1996–2008
Founder
John C. Bogle
Chairman and Chief Executive Officer, 1974–1996

P.O. Box 2600
Valley Forge, PA 19482-2600
Connect with Vanguard® > vanguard.com
Fund Information > 800-662-7447
Direct Investor Account Services > 800-662-2739
Institutional Investor Services > 800-523-1036
Text Telephone for PeopleWho Are Deaf or Hard of Hearing > 800-749-7273
This material may be used in conjunctionwith the offering of shares of any Vanguardfund only if preceded or accompanied bythe fund’s current prospectus.
All comparative mutual fund data are from Lipper, aThomson Reuters Company, or Morningstar, Inc., unlessotherwise noted.
You can obtain a free copy of Vanguard’s proxy votingguidelines by visiting vanguard.com/proxyreporting or bycalling Vanguard at 800-662-2739. The guidelines arealso available from the SEC’s website, sec.gov. Inaddition, you may obtain a free report on how your fundvoted the proxies for securities it owned during the 12months ended June 30. To get the report, visit eithervanguard.com/proxyreporting or sec.gov.
You can review and copy information about your fund atthe SEC’s Public Reference Room in Washington, D.C. Tofind out more about this public service, call the SEC at202-551-8090. Information about your fund is alsoavailable on the SEC’s website, and you can receivecopies of this information, for a fee, by sending arequest in either of two ways: via email addressed [email protected] or via regular mail addressed to thePublic Reference Section, Securities and ExchangeCommission, Washington, DC 20549-1520.
Source for Bloomberg Barclays indexes: BloombergIndex Services Limited. Copyright 2018, Bloomberg. Allrights reserved.
© 2018 The Vanguard Group, Inc.All rights reserved.Vanguard Marketing Corporation, Distributor.
Q12202 052018